Article

The Slow Death of Capital Protection

by
Christian Bauer
and
Marc Oliver Rieger
*
Department of Eonomics, University of Trier, 54296 Trier, Germany
*
Author to whom correspondence should be addressed.
J. Risk Financial Manag. 2021, 14(7), 303; https://doi.org/10.3390/jrfm14070303
Submission received: 25 May 2021 / Revised: 24 June 2021 / Accepted: 25 June 2021 / Published: 3 July 2021
(This article belongs to the Special Issue Structured Financial Products and Derivatives)

Abstract

:
Capital protected products are a special type of structured retail products that guarantee a minimum amount of payment at maturity. They were the earliest type of structured products and are very popular with risk averse investors, but nevertheless have become rare in the past years. Using a unique dataset of all structured products issued in Switzerland, one of the biggest markets for such products in the world, we investigate why this has been the case, and argue that it is to a large degree an effect of the zero-interest policy of central banks.

1. Introduction

Structured products (also known as structured notes or structured financial products) have existed since around 1990. They provide a payoff that depends on one or more underlyings—usually stocks, baskets of stocks or commodities. Among the first such products were capital protected products (also knows as guarantee certificates). In Switzerland, for example, the first structured product was a guaranteed return on investment issued in January 1991 (Rieger 2009).
Most structured products are issued by banks. While some are targeted to institutional investors, many are sold to retail investors and broadly marketed. While fairly popular in many European and East Asian countries since around 2005 (with sometimes around 6% of financial assets being invested in them), they are still a niche product in America (Rieger 2009).
Most of the previous academic research on structured products has focused on the issuer’s perspective and studied their pricing using models from mathematical finance. Some empirical studies also investigated the actual market prices of structured products: in the US, Benet et al. (2006) and Henderson and Pearson (2011) find that there is a substantial amount of overpricing (which means that issuer prices are above theoretical values) among the (few) structured products issued there. In Germany (Stoimenov and Wilkens 2005; Wilkens et al. 2003), Switzerland (Grünbichler and Wohlwend 2005) and the Netherlands (Szymanowska et al. 2009), this has been found, too, although these markets are substantially larger. While most studies focused on generic products such as reverse convertibles that are mostly meant for medium term investments, there are also studies on the pricing of leverage products that are intended for hedging and speculation (Wilkens and Stoimenov 2007). Finally, Wallmeier and Diethelm (2009) demonstrated that for multi-asset barrier reverse convertibles, overpricing becomes more pronounced for more complex products.
There are also more fundamental studies that looked for rational and behavioral reasons for the attractiveness of certain product types, such as reverse convertibles (covered calls) (Shefrin and Statman 1993, 2000), barrier products (Rieger 2012), several types (Branger and Breuer 2007; Breuer and Perst 2007) or for general payoff functions (Hens and Rieger 2014; Rieger 2011). More recently, the motivation of investors to buy structured products has been studied from various perspectives (Abreu and Mendes 2018; Anic and Wallmeier 2020; Kunz et al. 2017; Rieger and Hens 2012). We are, however, not aware of market-wide analyses of product trends over time in the academic literature. A reason for this is the usual lack of data: structured products are traded on various trading platforms, often OTC, and thus difficult to capture by standard data bases. Additionally, data providers are often US-based and do not seem to see the need to include a broad coverage of financial assets that are of minor importance in the US (but of big importance elsewhere).1
For our study, we were fortunate to be able to use a unique dataset, provided by derivative partners, that includes information about nearly all structured products issued in Switzerland from 2005 to 2019, in total 884,816.
In this paper, we focus on capital protected products (guarantee certificates). These products can be understood as a combination of a zero coupon bond with call options. The discount for which the coupon is bought (plus, potentially, a certain additional amount that reduces the full to partial protection) is used to buy the call options. The more call options can be bought, the higher the participation on positive returns of the underlying, while the bond secures a total (or partial) protection against losses. Investors buy these products because it is easier for them than the replication based on bonds and options or because they lack the necessary financial knowledge for this replication.
In total, we have 14,237 such capital protected products in our dataset. Using these data, we will investigate the question why capital protected products (that were, as we have seen, among the first to be issued) are today so rare, even though research in behavioral finance suggests that they can have relatively large benefits for investors (Hens and Rieger 2014) and are also intuitively appealing to them (Rieger and Hens 2012): this becomes clear when considering that many investors are loss averse (Tversky and Kahneman 1992) or even show loss probability aversion (Zeisberger 2020); (Holzmeister et al. 2020). Directly investing into stocks poses potential (nominal) losses. As investors tend to be loss averse, potential losses represent a big hurdle for investing. Capital protected products can help overcome this hurdle, as they exclude nominal losses, provided that they offer full capital protection. These products could therefore have a high potential to increase stock market participation which makes their disappearance being more than a mere curiosity, but an important issue, that we will investigate in this article.
The article is structured as follows. In Section 2, we provide information about our data and the specific variables we will consider. In Section 3, we present first the general empirical finding of the “slow death of capital protection”, in other words, the virtual disappearance of this product type over time. Then, we will use further statistical analyses to explain this disappearing by decreasing interest rates, caused by the central banks’ zero-interest policy since the financial crisis. We will also show how issuers tried, but ultimately failed, to rescue the product category by modifying key parameters of their products. Section 4 concludes.

2. Data on Structured Products and Financial Markets

We use a dataset provided by derivative partners, the leading Swiss service provider in structured products. The dataset contains all structured products issued from 2005 to 2019 (with the possible exception of a few omissions in the first years). For each of these products, up 68 parameters are recorded. For our analysis, we focus especially on the precise category (for instance, capital protection), the level of protection and the underlying (for instance, the S&P 500). In total, 884,816 products are contained in the data.
We consider in this paper only investment products, but not leverage products. The latter category includes warrants2, mini futures and other instruments that provide high leverage and have therefore a completely different motivation (short-term speculation and hedging) than the investment products (that are meant for medium term investment). The dataset contains 454,557 leverage, 327,691 investment and 102,556 unclassified products. The number of leverage products is usually higher, as they are issued in order to cater a wide variety of parameters: most single assets of the main stock markets with various maturities and strike levels. They have a large turnover, as they are meant for short-term buying and selling, but the invested volume is much lower than for investment products (Rieger 2009).
The data do not contain information about the volume of investments into each product. There is, however, a direct relation between the number of investment products of a certain category that banks issue and the invested volume, as banks would not issue many products of a category that is not sought after: issuing products is costly in Switzerland and is therefore only profitable if the investor volume is high enough. We can therefore assume that the number of issued products follows closely the invested volume into these product categories.
For capital protected products, we are particularly interested in two parameters: the type of underlying (single stock, stock market index, others) and the protection level. Theoretical considerations based on behavioral preferences, in particular loss aversion, have shown that a full protection level of 100% (or more) is ideal for behavioral investors (Hens and Rieger 2014); thus, we distinguish between this case and any lower level of protection (partial protection). In difficult market conditions (for instance, when interest rates are low), it might only be possible to issue products with partial protection.
It is also cheaper to provide protection when the underlying has low volatility. Therefore, in difficult market conditions, it might still be possible to issue capital protection on indices, but not on single stocks.
We therefore focus our analysis on the two parameters protection level (full/partial) and underlying (single stock/index).
Besides data on structured products, we also use interest rate and volatility data as control variables, as they are obviously key factors in the pricing of these products. For the respective time, we use the Swiss policy rate data from the Swiss National Bank (SNB) and VIX index provided by the FED St. Louis as daily volatility data.
Of course, other influencing factors such as the regulation or trends towards other forms of portfolio insurance strategies might be causal to the development of capital protected products, as would be general changes of the market volume through widespread individual decisions to cash positions to withdraw from the market entirely. However, due to the very simple nature of the subgroup capital protected products of all structured products, any of these effects should influence the other types of structured products as well. Since we cannot find evidence in our dataset on similar developments in other subgroups of protected products,3 we focus our analysis on the effects of interest rate and market volatility on capital protected products.

3. Results

The first observation on capital protected products is that their number indeed decreased dramatically over the past years. This is true when considering their proportion on the total number of investment products issued, as well as when considering their total number (see Table 1).
What could be potential reasons for this slow death?
The construction of capital protected products from a zero-coupon bond and a call option makes it obvious that their participation rate, and thus, the attractiveness of their upside potential, depends on the price of the call option and the discount of the bond: if the call option is expensive or the discount is small, the participation will become small. This is in particular the case when volatility is high or when interest rates are low.
On the other hand, demand for such products might also depend on volatility: in times of high volatility, i.e., high market uncertainty, investors find capital protection particularly appealing. It is therefore a priori not clear whether high volatility will lead to more or less of such products: on the one hand, capital protection becomes more sought after, on the other hand also more pricy. The effect of interest rate, on the other hand, is clearly one-sided: lower interest makes these products less attractive.
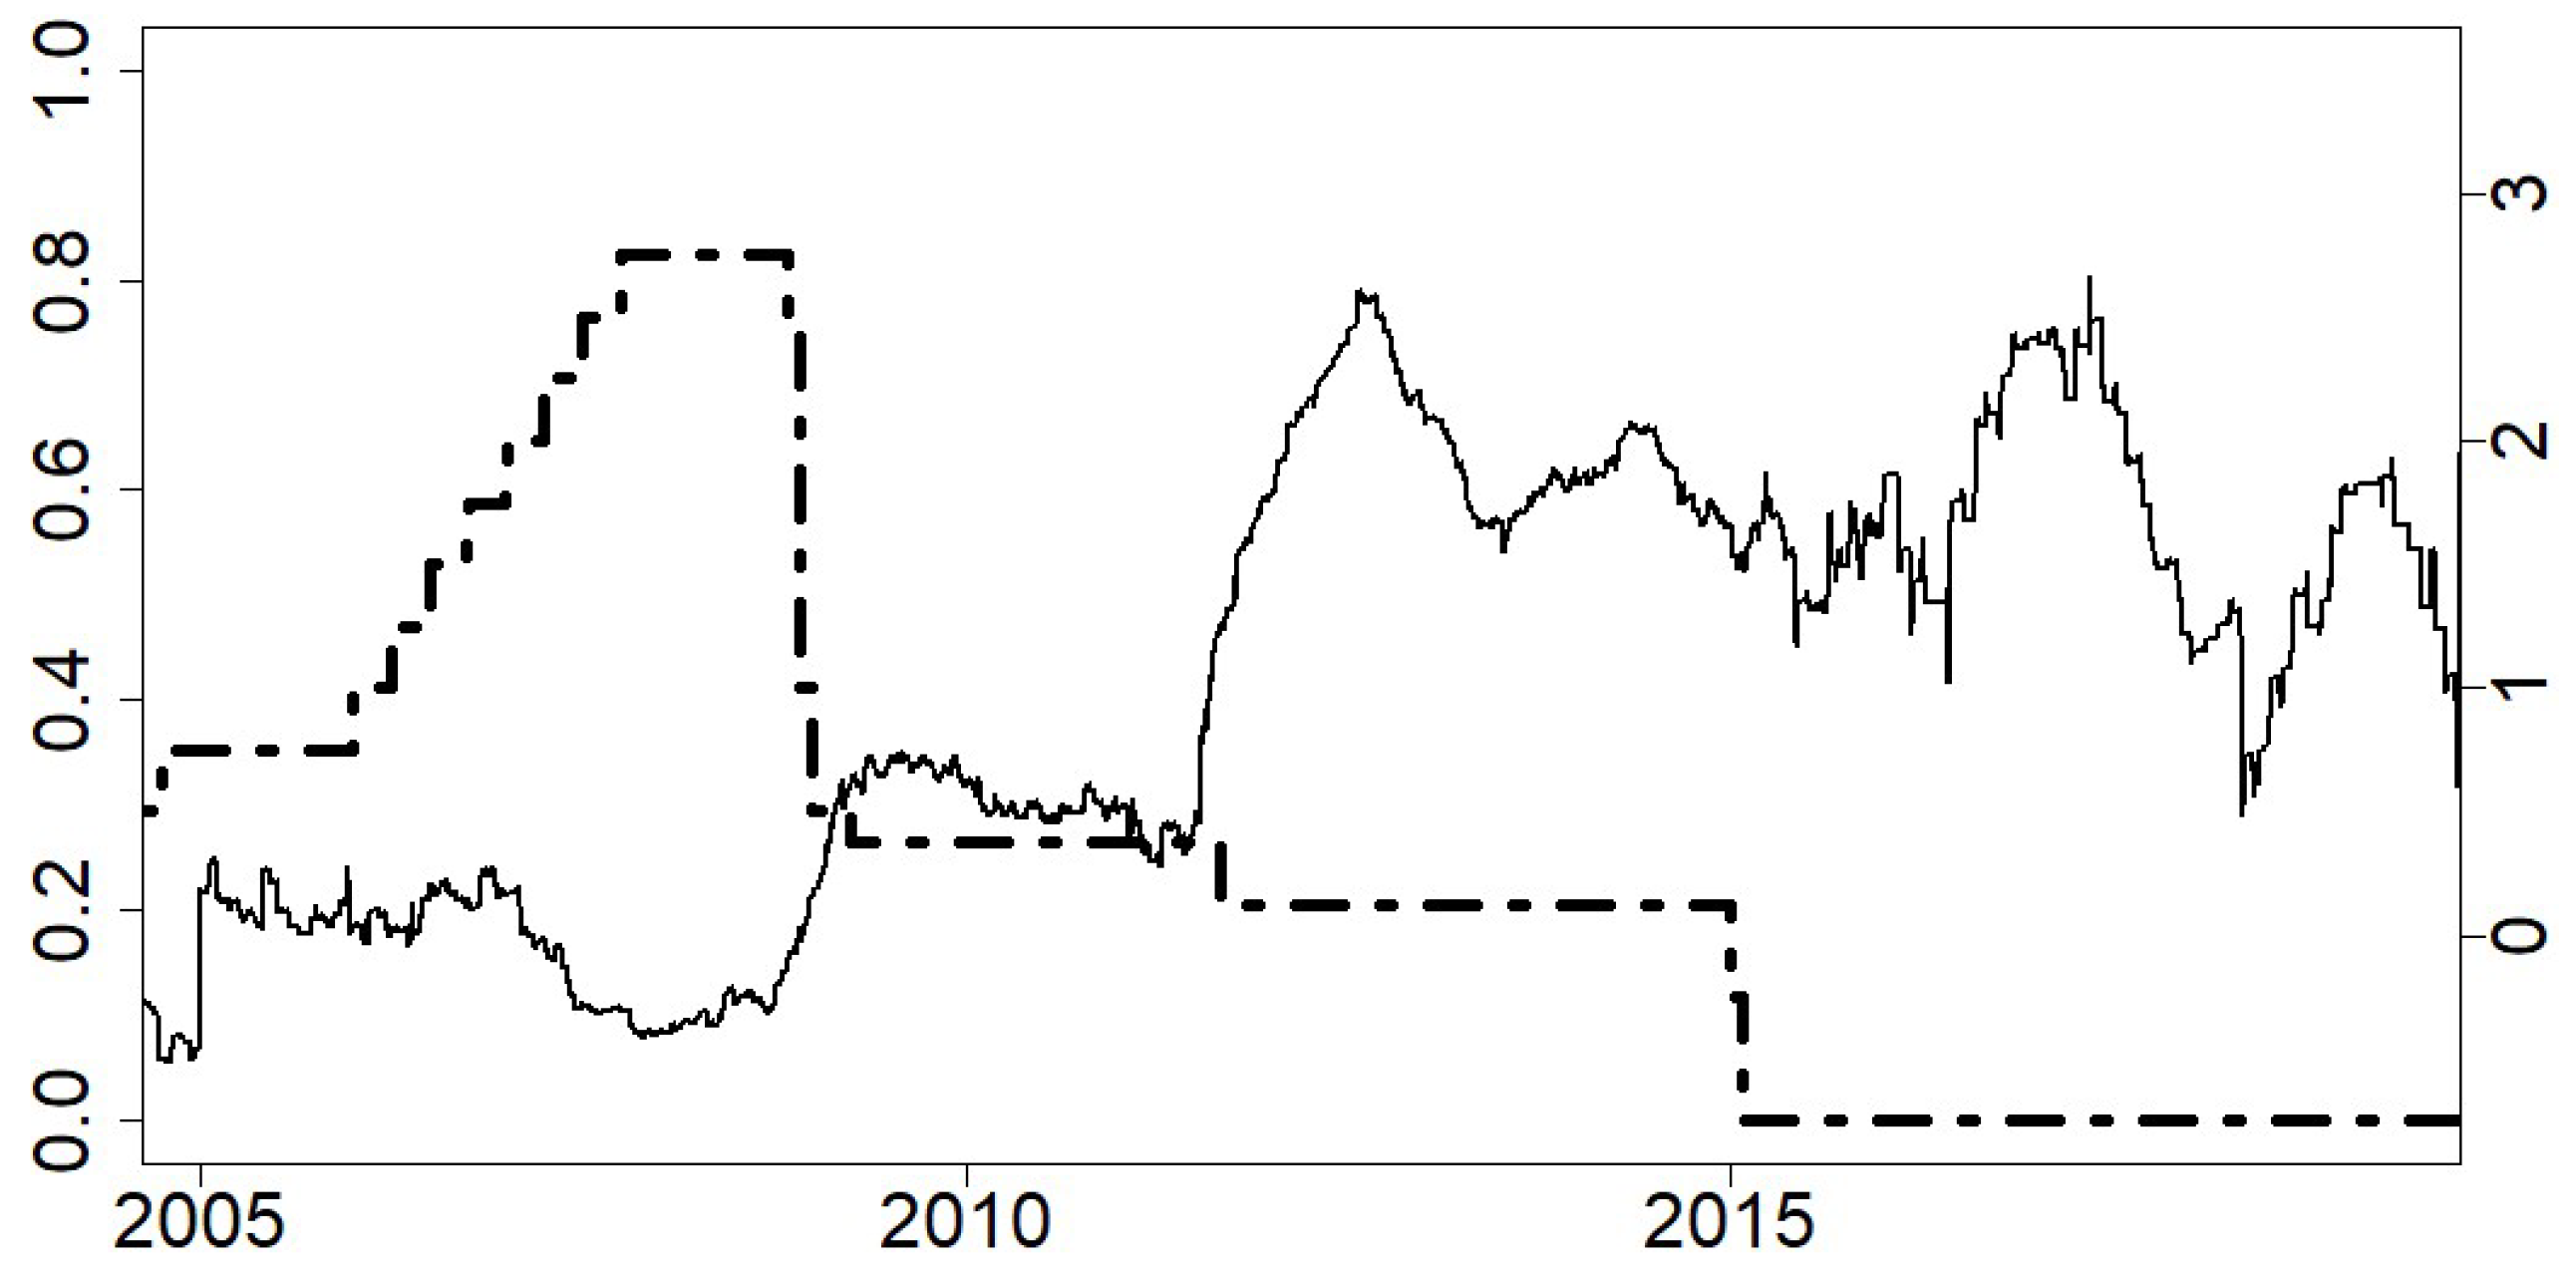
The relation between interest rates and capital protected products becomes indeed obvious when looking at Figure 1, and in particular at the years since around 2009: the lower the interest rate, the fewer products were issued.
If interest rates are the main driver of this trend, we would expect to see fully protected products to be affected first by decreasing interest rates. Indeed, issuers tended to shift from fully to partially protected products at first after interest rates had dropped (see Figure 2). From around 2012, however, also these products were not issued much anymore. Potential reasons might be changes in market volatility or simply a learning process with issuers or investors that a partial capital protection is just far less appealing than a full protection—for the behavioral reasons explained above.
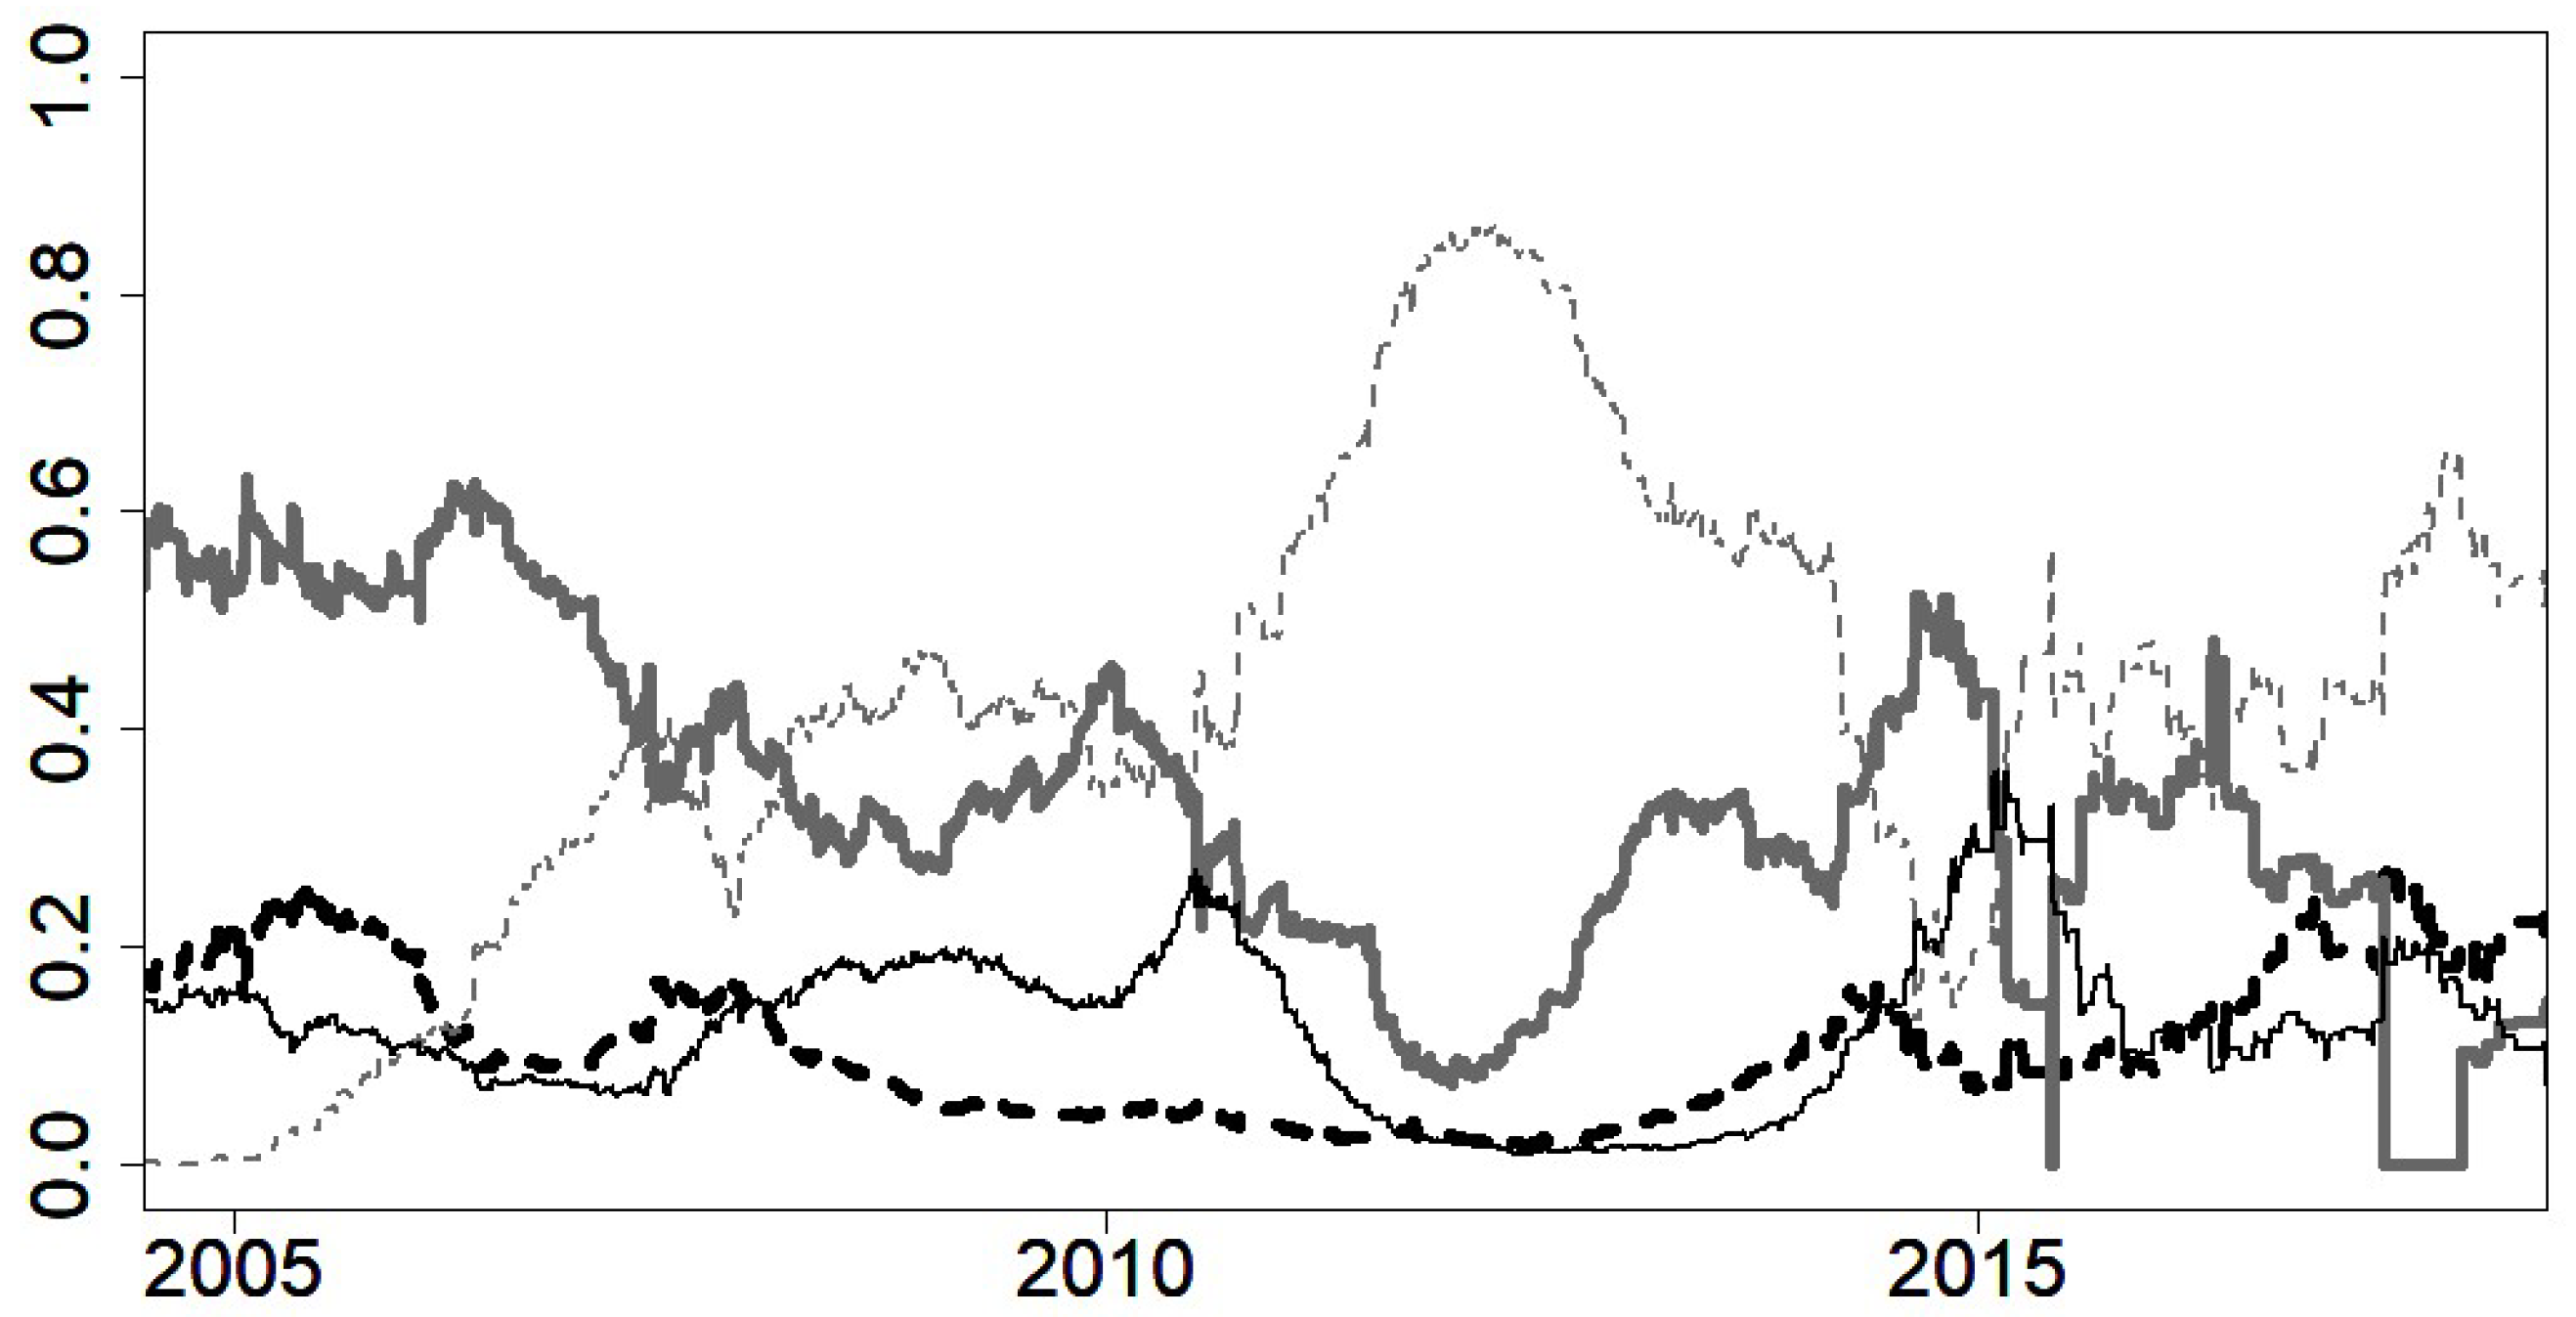
A similar effect can be observed for products with indices and baskets as underlyings: since indices and baskets can have lower volatility, they make it easier to provide good participation rates. This might explain that we see a small peak in index underlyings around 2013, and that basket underlyings stayed fairly stable over the whole time period (Figure 3).
In summary, we can distinguish three phases of the slow death of capital protection: in the high interest rate regime until 2008, capital protection products of all types are frequent. In the low interest rate regimes from 2008 to 2015, issuing of these products decreased dramatically. Instead of full participation, partial participation became popular for a while but turned out to be a dead end road, so issuers also stopped this line of products. Instead, baskets were more frequently used as underlyings. Finally, from 2015 on, in the negative interest rate regime, basically all types of capital protected products disappeared.
In the following, we will verify these heuristic results with regression analyses. To account for deviations from normality in the data, we apply MM-type robust regressions.4 We first test the impact of interest rates and market volatility on the total proportion of capital protected products among all investment products, controlling for time. The analysis shows a highly significant effect of interest rate but no time trend or volatility effects (Table 2). The empirical result supports our considerations above: lower interest rates clearly reduce the issuance of capital protected products. The same result holds when looking at the proportion of fully protected products, with additionally a significant time trend and volatility effect (Table 2). For partially protected products, we only find a positive time trend but no interest rate effect because of the strong increase in partially protected products in the period from 2010 onward to match the cost structure with the reduced financing effects from low interest rates.
When looking at underlyings, we notice the issuance of single underlyings declines with the interest rate. While for index and basket products we cannot identify an influence of neither interest rates nor volatility (Table 3). However, products with Multi-Asset underlyings decline with the lower interest rates but increase with market volatility. A possible explanation for this last observation might be that such assets are seen by investors as a way to diversify in uncertain times while, at the same time, the assets can be chosen in a way that the diversification effect is rather limited, and thus, the product characteristics still look good on paper. Further investigations, however, are needed to test this conjecture.

4. Conclusions

We can distinguish three phases of the slow death of capital protection: live, until 2008, suffering, until 2015, and death. These phases coincide with the development of the global interest rate, positive–decreasing–negative. The interest rate development strongly correlates with the emission density of capital protected products, while this holds not true for other classes of structured products. In other words, empirical evidence suggests zero-interest policy killed that product type, although it actually makes sense for investors. Even the swing to partial protection or varying the type of underlyings only slowed down the process. Although data availability constrained us to use issuance numbers instead of volume, we could empirically verify that this relation is singular to capital protected products in the group of structured products. An analysis of other product classes to answer the question, who next, is left to future research.

Author Contributions

Conceptualization, C.B. and M.O.R.; methodology, data aquisiton and theory, M.O.R.; empirical analysis C.B. All authors have read and agreed to the published version of the manuscript.

Funding

This research received no external funding.

Institutional Review Board Statement

Not applicable.

Informed Consent Statement

Not applicable.

Data Availability Statement

Restrictions apply to the availability of these data. Data was obtained from derivative partners.

Conflicts of Interest

The authors declare no conflict of interest.

Notes

1
This also explains why academic research in this field is often at a disadvantage, given the well-documented US bias regarding data in publications in top finance journals (Karolyi 2016).
2
Warrants have the same payoff as plain vanilla options, however, they are not traded on an option market, but instead on markets for structured products or over the counter. This means that they—like all other structured products—include an issuer risk: if the issuing company (usually bank) goes bankrupt, the invested money is usually lost, regardless of the development of the underlying asset. Warrants also have on average a longer time to expiration than options.
3
Neither the interest rate nor the VIX have significant influence on the share of any of the subgroups of all structured products, except for the subgroup of capital protected products. Detailed results available from the authors.
4
The residuals for the OLS regressions showed leptokurtosis of 1.5 to 3.5 and excess kurtosis of 7 to 30 in 7 of 11 models presented in the results section. The Jarque–Bera test for normal distributed data yielded p-values below 10 6 in 8 and the Breusch–Pagan test for heteroscedasticity p-values below 0.001 in 7 of the 11 models.

References

  1. Abreu, Margarida, and Victor Mendes. 2018. The investor in structured retail products: Advice driven or gambling oriented? Journal of Behavioral and Experimental Finance 17: 1–9. [Google Scholar] [CrossRef]
  2. Anic, Vladimir, and Martin Wallmeier. 2020. Perceived attractiveness of structured financial products: The role of presentation format and reference instruments. Journal of Behavioral Finance 21: 78–102. [Google Scholar] [CrossRef]
  3. Benet, Bruce A., Antoine Giannetti, and Seema Pissaris. 2006. Gains from structured product markets: The case of reverse-exchangeable securities (RES). Journal of Banking and Finance 30: 111–32. [Google Scholar] [CrossRef]
  4. Branger, Nicole, and Beate Breuer. 2007. The Optimal Demand for Retail Derivatives. Working Paper. Münster: University of Münster. [Google Scholar]
  5. Breuer, Wolfgang, and Achim Perst. 2007. Retail banking and behavioral financial engineering: The case of structured products. Journal of Banking and Finance 31: 827–44. [Google Scholar] [CrossRef]
  6. Grünbichler, Andreas, and Hanspeter Wohlwend. 2005. The valuation of structured products: Empirical findings for the Swiss market. Financial Markets and Portfolio Management 19: 361–80. [Google Scholar] [CrossRef]
  7. Henderson, Brian J., and Neil D. Pearson. 2011. The dark side of financial innovation: A case study of the pricing of a retail financial product. Journal of Financial Economics 100: 227–47. [Google Scholar] [CrossRef]
  8. Hens, Thorsten, and Marc Oliver Rieger. 2014. Can utility optimization explain the demand for structured investment products? Quantitative Finance 14: 673–81. [Google Scholar] [CrossRef] [Green Version]
  9. Holzmeister, Felix, Jürgen Huber, Michael Kirchler, Florian Lindner, Utz Weitzel, and Stefan Zeisberger. 2020. What drives risk perception? A global survey with financial professionals and laypeople. Management Science 66: 3977–4002. [Google Scholar] [CrossRef] [Green Version]
  10. Karolyi, George Andrew. 2016. Home bias, an academic puzzle. Review of Finance 20: 2049–78. [Google Scholar] [CrossRef]
  11. Kunz, Alexis H., Claude Messner, and Martin Wallmeier. 2017. Investors’ risk perceptions of structured financial products with worst-of payout characteristics. Journal of Behavioral and Experimental Finance 15: 66–73. [Google Scholar] [CrossRef]
  12. Rieger, Marc Oliver. 2009. Optionen, Derivate und Strukturierte Produkte (Options, Derivatives and Structured Products). Stuttgart: Schäffer-Poeschel. [Google Scholar]
  13. Rieger, Marc Oliver. 2011. Co-monotonicity of optimal investments and the design of structural financial products. Finance and Stochastics 15: 27–55. [Google Scholar] [CrossRef]
  14. Rieger, Marc Oliver. 2012. Why do investors buy bad financial products? Probability misestimation and preferences in financial investment decision. Journal of Behavioral Finance 13: 108–18. [Google Scholar] [CrossRef]
  15. Rieger, Marc Oliver, and Thorsten Hens. 2012. Explaining the demand for structured financial products: Survey and field experiment evidence. Zeitschrift für Betriebswirtschaftslehre 82: 491–508. [Google Scholar] [CrossRef]
  16. Shefrin, Hersh, and Meir Statman. 1993. Behavioral aspects of the design and marketing of financial products. Financial Management 22: 123–34. [Google Scholar] [CrossRef]
  17. Shefrin, Hersh, and Meir Statman. 2000. Behavioral portfolio theory. Journal of Financial and Quantitative Analysis 35: 127–151. [Google Scholar] [CrossRef] [Green Version]
  18. Stoimenov, Pavel A., and Sascha Wilkens. 2005. Are structured products “fairly” priced? An analysis of the German market for equity-linked instruments. Journal of Banking and Finance 29: 2971–93. [Google Scholar] [CrossRef]
  19. Szymanowska, Marta, Jenke Ter Horst, and Chris Veld. 2009. Reverse convertible bonds analyzed. Journal of Futures Markets: Futures, Options, and Other Derivative Products 29: 895–919. [Google Scholar] [CrossRef]
  20. Tversky, Amos, and Daniel Kahneman. 1992. Advances in Prospect Theory: Cumulative representation of uncertainty. Journal of Risk and Uncertainty 5: 297–323. [Google Scholar] [CrossRef]
  21. Wallmeier, Martin, and Martin Diethelm. 2009. Market pricing of exotic structured products: The case of multi-asset barrier reverse convertibles in switzerland. The Journal of Derivatives 17: 59–72. [Google Scholar] [CrossRef] [Green Version]
  22. Wilkens, Sascha, Carsten Erner, and Klaus Röder. 2003. The pricing of structured products—An empirical investigation of the German market. The Journal of Derivatives 11: 55–69. [Google Scholar] [CrossRef]
  23. Wilkens, Sascha, and Pavel A. Stoimenov. 2007. The pricing of leverage products: An empirical investigation of the German market for ‘long’ and ‘short’ stock index certificates. Journal of Banking and Finance 31: 735–50. [Google Scholar] [CrossRef]
  24. Zeisberger, Stefan. 2020. Do People Care about Loss Probabilities? Available at SSRN 2169394. Available online: https://ssrn.com/abstract=2169394 (accessed on 30 June 2021).
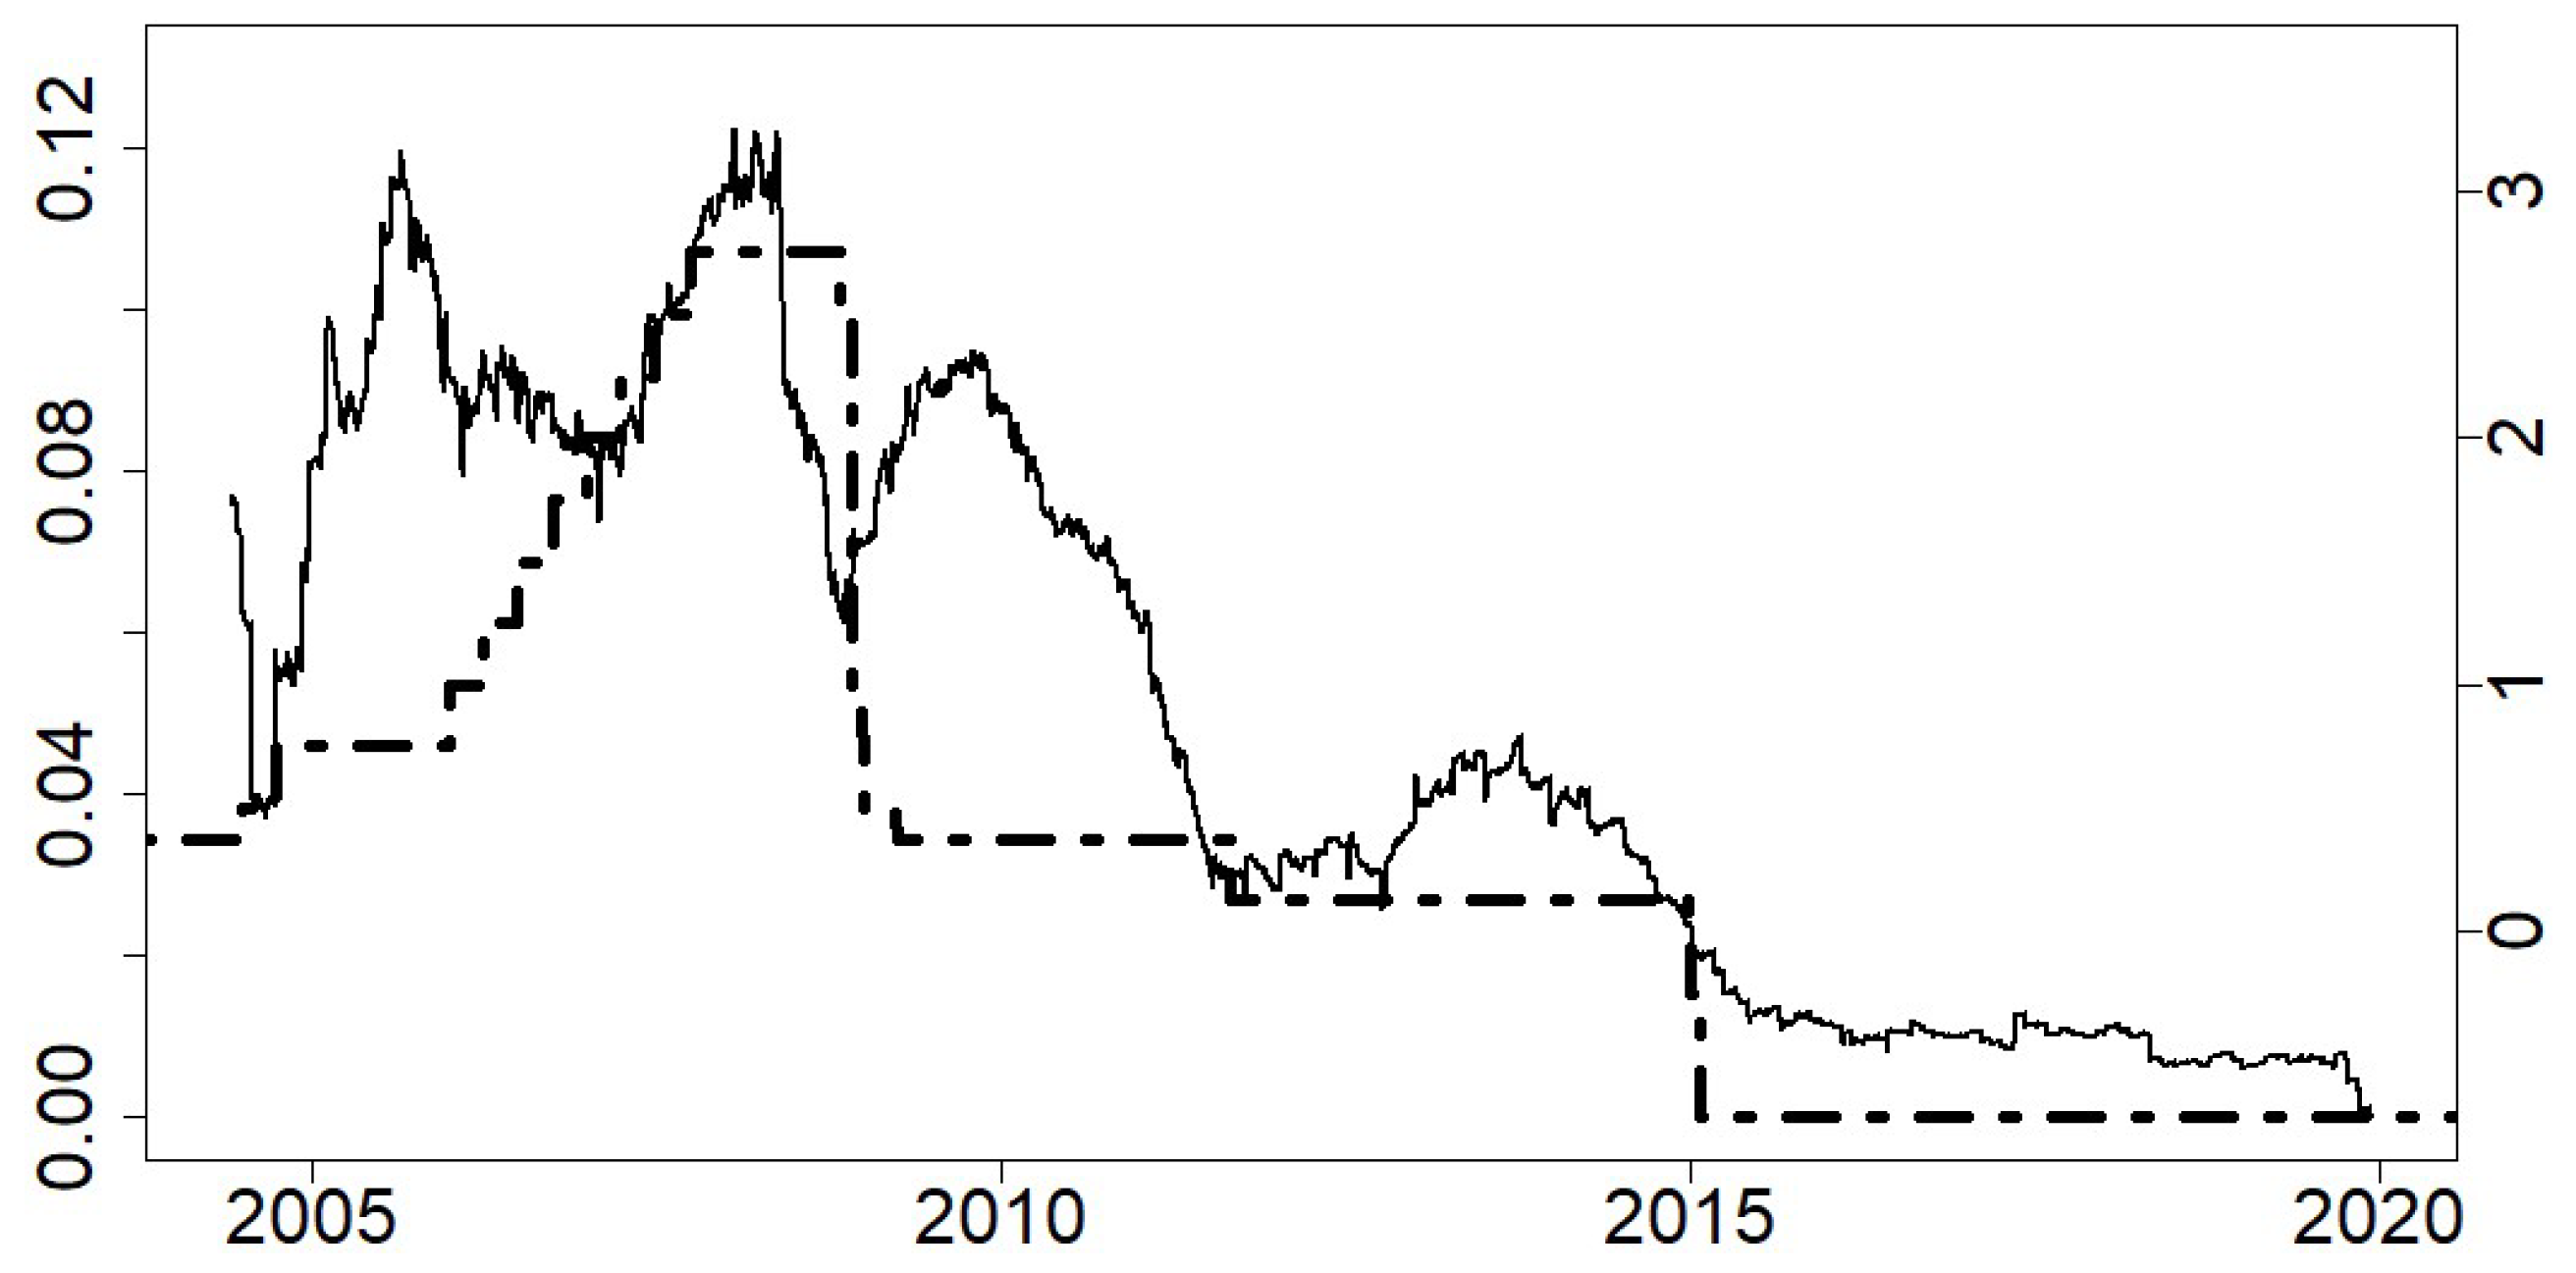
Figure 1. Left axis: Proportion of capital protected products among all investment products and interest rate levels from 2004 to 2019. Right axis: Swiss policy interest rate (dash-dot).
Jrfm 14 00303 g001
Figure 2. Left axis: Proportion of partially protected products among all capital protected products and interest rate levels from 2004 to 2019. Right axis: Swiss policy interest rate (dash-dot).
Jrfm 14 00303 g002
Figure 3. Proportion of single stocks (thin black solid), indices (thick black dashed), baskets (thick gray solid) and multiple assets (thin gray dashed) as underlyings of capital protected products and interest rate levels from 2004 to 2019.
Jrfm 14 00303 g003
Table 1. Share of capital protected products on all investment products, 2004–2019.
YearNumber of Investment ProductsNumber of Capital Protected ProductsShare in %
2004828637.6%
200530562488.1%
200669516339.1%
200717,39414288.2%
200822,845262211.5%
200917,89112757.1%
201030,20326369.7%
201123,58714486.1%
201220,8995902.8%
201322,5759584.2%
201422,7908203.6%
201522,6265382.4%
20167495871.2%
201711,0101091.0%
201811,9821251.0%
201913,179910.7%
Table 2. Influence of the interest rate on the issuance of capital protected products (CPP) and the share of full and partial protection.
Dependent Variable:
CPP Share
on All SP
Shares of Different Protection
Levels among All CPPs
Full prot.Partial prot.
(1)(2)(3)
Swiss policy rate0.022 ***0.026−0.011
(0.006)(0.023)(0.021)
VIX0.0010.006 ***−0.005 ***
(0.001)(0.002)(0.002)
Time−0.00000−0.0001 ***0.0001 ***
(0.00000)(0.00003)(0.00003)
Constant0.0801.711 ***−0.813 **
(0.069)(0.454)(0.386)
Observations188183183
R 2 0.5370.2890.244
Adjusted R 2 0.5290.2770.231
Resid. Std. Error0.0250.2350.242
(df = 184)(df = 179)(df = 179)
** p < 0.05; *** p < 0.01.
Table 3. Influence of the interest rate on the issuance of capital protected products with single, basket and index underlying.
Dependent Variable:
SingleIndexBasketMulti Asset
(1)(2)(3)(4)
Swiss policy rate0.145 ***0.0490.230 *0.228 ***
(0.021)(0.042)(0.135)(0.065)
VIX0.0020.001−0.005 *0.016 ***
(0.003)(0.001)(0.003)(0.003)
Time0.00003 ***0.00002 **0.0001 *0.0001 ***
(0.00001)(0.00001)(0.00004)(0.00003)
Constant−0.441 **−0.329 *−0.752−1.758 ***
(0.187)(0.172)(0.497)(0.386)
Observations188226207188
R 2 0.4990.1320.1960.330
Adjusted R 2 0.4910.1200.1840.319
Resid. Std. Error0.1150.0800.2530.328
(df = 184)(df = 222)(df = 203)(df = 184)
* p < 0.1; ** p < 0.05; *** p < 0.01.
Publisher’s Note: MDPI stays neutral with regard to jurisdictional claims in published maps and institutional affiliations.