
Machine Learning in Finance: A Metadata-Based Systematic Review of the Literature


Abstract
:1. Introduction
2. Materials and Methods
2.1. Methodology
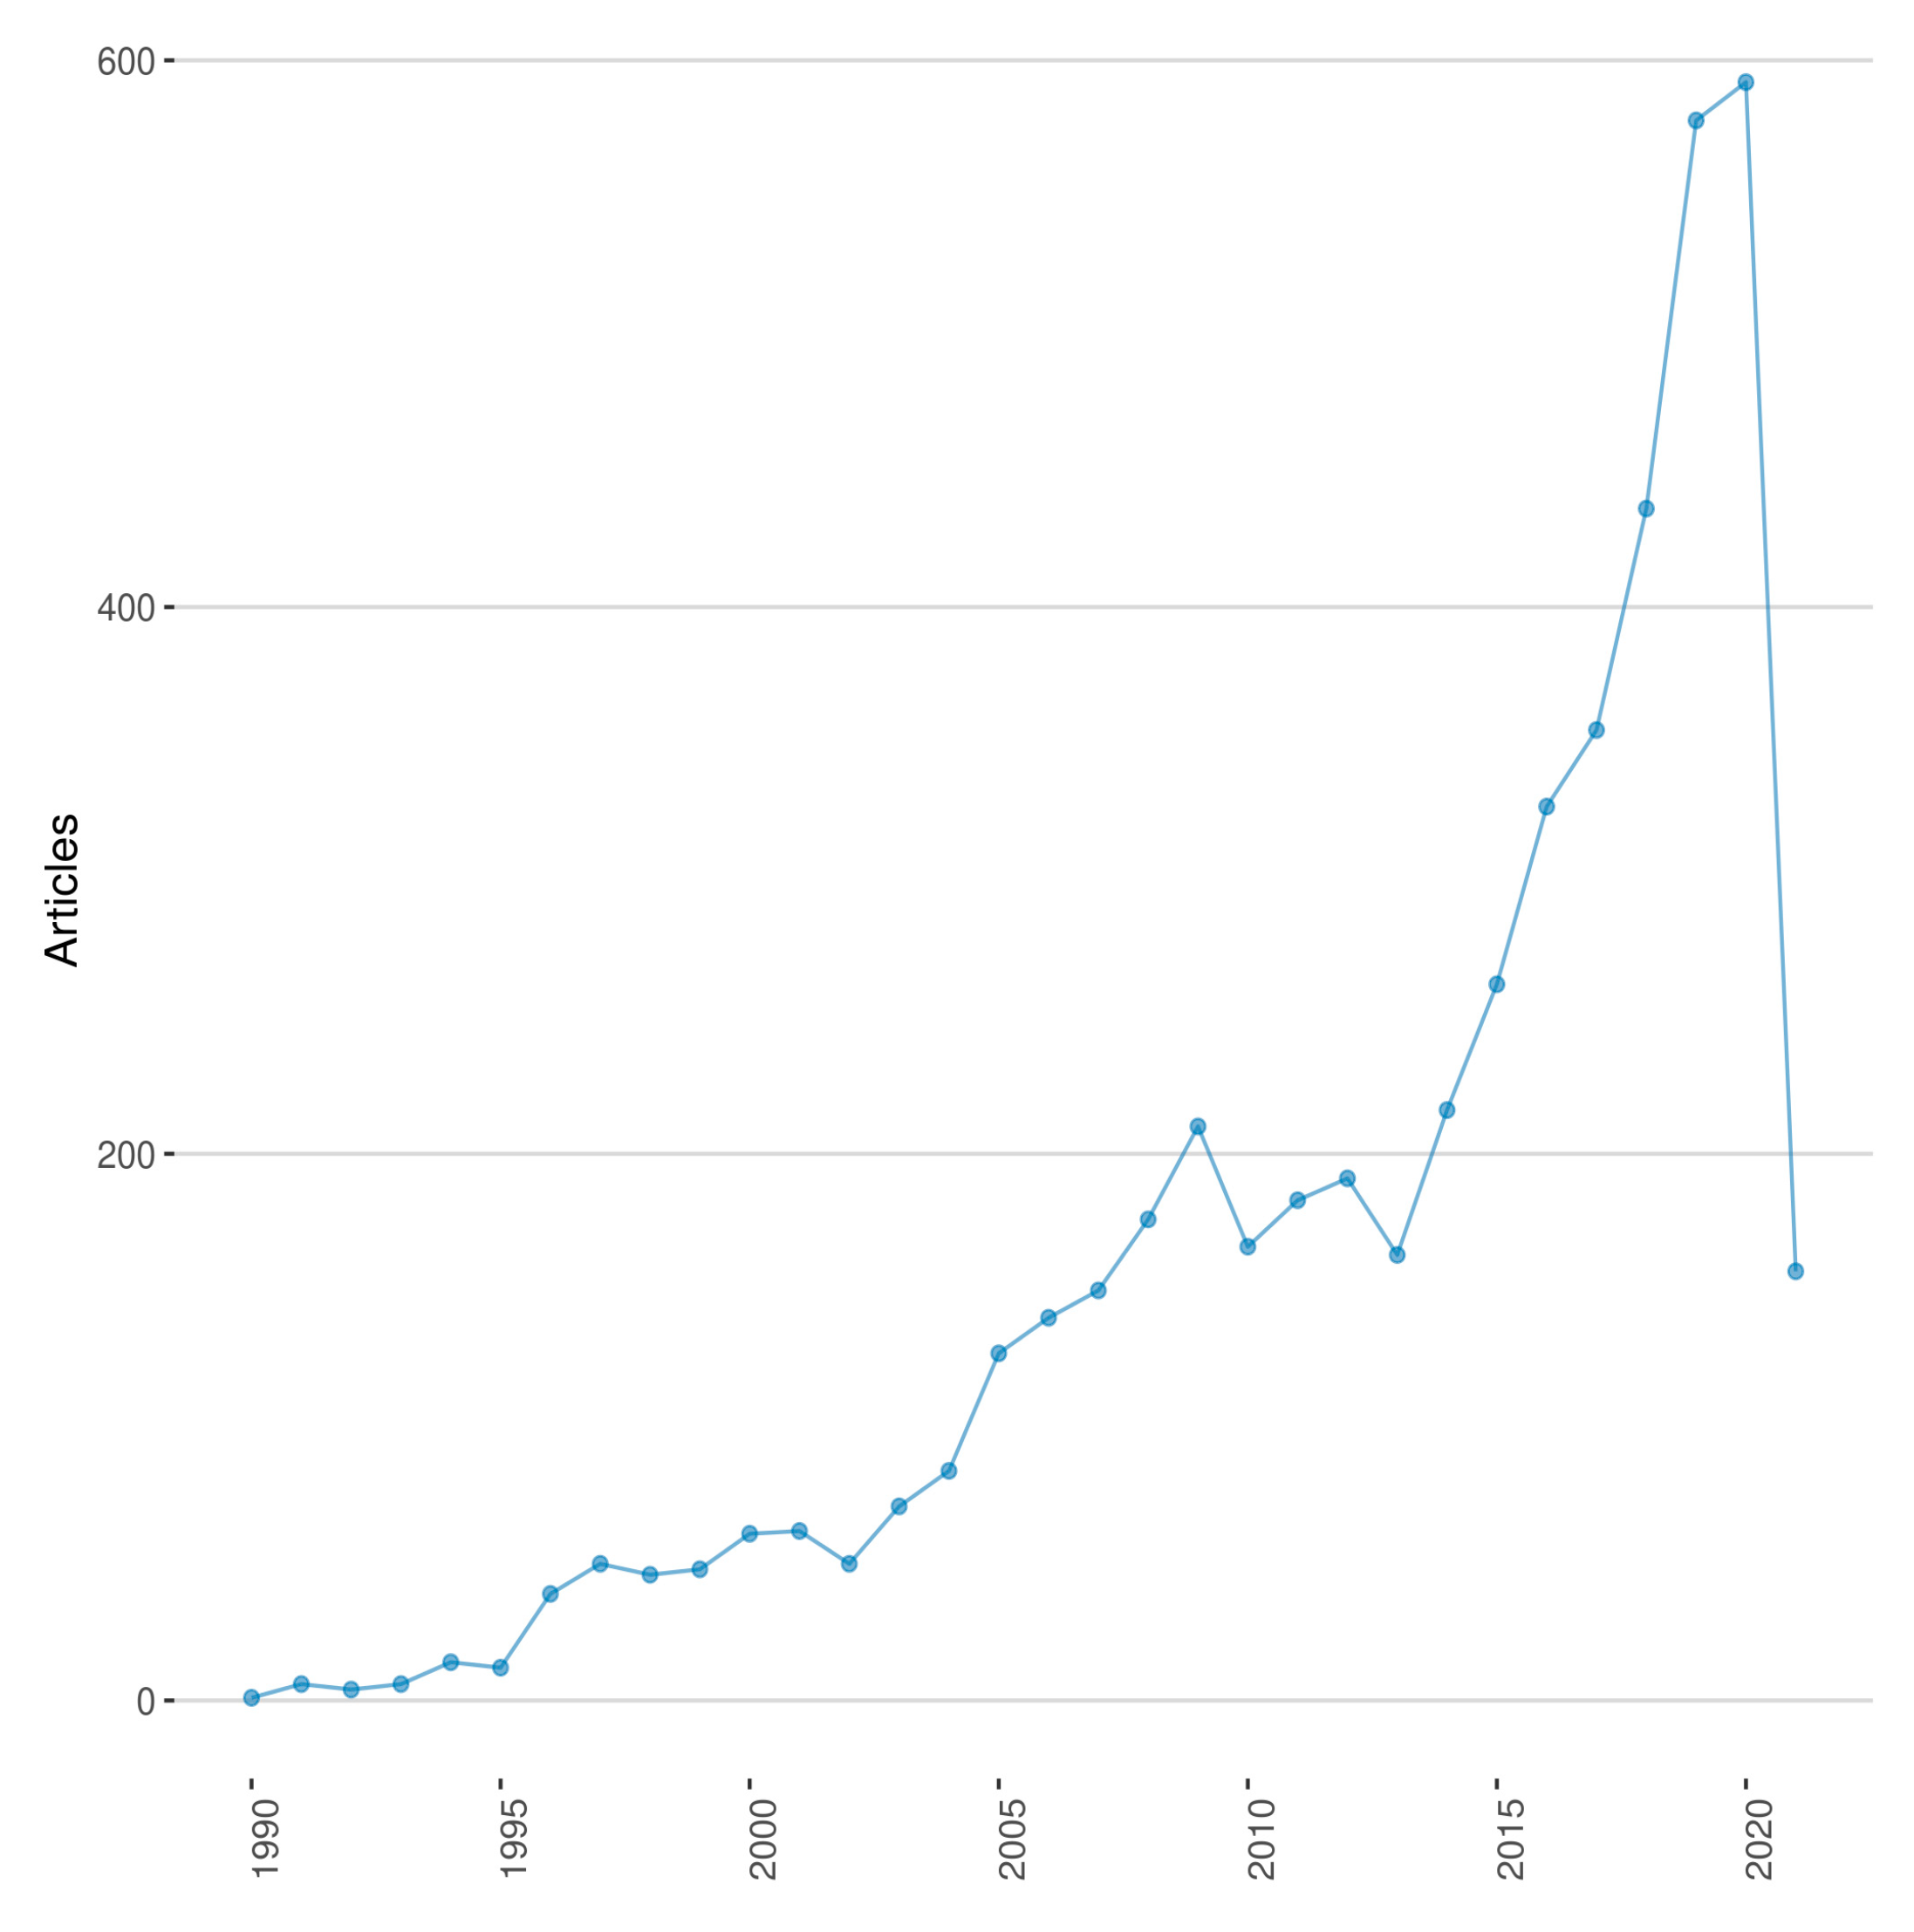
2.2. Descriptive Statistics
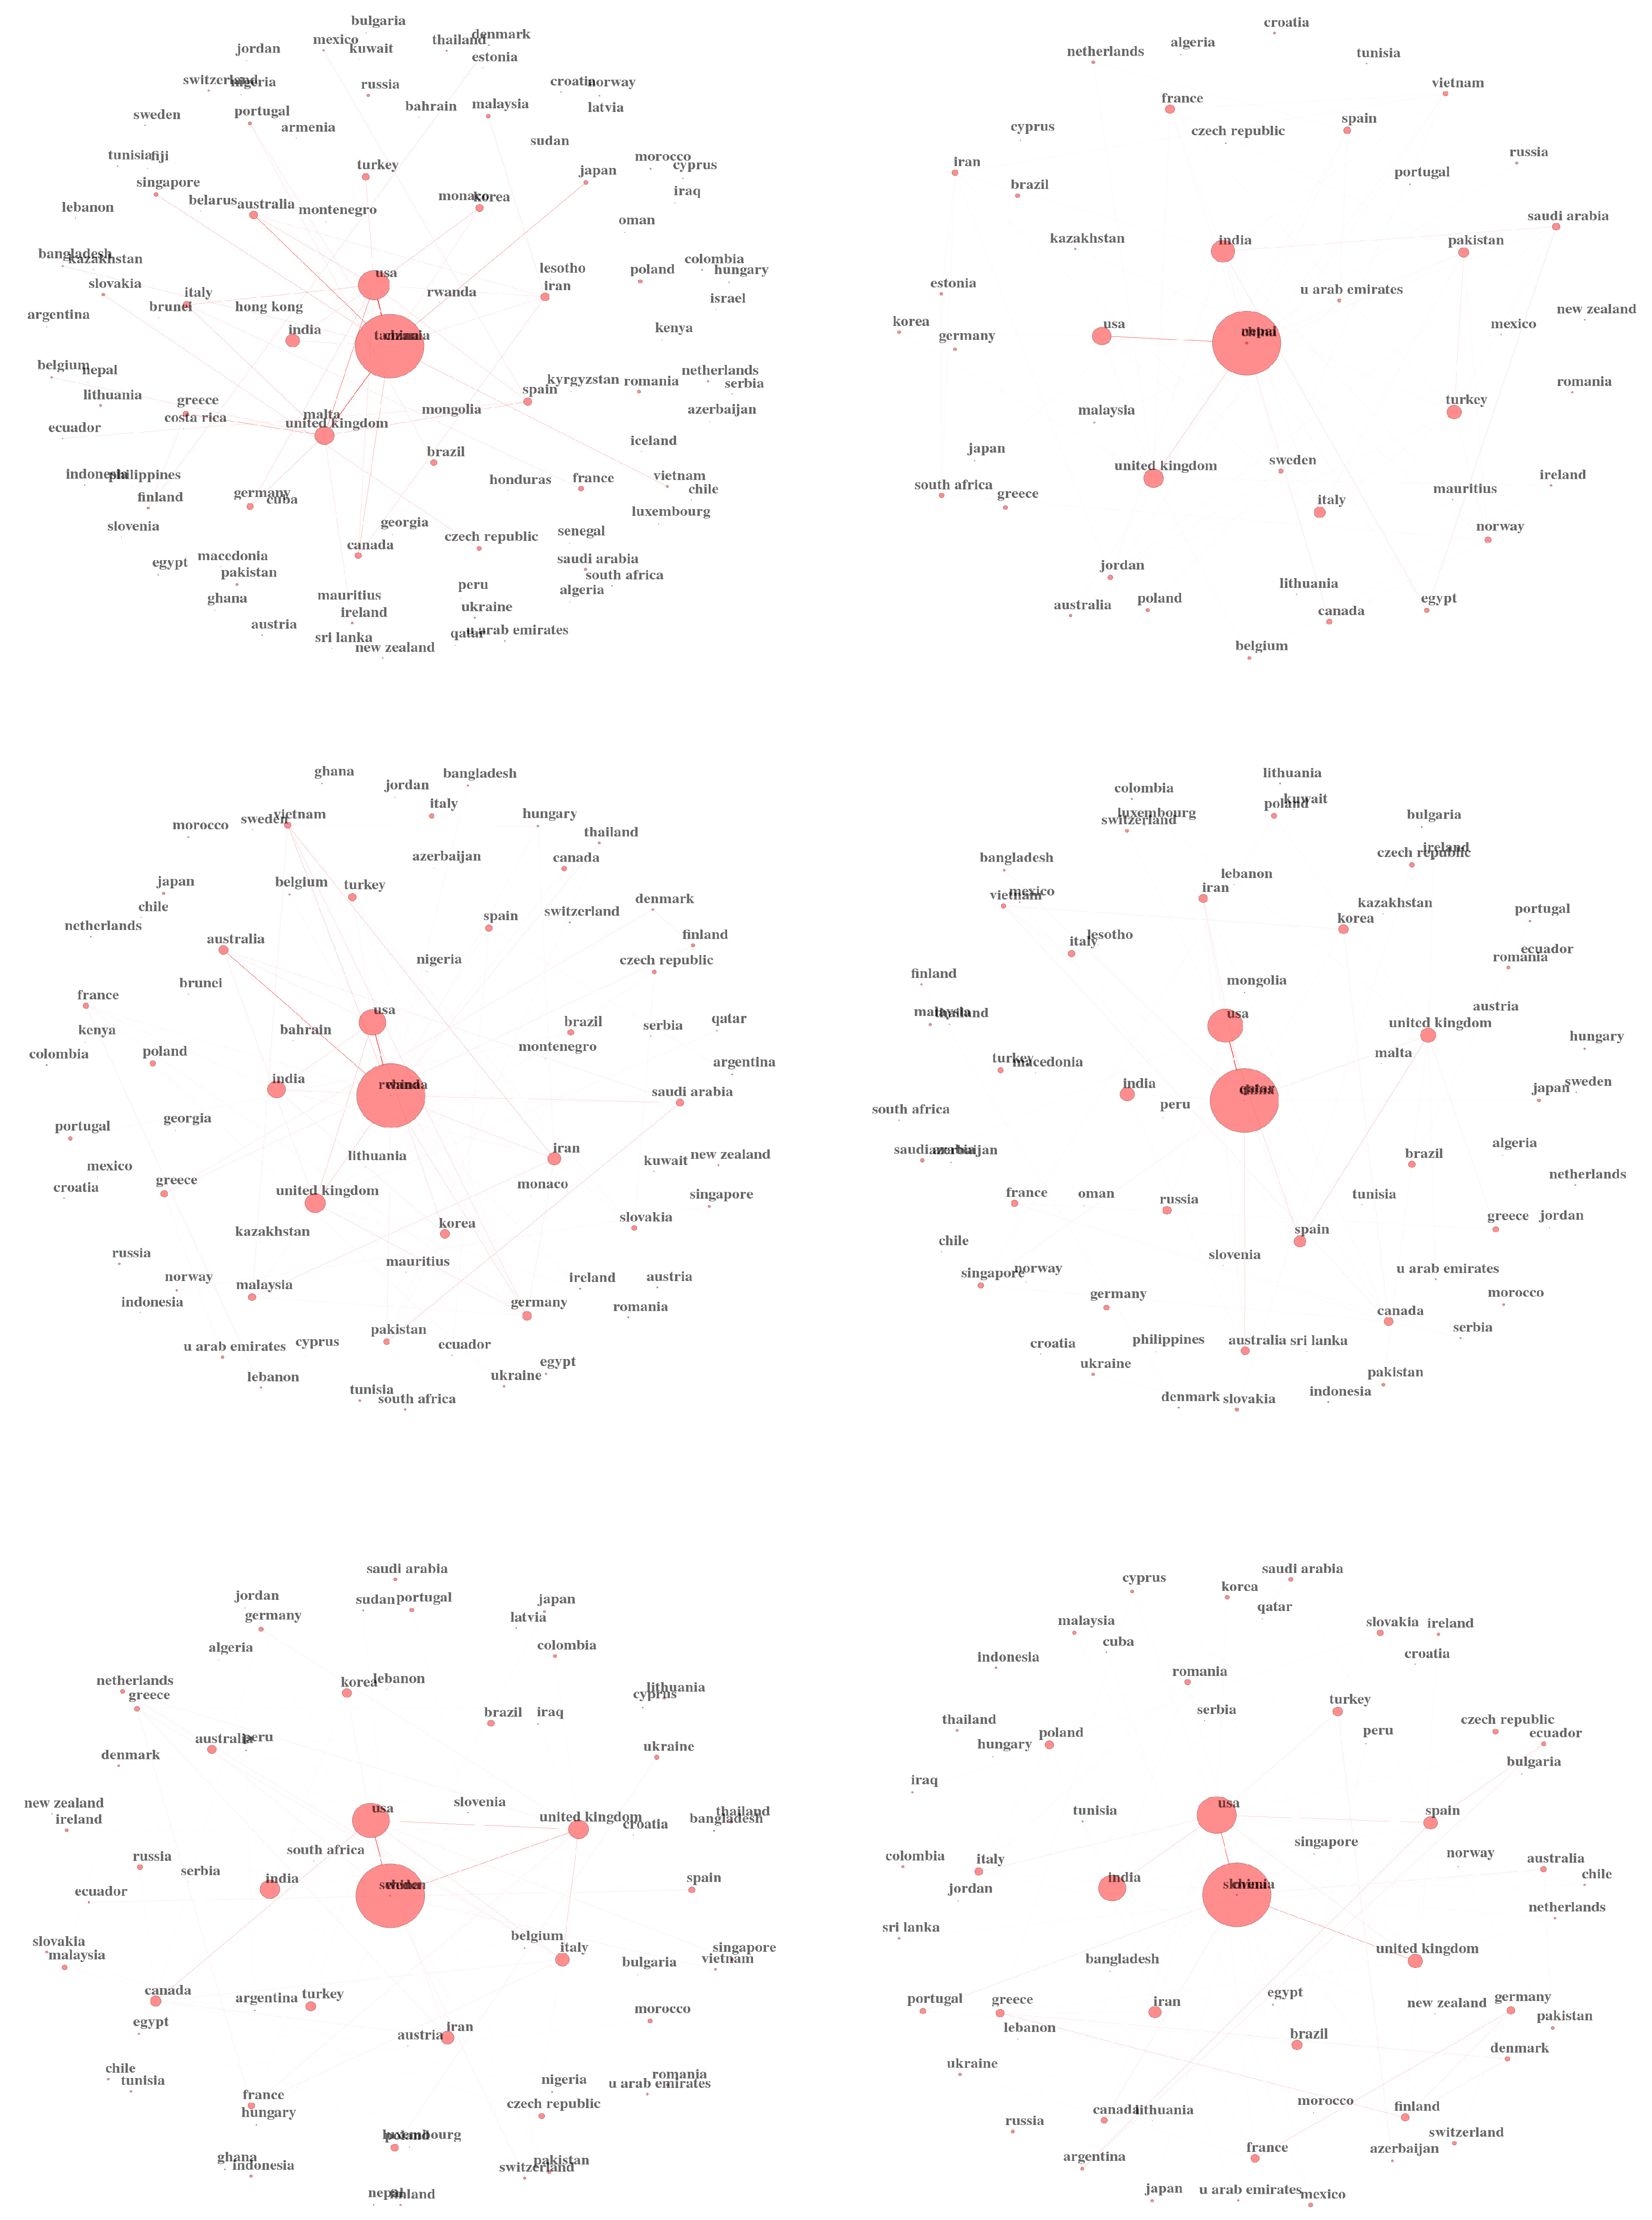
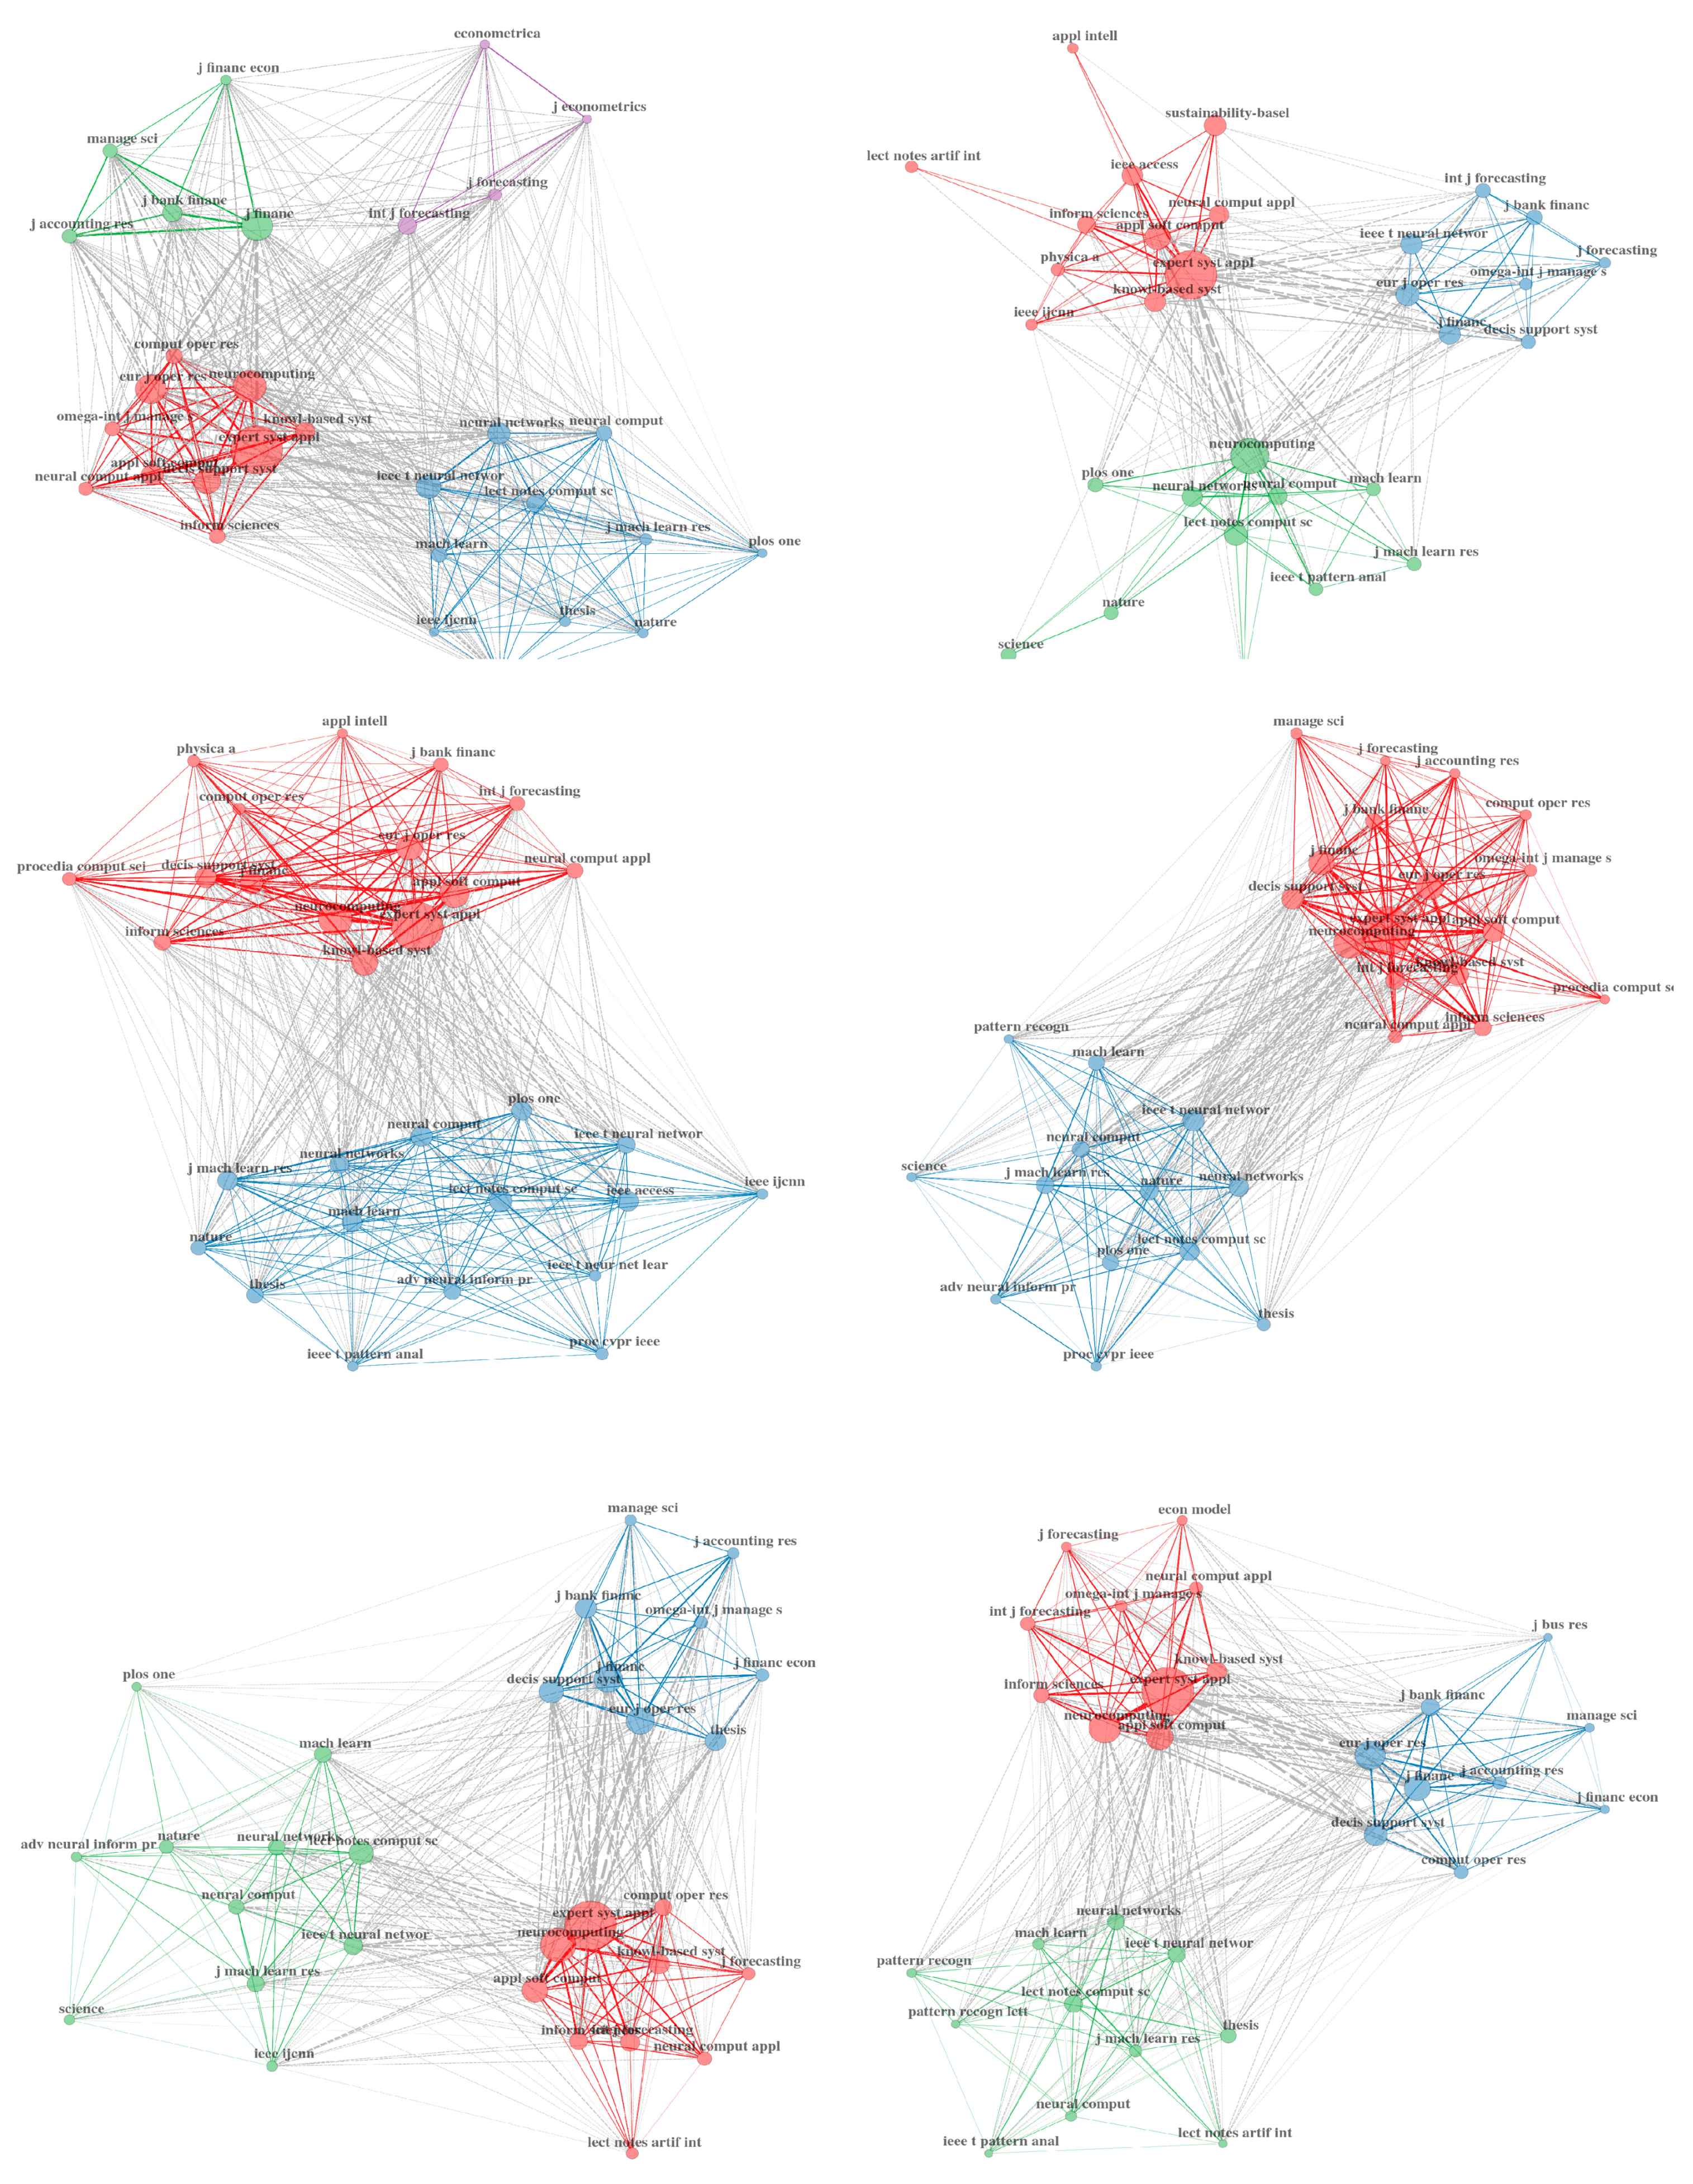
3. Conceptual Structures of Our Sample
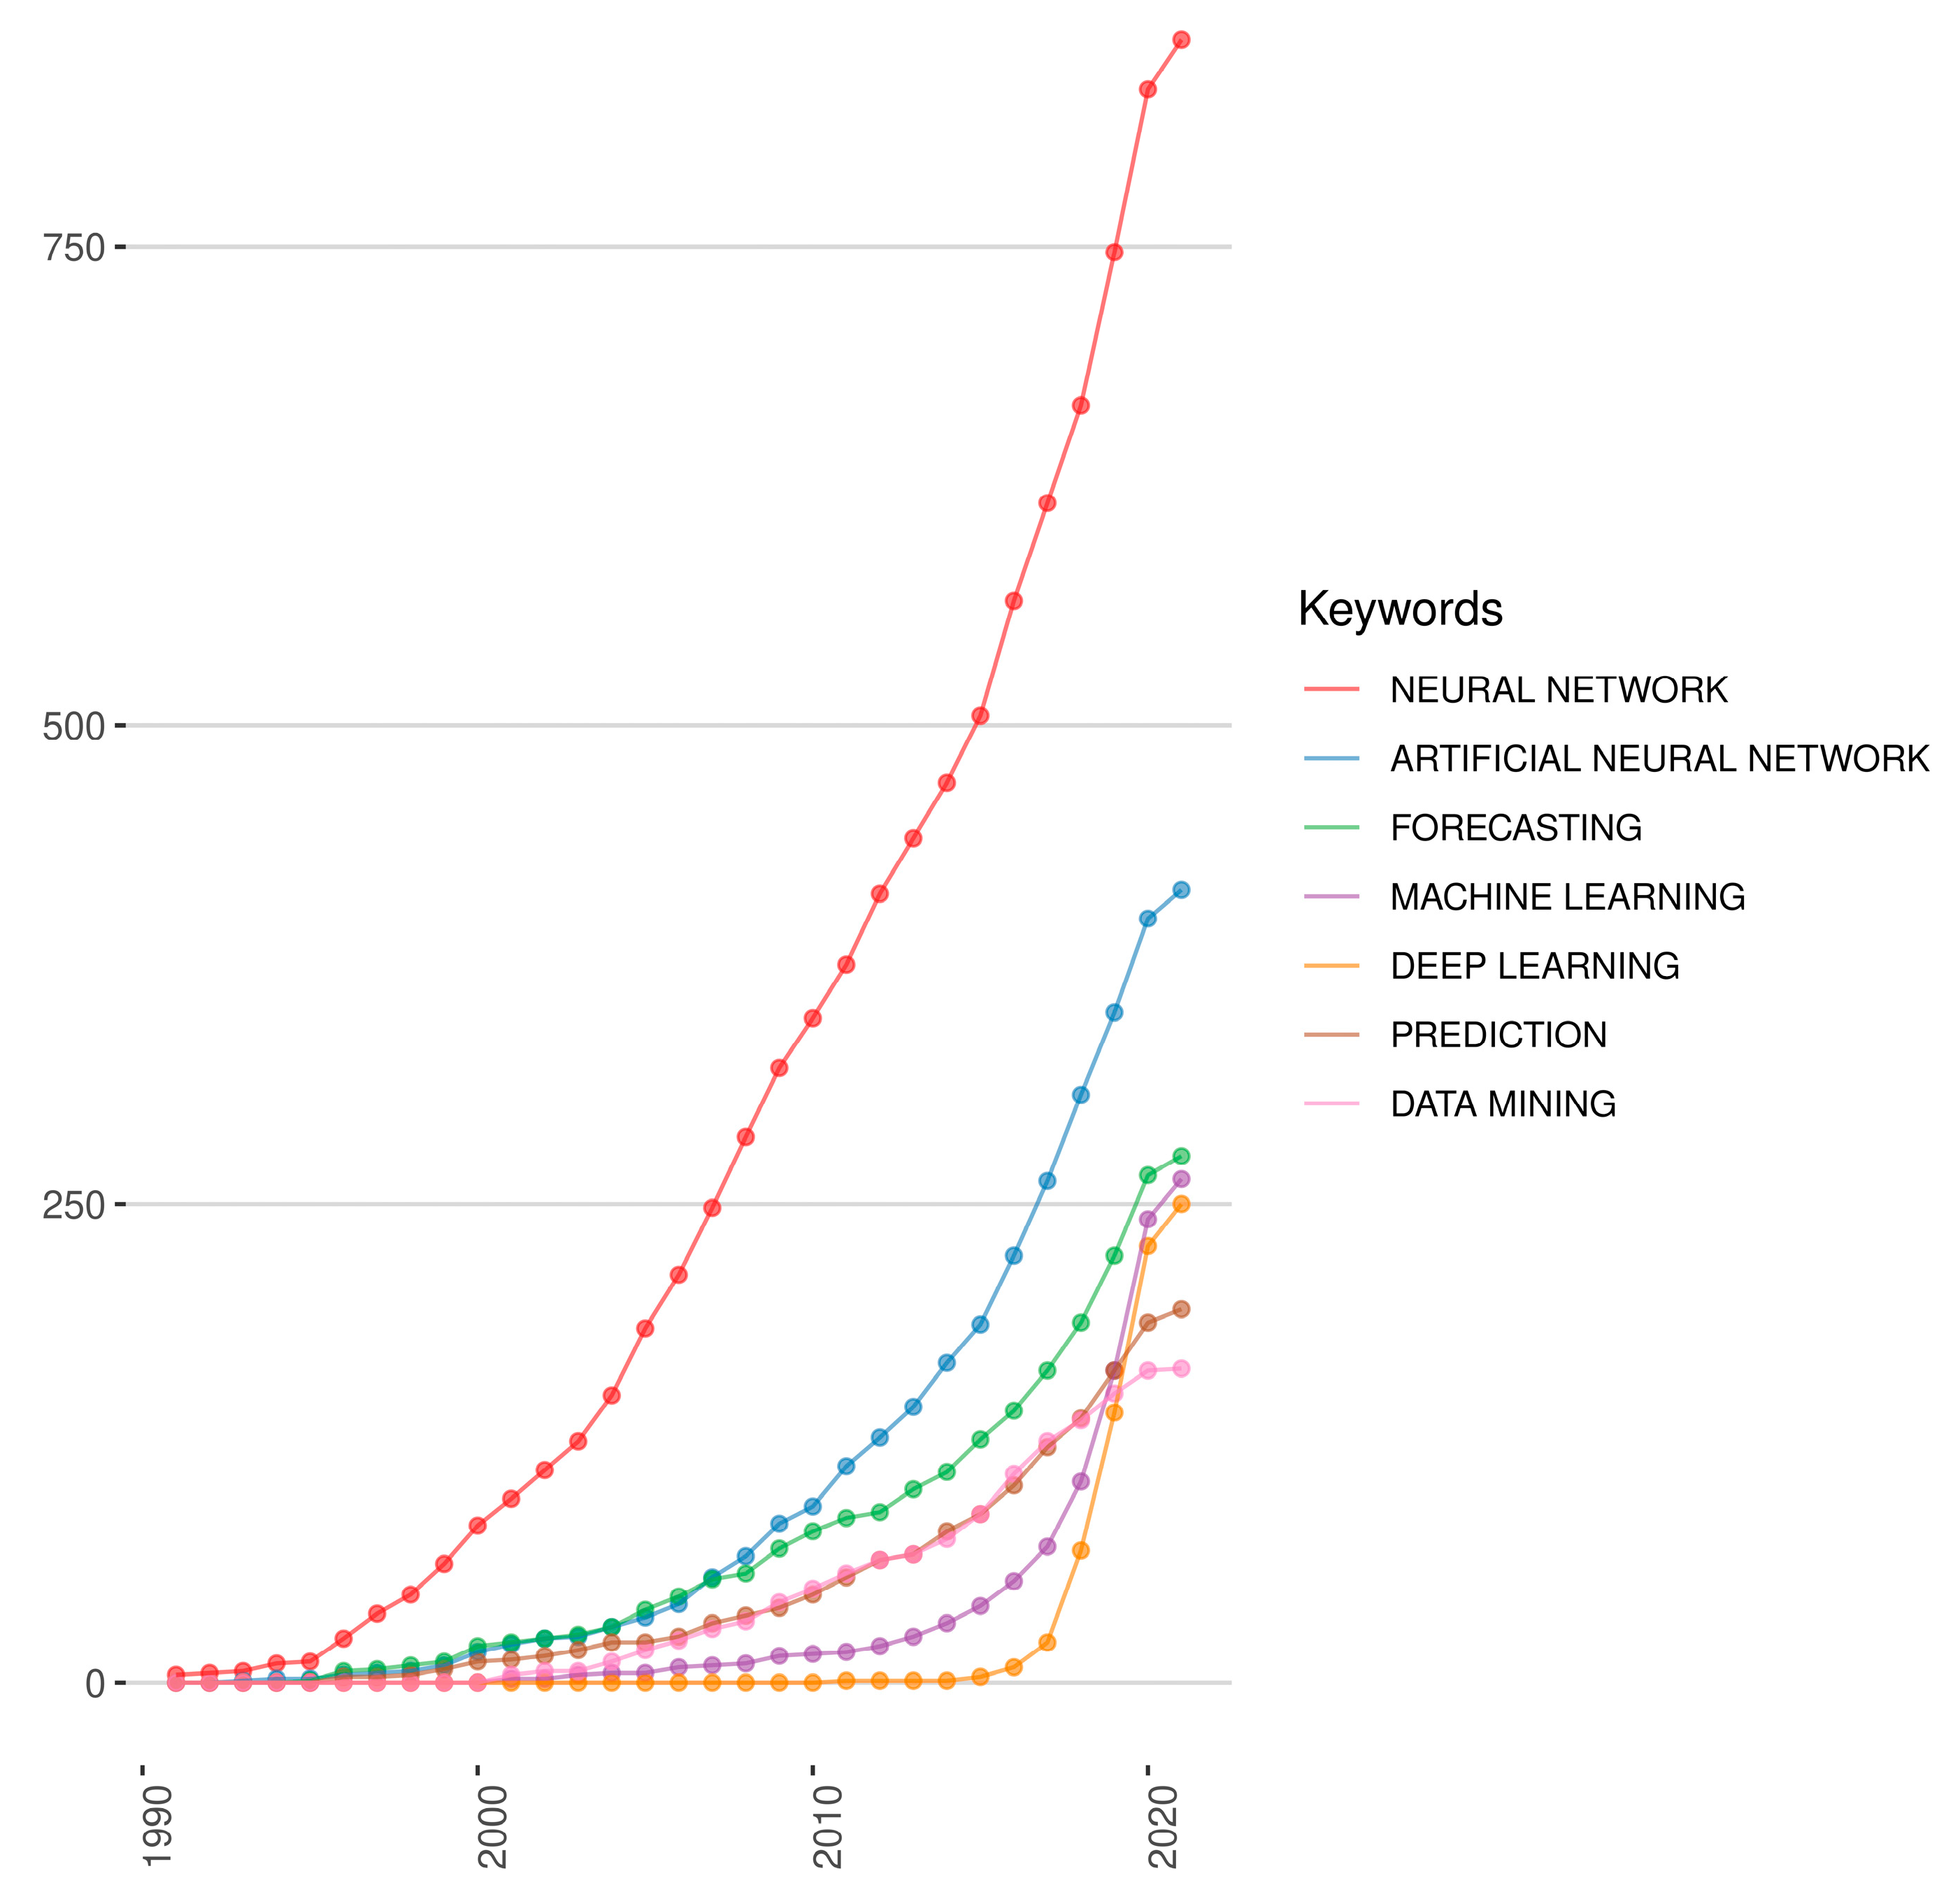
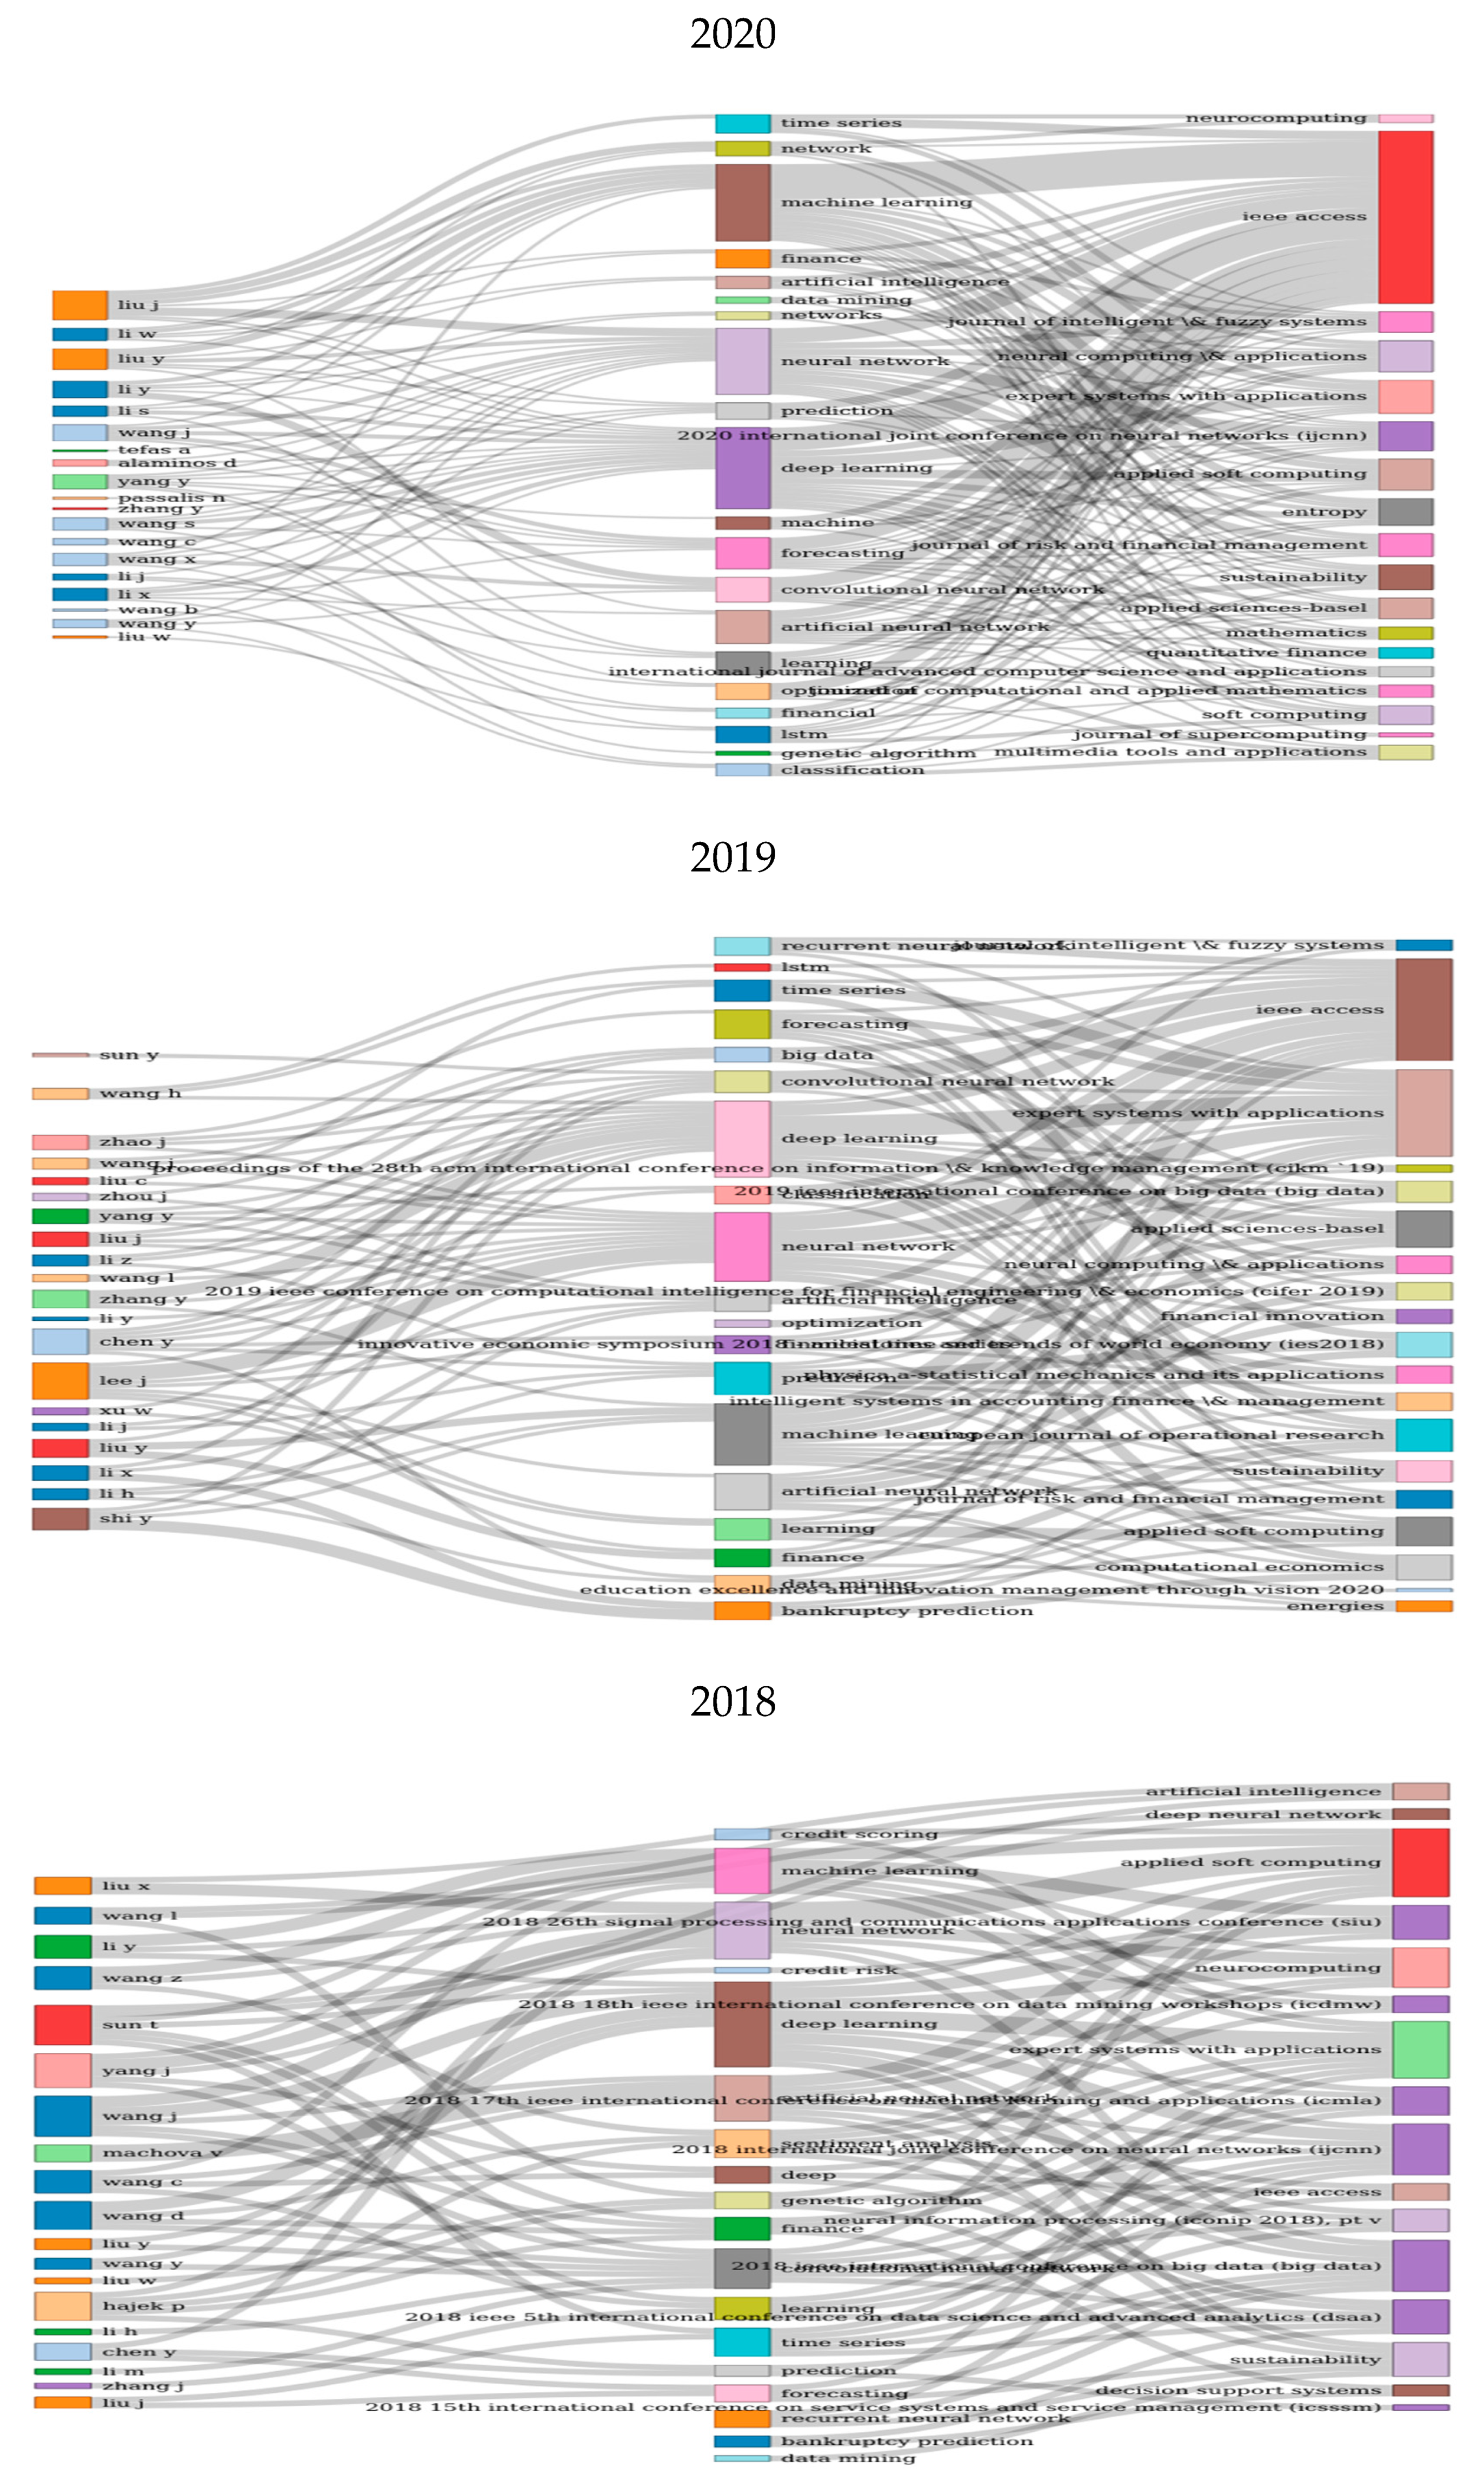
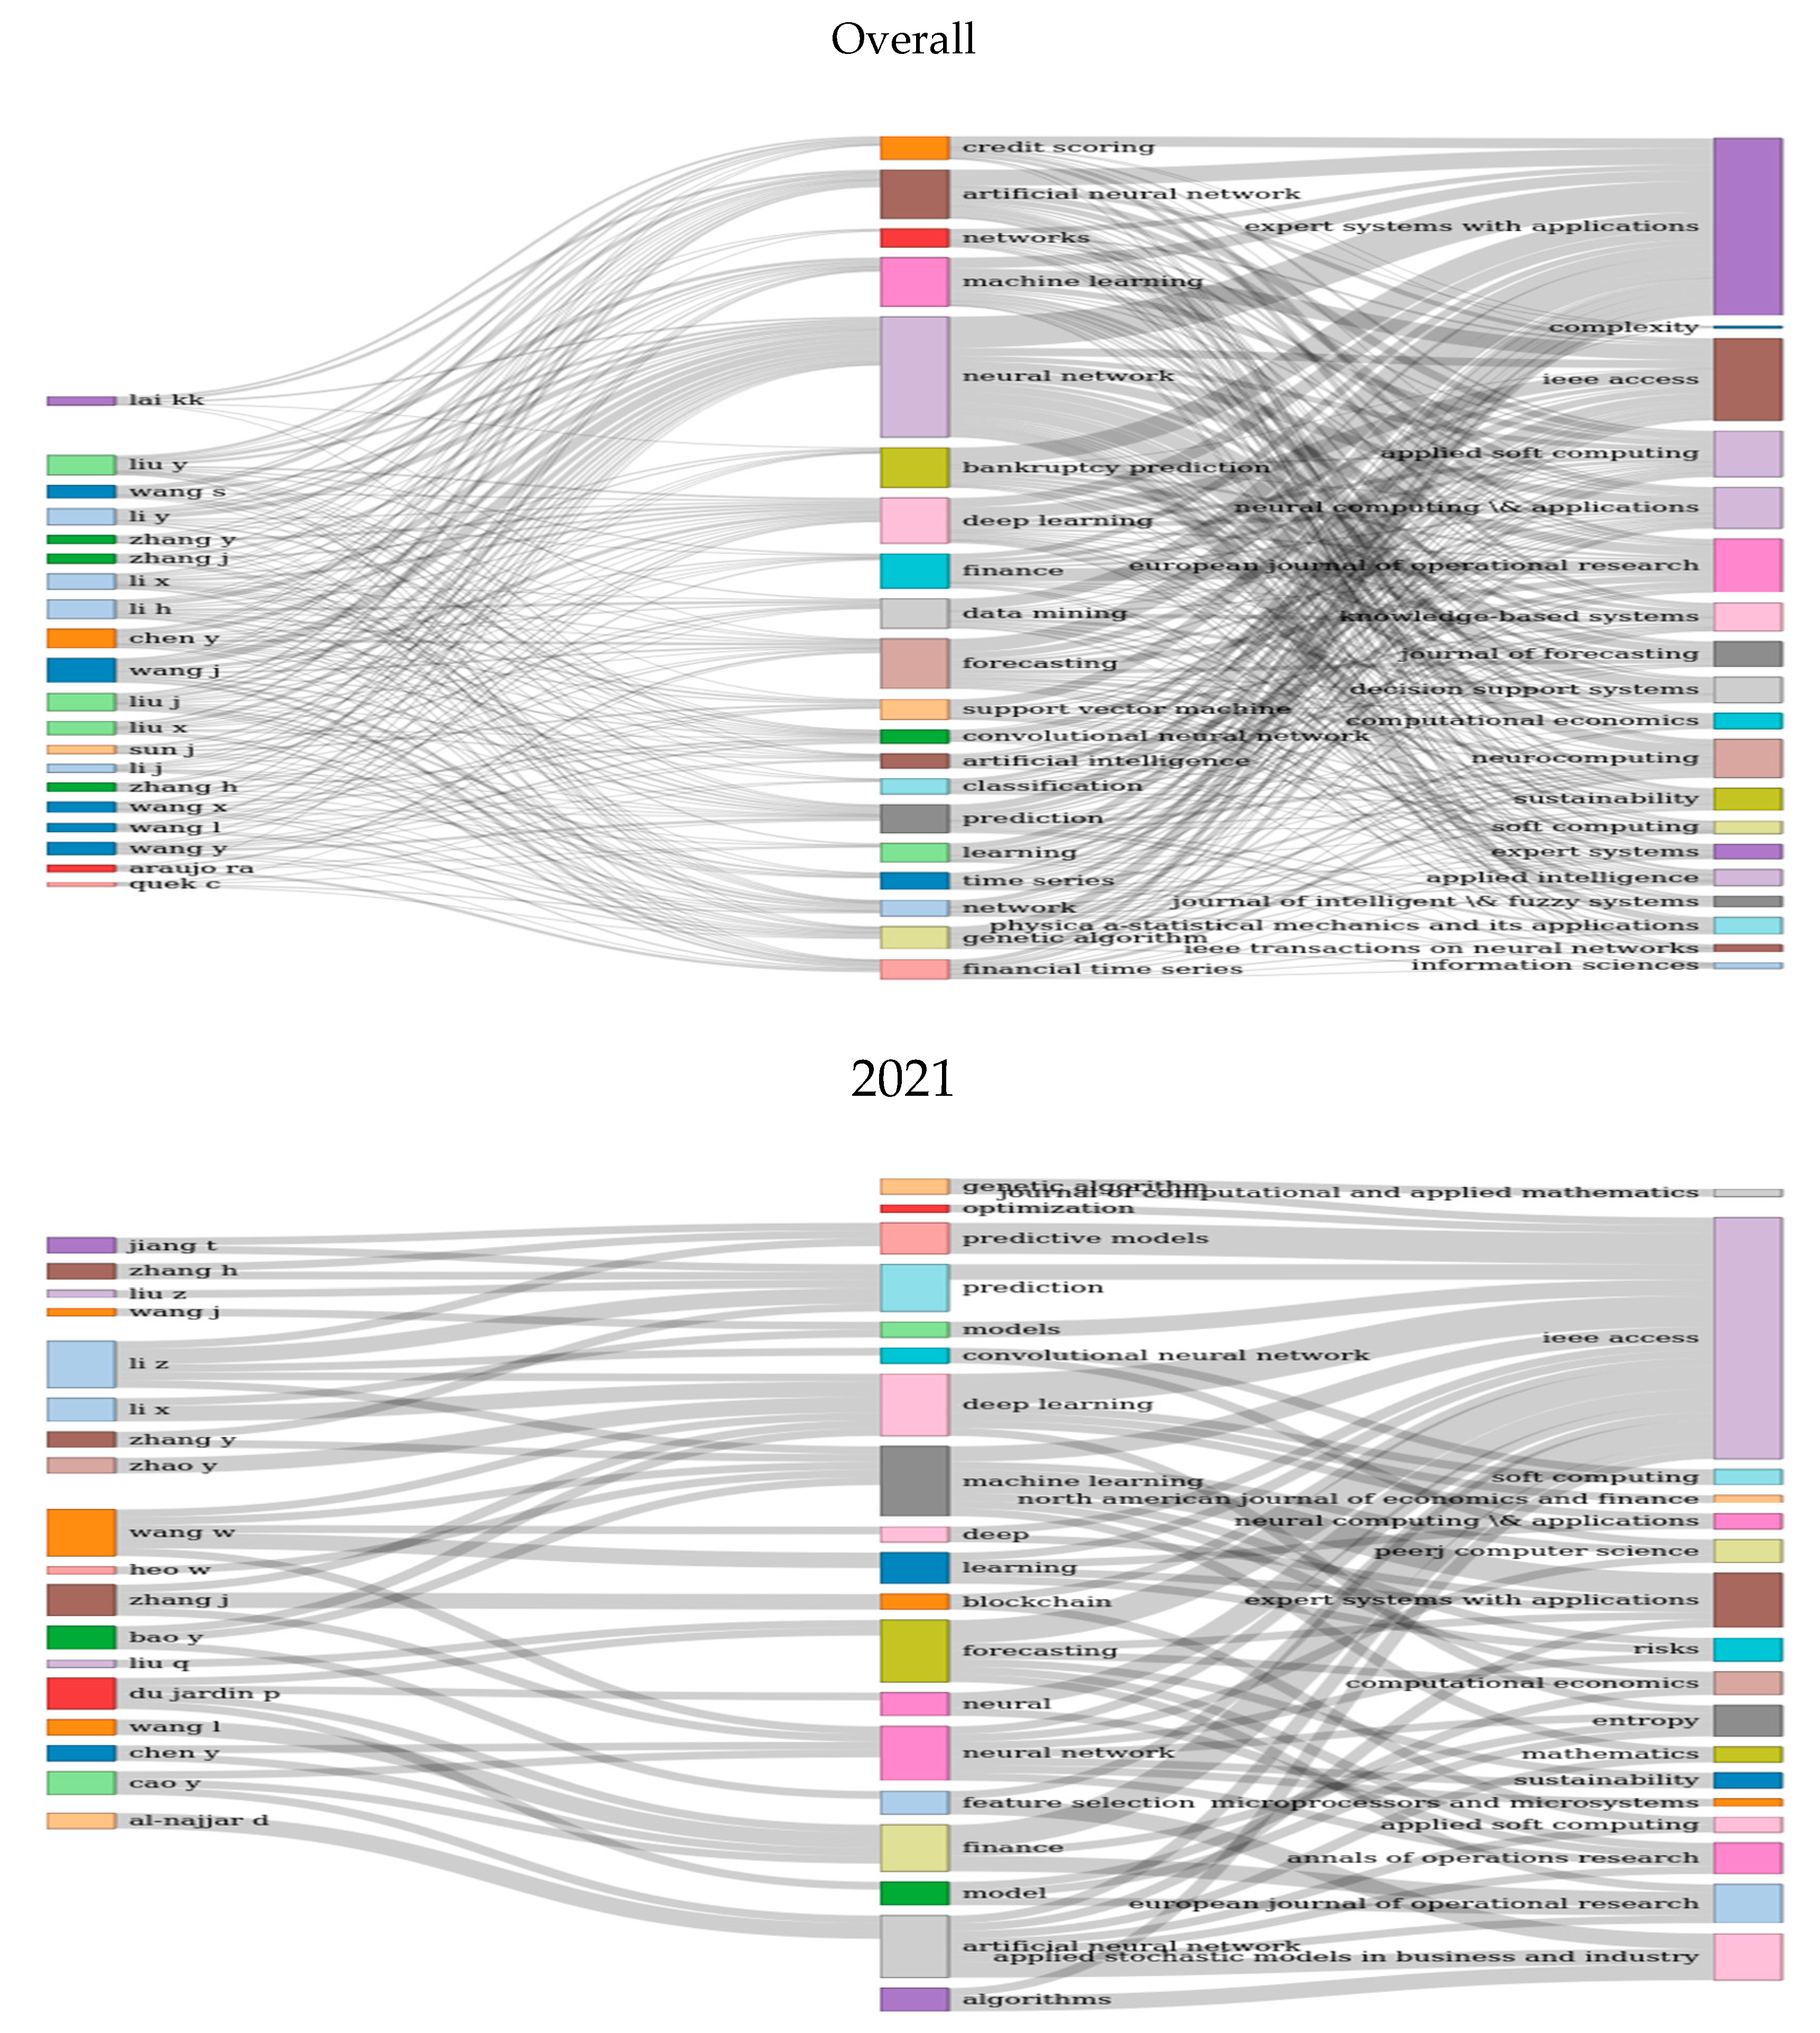
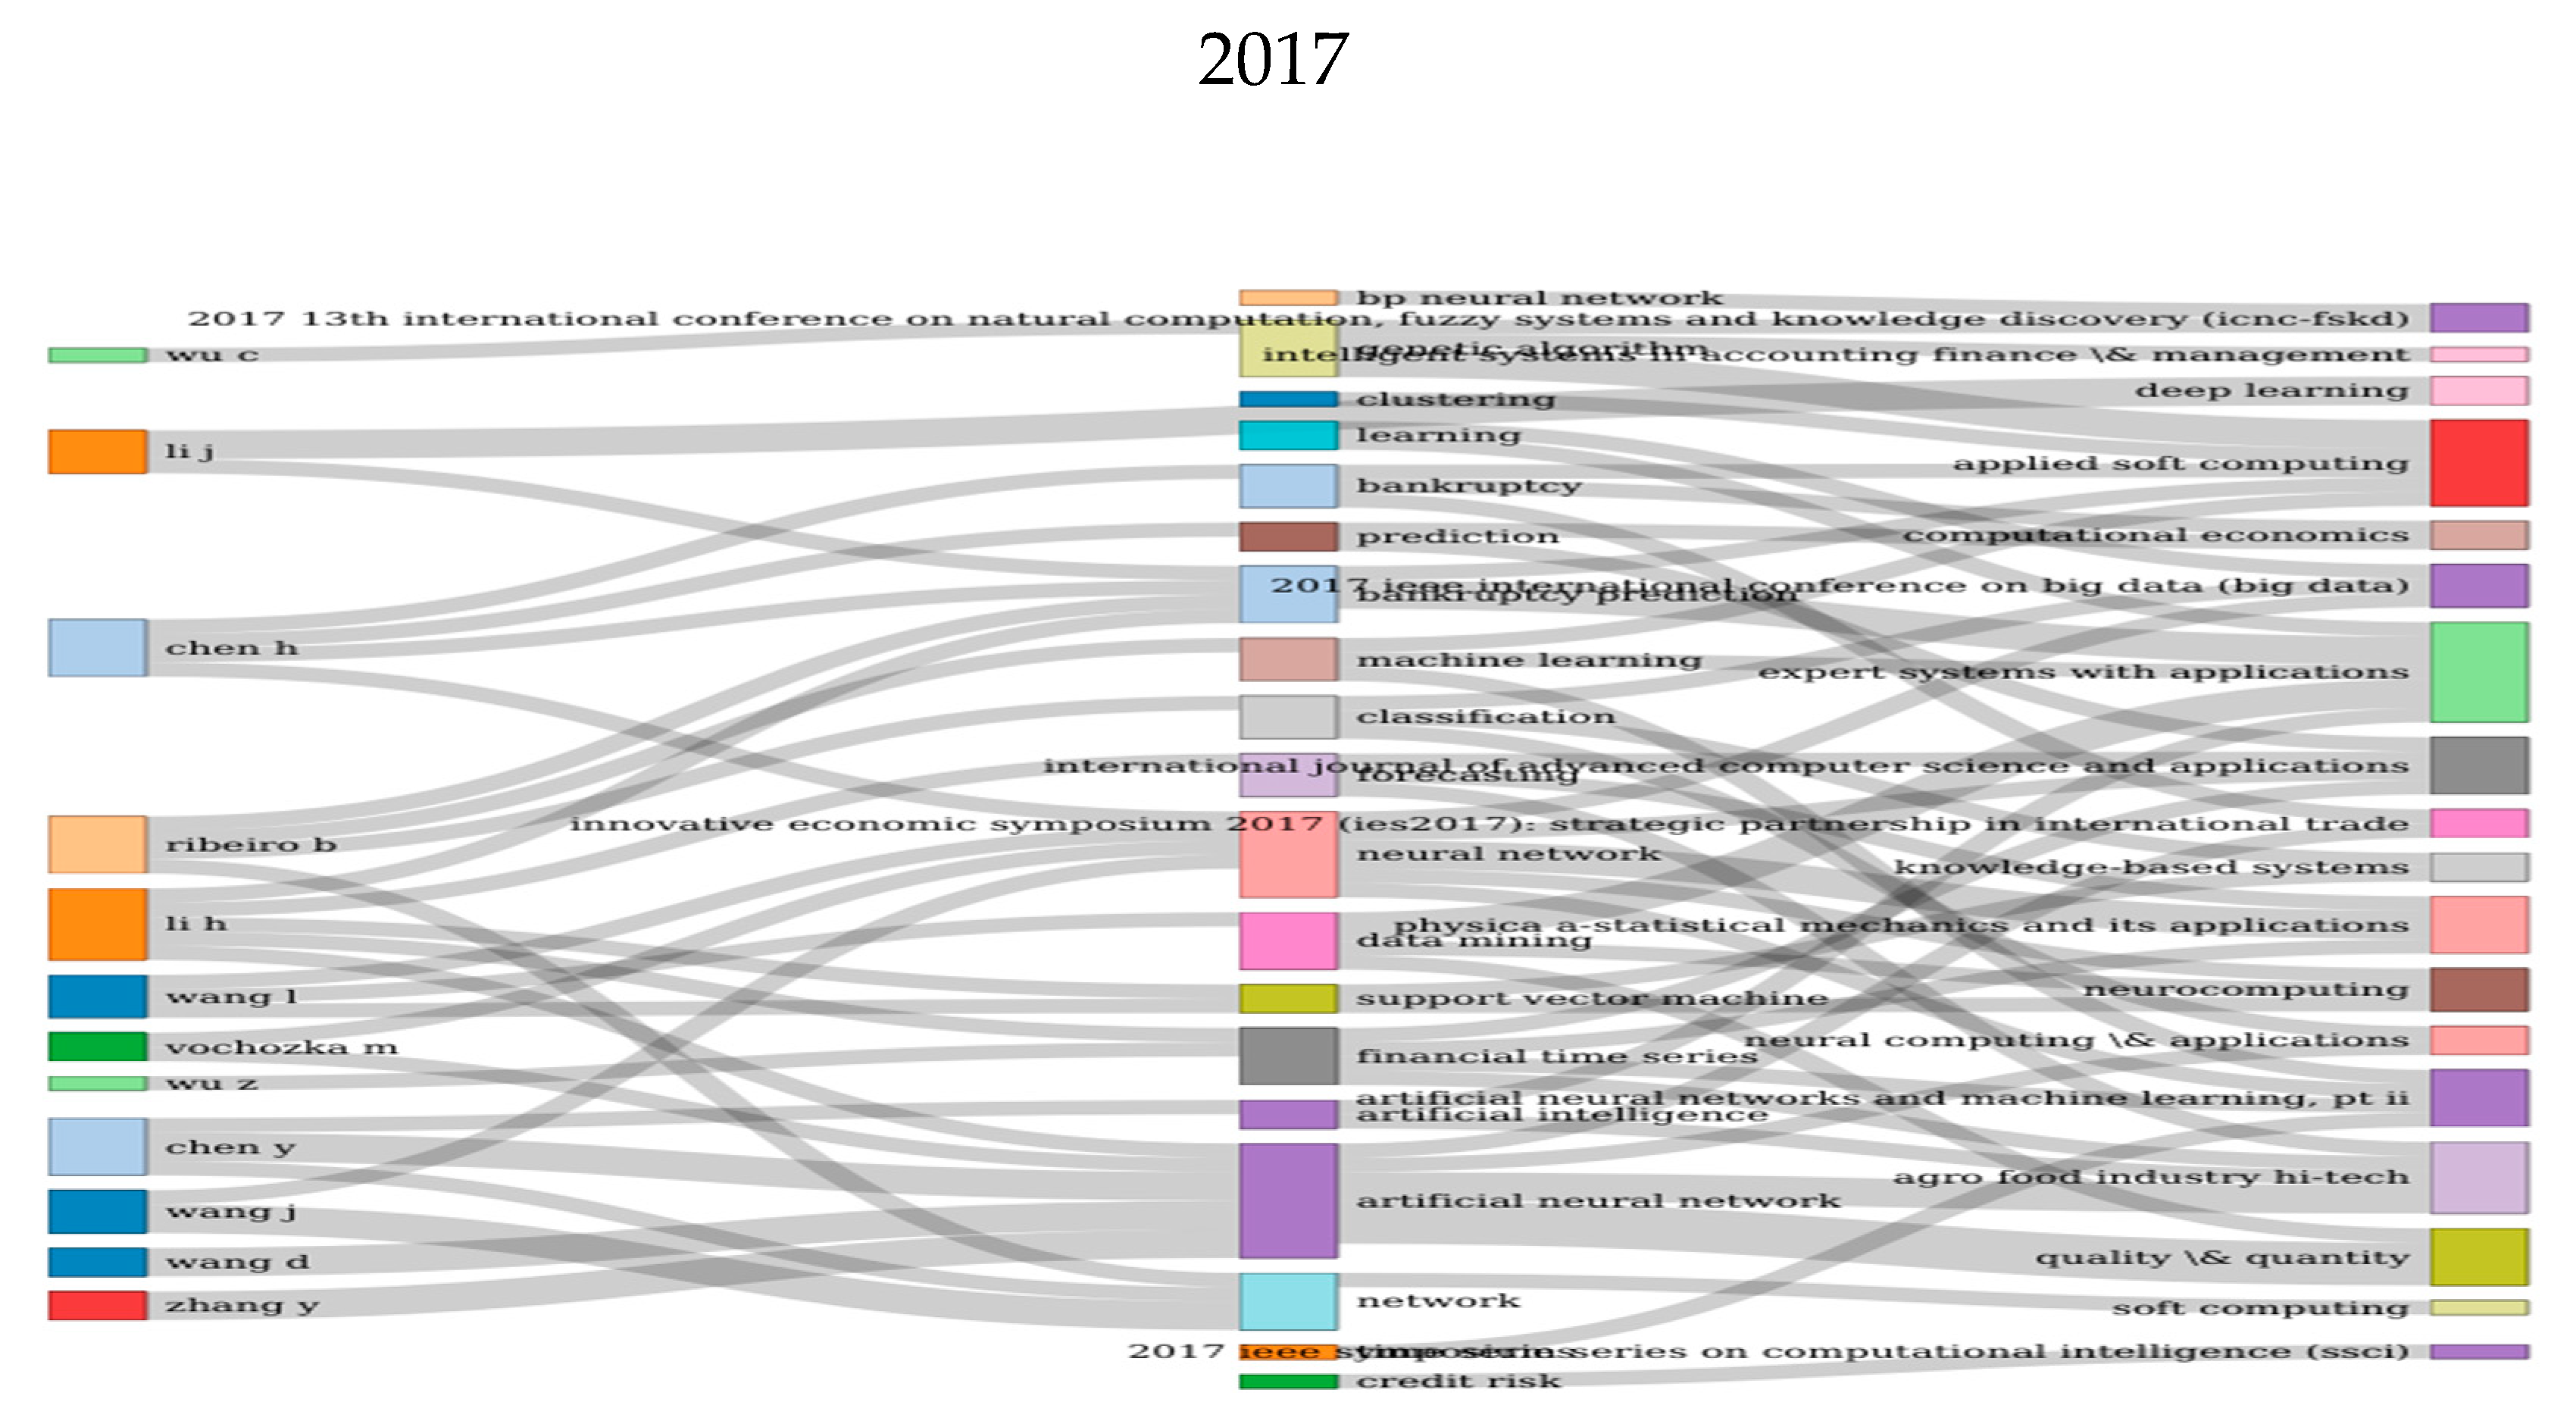
3.1. Keywords Analyses
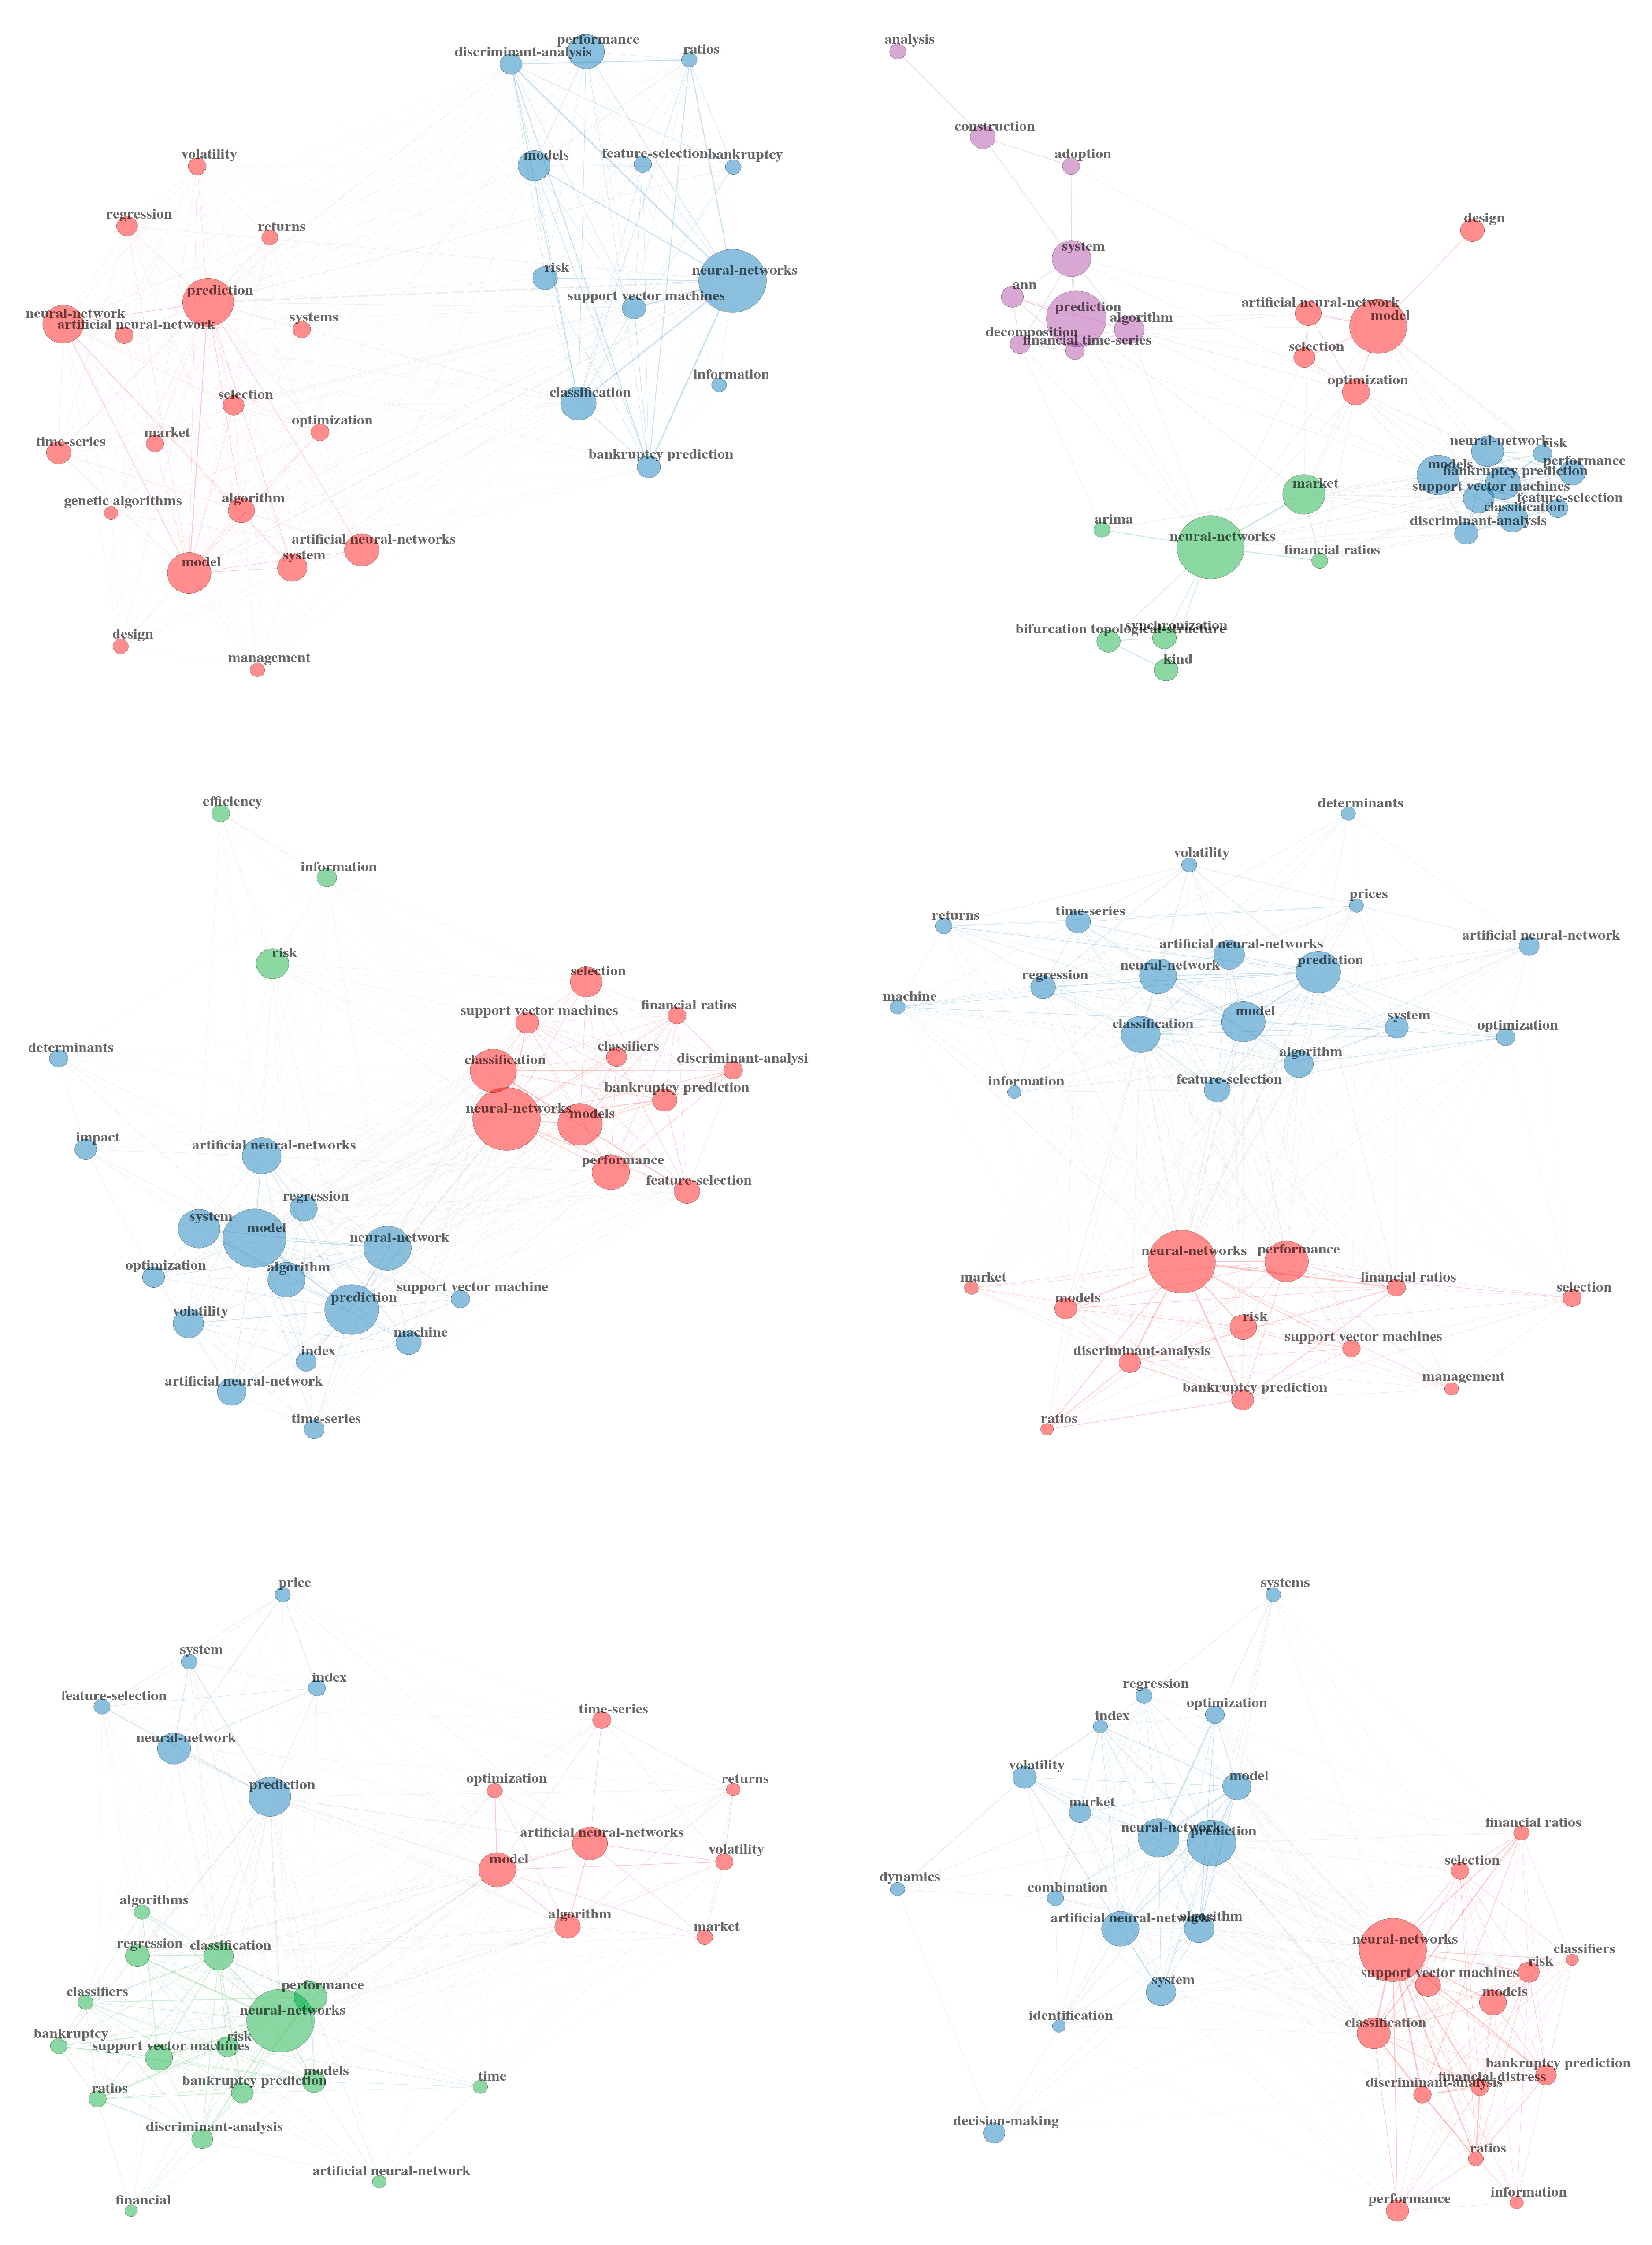
3.2. Keywords Co-Occurrences Network Analyses
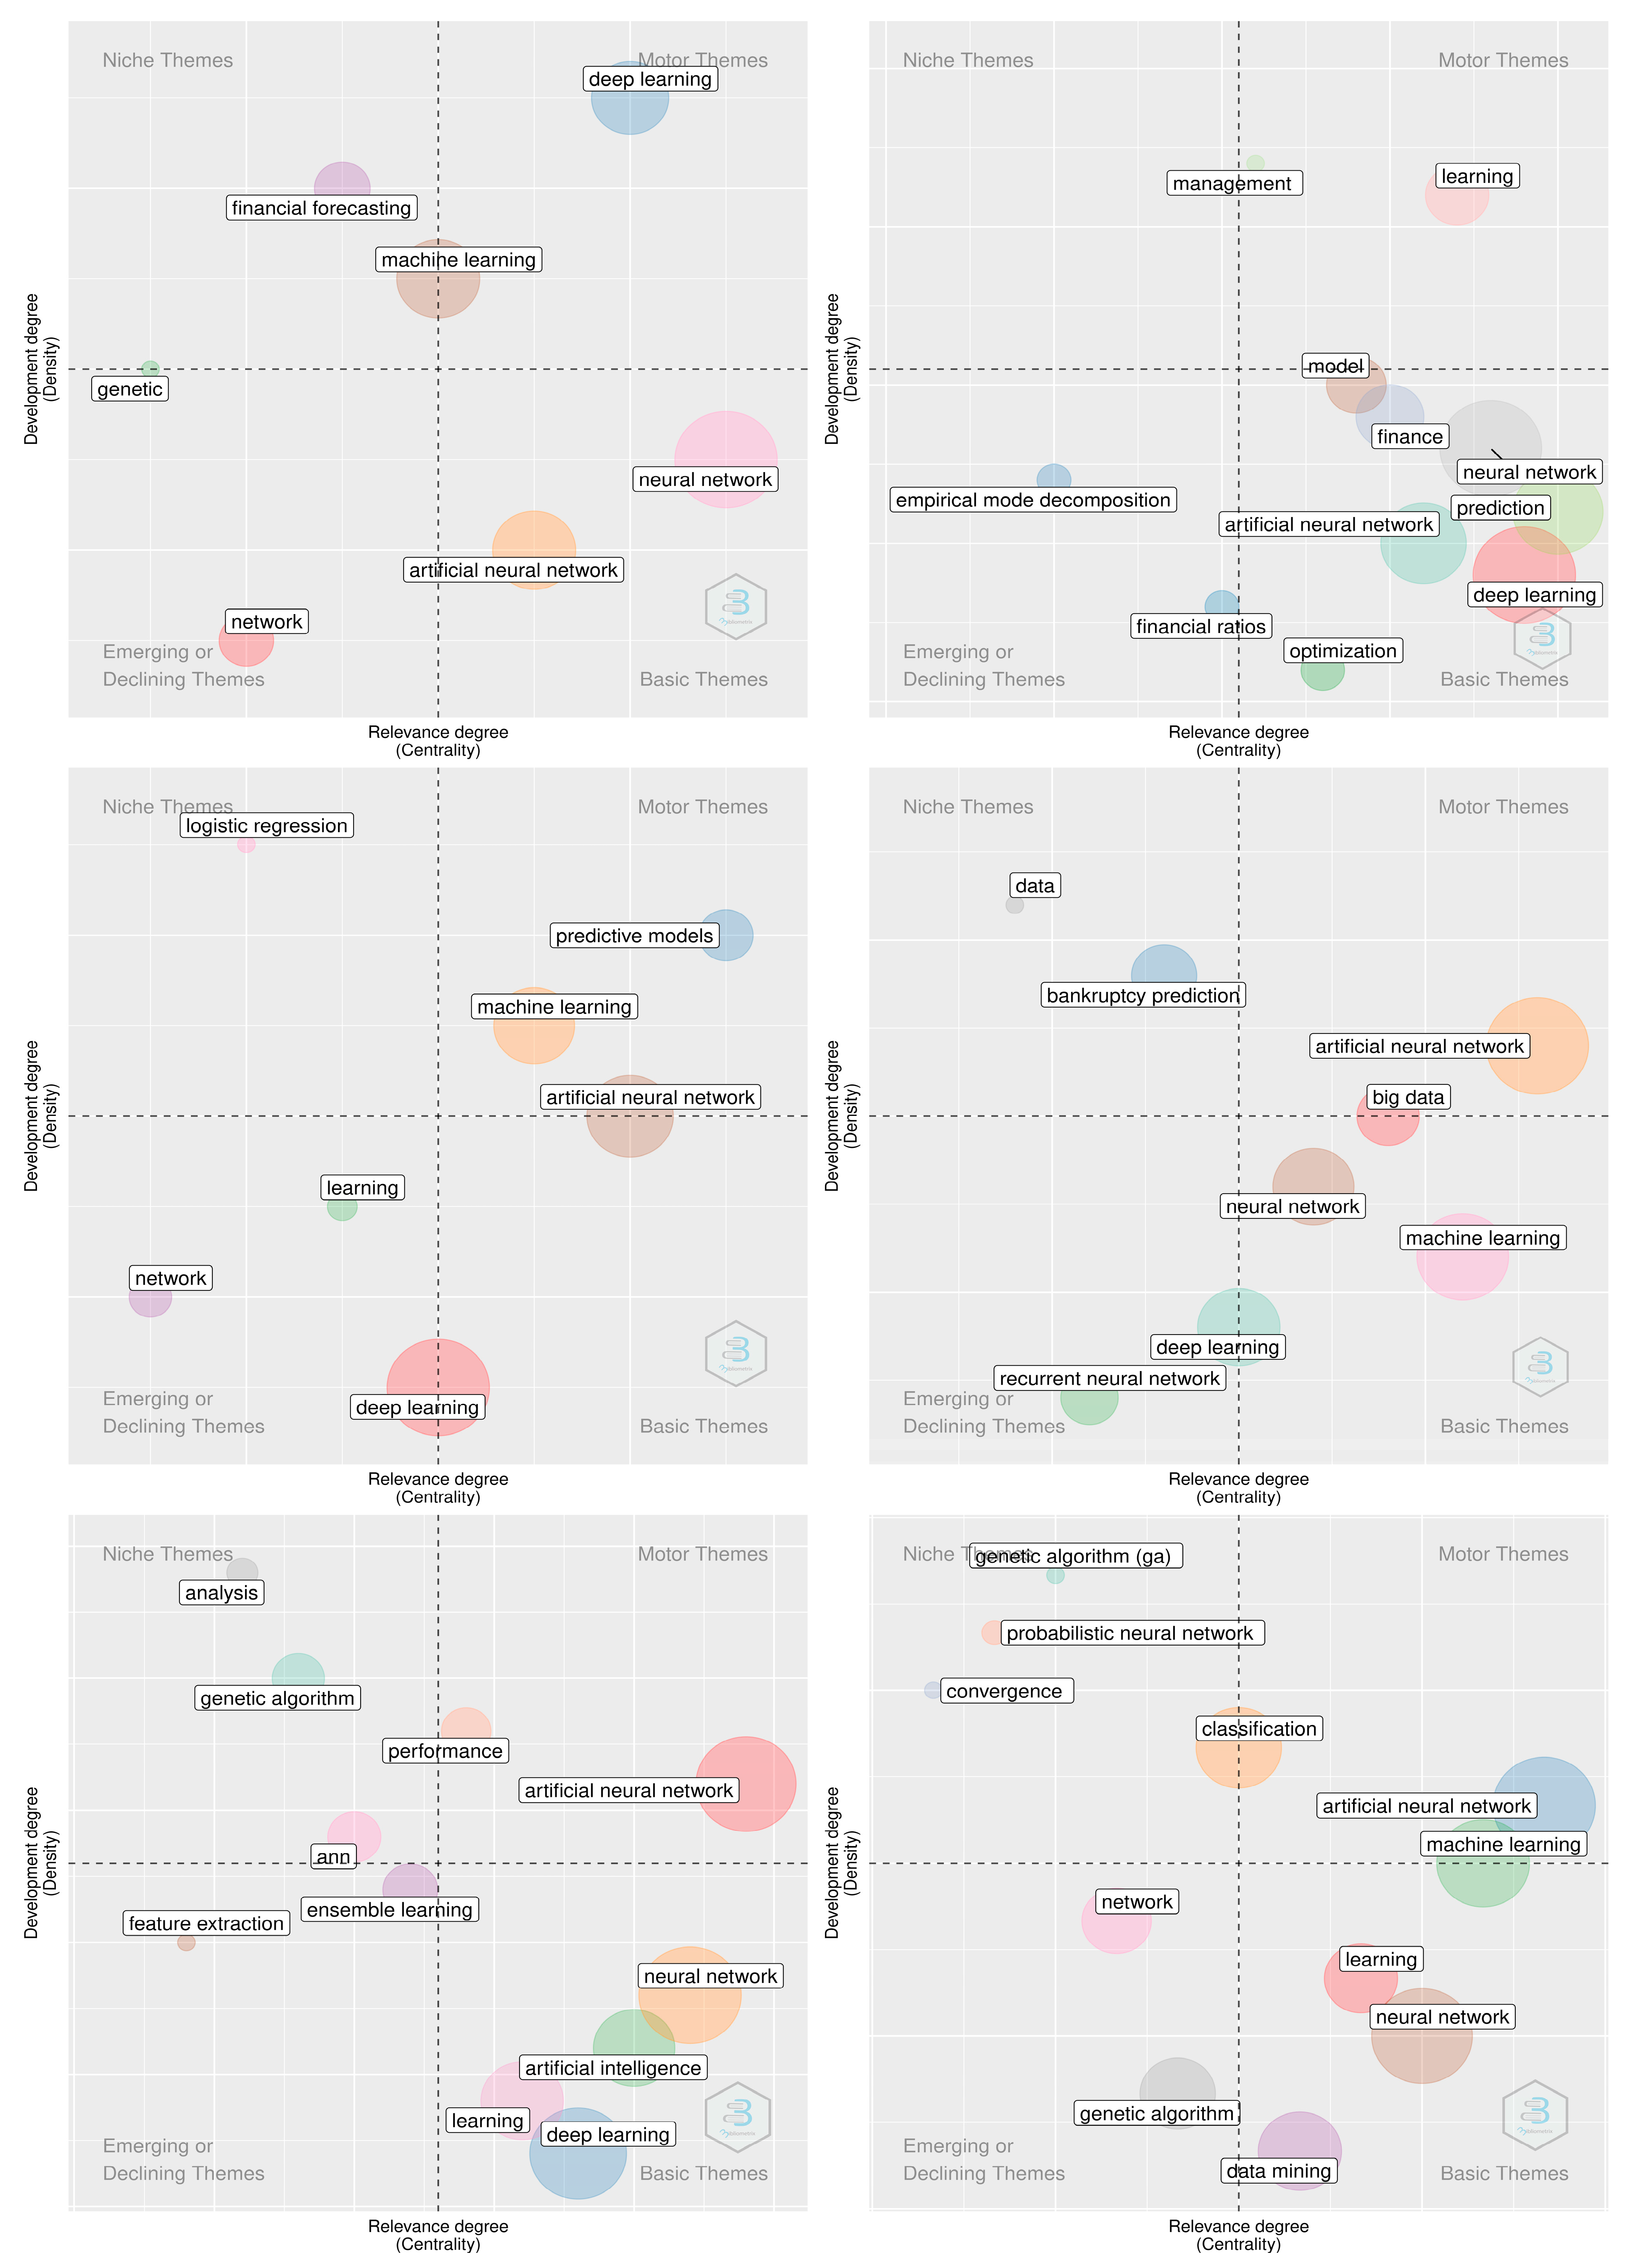
3.3. Topic Modeling-Based Analyses
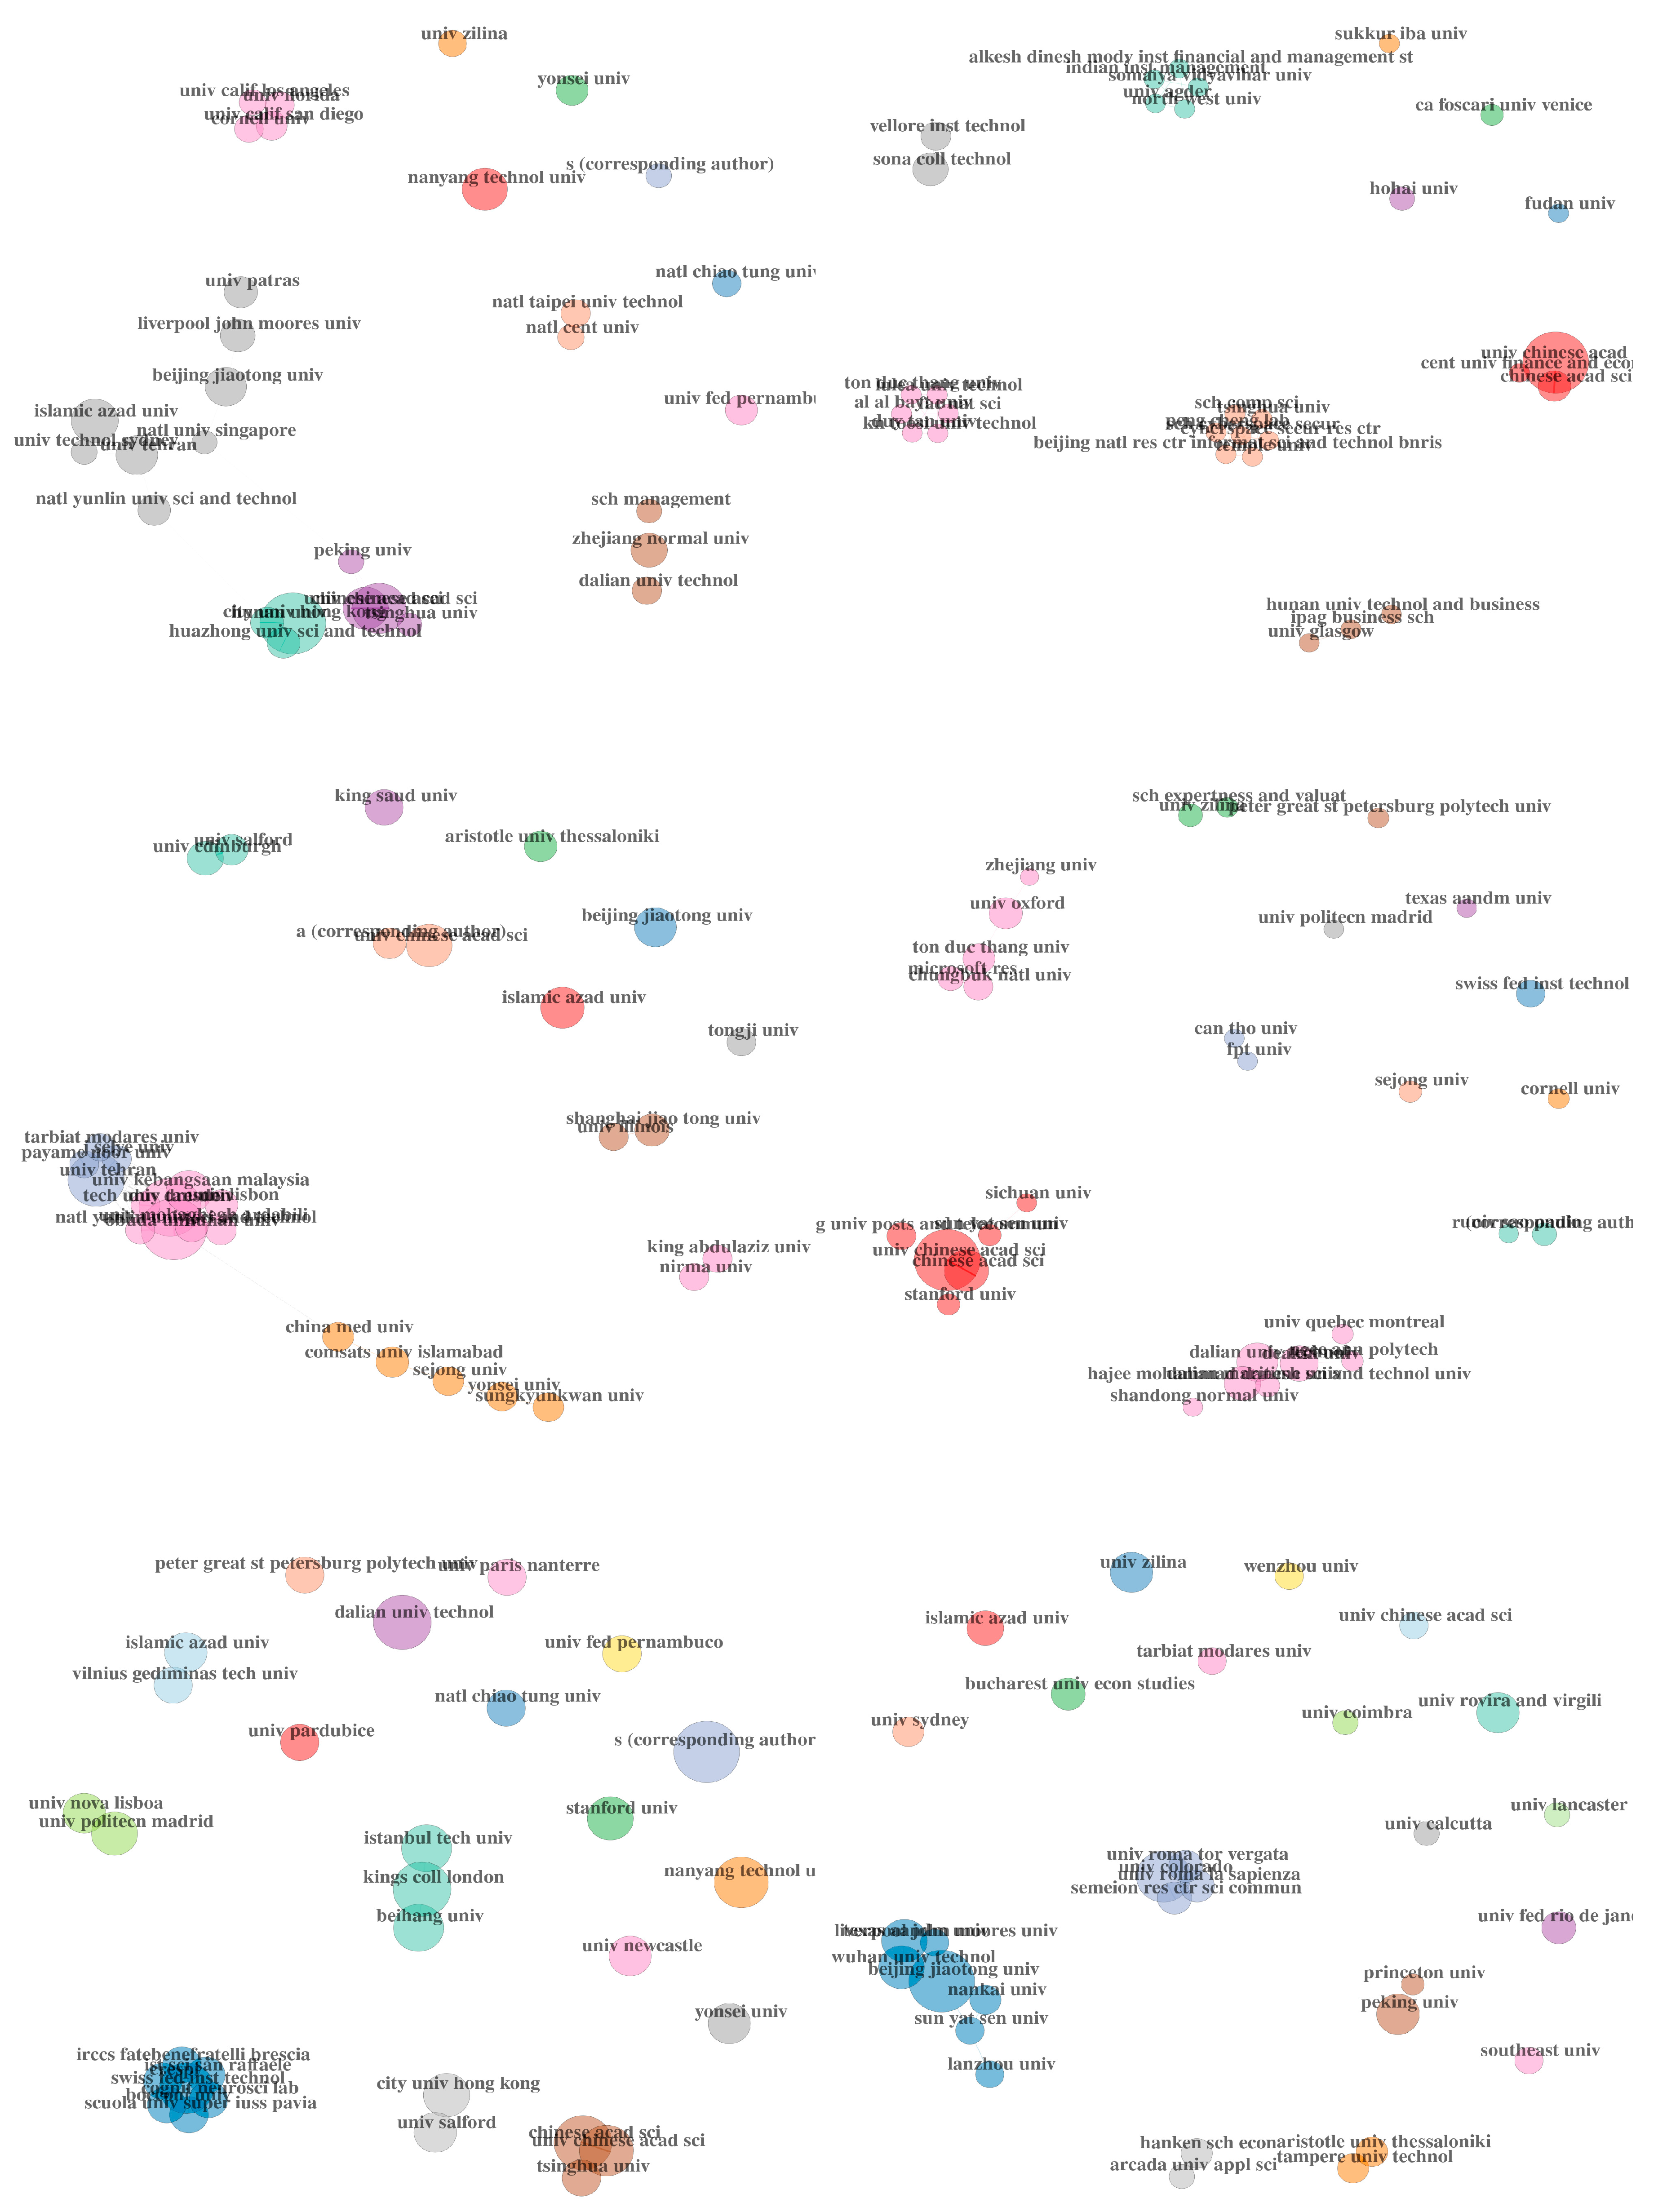
4. Intellectual Structures of Our Sample
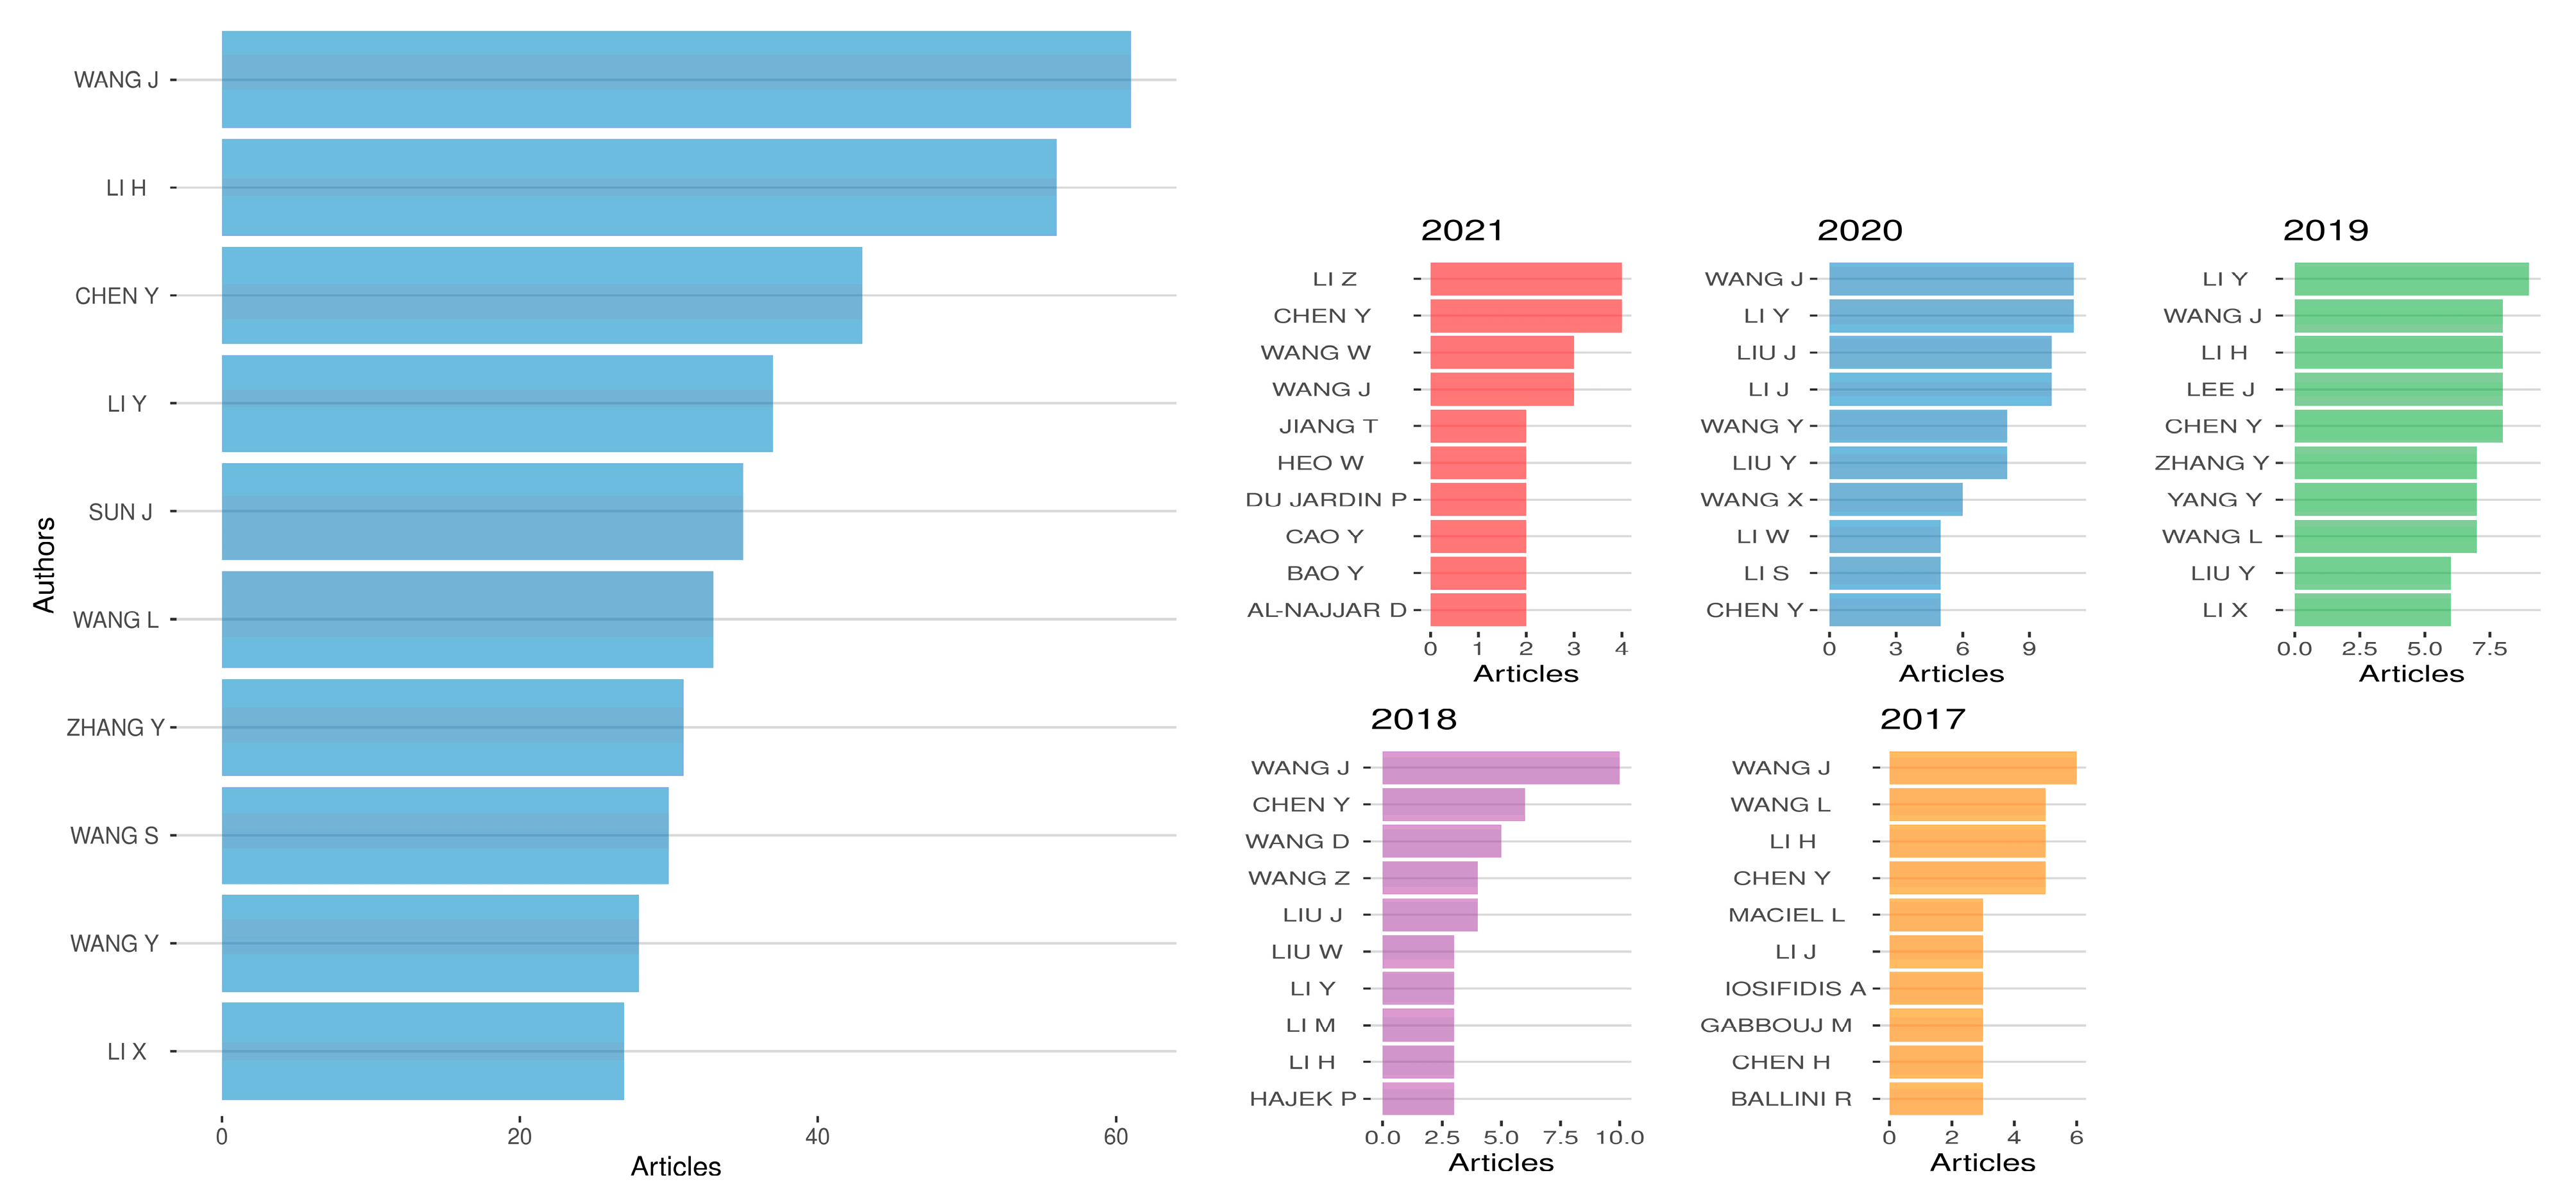
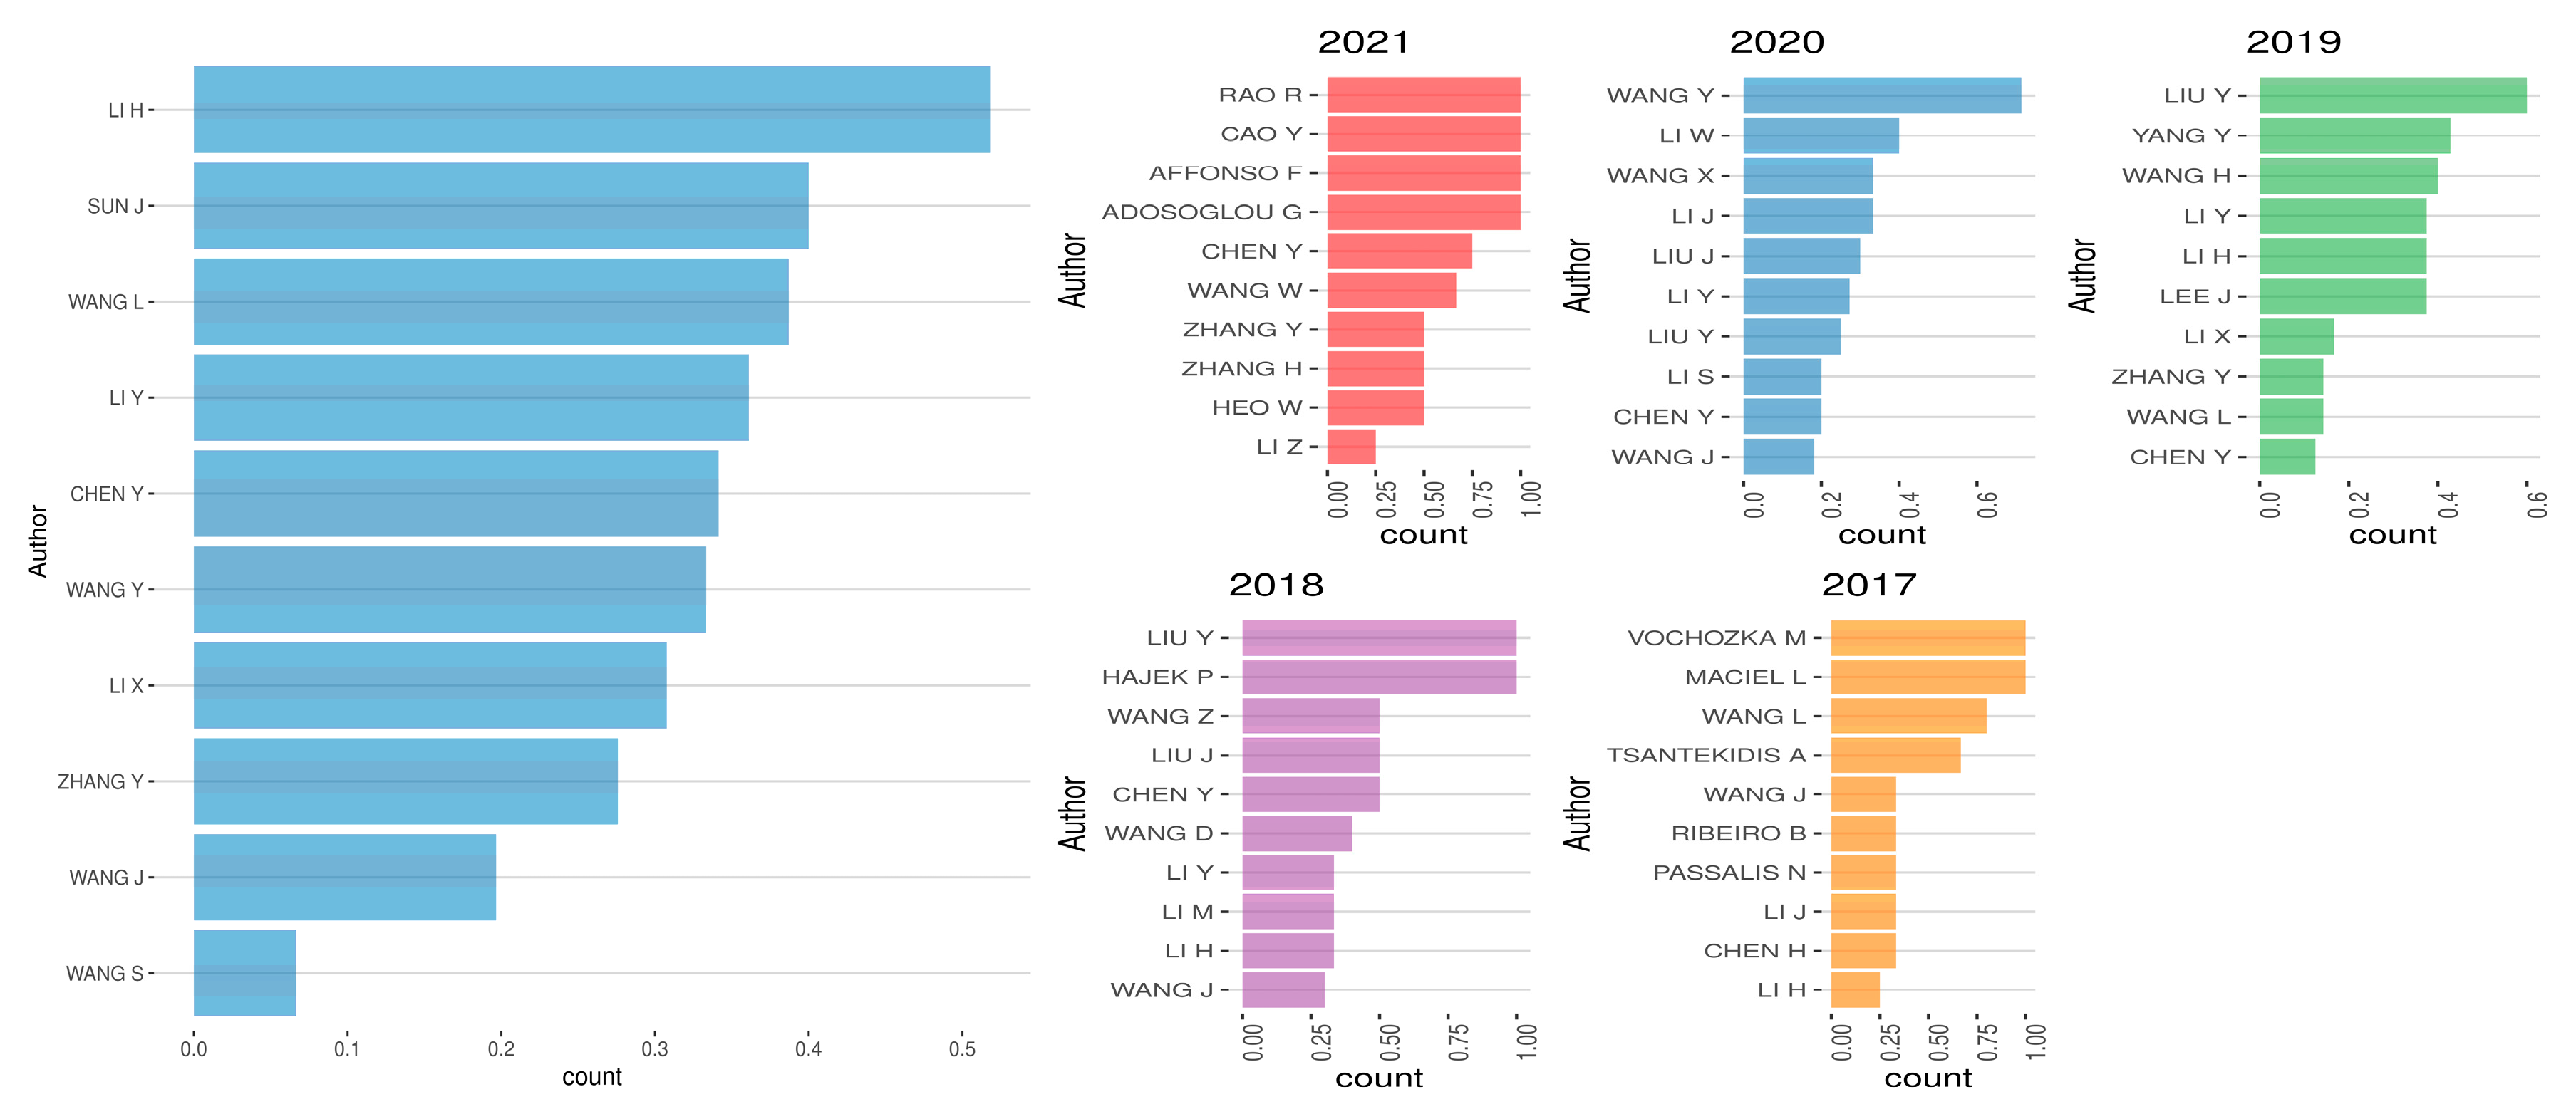
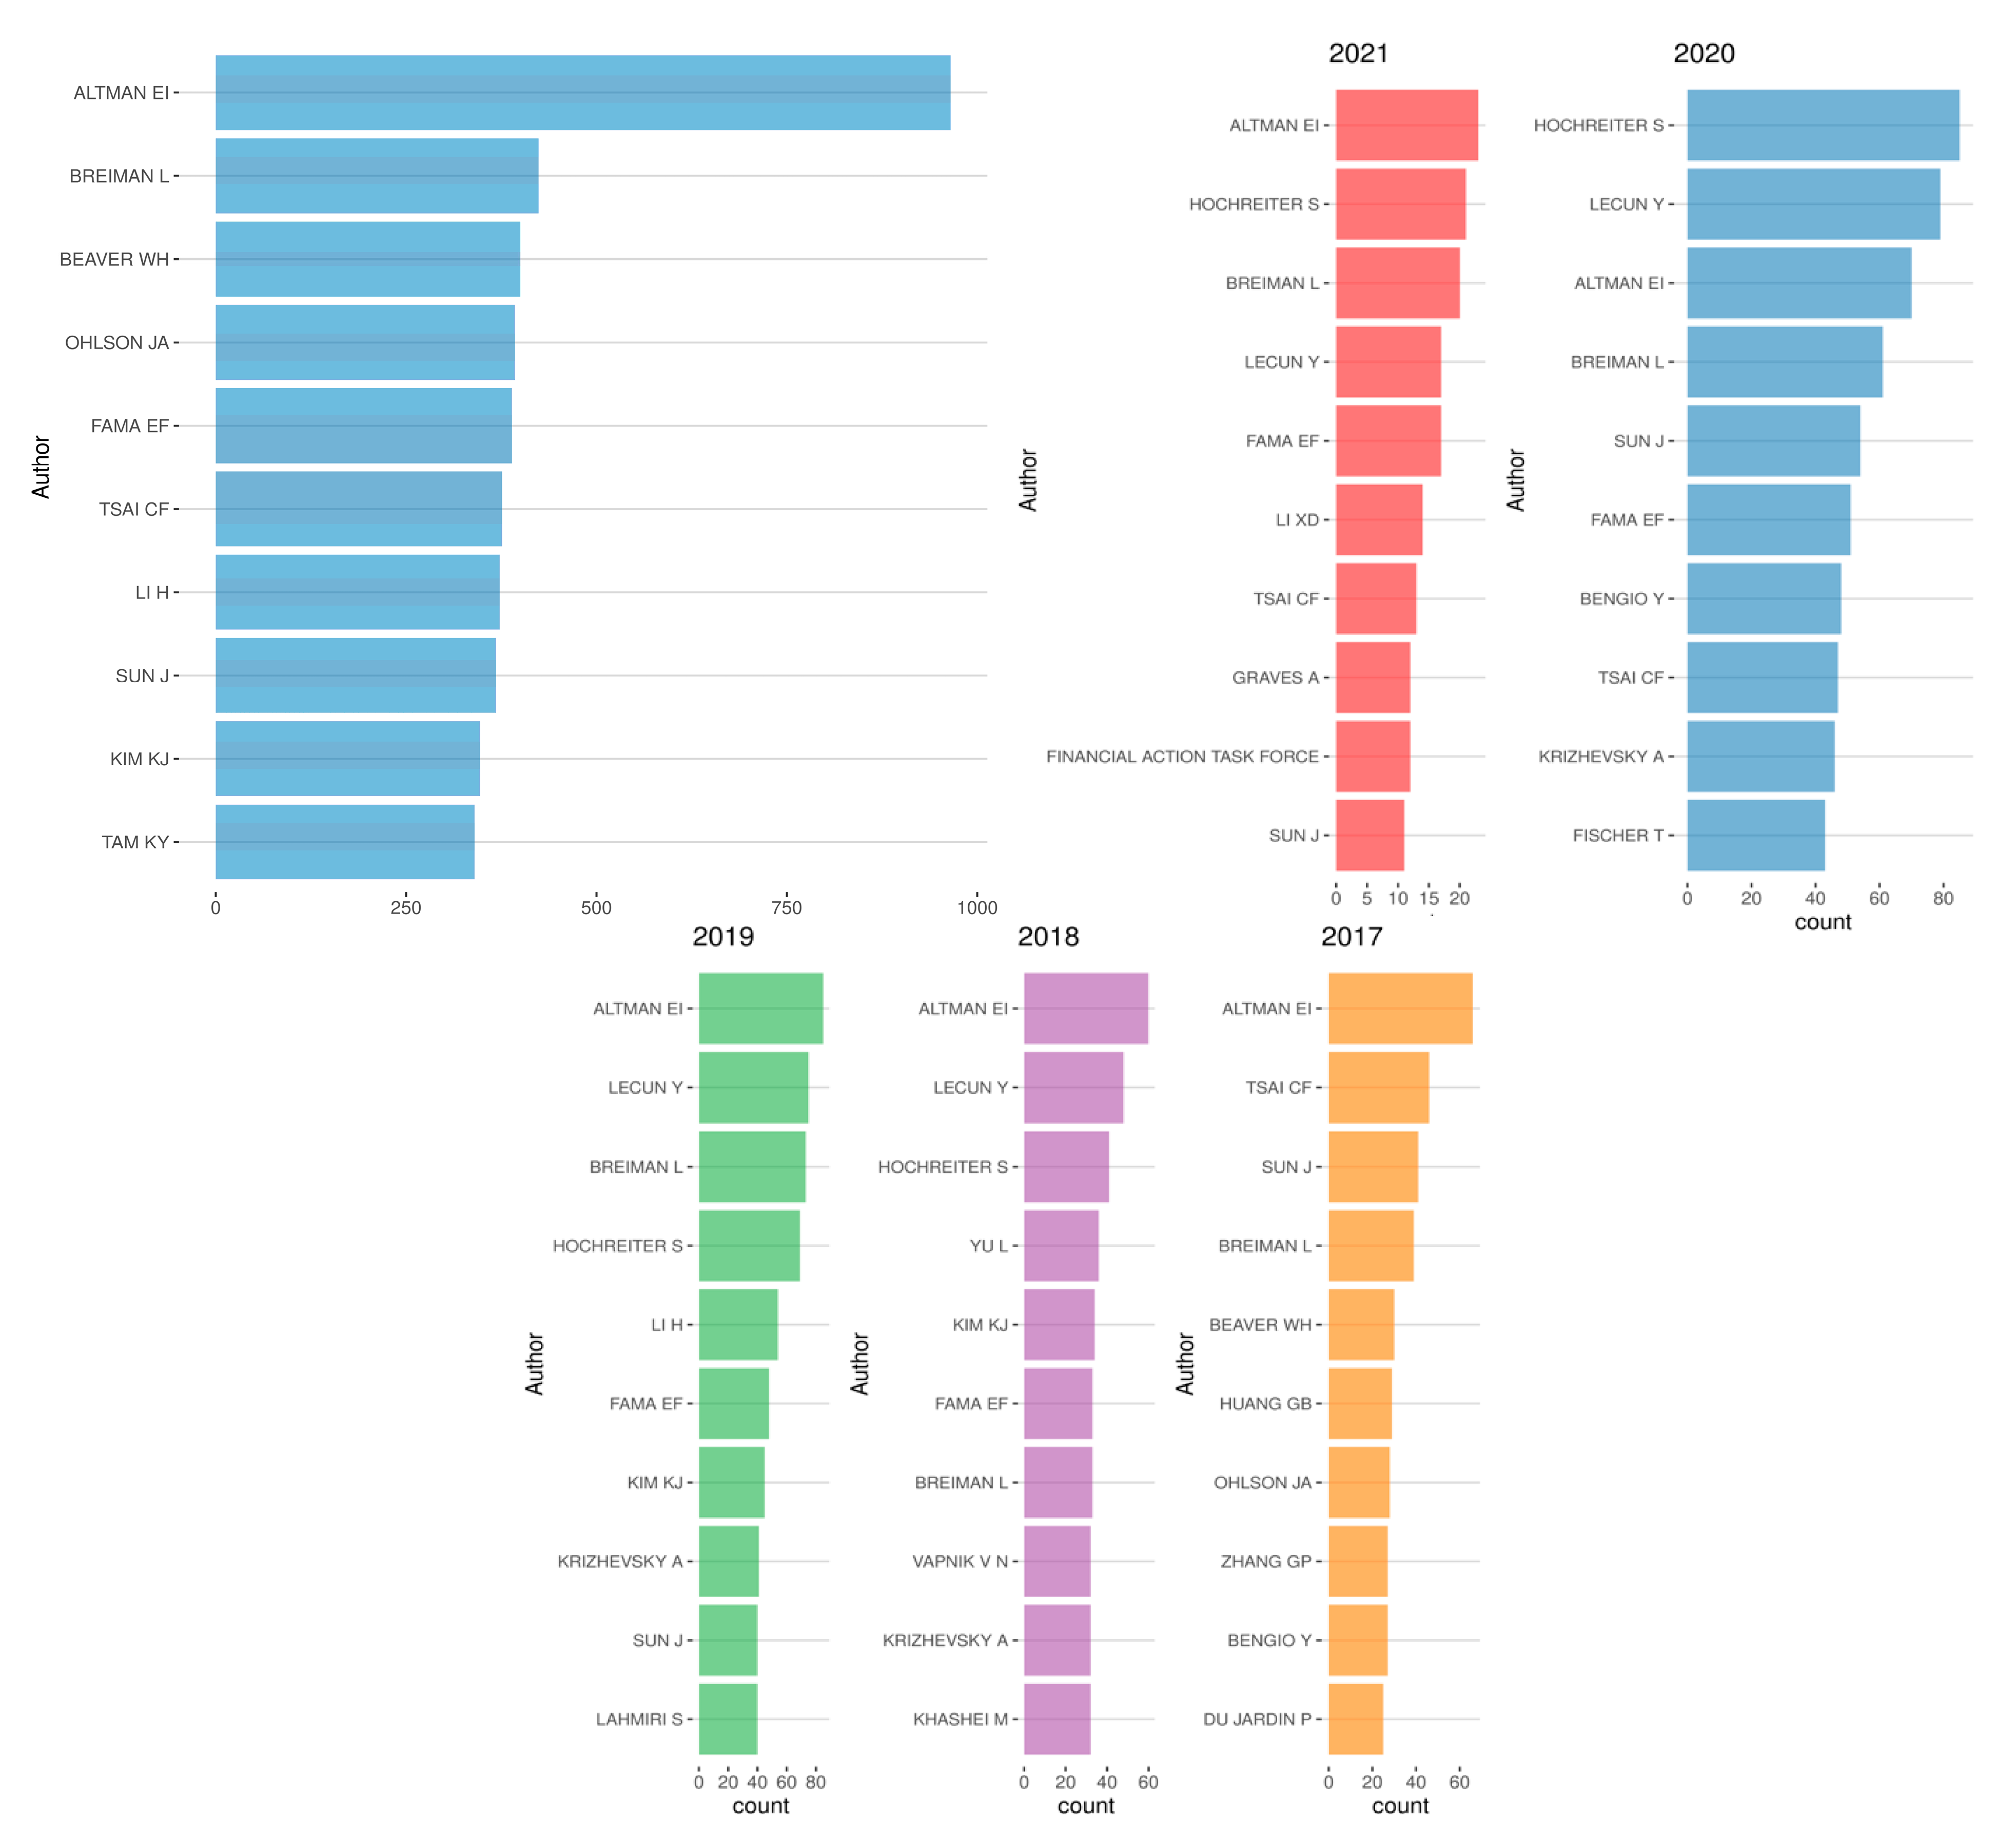
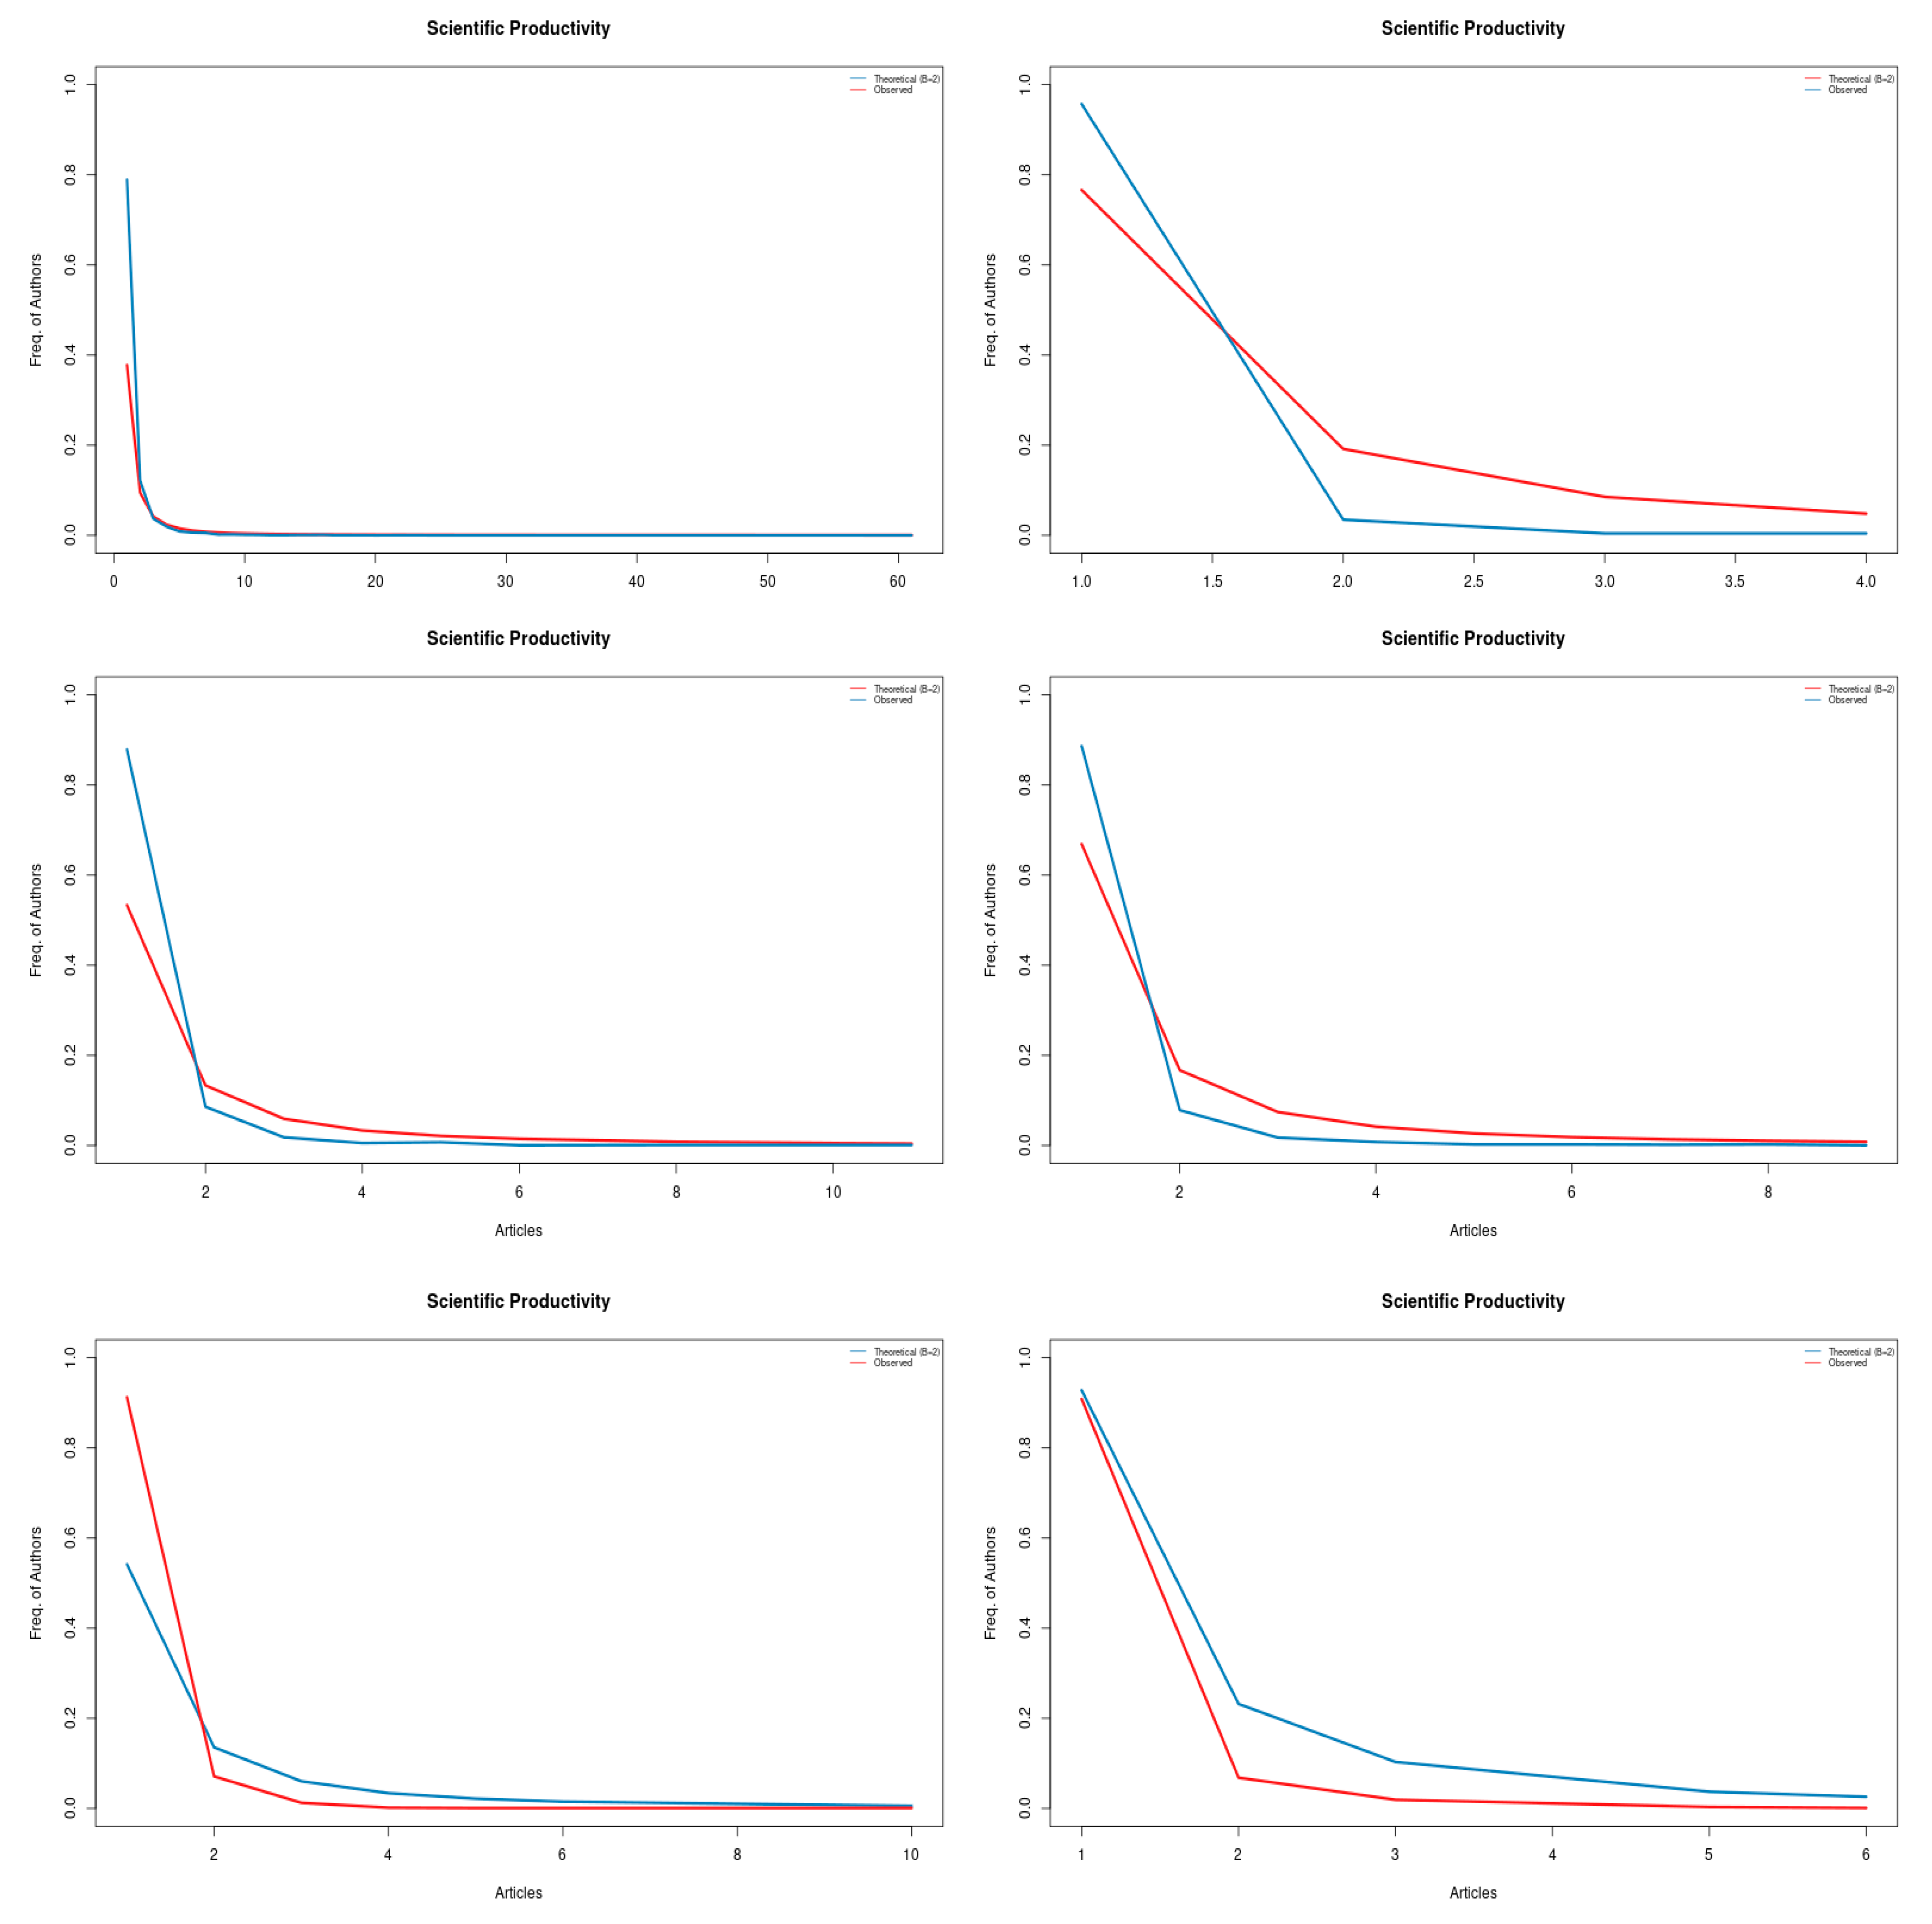
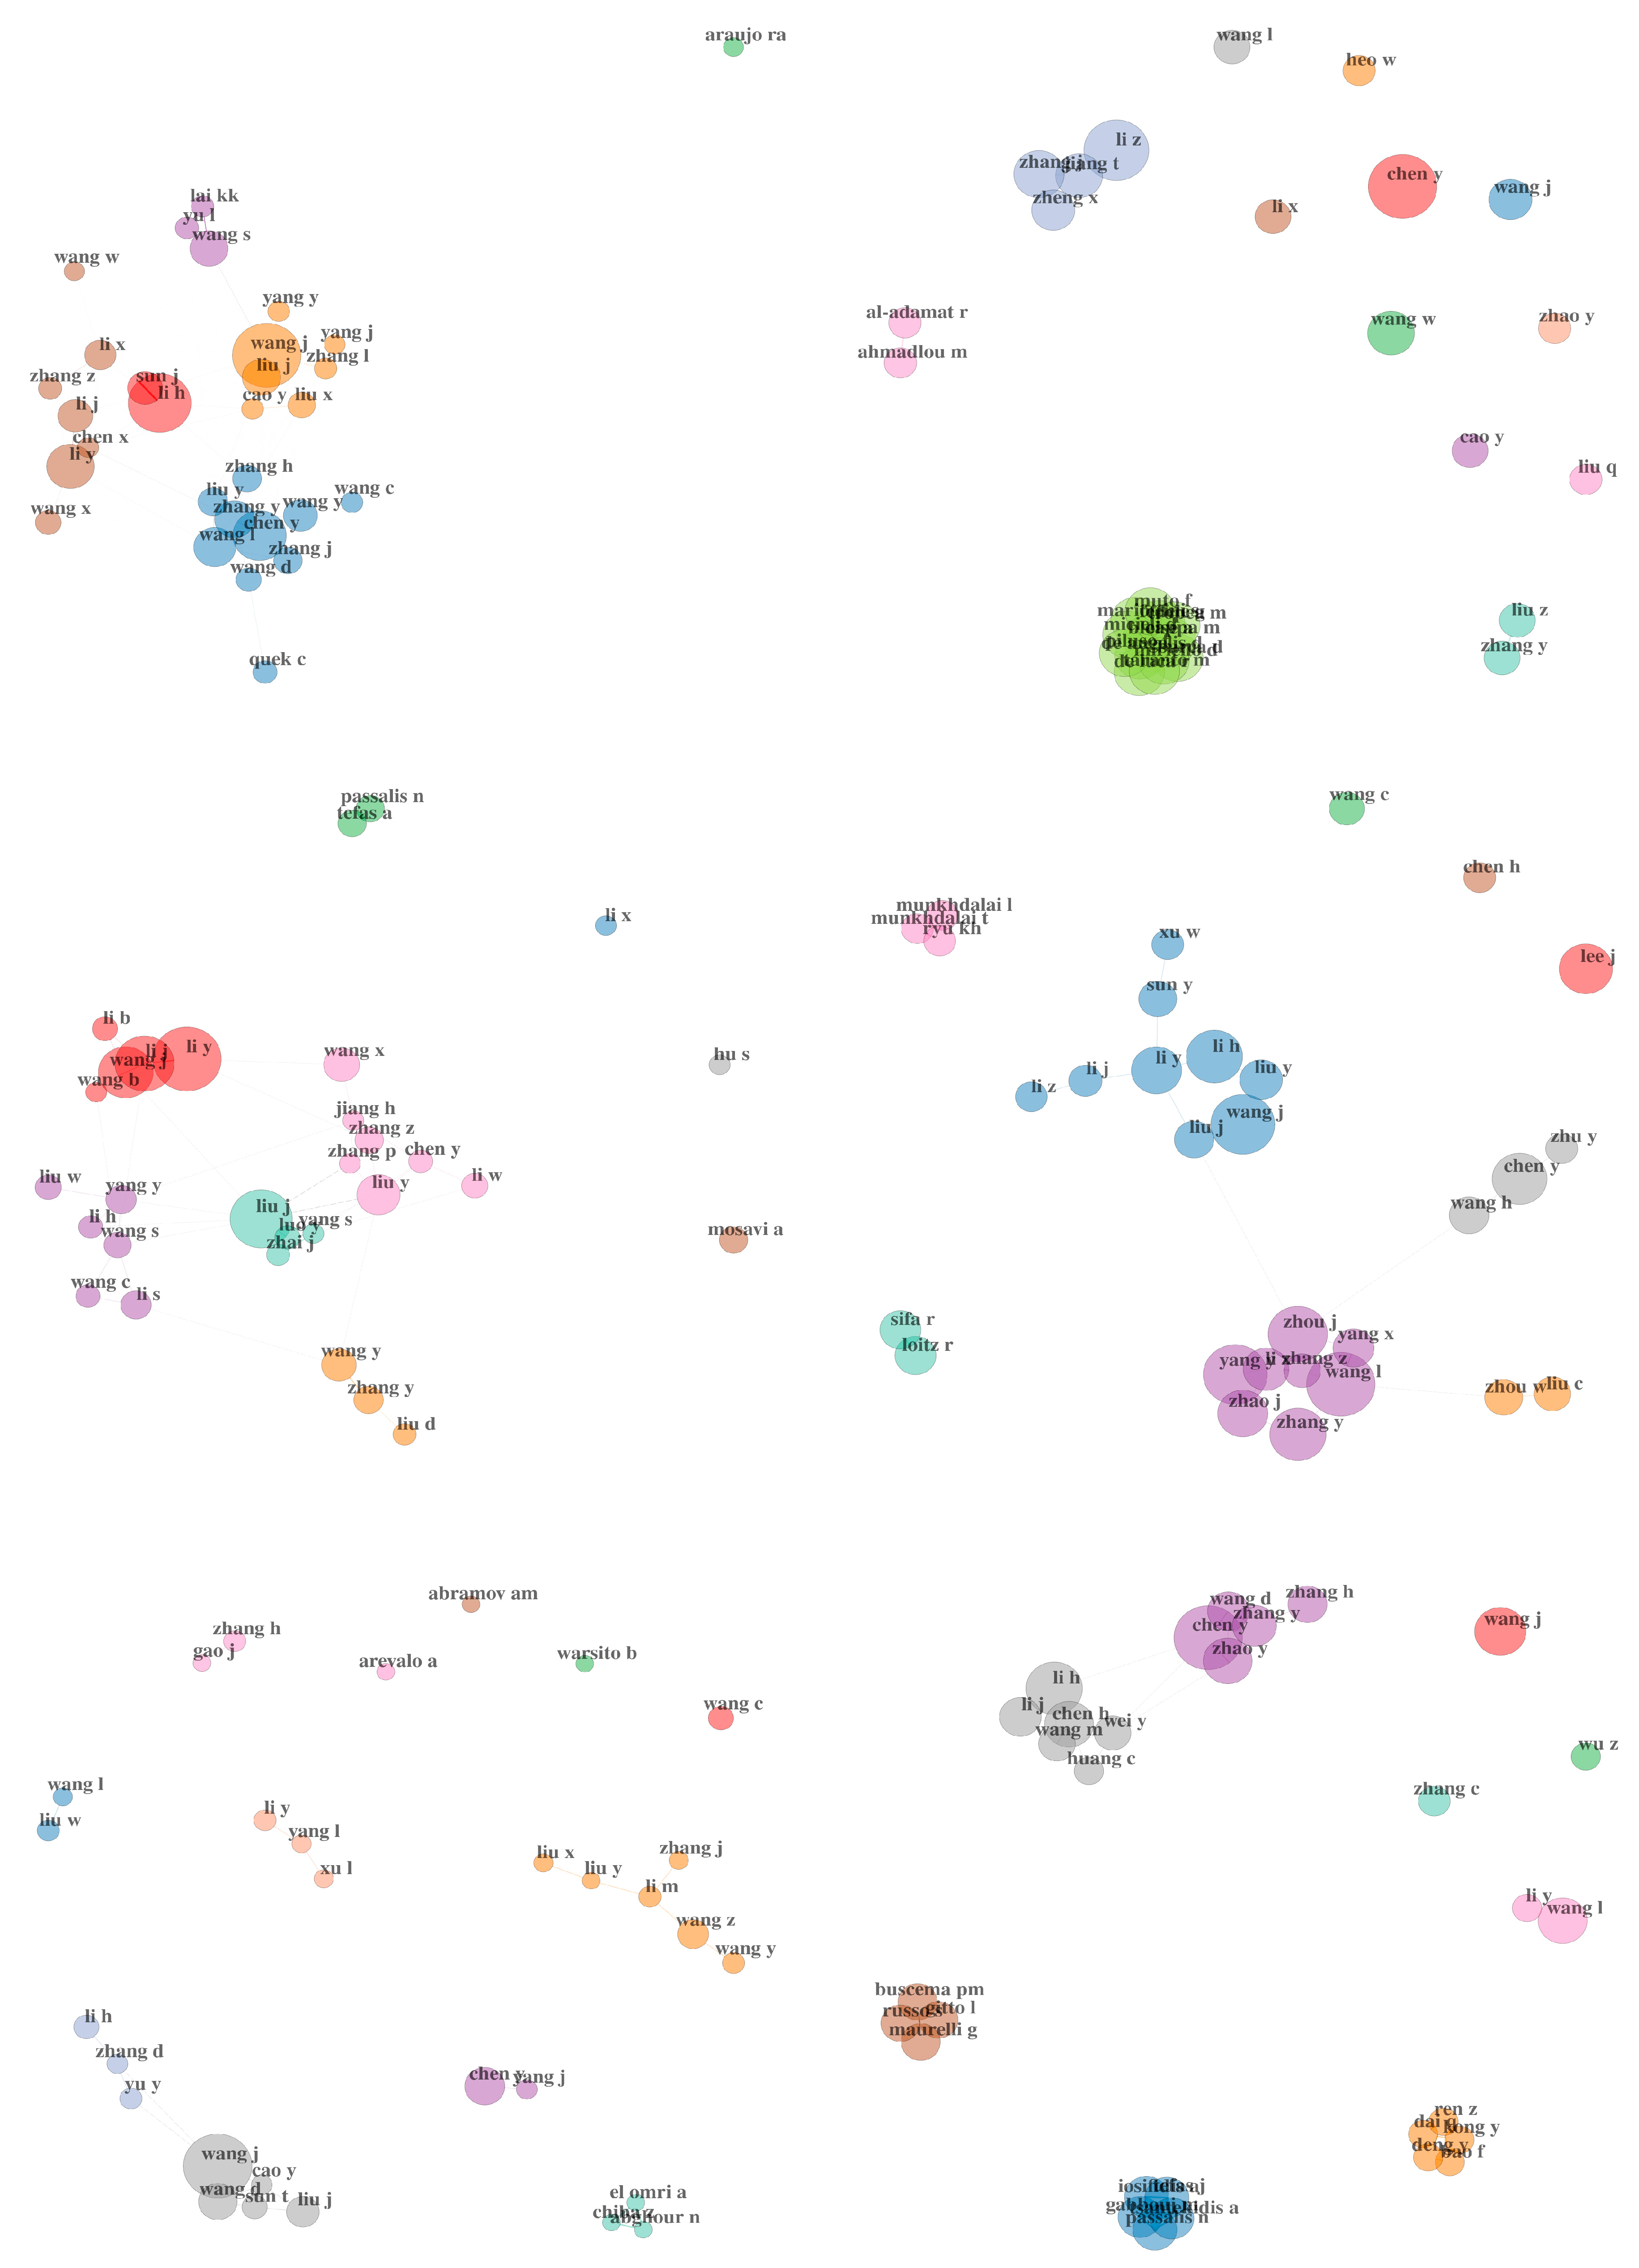
4.1. Authors
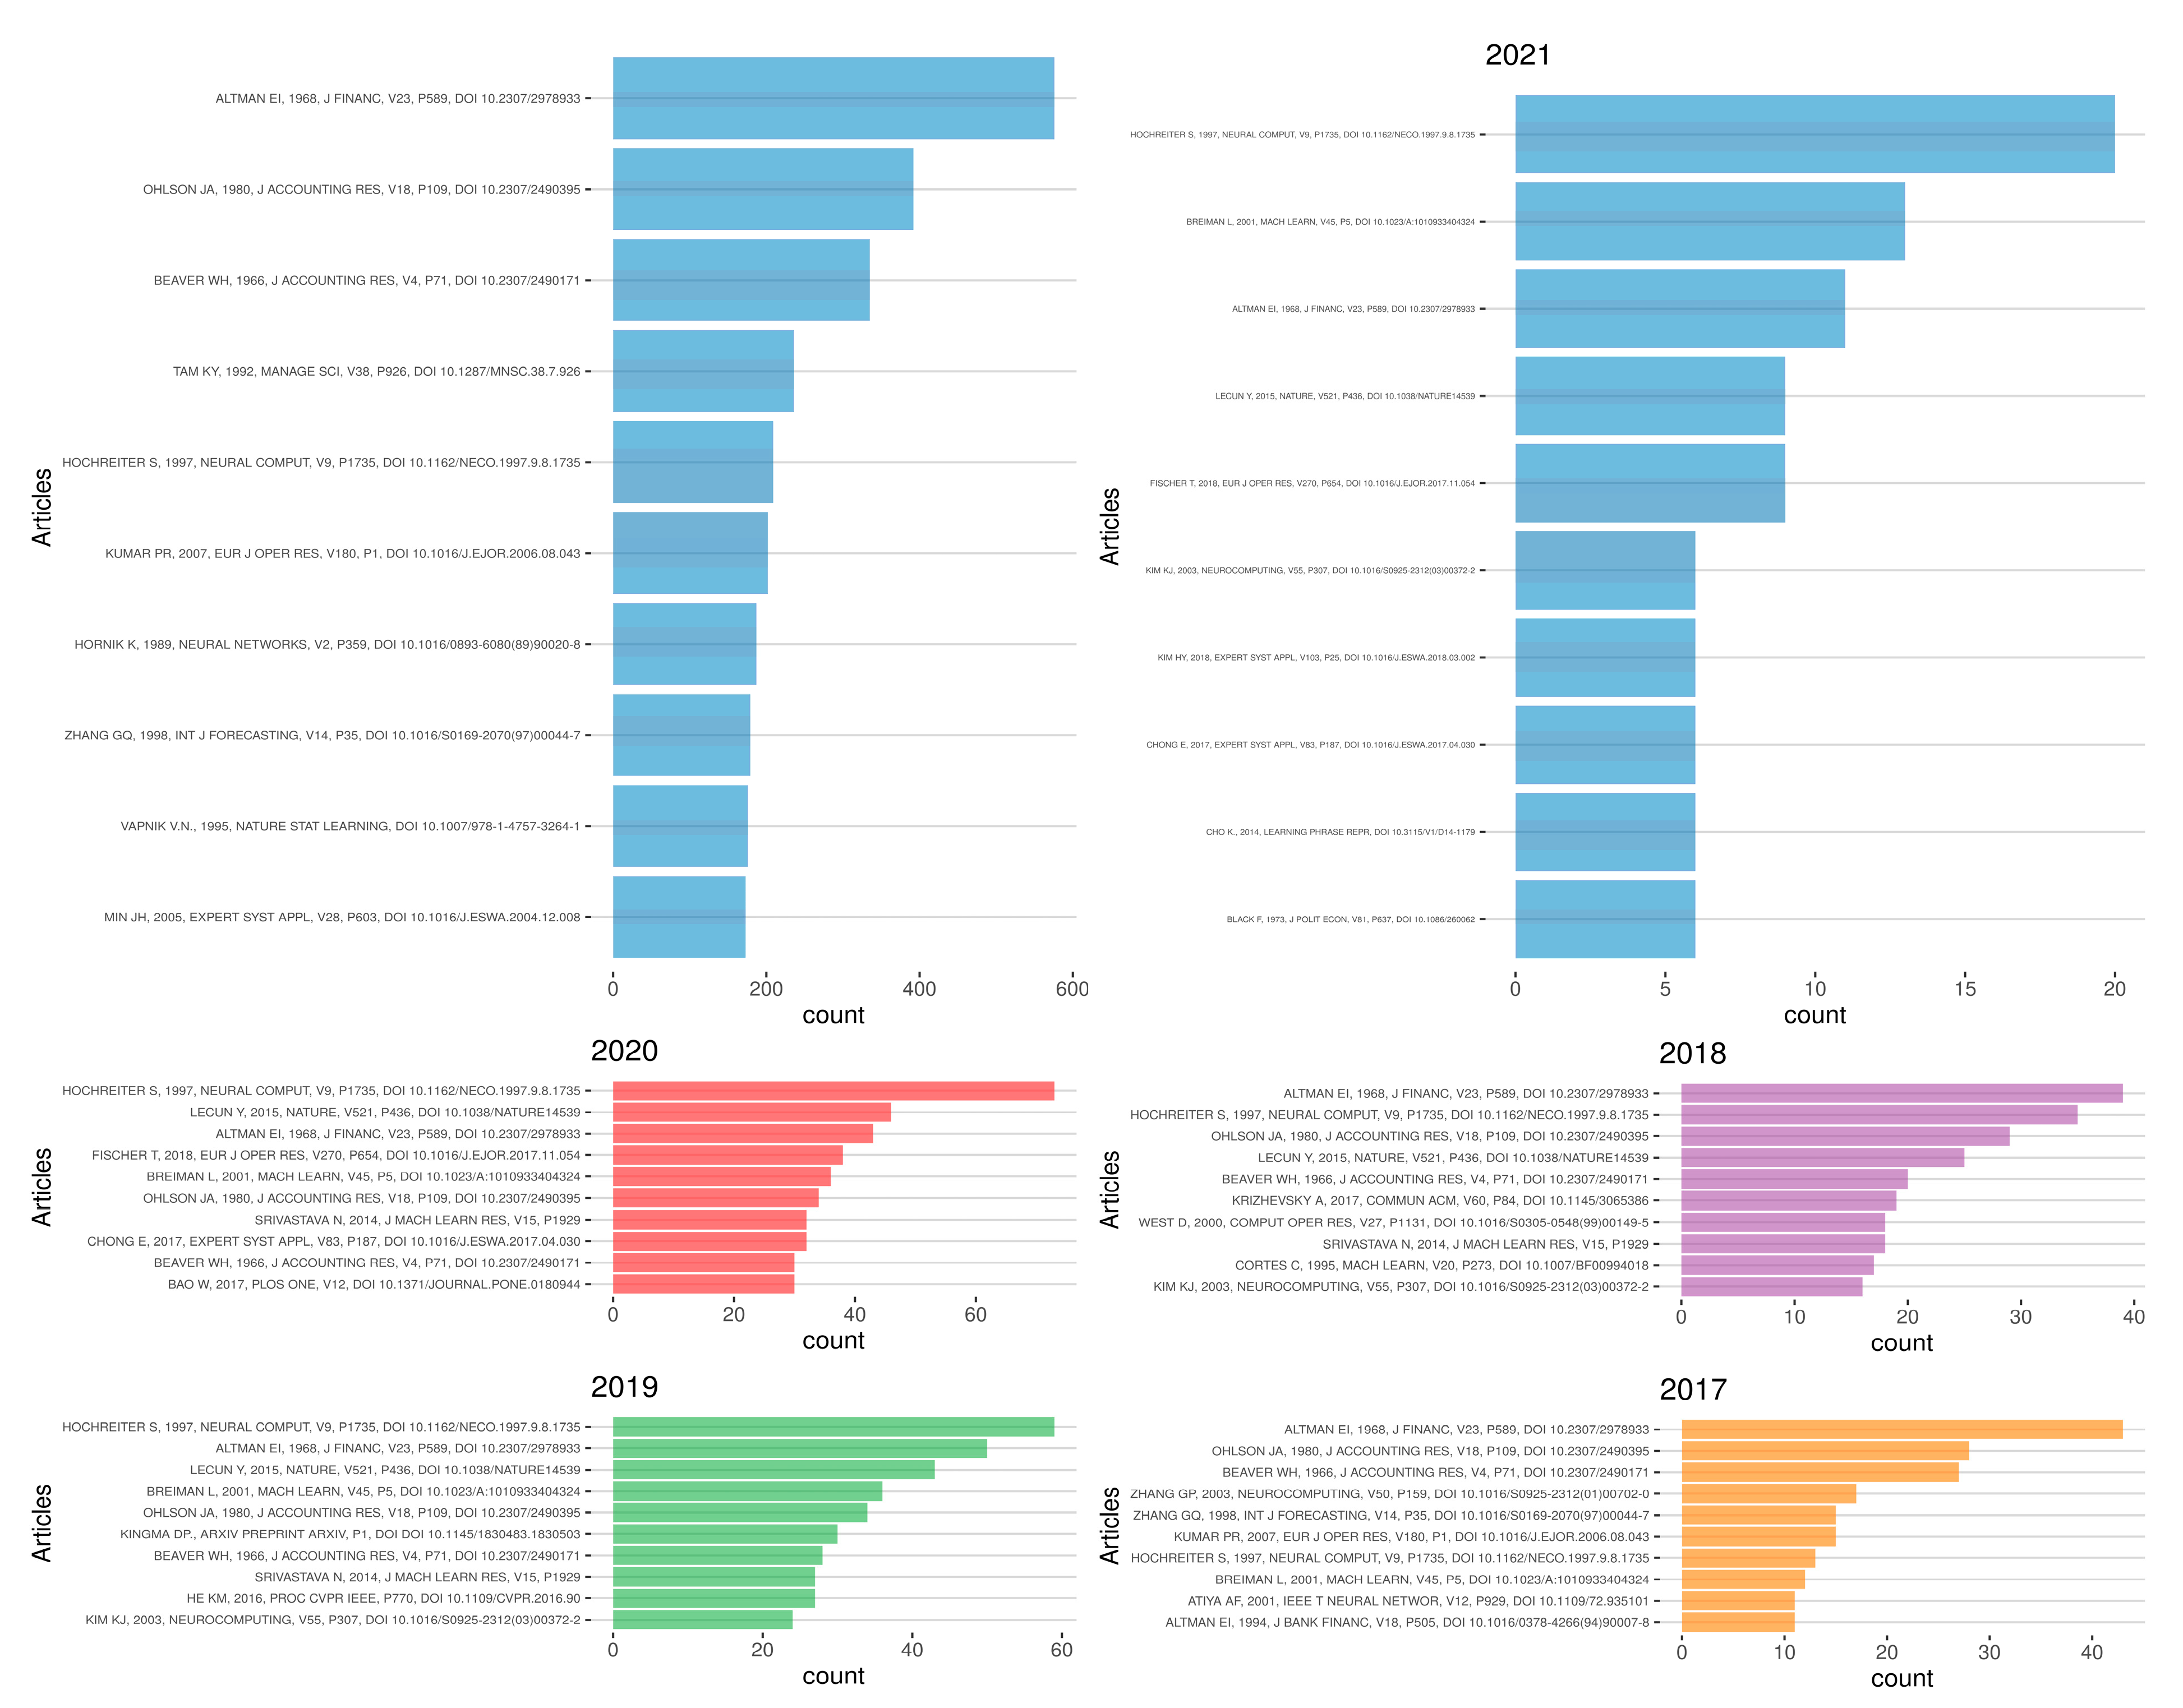
4.2. Articles
5. Social Structures of Our Sample
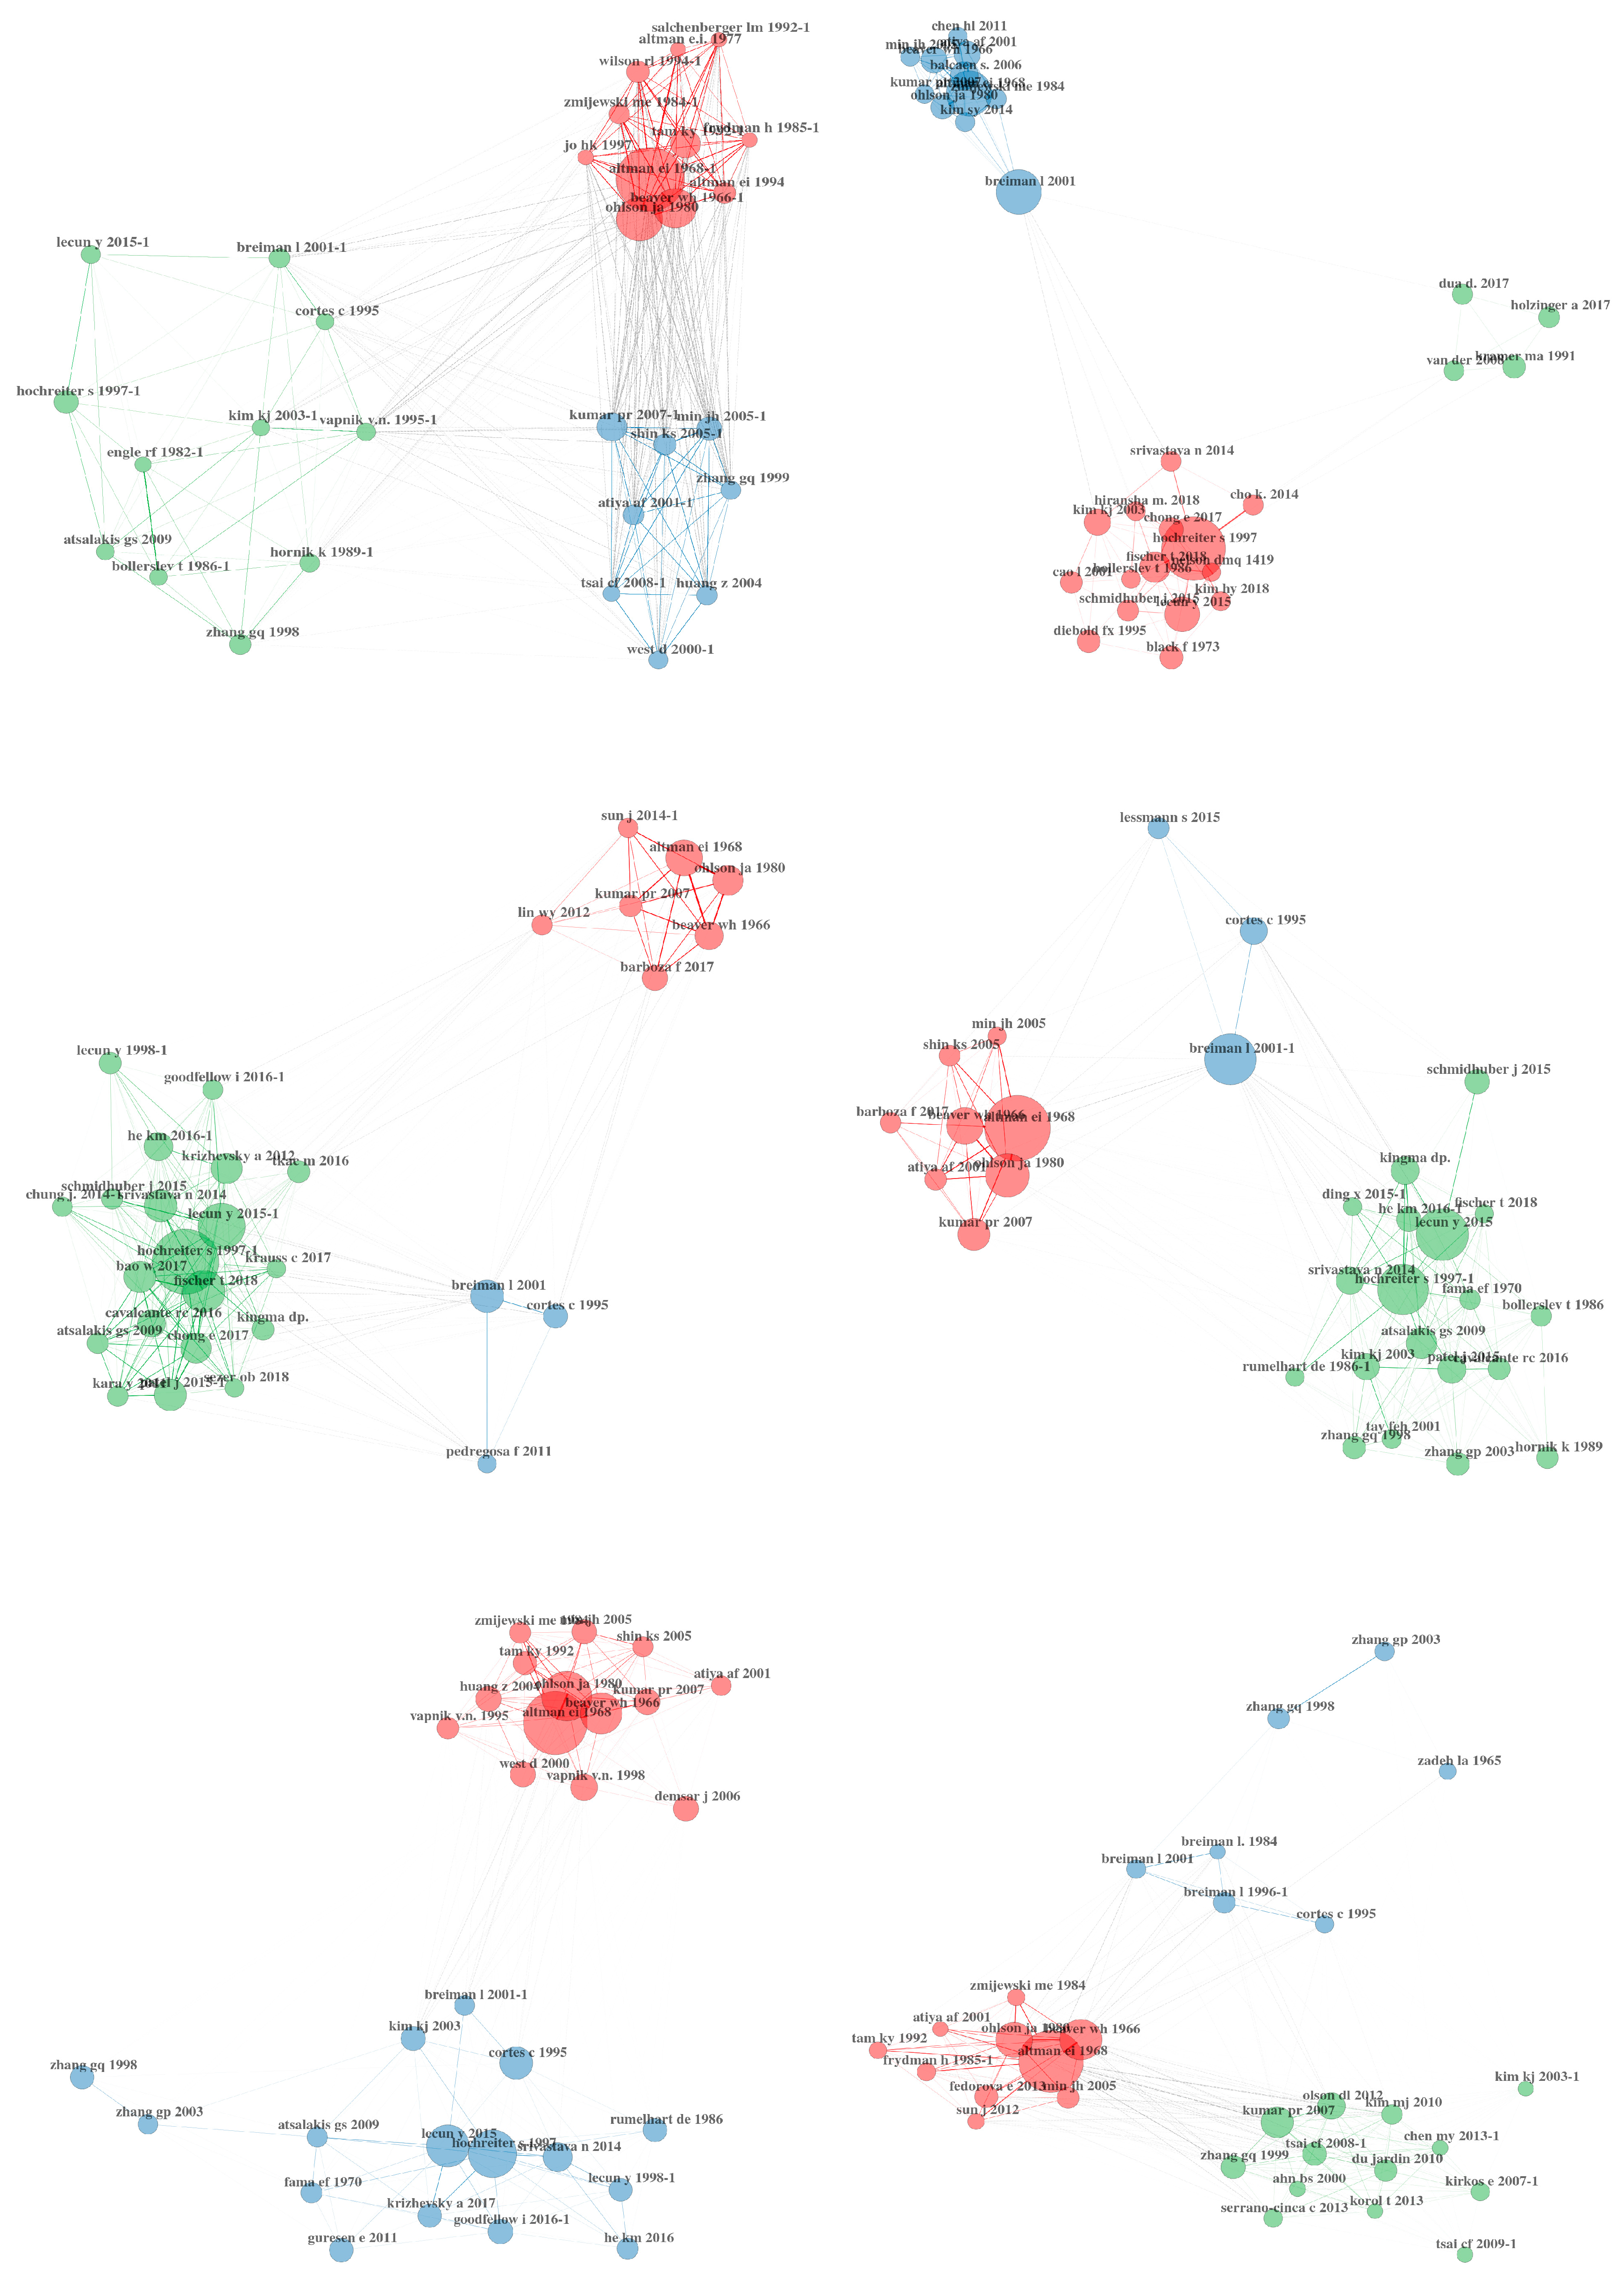
5.1. Co-Citations of Authors
5.2. Co-Citations of Articles
5.3. Co-Citations of Journals
5.4. Co-Citations of Institutions
6. Conclusions
Author Contributions
Funding
Institutional Review Board Statement
Informed Consent Statement
Acknowledgments
Conflicts of Interest
Appendix A
| References |
| Adcock, R., and N. Gradojevic. 2019. Non-fundamental, non-parametric Bitcoin forecasting. Physica A: Statistical Mechanics and Its Applications 531:121727. |
| Atsalakis, G. S., I. G. Atsalaki, F. Pasiouras, and C. Zopounidis. 2019. Bitcoin price forecasting with neuro-fuzzy techniques. European Journal of Operational Research 276: 770–80. |
| Bekiros, S. D., and D. A. Georgoutsos. 2008. Direction-of-change forecasting using a volatility-based recurrent neural network. Journal of Forecasting 27: 407–17. |
| Blake, A. P., and G. Kapetanios. 2000. A radial basis function artificial neural network test for ARCH. Economics Letters 69: 15–23. |
| Chung-Ming, Kuan, and Halbert White. 1994, Artificial neural networks: An econometric perspective, Econometric Reviews 13: 1–91. |
| Cui, Herui, Ruoyao Wang, and Haoran Wang. 2020. An Evolutionary Analysis of Green Finance Sustainability Based on Multi-Agent Game. Journal of Cleaner Production 269: 121799 |
| Donaldson, R., and M. Kamstra. 1997. An artificial neural network-garch model for international stock return volatility. Journal of Empirical Finance 4: 17–46. |
| Falcone, Pasquale Marcello. 2020. Environmental Regulation and Green Investments: The Role of Green Finance. International Journal of Green Economics 14: 159–73. |
| Fernandez-Rodrıguez, F., C. Gonzalez-Martel, and S. Sosvilla-Rivero. 2000. On the profitability of technical trading rules based on artificial neural networks: Evidence from the Madrid stock market. Economics Letters 69: 89–94. |
| Fischer, T., and C. Krauss. 2018. Deep learning with long short-term memory networks for financial market predictions. European Journal of Operational Research 270: 654–69. |
| Garcia, R., and R. Gencay. 2000. Pricing and hedging derivative securities with neural networks and a homogeneity hint. Journal of Econometrics 94: 93–115. |
| Gencay, R., and T. Stengos. 1998. Moving average rules, volume and the predictability of security returns with feedforward networks. Journal of Forecasting 17: 401–14. |
| Gerritsen, D. F., E. Bouri, E. Ramezanifar, and D. Roubaud. 2020. The profitability of technical trading rules in the Bitcoin market. Finance Research Letters 34: 101263. |
| Gradojevic, N., and R. Gencay. 2013. Fuzzy logic, trading uncertainty and technical trading. Journal of Banking and Finance 37: 578–86. |
| Gu, S., B. Kelly, and D. Xiu. 2020. Empirical Asset Pricing via Machine Learning. The Review of Financial Studies 33: 2223–73. |
| Hans, F. P., and van Griensven Kasper. 1998. Forecasting Exchange Rates Using Neural Networks for Technical Trading Rules. Studies in Nonlinear Dynamics & Econometrics 2: 1–8. |
| Hsieh, D. A. 1989. Testing for nonlinear dependence in daily foreign exchange rates. The Journal of Business 62: 339–68. |
| Huang, J.-Z., W. Huang, and J. Ni. 2019. Predicting Bitcoin returns using high-dimensional technical indicators. The Journal of Finance and Data Science 5: 140–55. |
| Hutchinson, J. M., A. W. Lo, and T. Poggio. 1994. A nonparametric approach to pricing and hedging derivative securities via learning networks. The Journal of Finance 49: 851–89. |
| Kaucic, M. 2010. Investment using evolutionary learning methods and technical rules. European Journal of Operational Research 207: 1717–27. |
| Krauss, C., X. A. Do, and N. Huck. 2017. Deep neural networks, gradient-boosted trees, random forests: Statistical arbitrage on the S&P 500. European Journal of Operational Research 259: 689–702. |
| Kristjanpoller, W., and M. C. Minutolo. 2018. A hybrid volatility forecasting framework integrating GARCH, artificial neural network, technical analysis and principal components analysis. Expert Systems with Applications 109: 1–11. |
| Lo, A.W. 2004. The adaptive markets hypothesis. The Journal of Portfolio Management 30: 15–29. |
| Lo, A.W., H. Mamaysky, and J. Wang. 2000. Foundations of Technical Analysis: Computational Algorithms, Statistical Inference, and Empirical Implementation. The Journal of Finance 55: 1705–65. |
| Menkhoff, L. 1997. Examining the use of technical currency analysis. International Journal of Finance & Economics 2: 307–18. |
| Menkhoff, L. 2010. The use of technical analysis by fund managers: International evidence. Journal of Banking & Finance 34: 2573–86. |
| Neely, C. J., D. E. Rapach, J. Tu, and G. Zhou. 2014. Forecasting the equity risk premium: The role of technical indicators. Management Science 60: 1772–91. |
| Neely, C., P. Weller, and J. Ulrich. 2009. The Adaptive Markets Hypothesis: Evidence from the Foreign Exchange Market. Journal of Financial and Quantitative Analysis 44: 467–88. |
| Taylor, M. P., and H. Allen. 1992. The use of technical analysis in the foreign exchange market. Journal of International Money and Finance 11: 304–14. |
References
- Aria, Massimo, and Corrado Cuccurullo. 2017. bibliometrix: An R-tool for comprehensive science mapping analysis. Journal of Informetrics 11: 959–75. [Google Scholar] [CrossRef]
- Aria, Massimo, V. Della Corte, and A. Piscitelli. 2017. Business Orientation and Governance Choices in Cultural Firms: A Survey Research in Area of Naples. Italian Journal of Applied Statistics 29. [Google Scholar] [CrossRef]
- Atsalakis, George S., Ioanna G. Atsalaki, Fotios Pasiouras, and Constantin Zopounidis. 2019. Bitcoin price forecasting with neuro-fuzzy techniques. European Journal of Operational Research 276: 770–80. [Google Scholar] [CrossRef]
- Bekiros, Stelios D., and Dimitris Georgoutsos. 2008. Direction-of-change forecasting using a volatility-based recurrent neural network. Journal of Forecasting 27: 407–17. [Google Scholar] [CrossRef] [Green Version]
- Berardi, Michele. 2011. Fundamentalists vs. chartists: Learning and predictor choice dynamics. Journal of Economic Dynamic Control 35: 776–92. [Google Scholar] [CrossRef] [Green Version]
- Blake, Andrew P., and George Kapetanios. 2000. A radial basis function artificial neural network test for ARCH. Economics Letters 69: 15–23. [Google Scholar] [CrossRef]
- Chung-Ming, Kuan, and Halbert White. 1994. Artificial neural networks: An econometric perspective. Econometric Reviews 13: 1–91. [Google Scholar]
- Day, Richard H., and Weihong Huang. 1990. Bulls, bears and market sheep. Journal of Economic Behavior & Organization 14: 299–329. [Google Scholar]
- De Spiegeleer, Jan, Dilip B. Madan, Sofie Reyners, and Wim Schoutens. 2018. Machine learning for quantitative finance: Fast derivative pricing, hedging and fitting. Quantitative Finance 18: 1635–43. [Google Scholar] [CrossRef]
- del Amo, Iñigo Fernández, John Ahmet Erkoyuncu, Rajkumar Roy, Riccardo Palmarini, and Demetrius Onoufriou. 2018. A systematic review of Augmented Reality content-related techniques for knowledge transfer in maintenance applications. Computers in Industry 103: 47–71. [Google Scholar] [CrossRef]
- Dixon, Matthew F., Igor Halperin, and Paul Bilokon. 2020. Machine Learning in Finance: From Theory to Practice. Cham: Springer. [Google Scholar]
- Donaldson, Glen R., and Mark Kamstra. 1997. An artificial neural network-GARCH model for international stock return volatility. Journal of Empirical Finance 4: 17–46. [Google Scholar] [CrossRef]
- Fernandez-Rodrıguez, F., C. Gonzalez-Martel, and S. Sosvilla-Rivero. 2000. On the profitability of technical trading rules based on artificial neural networks: Evidence from the Madrid stock market. Economics Letters 69: 89–94. [Google Scholar] [CrossRef]
- Fischer, Thomas, and Christopher Krauss. 2018. Deep learning with long short-term memory networks for financial market predictions. European Journal of Operational Research 270: 654–69. [Google Scholar] [CrossRef] [Green Version]
- Frankel, Jeffrey A., and Kenneth A. Froot. 1990. Chartists, Fundamentalists, and Trading in the Foreign Exchange Market. The American Economic Review 80: 181–85. [Google Scholar]
- Garcia, Rene, and Ramazan Gencay. 2000. Pricing and hedging derivative securities with neural networks and a homogeneity hint. Journal of Econometrics 94: 93–115. [Google Scholar] [CrossRef] [Green Version]
- Gavrishchaka, Valeriy, and Supriya Banerjee. 2006. Support Vector Machine as an Efficient Framework for Stock Market Volatility Forecasting. Computational Management Science 3: 147–60. [Google Scholar] [CrossRef]
- Gencay, Ramazan, and Thanasisa Stengos. 1998. Moving average rules, volume, and the predictability of security returns with feedforward networks. Journal of Forecasting 17: 401–14. [Google Scholar] [CrossRef]
- Gerritsen, Dirk F., Elie Bouri, Ehsan Ramezanifar, and David Roubaud. 2020. The profitability of technical trading rules in the Bitcoin market. Finance Research Letters 34: 101263. [Google Scholar] [CrossRef]
- Glasserman, Paul, Kriste Krstovski, Paul Laliberte, and Harry Mamaysky. 2020. Choosing News Topics to Explain Stock Market Returns. In Proceedings of the ACM International Conference on A.I. in Finance (ICAIF’ 20), New York, NY, USA, October 15–16; New York: ACM. [Google Scholar] [CrossRef]
- Gradojevic, Nikola, and Ramazan Gencay. 2013. Fuzzy logic, trading uncertainty and technical trading. Journal of Banking and Finance 37: 578–86. [Google Scholar] [CrossRef]
- Grant, Maria J., and Andrew Booth. 2009. A typology of reviews: An analysis of 14 review types and associated methodologies. Health Information & Libraries Journal 26: 91–108. [Google Scholar] [CrossRef]
- Gu, Shihao, Bryan Kelly, and Dacheng Xiu. 2020. Empirical Asset Pricing via Machine Learning. The Review of Financial Studies 33: 2223–73. [Google Scholar] [CrossRef] [Green Version]
- Hans, Franses P., and Kasper van Griensven. 1998. Forecasting Exchange Rates Using Neural Networks for Technical Trading Rules. Studies in Nonlinear Dynamics & Econometrics 2: 1–8. [Google Scholar]
- Hsieh, David A. 1989. Testing for nonlinear dependence in daily foreign exchange rates. The Journal of Business 62: 339–68. [Google Scholar] [CrossRef]
- Huang, Jian, Junyi Chai, and Stella Cho. 2020. Deep learning in finance and banking: A literature review and classification. Frontiers of Business Research in China 14: 1–24. [Google Scholar] [CrossRef]
- Hutchinson, James M., Andrew W. Lo, and Tomaso Poggio. 1994. A nonparametric approach to pricing and hedging derivative securities via learning networks. The Journal of Finance 49: 851–89. [Google Scholar] [CrossRef]
- Jiang, Xinxin, Shirui Pan, Jing Jiang, and Guodong Long. 2018. Cross-domain deep learning approach for multiple financial market predictions. In Proceedings of the 2018 International Joint Conference on Neural Networks (IJCNN), Rio de Janeiro, Brazil, July 8–13; pp. 1–8. [Google Scholar]
- Kaucic, Massimiliano. 2010. Investment using evolutionary learning methods and technical rules. European Journal of Operational Research 207: 1717–27. [Google Scholar] [CrossRef]
- Kraus, Mathias, and Stefan Feuerriegel. 2017. Decision Support from Financial Disclosures with Deep Neural Networks and Transfer Learning. Available online: https://arxiv.org/pdf/1710.03954.pdf (accessed on 18 March 2021).
- Krauss, Christopher, Xuan Anh Do, and Nicolas Huck. 2017. Deep neural networks, gradient-boosted trees, random forests: Statistical arbitrage on the S&P 500. European Journal of Operational Research 259: 689–702. [Google Scholar]
- Kristjanpoller, Werner, and Marcel C. Minutolo. 2018. A hybrid volatility forecasting framework integrating GARCH, artificial neural network, technical analysis, and principal components analysis. Expert Systems with Applications 109: 1–11. [Google Scholar] [CrossRef]
- Lee, Cheng-Fee, and John Lee, eds. 2010. Handbook of Quantitative Finance and Risk Management. New York: Springer. [Google Scholar]
- Lo, Andrew W. 2004. The adaptive markets hypothesis. The Journal of Portfolio Management 30: 15–29. [Google Scholar] [CrossRef]
- Lo, Andrew W., Harry Mamaysky, and Jiang Wang. 2000. Foundations of Technical Analysis: Computational Algorithms, Statistical Inference, and Empirical Implementation. The Journal of Finance 55: 1705–65. [Google Scholar] [CrossRef] [Green Version]
- Loughran, Tim, and Bill McDonald. 2011. When is a Liability not a Liability? Textual Analysis, Dictionaries, and 10-Ks. Journal of Finance 66: 35–65. [Google Scholar] [CrossRef]
- Malinauskaite, Laura, David Cook, Brynhildur Davíðsdóttir, Helga Ögmundardóttir, and Joe Roman. 2019. Ecosystem services in the Arctic: A thematic review. Ecosystem Services 36: 100898. [Google Scholar] [CrossRef]
- Markowitz, Harry M. 1952. Portfolio Selection. The Journal of Finance 7: 77–91. [Google Scholar]
- Matsubara, Takashi, Ryo Akita, and Kuniaki Uehara. 2018. Stock price prediction by deep neural generative model of news articles. IEICE Transactions on Information and Systems 4: 901–8. [Google Scholar] [CrossRef] [Green Version]
- Mengist, Wondimagegn, Teshome Soromessa, and Gudina Legese. 2020. Method for conducting systematic literature review and meta-analysis for environmental science research. MethodsX 7: 11. [Google Scholar] [CrossRef] [PubMed]
- Menkhoff, Lukas. 1997. Examining the use of technical currency analysis. International Journal of Finance & Economics 2: 307–18. [Google Scholar]
- Menkhoff, Lukas. 2010. The use of technical analysis by fund managers: International evidence. Journal of Banking & Finance 34: 2573–86. [Google Scholar]
- Minh, Dang, Abolghasem Sadeghi-Niaraki, Huy Huynh, Kyungbok Min, and Hyeonjoon Moon. 2017. Deep learning approach for short-term stock trends prediction based on two-stream gated recurrent unit network. IEEE Access 6: 55392–404. [Google Scholar] [CrossRef]
- Mitra, Gautam, and Xiang Yu, eds. 2016. The Handbook of Sentiment Analysis in Finance. New York: Albury Books. [Google Scholar]
- Mitra, Leela, and Gautam Mitra. 2011. The Handbook of News Analytics in Finance. Hoboken: John Wiley & Sons. [Google Scholar]
- Neely, Christopher, David E. Rapach, Jun Tu, and Guofu Zhou. 2014. Forecasting the equity risk premium: The role of technical indicators. Management Science 60: 1772–1791. [Google Scholar] [CrossRef] [Green Version]
- Neely, Christopher, Paul Weller, and Joshua Ulrich. 2009. The Adaptive Markets Hypothesis: Evidence from the Foreign Exchange Market. Journal of Financial and Quantitative Analysis 44: 467–88. [Google Scholar] [CrossRef] [Green Version]
- Perevochtchikova, Maria, José Álvaro Hernández Flores, Wilmer Marín, Alfonso Langle Flores, Arturo Ramos Bueno, and Iskra Alejandra Rojo Negrete. 2019. Systematic review of integrated studies on functional and thematic ecosystem services in Latin America, 1992–2017. Ecosystem Services 36: 100900. [Google Scholar] [CrossRef]
- Popper, Karl Raimund. 1962. Conjectures and Refutations; The Growth of Scientific Knowledge. New York: Basic Books. [Google Scholar]
- Prasch, Robert, and Thierry Warin. 2016. Systemic Risk and Financial Regulations: A Theoretical Perspective. Journal of Banking Regulation 17: 188–99. [Google Scholar] [CrossRef]
- Schumaker, Robert P., and Hsinchun Chen. 2010. A discrete stock price prediction engine based on financial news. Computer 43: 51–56. [Google Scholar] [CrossRef]
- Sharpe, William F. 1963. A Simplified Model for Portfolio Analysis. Management Science 9: 277–93. [Google Scholar] [CrossRef] [Green Version]
- Sharpe, William F. 1964. Capital Asset Prices—A Theory of Market Equilibrium under Conditions of Risk. Journal of Finance 19: 425–42. [Google Scholar]
- Taylor, Mark, and Hellen Allen. 1992. The use of technical analysis in the foreign exchange market. Journal of International Money and Finance 11: 304–14. [Google Scholar] [CrossRef]
- Warin, Thierry. 2005. Popper’s Falsifiability and Mises’ a-Priorism: Is Dogmatism Everywhere? Epistemologia 28: 121–38. [Google Scholar]


| Description | Overall Time Period (1990–2021) | 2017 | 2018 | 2019 | 2020 | 2021 |
|---|---|---|---|---|---|---|
| Sources (Journals, Books, etc.) | 2533 | 265 | 329 | 374 | 333 | 107 |
| Documents | 5053 | 355 | 436 | 578 | 592 | 157 |
| Average years from publication | 7.74 | 4 | 3 | 2 | 1 | 0 |
| Average citations per documents | 14.66 | 10.9 | 8.278 | 5.005 | 2.255 | 0.465 |
| Average citations per year per document | 1.699 | 2.18 | 2.069 | 1.668 | 1.128 | 0.465 |
| References | 105,684 | 10,844 | 13,281 | 18,239 | 22,817 | 7313 |
| Description | Overall Time Period (1990–2021) | 2017 | 2018 | 2019 | 2020 | 2021 |
|---|---|---|---|---|---|---|
| Article | 2719 | 196 | 222 | 339 | 484 | 143 |
| Article; easy access | 67 | 0 | 0 | 0 | 0 | 0 |
| Article; proceedings paper | 143 | 1 | 4 | 2 | 0 | 1 |
| Article; retracted publication | 1 | 0 | 1 | 0 | 0 | 0 |
| Bibliography | 1 | 0 | 0 | 0 | 0 | 0 |
| Biographical item | 1 | 0 | 0 | 0 | 0 | 0 |
| Book review | 6 | 0 | 0 | 0 | 0 | 0 |
| Correction | 3 | 0 | 0 | 1 | 0 | 1 |
| Editorial material | 9 | 0 | 2 | 1 | 0 | 1 |
| Letter | 3 | 0 | 0 | 0 | 0 | 0 |
| Meeting abstract | 3 | 0 | 0 | 0 | 1 | 0 |
| Proceedings paper | 1974 | 150 | 194 | 216 | 79 | 0 |
| Review | 120 | 8 | 13 | 19 | 28 | 11 |
| Review; early access | 3 | 0 | 0 | 0 | 0 | 0 |
| Description | Overall Time Period | 2017 | 2018 | 2019 | 2020 | 2021 |
|---|---|---|---|---|---|---|
| Keyword Plus (ID) | 3607 | 604 | 693 | 849 | 950 | 234 |
| Author’s Keywords (DE) | 10164 | 1251 | 1429 | 1804 | 2044 | 688 |
| Authors | 9648 | 939 | 1210 | 1655 | 1651 | 492 |
| Author Appearances | 14628 | 1056 | 1350 | 1972 | 1985 | 519 |
| Authors of single-authored documents | 520 | 44 | 40 | 37 | 47 | 8 |
| Authors of multi-authored documents | 9128 | 895 | 1170 | 1618 | 1604 | 484 |
| Description | Overall Time Period | 2017 | 2018 | 2019 | 2020 | 2021 |
|---|---|---|---|---|---|---|
| Single-authored documents | 661 | 46 | 42 | 37 | 49 | 9 |
| Documents per Author | 0.524 | 0.378 | 0.360 | 0.349 | 0.359 | 0.319 |
| Authors per Document | 1.91 | 2.65 | 2.78 | 2.86 | 2.79 | 3.13 |
| Co-Authors per Documents | 2.89 | 2.97 | 3.10 | 3.41 | 3.35 | 3.31 |
| Collaboration Index | 2.08 | 2.90 | 2.97 | 2.99 | 2.95 | 3.27 |
| Author Keywords (DE) | Articles | Keywords-Plus (ID) | Articles |
|---|---|---|---|
| Overall Time Period | |||
| Neural Network | 867 | Neural Networks | 800 |
| Artificial Neural Network | 423 | Prediction | 482 |
| Forecasting | 277 | Model | 402 |
| Machine Learning | 274 | Neural Network | 340 |
| Deep Learning | 257 | Classification | 305 |
| 2021 | |||
| Neural Network | 26 | Neural Networks | 13 |
| Artificial Neural Network | 22 | Model | 12 |
| Forecasting | 21 | Prediction | 10 |
| Machine Learning | 15 | Market | 8 |
| Deep Learning | 10 | Classification | 7 |
| 2020 | |||
| Deep Learning | 87 | Neural Networks | 81 |
| Neural Network | 85 | Prediction | 66 |
| Machine Learning | 79 | Model | 63 |
| Artificial Neural Network | 49 | Neural Network | 50 |
| Forecasting | 42 | Models | 40 |
| 2019 | |||
| Neural Network | 80 | Neural Networks | 96 |
| Deep Learning | 72 | Prediction | 51 |
| Machine Learning | 58 | Model | 49 |
| Artificial Neural Network | 43 | Neural Network | 38 |
| Forecasting | 35 | Classification | 36 |
| 2018 | |||
| Neural Network | 51 | Neural Networks | 83 |
| Deep Learning | 48 | Prediction | 44 |
| Artificial Neural Network | 45 | Model | 42 |
| Machine Learning | 35 | Classification | 26 |
| Forecasting | 25 | Neural Network | 25 |
| 2017 | |||
| Neural Network | 51 | Neural Networks | 68 |
| Artificial Neural Network | 39 | Prediction | 38 |
| Forecasting | 21 | Model | 34 |
| Prediction | 20 | Neural Network | 31 |
| Machine Learning | 18 | Classification | 30 |
| Statistics | Overall Time Period | 2021 | 2020 | 2019 | 2018 | 2017 |
|---|---|---|---|---|---|---|
| Size | 3607.000 | 234.000 | 950.000 | 849.000 | 693.000 | 604.000 |
| Density | 0.005 | 0.036 | 0.014 | 0.016 | 0.018 | 0.021 |
| Transitivity | 0.128 | 0.538 | 0.238 | 0.232 | 0.266 | 0.269 |
| Diameter | 6.000 | 6.000 | 6.000 | 6.000 | 6.000 | 6.000 |
| Degree Centralization | 0.298 | 0.188 | 0.229 | 0.303 | 0.317 | 0.333 |
| Average path length | 2.752 | 3.067 | 2.792 | 2.716 | 2.732 | 2.682 |
| Article | Total Citations | Total Citations per Year | NTC |
|---|---|---|---|
| Overall Time Period | |||
| Schaap Mg., 2001, J Hydrol | 1361 | 64.8 | 20.06 |
| Jordan Mi, 2015, Science | 1189 | 169.9 | 78.27 |
| Kim Kj, 2003, Neurocompeting | 748 | 39.4 | 18.34 |
| Pan Wt, 2012, Knowledge-Based Syst | 725 | 72.5 | 33.93 |
| Tay Feh, 2001, Omega-Int H Manage Sci | 596 | 28.4 | 8.79 |
| 2017 | |||
| Wei, Y, 2017, Ieee Trans Pattern Anal Mach Intell | 199 | 39.8 | 18.25 |
| Bao W, 2017, Plos One | 198 | 39.6 | 18.16 |
| Deng Y, 2017, Ieee Trans Neural Netw Learn Syst | 142 | 28.4 | 13.03 |
| Barboza F, 2017, Expert Syst Appl | 135 | 27.0 | 12.38 |
| Krauss C, 2017, Eur J Oper Res | 115 | 23.0 | 10.55 |
| 2018 | |||
| Fischer T, 2018, Eur J Oper Res | 258 | 64.5 | 31.17 |
| Termeh Svr, 2018, Sci Total Environ | 144 | 36.0 | 17.40 |
| Han J, 2018, Proc Natl Acad Sci USA | 129 | 32.2 | 15.58 |
| Kim Hy, 2018, Expert Syst Appl | 108 | 27.0 | 12.38 |
| Cai Y, 2018, Remote Sens Environ | 102 | 25.5 | 12.32 |
| 2019 | |||
| Altan A, 2019, Chaos Solitons Fractals | 90 | 30.0 | 17.98 |
| Cao J, 2019, Physica A | 60 | 20.0 | 11.99 |
| Long W, 2019, Knowledge-Based Syst | 55 | 18.3 | 10.99 |
| Strubell E, 2019, 57th Annual Meeting of the Association for Computational Linguistics (ACl 2019) | 48 | 16.0 | 9.59 |
| Plawiak P, 2019, Appl Soft Comput | 43 | 14.3 | 8.59 |
| 2020 | |||
| Pang X, 2020, J Supercomput | 44 | 22.0 | 19.51 |
| Akhtar Ms, 2020, Ieee Comput Intell Mag | 41 | 20.5 | 18.18 |
| Ahmed R, 2020, Renew Sust Energ Rev | 38 | 19.0 | 16.85 |
| Sezer Ob, 2020, Appl Soft Comput | 32 | 16.0 | 14.19 |
| Gu S, 2020, Rev Financ Stud | 29 | 14.5 | 12.86 |
| 2021 | |||
| Marcelino P, 2021, Int J Pavement Eng | 12 | 12 | 25.81 |
| Talwar M, 2021, J Retail Consum Serv | 8 | 8 | 17.21 |
| Carta S, 2021, Expert Syst Appl | 6 | 6 | 12.90 |
| Brodny J, 2021, J Clean Prod | 5 | 5 | 10.75 |
| Hu Z, 2021, Appl Syst Innov | 4 | 4 | 8.60 |
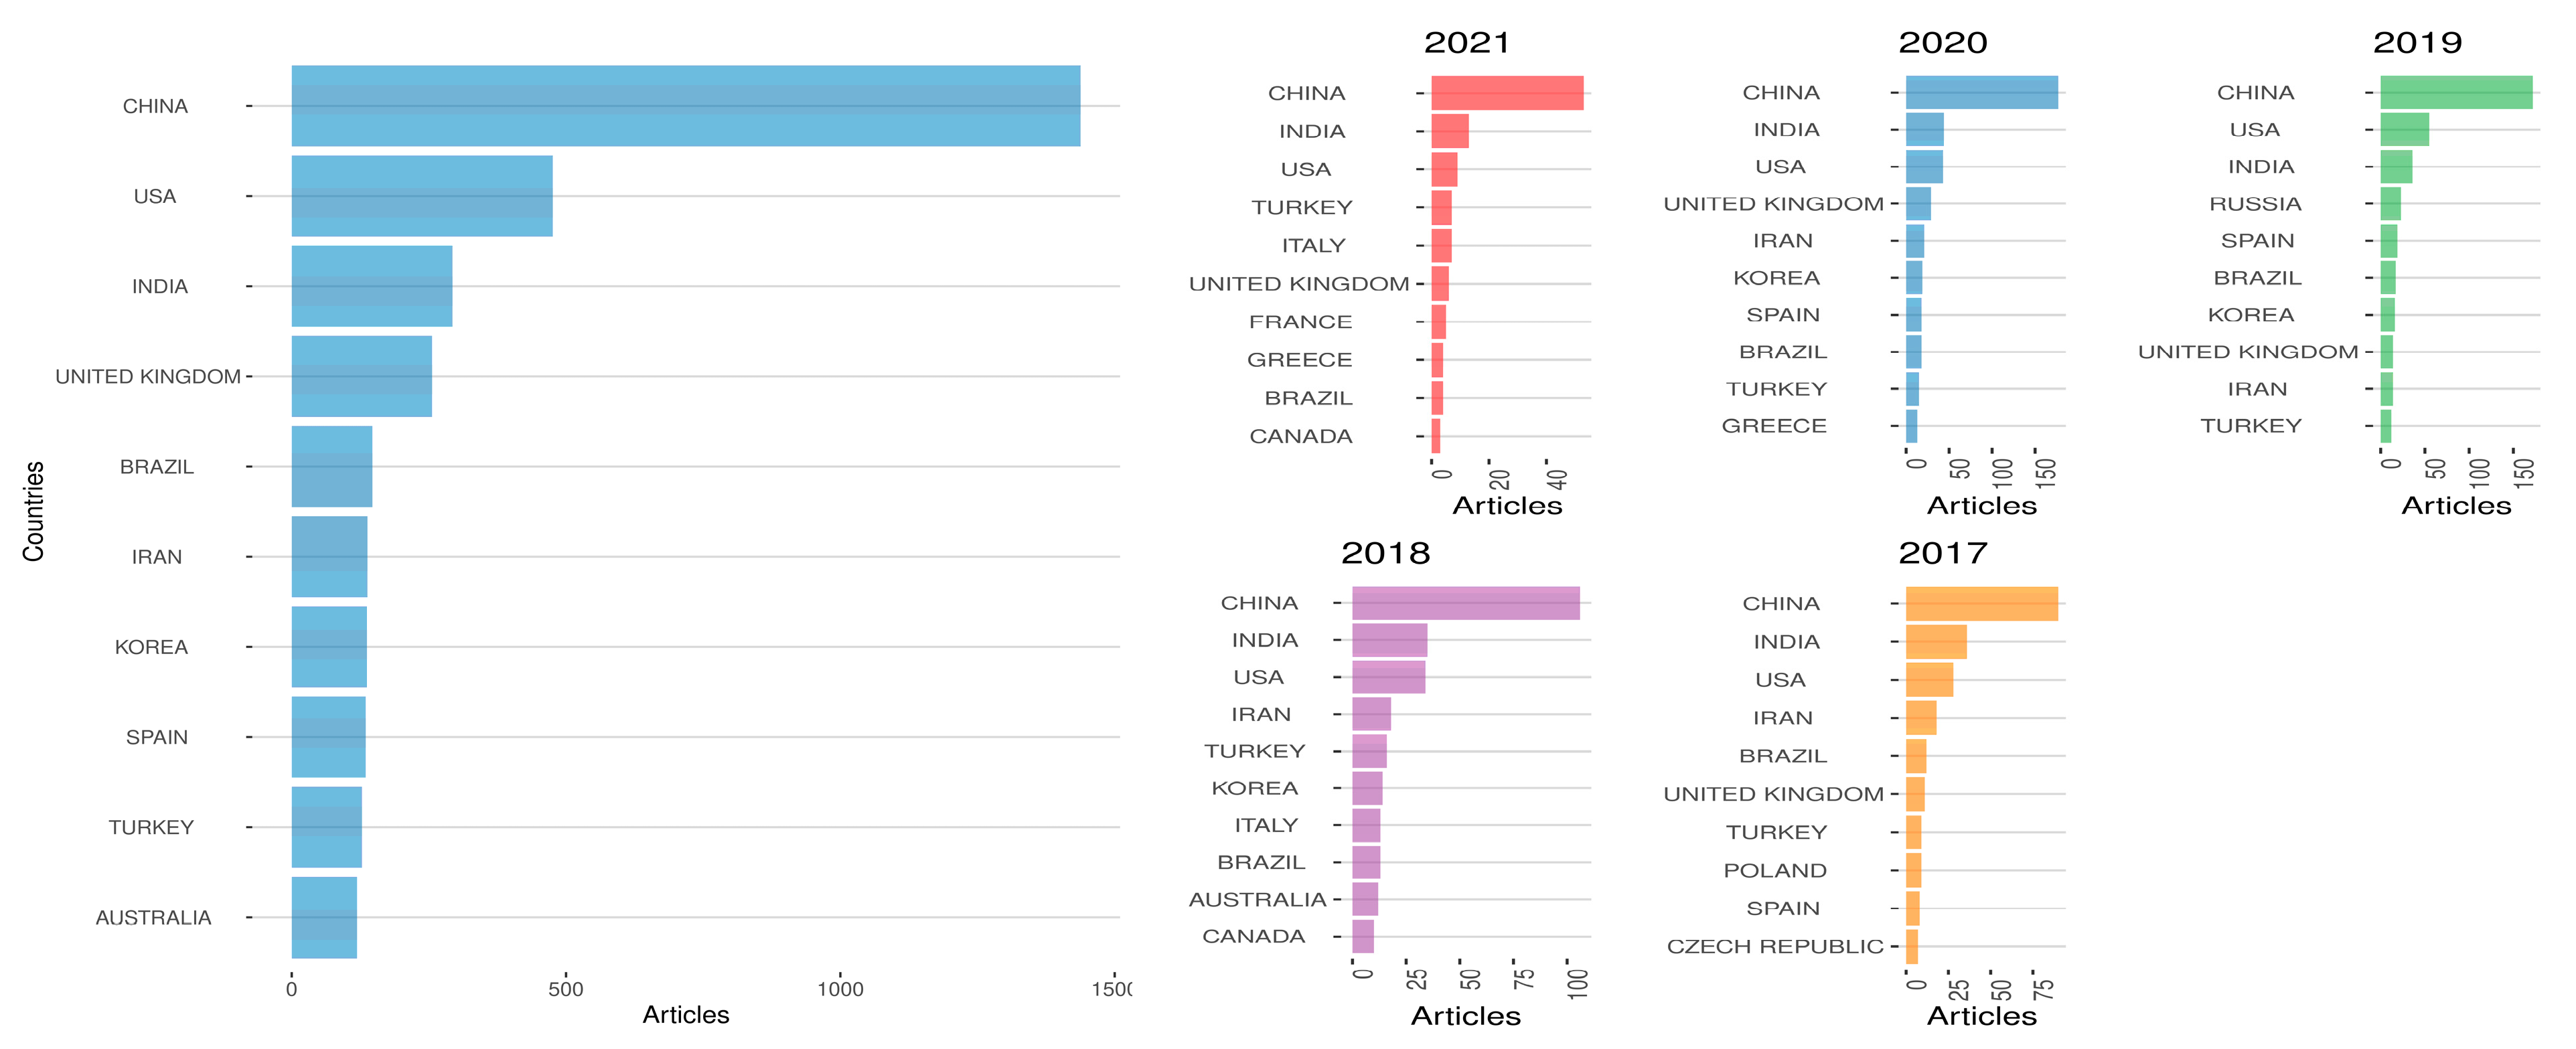
| Country | Articles | Frequency | SCP | MCP | MCP_Ratio |
|---|---|---|---|---|---|
| Overall Time Period | |||||
| China | 1438 | 0.2885 | 1253 | 185 | 0.1287 |
| United States | 476 | 0.0955 | 389 | 87 | 0.1828 |
| India | 293 | 0.0588 | 268 | 25 | 0.0853 |
| United Kingdom | 256 | 0.0514 | 195 | 61 | 0.2383 |
| Brazil | 147 | 0.0295 | 138 | 9 | 0.0612 |
| 2017 | |||||
| China | 90 | 0.2535 | 74 | 16 | 0.1778 |
| India | 36 | 0.1014 | 33 | 3 | 0.0833 |
| United States | 28 | 0.0789 | 20 | 8 | 0.2857 |
| Iran | 18 | 0.0507 | 16 | 2 | 0.1111 |
| Brazil | 12 | 0.0338 | 11 | 1 | 0.0833 |
| 2018 | |||||
| China | 106 | 0.2437 | 89 | 17 | 0.1604 |
| India | 35 | 0.0805 | 32 | 3 | 0.0857 |
| United States | 34 | 0.0782 | 22 | 12 | 0.3529 |
| Iran | 18 | 0.0414 | 15 | 3 | 0.1667 |
| Turkey | 16 | 0.0368 | 15 | 1 | 0.0625 |
| 2019 | |||||
| China | 172 | 0.2976 | 136 | 36 | 0.2093 |
| United States | 55 | 0.0952 | 48 | 7 | 0.1273 |
| India | 36 | 0.0623 | 33 | 3 | 0.0833 |
| Russia | 23 | 0.0398 | 22 | 1 | 0.0435 |
| Spain | 19 | 0.0329 | 9 | 10 | 0.5263 |
| 2020 | |||||
| China | 177 | 0.2990 | 147 | 30 | 0.169 |
| India | 44 | 0.0743 | 35 | 9 | 0.205 |
| United States | 43 | 0.0726 | 34 | 9 | 0.209 |
| United Kingdom | 29 | 0.0490 | 20 | 9 | 0.310 |
| Iran | 21 | 0.0355 | 18 | 3 | 0.143 |
| 2021 | |||||
| China | 53 | 0.3397 | 42 | 11 | 0.208 |
| India | 13 | 0.0833 | 13 | 0 | 0.000 |
| United States | 9 | 0.0577 | 6 | 3 | 0.333 |
| Italy | 7 | 0.0449 | 7 | 0 | 0.000 |
| Turkey | 7 | 0.0449 | 6 | 1 | 0.143 |
| Country | Total Citations | Average Article Citations |
|---|---|---|
| Overall Time Period | ||
| China | 17154 | 11.929 |
| United States | 16876 | 35.454 |
| United Kingdom | 4691 | 18.324 |
| South Korea | 4482 | 32.715 |
| India | 2999 | 10.235 |
| 2017 | ||
| China | 1413 | 15.70 |
| United States | 463 | 16.54 |
| India | 404 | 11.22 |
| Brazil | 260 | 21.67 |
| Germany | 207 | 34.50 |
| 2018 | ||
| United States | 555 | 16.324 |
| China | 511 | 4.821 |
| Iran | 285 | 15.833 |
| Germany | 270 | 54.000 |
| India | 232 | 6.629 |
| 2019 | ||
| China | 607 | 3.529 |
| United States | 421 | 7.655 |
| Brazil | 165 | 9.706 |
| Iran | 132 | 9.429 |
| South Korea | 126 | 7.875 |
| 2020 | ||
| China | 352 | 1.989 |
| United States | 127 | 2.953 |
| India | 107 | 2.432 |
| United Kingdom | 72 | 2.483 |
| Australia | 63 | 5.727 |
| 2021 | ||
| China | 13 | 0.245 |
| Portugal | 12 | 12.000 |
| Norway | 9 | 3.000 |
| India | 7 | 0.538 |
| Italy | 6 | 0.857 |
| Sources | Articles |
|---|---|
| Overall Time Period | |
| Expert Systems with Applications | 305 |
| Applied Soft Computing | 75 |
| Ieee Access | 74 |
| Neurocomputing | 71 |
| Neural Computing & Applications | 56 |
| 2017 | |
| Expert Systems with Applications | 12 |
| Applied Soft Computing | 6 |
| Physica a-Statistical Mechanics and Its Applications | 5 |
| 2017 Ieee International Conference on Big Data (Big Data) | 4 |
| Agro Food Industry High-tech | 4 |
| 2018 | |
| Expert Systems with Applications | 12 |
| Applied Soft Computing | 9 |
| Neurocomputing | 8 |
| 2018 26th Signal Processing and Communications Applications Conference (Sui) | 7 |
| 2018 International Joint Conference on Neural Networks (ijcnn) | 7 |
| 2019 | |
| Ieee Access | 24 |
| Expert Systems with Applications | 19 |
| Physica a-Statistical Mechanics and Its Applications | 11 |
| Sustainability | 11 |
| Applied Soft Computing | 9 |
| 2020 | |
| Ieee Access | 37 |
| Expert Systems with Applications | 17 |
| 2020 International Joint Conference on Neural Networks (ijcnn) | 13 |
| Soft Computing | 13 |
| Neural Computing & Applications | 11 |
| 2021 | |
| Ieee Access | 10 |
| Expert Systems with Applications | 8 |
| Computational Economics | 5 |
| Annals of Operational Research | 4 |
| Complexity | 4 |
Publisher’s Note: MDPI stays neutral with regard to jurisdictional claims in published maps and institutional affiliations. |
© 2021 by the authors. Licensee MDPI, Basel, Switzerland. This article is an open access article distributed under the terms and conditions of the Creative Commons Attribution (CC BY) license (https://creativecommons.org/licenses/by/4.0/).
Share and Cite
Warin, T.; Stojkov, A. Machine Learning in Finance: A Metadata-Based Systematic Review of the Literature. J. Risk Financial Manag. 2021, 14, 302. https://doi.org/10.3390/jrfm14070302
Warin T, Stojkov A. Machine Learning in Finance: A Metadata-Based Systematic Review of the Literature. Journal of Risk and Financial Management. 2021; 14(7):302. https://doi.org/10.3390/jrfm14070302
Chicago/Turabian StyleWarin, Thierry, and Aleksandar Stojkov. 2021. "Machine Learning in Finance: A Metadata-Based Systematic Review of the Literature" Journal of Risk and Financial Management 14, no. 7: 302. https://doi.org/10.3390/jrfm14070302
APA StyleWarin, T., & Stojkov, A. (2021). Machine Learning in Finance: A Metadata-Based Systematic Review of the Literature. Journal of Risk and Financial Management, 14(7), 302. https://doi.org/10.3390/jrfm14070302