Article

Volatility Spillover and International Contagion of Housing Bubbles

1
Department of Economics, Laval University, Québec, QC G1V 0A6, Canada
2
Department of Finance, Insurance and Real Estate, Laval University, Québec, QC G1V 0A6, Canada
3
Department of Finance, Government of Quebec, Québec, QC G1R 5L3, Canada
4
Department of Economics and Management, University Thomas Sankara, Ouagadougou 12 BP 417, Burkina Faso
*
Author to whom correspondence should be addressed.
J. Risk Financial Manag. 2021, 14(7), 287; https://doi.org/10.3390/jrfm14070287
Submission received: 24 March 2021 / Revised: 13 June 2021 / Accepted: 17 June 2021 / Published: 23 June 2021
(This article belongs to the Section Applied Economics and Finance)

Abstract

:
This paper provides new empirical evidence on housing bubble timing, volatility spillover, and bubble contagion between Japan and its economic partners, namely, the United States, the Eurozone, and the United Kingdom. First, we apply a generalized sup ADF (GSADF) test to the quarterly price-to-rent ratio from 1970Q1 to 2018Q4 to detect explosive behaviors in housing prices. Second, we analyze the volatility spillover in housing prices between Japan and its economic partners using the multivariate time-varying DCC-GARCH model. Third, we assess bubble contagion by estimating a non-parametric model of bubble migration with time-varying coefficients. We document two historical bubble episodes from 1970 to 2018 in Japan’s housing market. Moreover, we find evidence of volatility spillover effects and bubble contagion between Japan’s real estate market and its most important economic partners during several periods. In this context of market integration, countries need to develop coordinated real estate policies to address the risk of global real estate bubbles.

1. Introduction

In economic literature, a real estate bubble is defined as a sustained rise in housing prices that is not fueled by the fundamentals of the economy (Garber 1990; Flood and Hodrick 1990; Case and Shiller 2003; Shiller 2015). Since the 2008 financial crisis, several developed countries such as Japan have implemented macroprudential policies to stabilize house prices and prevent bubble episodes (Saita et al. 2016; Kobayashi 2016). Yet, concerns have been raised recently about Japanese real estate vulnerability with respect to housing prices outpacing economic fundamentals. In fact, from 2015 to 2018, the housing price index has risen by 8.07% in Japan while the rent index has decreased by 0.85% (OECD 2019). According to the 2018 UBS1 Global Real Estate Bubble Index (UBS 2018), which gauges the risk of a property bubble based on the housing price pattern, Tokyo was ranked the most exuberant market in the world in 2018 with a score of 2.03, far above the critical score of 1.5. Moreover, the 2019 Bloomberg report on the world’s housing bubbles indicated that the housing market of Japan was moderately at risk of a bubble in the first quarter of 2019 (Bloomberg 2019). While previous literature was largely focused on detecting bubbles and stamping bubble emergence and duration without addressing market interconnectedness (Phillips et al. 2011, 2015; Engsted and Pedersen 2015; Zhou and Sornette 2003; Gürkaynak 2008; Agnello and Schuknecht 2011; Kholodilin et al. 2014; Engsted and Pedersen 2015; Engsted et al. 2016; Chen and Xie 2017), the issue of price volatility spillover and bubble contagion between connected real estate markets has become the major issue in recent studies. Recent reports by International Monetary Fund (Hirata et al. 2013; Alter et al. 2018; Katagiri 2018) suggest that global integration has entailed a risk of global property market synchronization, which is recognized as house-price synchronized co-movements in major capital cities. Theoretically, the volatility spillover and bubble contagion of housing prices hypothesis exist mainly because of the connectivity of markets, the openness of trade, and the international mobility of capitals, which allow real estate investors to move the supply and demand of housing from one market to another (Richter and Werner 2016). In addition to this transaction channel, Richter and Werner (2016) also suggested three other channels of international capital flows on housing markets which are direct credit, indirect channel, and interest rate. Empirical evidence of bubble migration between regional housing markets has been highlighted in several countries, including the United States (Xie and Chen 2015; Phillips and Yu 2011; Cohen and Zabel 2020), China (Deng et al. 2017), New Zealand (Greenaway-McGrevy and Phillips 2016), Israel (Caspi 2017), and Canada (Rherrad et al. 2019, 2020). Other papers also found evidence of international transmission of housing prices (Gomez-Gonzalez et al. 2018; Engsted et al. 2016; Bago et al. 2021). Gomez-Gonzalez et al. (2018) suggested that housing bubbles have only migrated from the US housing market to European countries while Bago et al. (2021) showed evidence of bubble transmission within some Eurozone real estate markets, including the United Kingdom. However, none of these articles examined the transmission of real estate bubbles originating in Japan, leaving this component of international bubble transmission unexplored. Regarding regional volatility spillover, a recent paper by Chen and Chiang (2020) found evidence of time-varying spillovers between six major cities in China. Wong et al. (2007) also found a similar result regarding volatility spillovers between the spot and forward (pre-sale) index returns in the Hong Kong real estate market. More generally, price contagion has also been studied in several other contexts such as oil markets (Nyangarika et al. 2018; Mikhaylov 2018.), energy markets (An et al. 2020), currency markets (Omrane and Hafner 2009), and cryptocurrency markets (Hafner 2020). These papers contribute to shedding light on price transmission between connected markets. However, none of these studies combined volatility spillover analysis and bubble contagion estimated with robust econometric models to present a comprehensive picture of the connectedness of international property markets.
The aim of this paper is three-fold. First, we date-stamp housing bubbles in international housing markets. Second, we analyze housing-price volatility association between Japan and its main economic partners, the United States, the Eurozone, and the United Kingdom. Besides China2, these economies represent the largest Global Real Estate Investment Market (GRIM) in the world in 2019 (Teuben and Neshat 2020). Third, we assess bubble contagion between Japan and its economic partners. From the original work of Kindleberger and Aliber (2005) to the recursive tests’ procedure for explosive behavior of Phillips et al. (2011, 2015), robust empirical methods have been developed to identify the presence of bubbles in time series. Researchers have also developed empirical models to evaluate bubble migration between real estate markets. In order to analyze the volatility of time series when the volatility varies over time and applied in several studies, the DCC- GARCH model, developed by Engle (2002), has been largely applied (Celık 2012; Dreger and Zhang 2013; Kohn and Pereira 2017; Bala and Takimoto 2017; Panda and Nanda 2018; Corbet et al. 2019; Akkoc and Civcir 2019). For bubble contagion, the most popular approach used to assess it is the non-parametric model with time-varying coefficients developed by Greenaway-McGrevy and Phillips (2016) and applied by Hu and Oxley (2018).
In this paper, we apply the generalized sup ADF (GSADF) test developed by Phillips et al. (2015) to the quarterly price-to-rent ratio from 1970Q1 to 2018Q4 to detect explosive behaviors in housing prices. Subsequently, we analyze the volatility spillover between Japan and its economic partners using the multivariate time-varying DCC-GARCH model developed by Engle (2002). Third, we estimate real estate bubble contagion using Greenaway-McGrevy and Phillips’s (2016) non-parametric model with time-varying coefficients. Our methodology is related to previous studies in the literature that have documented the existence and migration of episodic bubbles in housing markets (Case and Shiller 2003; Fraser et al. 2008; Schwartz 2009; Gelain and Lansing 2014; Engsted and Pedersen 2015; Engsted et al. 2016; Greenaway-McGrevy and Phillips 2016; Caspi 2017; Hu and Oxley 2018; Rherrad et al. 2019, 2020). It is important to mention that controlling for economic fundamentals is critical to identify actual bubble episodes in real estate markets (Phillips et al. 2015). Most of the studies in the literature, aiming at detecting housing bubbles, used price-to-rent ratio to account for the economic fundamentals (see Phillips and Yu 2011; Yiu et al. 2013; Gomez-Gonzalez et al. 2015, 2018; Greenaway-McGrevy and Phillips 2016; Hu and Oxley 2018; Shi et al. 2016; Rherrad et al. 2019, 2020). As in these papers, an explosive behavior in price-to-rent ratio is considered a sufficient condition for the existence of a bubble.
More specifically, our paper is close to that of Hu and Oxley (2018) who first provided empirical evidence about the timeline of Japan’s housing market bubble. Hu and Oxley (2018) found evidence that bubbles in the stock market migrate to the real estate market. Previous papers such as Ito and Iwaisako (1995) and Lee (1995) have also indicated that the Japan real estate market was overheated. However, none of these papers investigated the possibility of volatility spillover and bubble contagion of real estate prices between Japan and its economic partners. Thus, we contribute to the literature by (i) testing for volatility spillover of housing prices between Japan and United States, Eurozone, and United Kingdom and (ii) testing for international bubble transmission.
Our results indicate that Japan has experienced two historical bubble episodes for the period from 1970 to 2018. We found that Japan experienced two bubbles from 1989Q1 to 1990Q4 and 2000Q2 to 2006Q4. Moreover, we found evidence of volatility spillover effects and bubble migration between the real estate markets of Japan and its most important economic partners during several periods.
The rest of the paper is organized as follows. Section 2 presents the data used in this paper. Section 3 presents our empirical models for detecting the episodes of bubbles, investigating volatility spillover and bubble migration. Section 4 shows and discusses our empirical results, and Section 5 concludes.

2. Data

The data used in this paper were retrieved from OECD3 housing price indicators (OECD 2019) of Japan, the United States, the Eurozone, and the United Kingdom. Our database contains two housing price indicators. The first is the real house price which is the ratio of nominal price to the consumers’ expenditure deflator, both seasonally adjusted, from the OECD national accounts database (see OECD 2019). As indicated in the OECD database, the nominal house price covers the sale of newly built and existing dwellings, following the recommendations from the Residential Property Price Indices manual. The second is the price-to-rent ratio which is the nominal house price divided by the rent price. This measure is considered as an indicator of the profitability of house ownership. The rent is commonly used in the literature of bubble detection as a proxy of economic fundamentals (Phillips and Yu 2011; Yiu et al. 2013; Gomez-Gonzalez et al. 2015, 2018; Greenaway-McGrevy and Phillips 2016; Hu and Oxley 2018; Shi et al. 2016). The OECD housing price indicators are indexes with the base year 2015.
Figure 1a gives an observational view of the evolution of the price-to-rent ratios and the real price indexes in Japan. We also present the real estate prices of the main partners of Japan, the United States (Figure 1b), the Eurozone (Figure 1c), and the United Kingdom (Figure 1d). Figure 1a indicates that Japan has experienced a non-monotonous housing price increase between 1980 and 2002. However, since 2003, housing real price and price- to-rent ratio have started a decreasing path.
The picture is different for the real estate markets of the United States, the Eurozone, and the United Kingdom. Figure 1b–d suggest that housing price-to-rent ratios (and real prices) have registered a substantial increase in different periods in the United States, the Eurozone, and the United Kingdom, respectively.
Table 1 presents the descriptive statistics for the price-to-rent ratios in Japan and its main partners: the United States, the Eurozone, and the United Kingdom. On average, the price-to-rent ratio in Japan appears to be roughly higher (128.2) compared to its partners: the United States, (99.02), Eurozone (95.11), and the United Kingdom (69.13).
In Table 2, we analyze the stationarity of price-to-rent series. The results of the four stationarity tests (ADF, KPSS, and PP) clearly indicate that the price-to-rent ratios contain unit roots.

3. Methodology

3.1. Test for Explosive Behavior and Bubble Episodes

We rely on the generalized sup ADF (GSADF) test developed by Phillips et al. (2015) to analyze the explosive behavior of housing prices in Japan. The method consists in performing a unit root test on the following equation:
Δ y t = α + β y t 1 + i = 1 K γ i Δ y t 1 + ε t
where y t is the property price indicator at period t , α is the intercept, K is the optimal lag order, and ε c ,   t is the error term. If β = 0 , the time series is considered to have a normal unit root, while β > 0 implies an explosive behavior for the time series. The generalized sup ADF (GSADF) consists of repeated estimation of Equation (1) on subsamples of data in a recursive fashion and is based on global backward supremum ADF statistics of the form:
G S A D F ( r 0 ) = sup r 2 [ r 0 , 1 ] r 1 [ 0 , r 2 r 0 ] A D F r 1 r 2
The backward SADF (BSADF) statistic, which is used for determining the origination and collapse of each bubble, was defined by Phillips et al. (2015) as the sup value of the ADF statistic sequence:
B S A D F r 2 ( r 0 ) = sup r 1 [ 0 , r 2 r 0 ] A D F r 1 r 2
where r 0 is the minimum window size; r 1 is the starting point, which varies from 0 to r 2 r 0 ; and r 2 is the ending point, which varies from r 0 to 1. The minimum window size r 0 is determined according to the formula 0.01 + 1.8 T proposed by Phillips et al. (2015).
Phillips et al.’s (2015) procedure consists in estimating Equation (1) and then calculating repeatedly the ADF statistics on a sequence of backward expanding subsamples. Then, it computes the critical values with a wild bootstrap as suggested by Harvey et al. (2016) to account for the presence of heteroscedasticity and avoid spurious detection of bubbles. The maximum value of the estimated ADF statistics (BSADF) is used to determine if there is a bubble in each subperiod. The maximum of these BSADF statistics is the GSADF.

3.2. Multivariate DCC-GARCH Model for Volatility Spillover

First, we use the multivariate DCC-GARCH model developed by Engle (2002) to analyze the degree of connectedness between the markets. The DCC representation was introduced by Engle (2002) to capture the empirically observed dynamic temporal correlations of prices between two markets.
The estimation of Engle’s (2002) GARCH-DCC model involves two steps: the first step estimates a univariate GARCH model for each price, while the second estimates the time-varying conditional correlations between the pairs of markets. The procedure reads as follows. Let us consider two markets, A and B. In the first step, the bivariate DCC-GARCH model can be written as follows:
( Δ y A , t Δ y B , t ) = ( μ A ,   t μ B ,   t ) + Ω t 1 2 ( ε A ,   t ε B ,   t )
where   { Ω t = D t R t D t R t = ( d i a g ( Q t ) ) 1 / 2 Q t ( d i a g ( Q t ) ) 1 / 2 D t = d i a g ( ω A A , t ,   ω B B , t )
where ( Δ y A , t Δ y B , t ) is the vector of past observations of the property price variation, Ω t is the bivariate conditional variance, ( μ A ,   t μ B ,   t ) is the vector of conditional means, ( ε A ,   t ε B ,   t ) is the vector of standardized residuals, R t is a 2 × 2 symmetric dynamic correlations matrix, and D t is a diagonal matrix of conditional standard deviations for mean series, obtained from estimating a univariate GARCH model with ω i i on the ith diagonal, i ϵ { A ,   B } . Intuitively, Equation (4) considers two markets A and B where price variations can be correlated over time.
In the second step, the DCC representation focuses on the dynamic evolution of the correlations’ matrix R t in Equation (5) to test this hypothesis. From Engle (2002), the correlations’ matrix R t is defined as follows:
Q t = ( 1 γ ) Q ¯ + γ Q t 1 + η i , t 1 η j , t 1
R t = Q t 1 Q t Q t 1
where Q t = [ q i j , t ] is a 2 × 2 time-varying covariance matrix of standardized residuals η j , t = ε i , t ω i , t , Q ¯ is the unconditional correlations of η i , t η j , t , and and γ are non-negative scalar parameters that satisfy a stability constraint of the form + γ < 1 . Q t 1 = [ q i j , t ] = q i i , t , and i ϵ { A ,   B } is a diagonal matrix with the square root of the diagonal element of Q t .
For a pair of markets A and B, the conditional correlation at time t , which captures the connection between the two markets, is computed as follows:
ρ A B , t = ( 1 γ ) q ¯ A B + γ q A B , t 1 + η A , t 1 η B , t 1 [ ( 1 γ ) q ¯ A A + η A , t 1 2 + γ q A A , t 1 ] 1 / 2 [ ( 1 γ ) q ¯ B B + η B , t 1 2 + γ q B B , t 1 ] 1 / 2
The parameters are estimated using the quasi-maximum likelihood method (QMLE) under the Gaussian assumption (Bollerslev et al. 1988). If ρ A B , t > 0 during a period t, the real estate markets A and B are positively associated in terms of price volatility. Although the DCC-GARCH allows for detecting the correlation in price volatility, it does not allow detecting bubble contagion consistently (Orskaug 2009). This leads researchers to focus on a more recent non-parametric method using local kernel regressions developed by Greenaway-McGrevy and Phillips (2016) to determine the presence of bubble contagion between the real estate markets (see Caspi 2017; Hu and Oxley 2018; Gomez-Gonzalez et al. 2018; Rherrad et al. 2019, 2020).

3.3. Non-Parametric Model with Time-Varying Coefficient for Bubble Contagion

In order to analyze bubble migration between Japan and its economic partners, we used the non-parametric regression with time-varying coefficient developed by Greenaway-McGrevy and Phillips (2016). Let us consider two markets, A and B. The non-parametric regression specified by Greenaway-McGrevy and Phillips (2016) is:
β ˜ B , t = δ t , T β ˜ A , t d + ε t
where β ˜ k , t = β ^ k , t 1 T ω + 1 t = ω T β ^ k , t .
Intuitively, Equation (8) suggests that prices in region B at time t  ( β ˜ B , t ) depend on prices in region A from a past period td ( β ˜ A , t d )   with a parameter δ t , T , d being the optimal lag before prices in region A affect those in region B. If δ t , T = 0 , that will suggest that prices do not transmit between these markets during this period, and if δ t , T > 0 , the two markets are connected in terms of price transmission. As explained by Greenaway-McGrevy and Phillips (2016), a housing price transmission period indicated that these markets are connected during this period, and if a bubble rises, that will lead to bubble contagion.
From Greenaway-McGrevy and Phillips (2016), the time-varying coefficient δ is estimated by local kernel regression such that:
δ ^ ( r ; h , d ) = j = ω + d T K h j ( r ) β ˜ B , j β ˜ A , j d j = ω + d T K h j ( r ) β ˜ A , j d 2
where K h j ( r ) = 1 h K ( j / T r h ) ,   K ( . ) = ( 2 π )   1 / 2 e 1 2 ( . ) is a Gaussian kernel, h is the bandwidth, r is the fraction date, and d is the lag.

4. Empirical Results

4.1. Bubble Detection

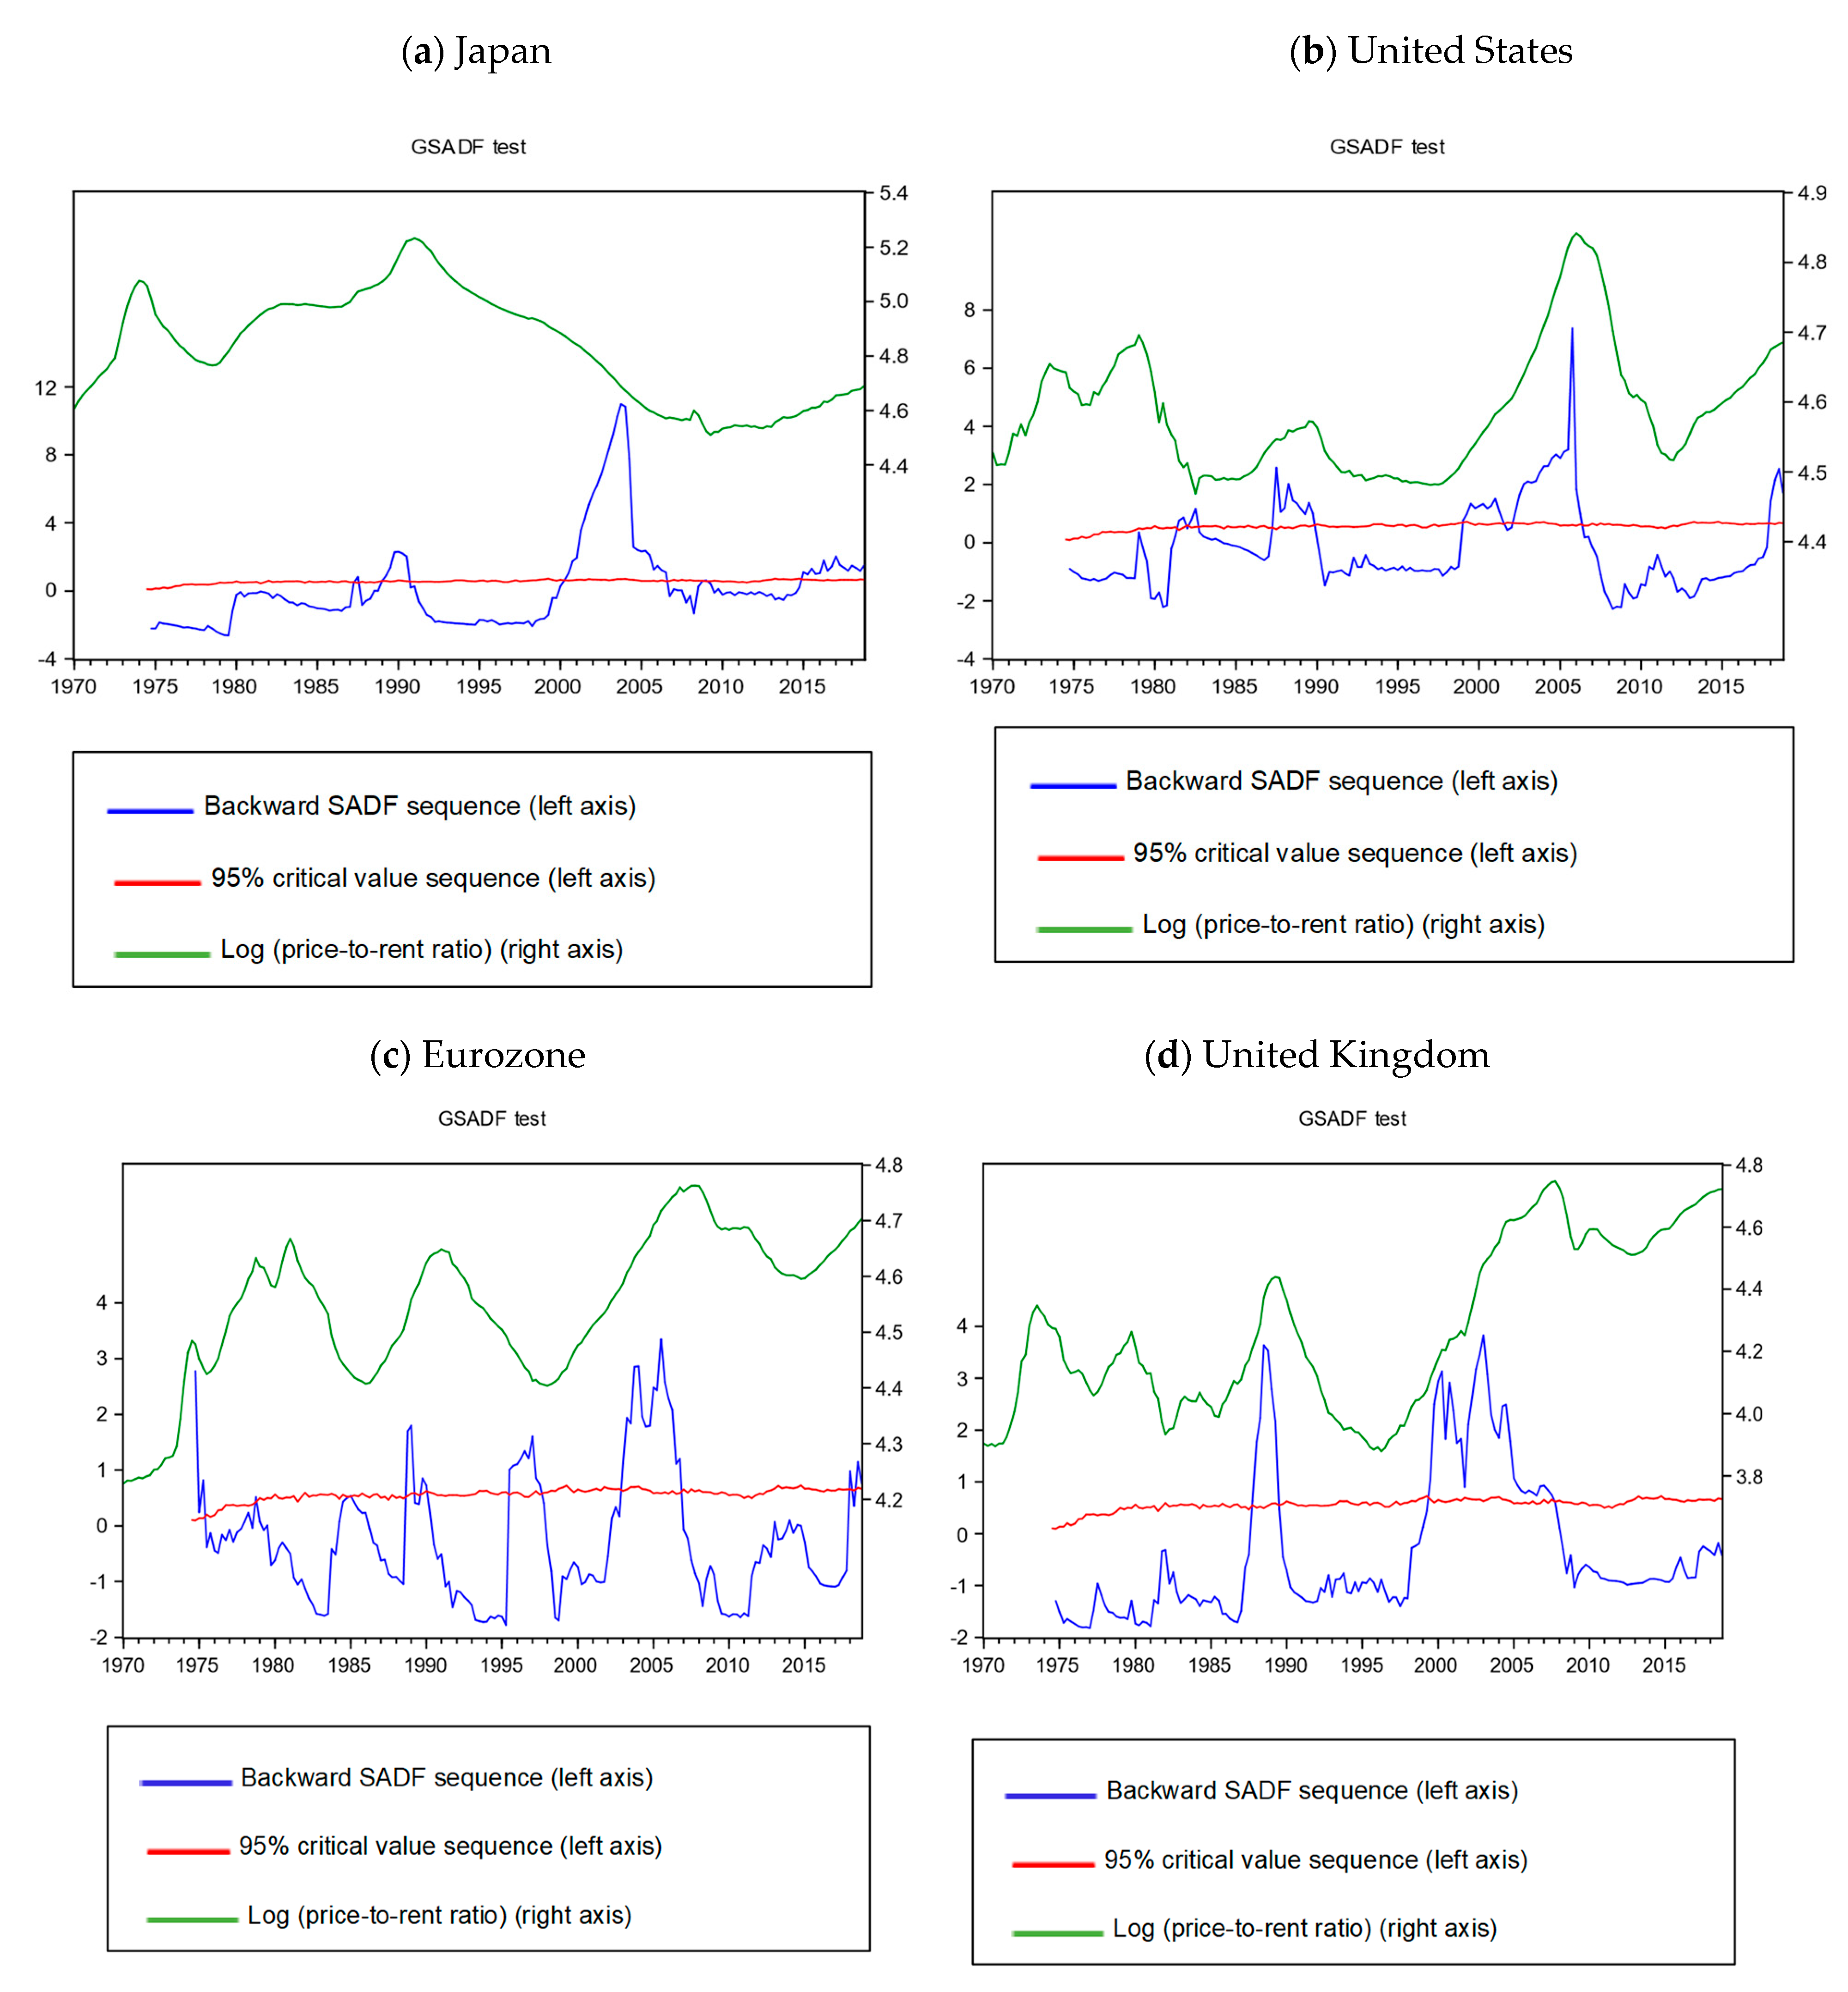
The results of the GSADF test for price exuberance are presented in Table 3 for Japan, the United States, the Eurozone, and the United Kingdom. The test revealed an overall explosive behavior during the period 1970–2018 for all the markets. Bubble timelines are presented in Figure 2a–d for Japan, the United States, the Eurozone, and the United Kingdom, respectively. Figure 2a shows that Japan experienced two bubbles from 1989Q1 to 1990Q4 and 2000Q2 to 2006Q4, with a peak in 2003Q4. Compared to the previous results, this first episode of the bubble is well within the one previously detected by Hu and Oxley which was from 1987Q2 to 1992Q2, using Japan data between 1970Q1 and 1999Q4 (base 2010 = 100). For the markets of the United States, the Eurozone, and the United Kingdom, episodes of speculative bubbles were observed as well. The results in Figure 2b suggest that the real estate market of the United States contained bubbles during the periods of 1981Q2–1989Q3 and 1999Q2–2006Q2. The market of the Eurozone (Figure 2c) also experienced three bubbles during the periods of 1988Q4–1990Q1, 1995Q3–1997Q4, and 2003Q1 to 2006Q4. In the United Kingdom, two bubble episodes were observed from 1987Q4 to 1989Q3 and 1999Q3 to 2007Q4. For recent years, our results indicate that the United States and the Eurozone are also entering bubble territory since 2017Q4 and 2018Q2, respectively, while the United Kingdom and Japan remain cool.

4.2. Price Volatility Spillover Effects

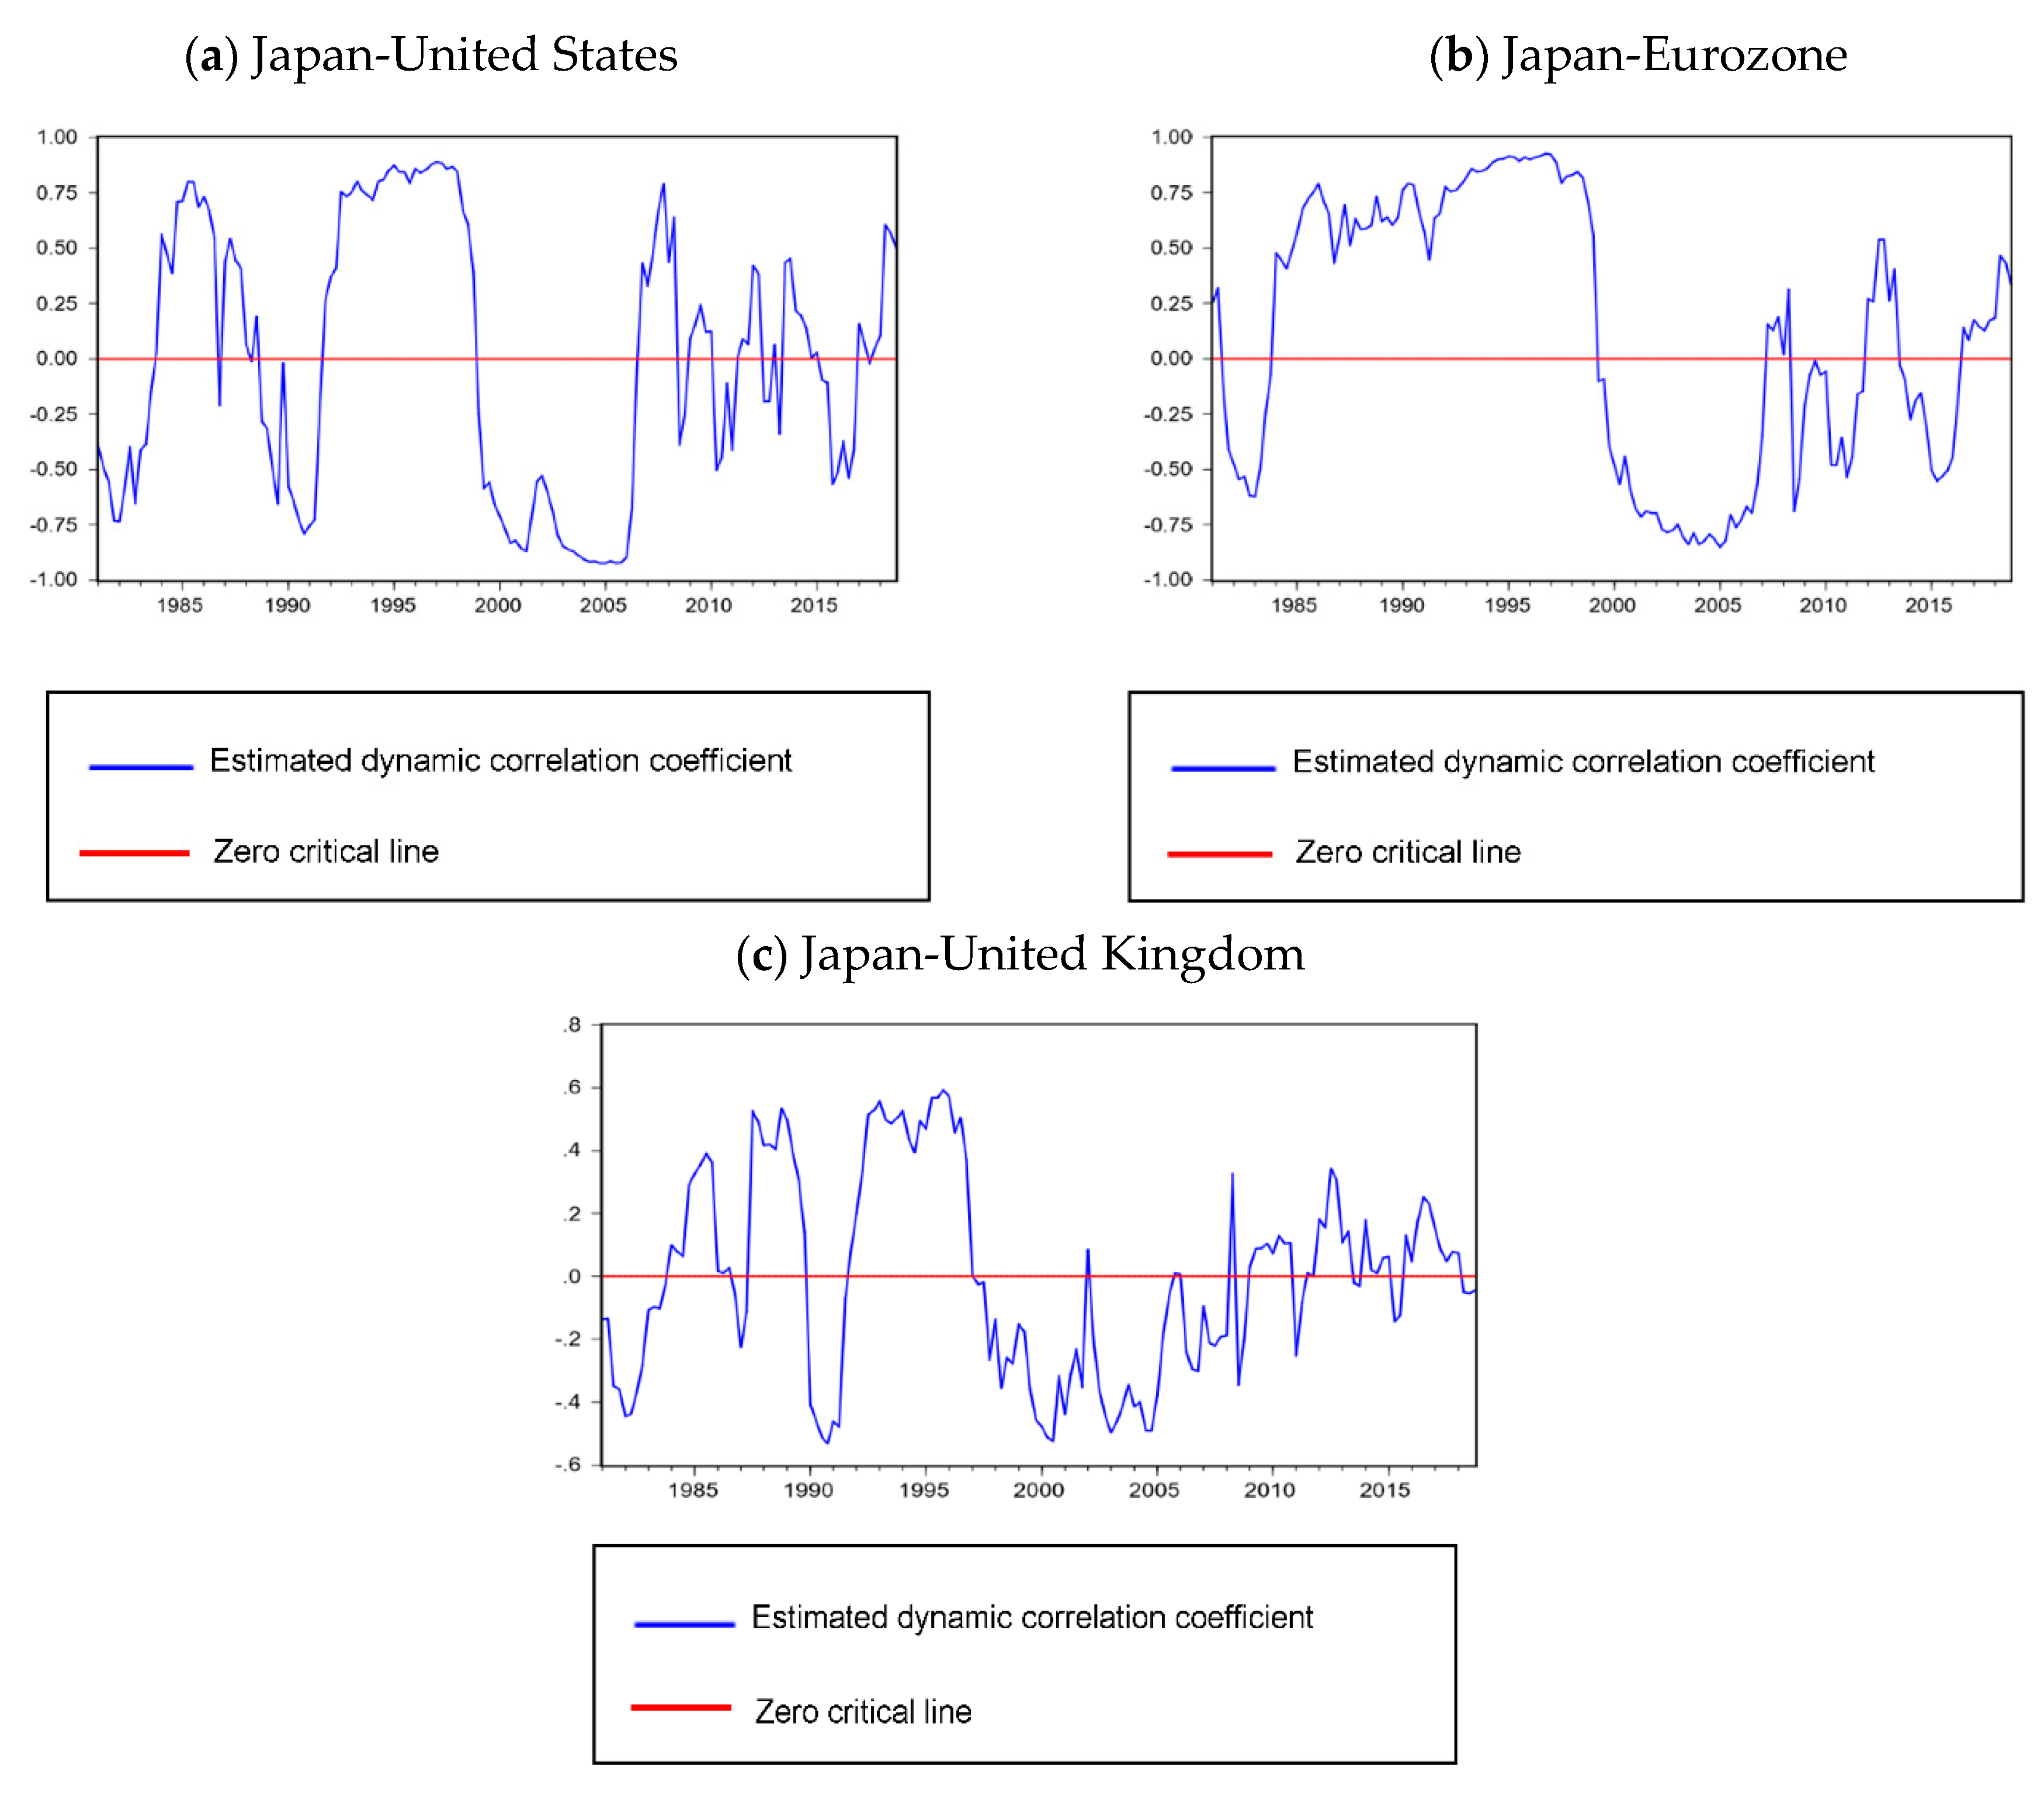
In this section, we present the DCC-GARCH estimates of housing price volatility transmission between Japan and its partners. The DCC-GARCH correlations for pairs of markets are presented in Figure 3a for Japan–Eurozone, Figure 3b for Japan-United Kingdom, and Figure 3c for Japan–United States. It is important to mention that DCC-GARCH correlations do not necessarily imply causal relationships.
Figure 3a indicates that, the real estate markets of Japan and the United States exhibit a positive relationship among the prices’ volatility before 1998Q2 except for the period 1988Q1 to 1991Q4. This implies that an increase in volatility in one price is positively associated with an increase in volatility of the other price during that period. The relationship was negative between Japan and the United States during the period 1998Q3 to 2007Q1. A negative conditional correlation suggests the existence of a negative volatility spillover which is a reverse connection in terms of price exuberance between the two markets during this period (Steeley 2006; Conrad and Karanasos 2010). Such a negative connection in price volatility can be related both to transaction shifts of housing demand and economic uncertainties among real estate investors who tend to diversify their investments. After 2007Q1, the connection varied over time with the larger part in the positive area. Overall, for most of the period studied except 1988Q1 to 1991Q4, we observed a positive association between the markets of Japan and the USA in terms of housing price volatility. The same picture was observed between Japan and the Eurozone (see Figure 3b), where price volatility in the two markets was positively correlated between 1983Q4 and 1999Q1. Since 2009Q2, the connection has fluctuated between positive and negative. For the pair Japan–United Kingdom (Figure 3c), we observed that the conditional correlation has been fluctuating between positive and negative, with a larger part in the positive area.

4.3. Bubble Contagion

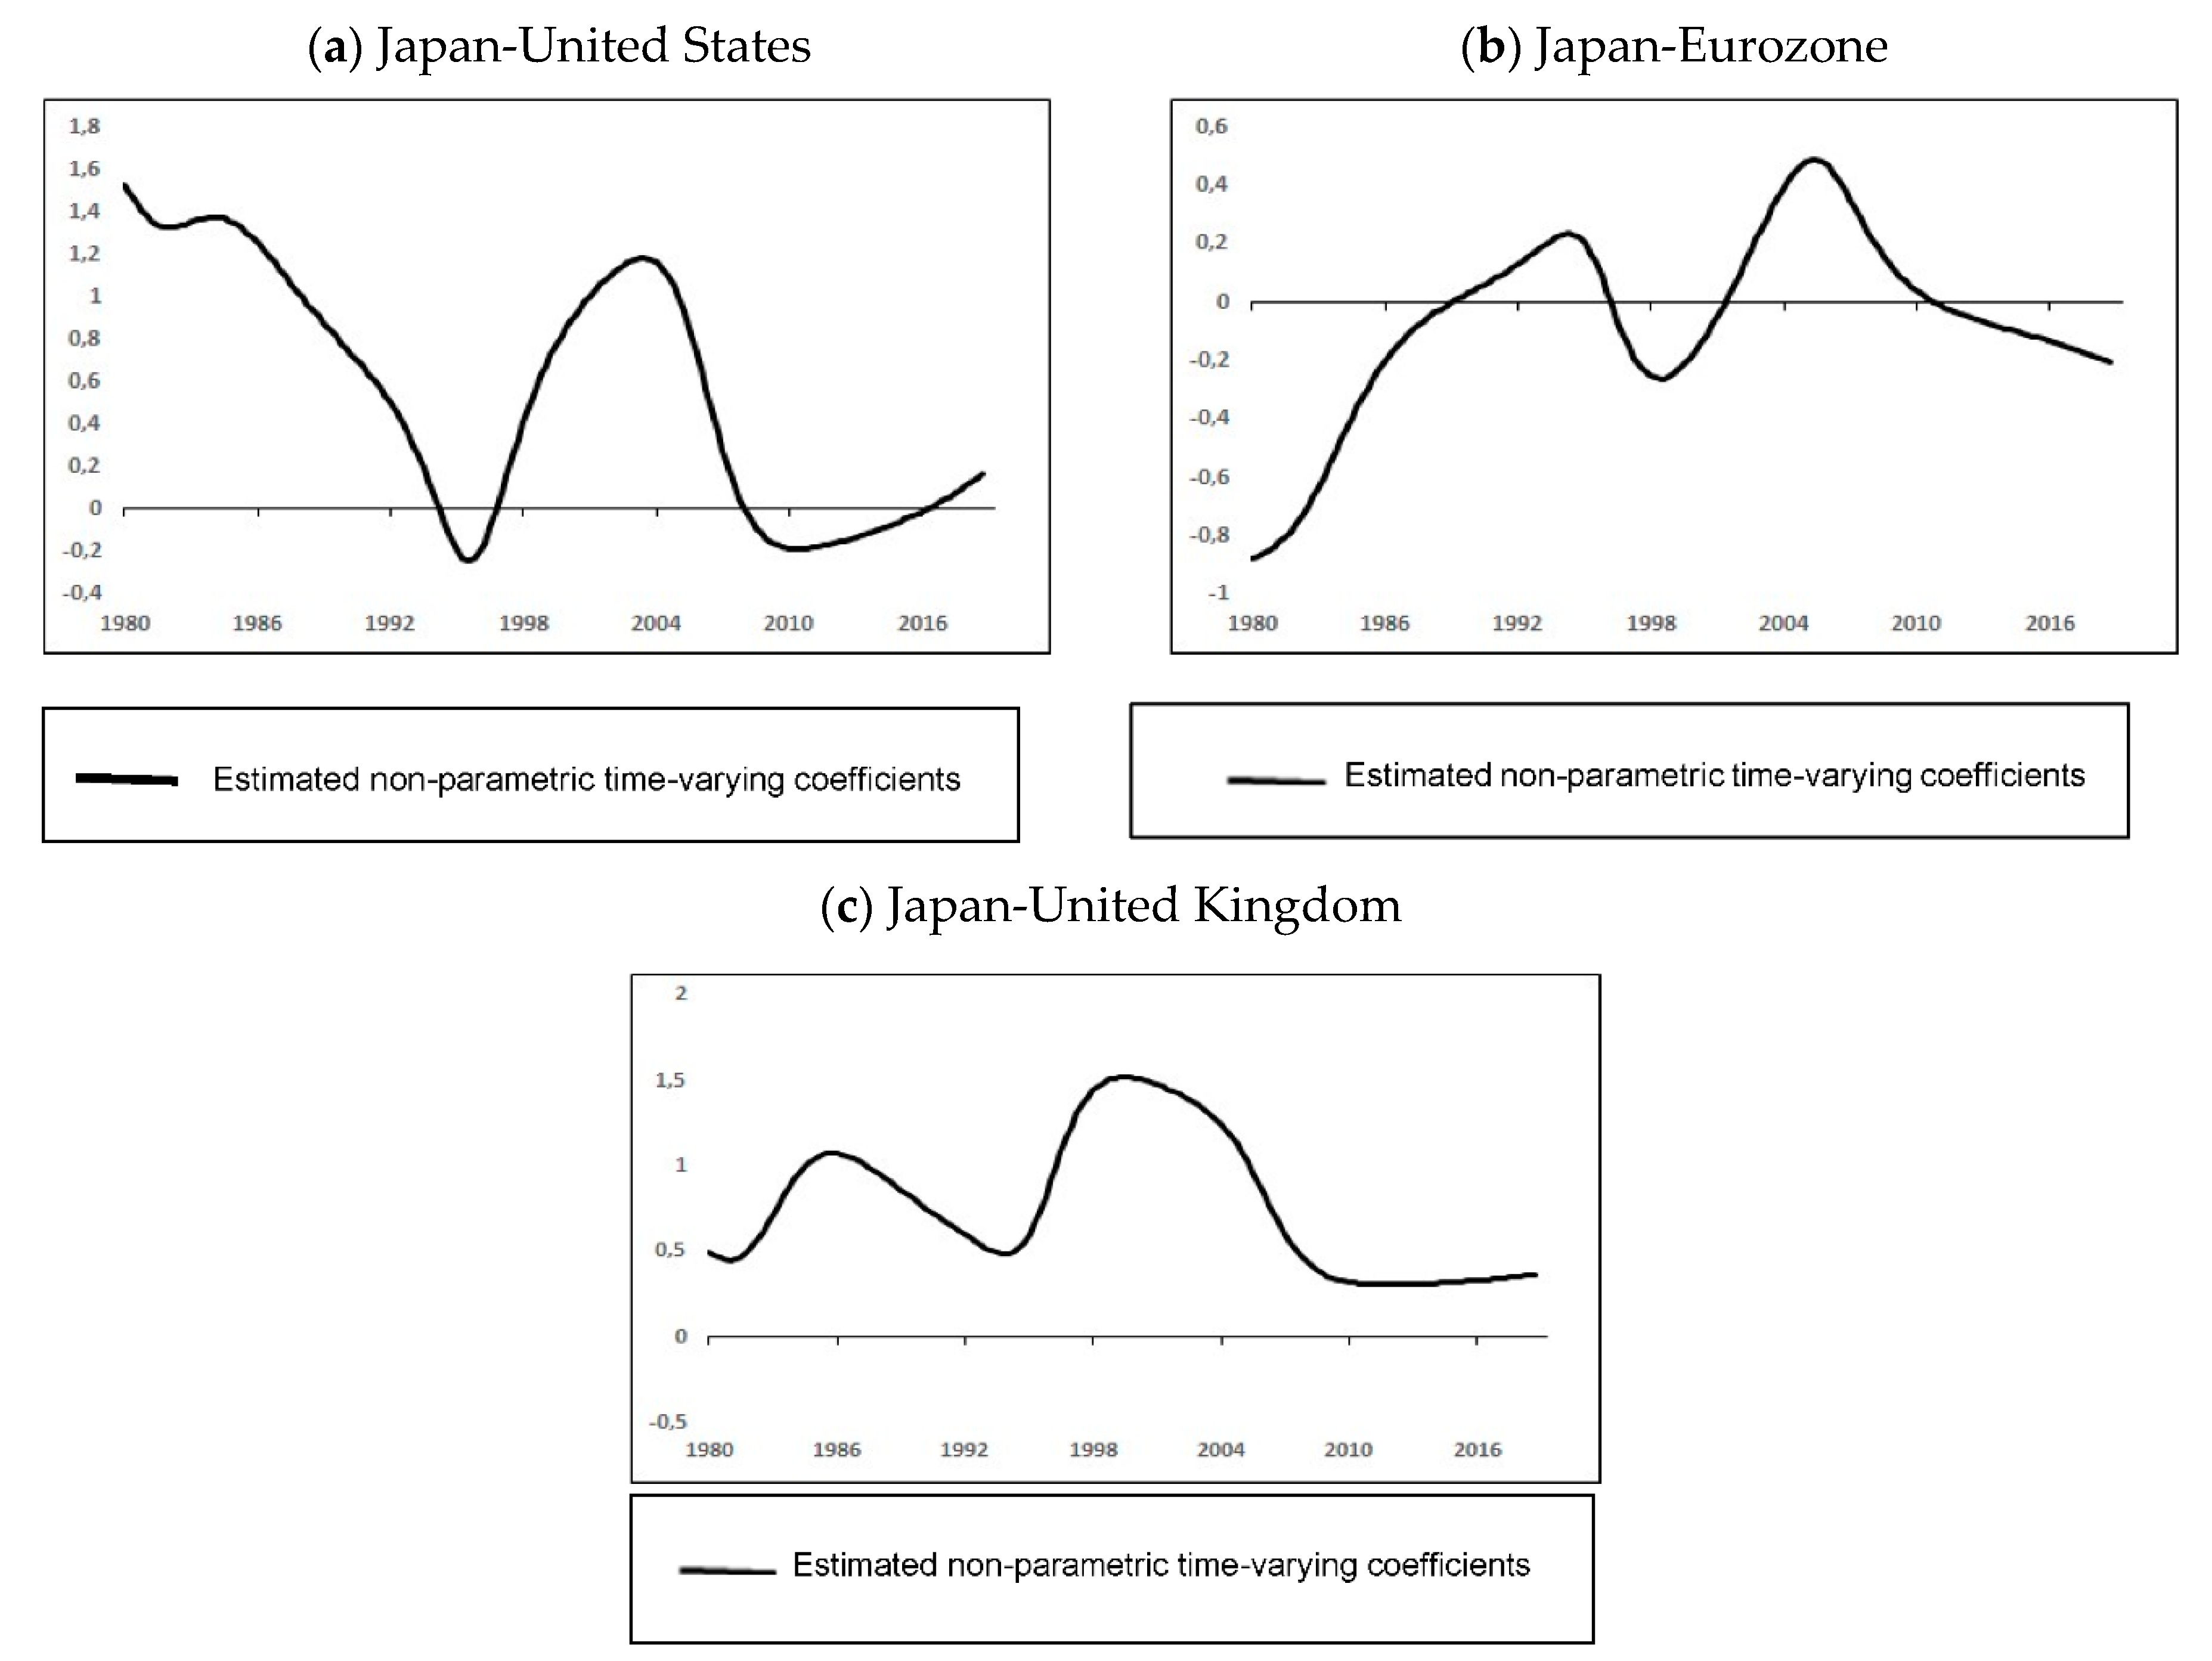
In this section, we report the non-parametric time-varying coefficients of real estate bubble contagion estimated from Greenaway-McGrevy and Phillips (2016) in Figure 4. A pair of markets are correlated in terms of bubble transmission when the estimated non-parametric coefficient is positive during that period. Figure 4a reports the Japan–US housing price transmission, Figure 4b the Japan–Eurozone connection, and Figure 4c the Japan–UK connection. First, we observe that the real estate market connection between Japan–United States and Japan–United Kingdom is positive in the most important part of the period, except for some short periods, while the connection between Japan and the Eurozone presents an “M shape”. Specifically, we observe that the markets of Japan and the United States were connected for the periods of 1970Q1 to 1994Q4, 1997Q1 to 2007Q4, and 2016Q2 to 2018Q4. A small negative connection is observed from 1995Q1 to 1996Q4 and 2008Q1 to 2016Q1. In Figure 4c, the results indicate that the real estate markets of Japan and the United Kingdom are strongly connected over the entire period, suggesting housing price contagion between these markets over the period 1970–2018. Finally, we find that the connection between the Japanese and Eurozone housing markets is less clear-cut, exhibiting an M shape. The two markets were connected during the periods of 1989Q2 to 1996Q1 and 2001Q3 to 2010Q3, indicating that housing prices were transmitted during this period. A plausible explanation of the negative connection is a shift in housing demand due to the attractiveness of the market, which will lead to an increase in demand in the newly attracted markets and a decrease in prices in the original market. For instance, when the Japanese property market becomes attractive (for any political, economic, or fiscal reason, etc.), buyers may move from Europe to Japan, causing house prices to rise in Japan and fall in Europe and vice versa. Overall, these results suggest that the real estate market of Japan was connected to the markets of the United States, the Eurozone, and the United Kingdom over several periods.

5. Conclusions

In this paper, we used nationally representative housing price-to-rent ratios to identify episodic bubbles in the real estate market of Japan. We applied Phillips et al.’s (2015) GSADF test for explosive behavior detection. The results indicate that, overall, Japan’s real estate market was exuberant during the period 1970–2018. Analyzing the bubble timeline, we found that Japan experienced two historical bubbles from 1989Q1 to 1990Q4 and 2000Q2 to 2006Q4, with a peak in 2003Q4.
The validity of the bubble detection can be assessed by comparing it with previous literature. For Japan, it can be observed that the first bubble episode identified in this paper interestingly falls within the housing bubble previously identified by Hu and Oxley (2018), which occurred from 1987Q2 to 1992Q2, despite using indexes with base 2010 = 100. For the United States, Gomez-Gonzalez et al. (2018) previously detected two bubbles in the US housing markets, which are close to the ones we detected. The first bubble detected by Gomez-Gonzalez et al. (2018) in the United States market occurred from 1981Q1 to 1982Q4 (1981Q2–1989Q3 in this paper) and the second from 1998Q2 to 2007Q1 (1999Q2–2006Q2 in this paper). Gomez-Gonzalez et al. (2018) also detected two bubbles in the United Kingdom real estate market from 1988Q1 to 1989Q2 and 1999Q2 to 2000Q3. In comparison, we found two bubbles as well in the United Kingdom market which are very close to those of Gomez-Gonzalez et al. (2018) from 1987Q4 to 1989Q3 and 1999Q3 to 2007Q4. Finally, Gomez-Gonzalez et al. (2018) detected three bubble episodes in the Eurozone area during the periods 2004Q4–2006Q2, 2008Q2–2009Q3, and 2012Q2–2012Q3. While this similarity with Gomez-Gonzalez et al. (2018) suggests accurate date stamping of bubble episodes, the GSADF test used in both studies is criticized. In fact, Monschang and Wilfling (2020) argued that while Phillips et al.’s (2015) GSADF test yields more accurate estimates of the bubbles’ origination and termination dates compared to other methods such as the sign-based test statistic of Harvey et al. (2020), the procedure might date-stamp non-existing bubbles. The results of Monschang and Wilfling (2020) also suggest that the dating strategies might be sensitive to the data frequency as well.
To further investigate price dynamics, we subsequently analyzed the housing price volatility spillover and bubble contagion between Japan and the United States, the Eurozone, and the United Kingdom using Engle’s (2002) DCC-GARCH model and Greenaway-McGrevy and Phillips’s (2016) non-parametric model with time-varying coefficient. Overall, the results suggest that the market of Japan has been connected to the United States, the Eurozone, and the United Kingdom during several periods from 1970 to 2018 in terms of housing price transmission. However, the intensity of the contagion has decreased after the 2000s.
This paper contributes to the growing evidence of international transmission of price volatility and bubble contagion in international housing markets. It complements previous papers such as Gomez-Gonzalez et al. (2018) who showed that bubbles originating in the US are easily transmitted to other real estate markets around the world. Using data from the United Kingdom and five selected Eurozone countries (France, Germany, Italy, Netherlands, and Spain), Bago et al. (2021) showed that bubbles migrated between these European countries. This paper adds to this literature by showing evidence of international bubble contagion originating from Japan as well.
Markets’ integration in terms of trade and the lack of policy coordination might be the leading cause of bubble contagion (Kohn and Pereira 2017). In this context, this analysis of bubble contagion and the spread of volatility intends to raise awareness among policy makers of the global risk of worldwide real estate bubbles. To tackle these issues, countries need to develop a coordinated real estate policy, e.g., coordination of central banks’ interest rates to avoid the circulation of real estate speculators from one market to another.
Interesting avenues for future research will be to examine issues that have not been addressed in this paper especially the economic determinants of bubble contagion (trade, credit, interest rates and the lack of policy coordination).

Author Contributions

Conceptualization, J.-L.B., K.A., I.R. and E.O.; Methodology, J.-L.B., I.R.; Software, K.A. ; Validation, E.O.; Formal analysis, J.-L.B., K.A., I.R. and E.O.; Writing—original draft preparation, J.-L.B., K.A., I.R. and E.O.; Writing—review and editing, J.-L.B., K.A., I.R. and E.O. All authors have read and agreed to the published version of the manuscript.

Funding

This research received no external funding.

Institutional Review Board Statement

Not applicable.

Data Availability Statement

The data used in this paper are publicly available on https://data.oecd.org/price/housing-prices.htm.

Conflicts of Interest

The authors declare no conflict of interest.

Notes

1
Any city with a Real Estate Bubble Index over 1.5 is considered at “Bubble Risk” according to UBS (2018).
2
China is not included in our analysis because of insufficient data.
3
The OECD real estate price indexes measure the rate at which the prices of residential properties (flats, detached houses, terraced houses, etc.) purchased by households are changing over time. The data cover both new and existing dwellings, independently of their final use and their previous owners. Only market prices are considered. OECD also includes the price of the land on which residential buildings are located in the housing price index.

References

  1. Agnello, Luca, and Ludger Schuknecht. 2011. Booms and busts in housing markets: Determinants and implications. Journal of Housing Economics 20: 171–90. [Google Scholar] [CrossRef] [Green Version]
  2. Akkoc, Ugur, and Irfan Civcir. 2019. Dynamic linkages between strategic commodities and stock market in Turkey: Evidence from SVAR-DCC-GARCH model. Resources Policy 62: 231–39. [Google Scholar] [CrossRef]
  3. Alter, Adrian, Jane Dokko, Mitsuru Katagiri, Romain Lafarguette, and Dulani Seneviratne. 2018. House Price Synchronization: What Role for Financial Factors. IMF Global Financial Stability Report. Washington: IMF. [Google Scholar]
  4. An, Jaehyung, Alexey Mikhaylov, and Ulf H. Richter. 2020. Trade War Effects: Evidence from Sectors of Energy and Resources in Africa. Heliyon 6: e05693. [Google Scholar]
  5. Bago, Jean-Louis, Imad Rherrad, Koffi Akakpo, and Ernest Ouédraogo. 2021. Real Estate Bubbles and Contagion: Evidence from Selected European Countries. Forthcoming. Review of Economic Analysis 13. Available online: https://openjournals.uwaterloo.ca/index.php/rofea/article/view/1823 (accessed on 10 March 2021).
  6. Bala, Dahiru A., and Taro Takimoto. 2017. Stock markets volatility spillovers during financial crises: A DCC-MGARCH with skewed-t density approach. Borsa Istanbul Review 17: 25–48. [Google Scholar] [CrossRef]
  7. Bloomberg. 2019. Global Insight: Where Is the Next Housing Bubble Brewing? Bloomberg Economics Report. New York: Bloomberg, July 15. [Google Scholar]
  8. Bollerslev, Tim, Robert F. Engle, and Jeffrey M. Wooldridge. 1988. A capital asset pricing model with time series varying covariance. Journal of Political Economy 96: 116–31. [Google Scholar] [CrossRef]
  9. Case, Karl E., and Robert J. Shiller. 2003. Is there a bubble in the housing market? Brookings Papers on Economic Activity 2003: 299–342. [Google Scholar] [CrossRef] [Green Version]
  10. Caspi, Itamar. 2017. Rtadf: Testing for bubbles with EViews. Journal of Statistical Software 81: 1–16. [Google Scholar]
  11. Celık, Sibel. 2012. The more contagion effect on emerging markets: The evidence of DCC-GARCH model. Economic Modelling 29: 1946–59. [Google Scholar] [CrossRef]
  12. Chen, Chien-Fu, and Shu-Hen Chiang. 2020. Time-varying spillovers among first-tier housing markets in China. Urban Studies 57: 844–64. [Google Scholar] [CrossRef]
  13. Chen, Shyh-Wei, and Zixiong Xie. 2017. Detecting speculative bubbles under considerations of the sign asymmetry and size non-linearity: New international evidence. International Review of Economics & Finance 52: 188–209. [Google Scholar]
  14. Cohen, Jeffrey P., and Jeffrey Zabel. 2020. Local house price diffusion. Real Estate Economics 48: 710–43. [Google Scholar] [CrossRef]
  15. Conrad, Christian, and Menelaos Karanasos. 2010. Negative volatility spillovers in the unrestricted ECCC-GARCH model. Econometric Theory 26: 838–62. [Google Scholar] [CrossRef] [Green Version]
  16. Corbet, Shaen, Charles James Larkin, Brian Lucey, and Larisa Yarovaya. 2019. KODAKCoin: A blockchain revolution or exploiting a potential cryptocurrency bubble? Applied Economics Letters 27: 518–24. [Google Scholar] [CrossRef]
  17. Deng, Yongheng, Eric Girardin, Roselyne Joyeux, and Shuping Shi. 2017. Did bubbles migrate from the stock to the housing market in China between 2005 and 2010? Pacific Economic Review 22: 276–92. [Google Scholar] [CrossRef]
  18. Dreger, Christian, and Yanqun Zhang. 2013. Is there a bubble in the Chinese housing market? Urban Policy and Research 31: 27–39. [Google Scholar] [CrossRef] [Green Version]
  19. Engle, Robert. 2002. Dynamic conditional correlation: A simple class of multivariate generalized autoregressive conditional heteroskedasticity models. Journal of Business & Economic Statistics 20: 339–50. [Google Scholar]
  20. Engsted, Tom, and Thomas Q. Pedersen. 2015. Predicting returns and rent growth in the housing market using the rent-price ratio: Evidence from the OECD countries. Journal of International Money and Finance 53: 257–75. [Google Scholar] [CrossRef] [Green Version]
  21. Engsted, Tom, Simon J. Hviid, and Thomas Q. Pedersen. 2016. Explosive bubbles in house prices? Evidence from the OECD countries. Journal of International Financial Markets, Institutions and Money 40: 14–25. [Google Scholar] [CrossRef]
  22. Flood, Robert P., and Robert J. Hodrick. 1990. On testing for speculative bubbles. Journal of Economic Perspectives 4: 85–101. [Google Scholar] [CrossRef] [Green Version]
  23. Fraser, Patricia, Martin Hoesli, and Lynn McAlevey. 2008. House prices and bubbles in New Zealand. The Journal of Real Estate Finance and Economics 37: 71–91. [Google Scholar] [CrossRef] [Green Version]
  24. Garber, Peter M. 1990. Famous first bubbles. Journal of Economic Perspectives 4: 35–54. [Google Scholar] [CrossRef] [Green Version]
  25. Gelain, Paolo, and Kevin J. Lansing. 2014. House prices, expectations, and time-varying fundamentals. Journal of Empirical Finance 29: 3–25. [Google Scholar] [CrossRef] [Green Version]
  26. Gomez-Gonzalez, Jose Eduardo, Jair N. Ojeda-Joya, Catalina Rey-Guerra, and Natalia Sicard. 2015. Testing for bubbles in the Colombian housing market: A new approach. Desarrollo y Sociedad 75: 197–222. [Google Scholar] [CrossRef]
  27. Gomez-Gonzalez, Jose Eduardo, Juliana Gamboa-Arbeláez, Jorge Hirs-Garzón, and Andrés Pinchao-Rosero. 2018. When bubble meets bubble: Contagion in OECD countries. The Journal of Real Estate Finance and Economics 56: 546–66. [Google Scholar] [CrossRef]
  28. Greenaway-McGrevy, Ryan, and Peter C. B. Phillips. 2016. Hot property in New Zealand: Empirical evidence of housing bubbles in the metropolitan centres. New Zealand Economic Papers 50: 88–113. [Google Scholar] [CrossRef]
  29. Gürkaynak, Refet S. 2008. Econometric tests of asset price bubbles: Taking stock. Journal of Economic Surveys 22: 166–86. [Google Scholar] [CrossRef]
  30. Hafner, Christian M. 2020. Testing for bubbles in cryptocurrencies with time-varying volatility. Journal of Financial Econometrics 18: 233–49. [Google Scholar]
  31. Harvey, David I., Stephen J. Leybourne, and Yang Zu. 2020. Sign-based unit root tests for explosive financial bubbles in the presence of deterministically time-varying volatility. Economic Theory 36: 122–69. [Google Scholar] [CrossRef] [Green Version]
  32. Harvey, David I., Stephen J. Leybourne, Robert Sollis, and Robert A. M. Taylor. 2016. Tests for explosive financial bubbles in the presence of non-stationary volatility. Journal of Empirical Finance 38: 548–74. [Google Scholar] [CrossRef] [Green Version]
  33. Hirata, Hideaki, Ayhan Kose, Christopher Otrok, and Marco Terrones. 2013. Global House Price Fluctuations; Synchronization and Determinants (No. 2013/038). Washington: International Monetary Fund. [Google Scholar]
  34. Hu, Yang, and Les Oxley. 2018. Bubble contagion: Evidence from Japan’s asset price bubble of the 1980–90s. Journal of the Japanese and International Economies 50: 89–95. [Google Scholar] [CrossRef]
  35. Ito, Takatoshi, and Tokuo Iwaisako. 1995. Explaining Asset Bubbles in Japan. Technical report. Cambridge: National Bureau of Economic Research. [Google Scholar]
  36. Katagiri, Mitsuru. 2018. House Price Synchronization and Financial Openness: A Dynamic Factor Model Approach. Washington: International Monetary Fund. [Google Scholar]
  37. Kholodilin, Konstantin A., Claus Michelsen, and Dirk Ulbricht. 2014. Speculative Price Bubbles in Urban Housing Markets in Germany. DIW Berlin Discussion Paper No. 1417. Berlin: German Institute for Economic Research. [Google Scholar]
  38. Kindleberger, Charles, and Robert Aliber. 2005. Manias, Panics, and Crashes, 5th ed. Hoboken: John Wiley & Sons. [Google Scholar]
  39. Kobayashi, Masahiro. 2016. The Housing Market and Housing Policies in Japan. Technical report. Tokyo: Asian Development Bank Institute. [Google Scholar]
  40. Kohn, Maximilian-Benedikt Herwarth, and Pedro L. Valls Pereira. 2017. Speculative bubbles and contagion: Analysis of volatility’s clusters during the DotCom bubble based on the dynamic conditional correlation model. Cogent Economics & Finance 5: 1411453. [Google Scholar]
  41. Lee, Bong-Soo. 1995. Fundamentals and bubbles in asset prices: Evidence from us and Japanese asset prices. Financial Engineering and the Japanese Markets 2: 89–122. [Google Scholar] [CrossRef]
  42. Mikhaylov, Alexey Yurievich. 2018. Pricing in Oil Market and Using Probit Model for Analysis of Stock Market Effects. International Journal of Energy Economics and Policy 8: 69–73. [Google Scholar]
  43. Monschang, Verena, and Bernd Wilfling. 2020. Sup-ADF-style bubble-detection methods under test. Empirical Economics, 1–28. [Google Scholar] [CrossRef] [Green Version]
  44. Nyangarika, Anthony Msafiri, Alexey Yurievich Mikhaylov, and Bao-jun Tang. 2018. Correlation of Oil Prices and Gross Domestic Product in Oil Producing Countries. International Journal of Energy Economics and Policy 8: 42–48. [Google Scholar]
  45. OECD. 2019. Housing Prices (Indicator). Available online: https://data.oecd.org/price/housing-prices.htm (accessed on 27 June 2019).
  46. Omrane, Walid Ben, and Christian M. Hafner. 2009. Information spillover, volatility and the currency markets. International Econometric Review 1: 47–59. [Google Scholar]
  47. Orskaug, Elisabeth. 2009. Multivariate DCC-GARCH Model with Various Error Distributions. Norway: Norwegian University of Science and Technology, Department of Mathematical Sciences. [Google Scholar]
  48. Panda, Ajaya Kumar, and Swagatika Nanda. 2018. Time-varying synchronization and dynamic conditional correlation among the stock market returns of leading South American economies. International Journal of Managerial Finance 14: 245–62. [Google Scholar] [CrossRef]
  49. Phillips, Peter C. B., and Jun Yu. 2011. Dating the timeline of financial bubbles during the subprime crisis. Quantitative Economics 2: 455–91. [Google Scholar] [CrossRef] [Green Version]
  50. Phillips, Peter C. B., Shuping Shi, and Jun Yu. 2015. Testing for multiple bubbles: Historical episodes of exuberance and collapse in the S&P 500. International Economic Review 56: 1043–78. [Google Scholar]
  51. Phillips, Peter C. B., Yangru Wu, and Jun Yu. 2011. Explosive behavior in the 1990s Nasdaq: When did exuberance escalate asset values? International Economic Review 52: 201–26. [Google Scholar] [CrossRef] [Green Version]
  52. Rherrad, Imad, Jean-Louis Bago, and Mardochée Mokengoy. 2020. Real estate bubbles and contagion: New empirical evidence from Canada. New Zealand Economic Papers 58: 38–51. [Google Scholar] [CrossRef]
  53. Rherrad, Imad, Mardochér Mokengoy, and Landry Kuate Fotue. 2019. Is the Canadian Housing Market ‘Really’exuberant? Evidence from Vancouver, Toronto and Montreal. Applied Economics Letters 26: 1597–602. [Google Scholar] [CrossRef]
  54. Richter, Michael, and Johannes-Gabriel Werner. 2016. Conceptualising the Role of International Capital Flows for Housing Markets. Intereconomics 51: 146–54. [Google Scholar] [CrossRef] [Green Version]
  55. Saita, Yumi, Chihiro Shimizu, and Tsutomu Watanabe. 2016. Aging and real estate prices: Evidence from Japanese and US regional data. International Journal of Housing Markets and Analysis 9: 66–87. [Google Scholar] [CrossRef]
  56. Schwartz, Herman M. 2009. Subprime Nation: American Power, Global Capital, and the Housing Bubble. New York: Cornell University Press. [Google Scholar]
  57. Shi, Shuping, Abbas Valadkhani, Russell Smyth, and Farshid Vahid. 2016. Dating the timeline of house price bubbles in Australian capital cities. Economic Record 92: 590–605. [Google Scholar] [CrossRef]
  58. Shiller, Robert J. 2015. Irrational Exuberance: Revised and Expanded, 3rd ed. Princeton: Princeton University Press. [Google Scholar]
  59. Steeley, James M. 2006. Volatility transmission between stock and bond markets. Journal of International Financial Markets, Institutions and Money 16: 71–86. [Google Scholar] [CrossRef] [Green Version]
  60. Teuben, Bert, and Razia Neshat. 2020. Real Estate Market Size 2019: Annual Update on the Size of the Professionally Managed Global Real Estate Investment Market. New York: Morgan Stanley Capital International (MSCI). [Google Scholar]
  61. UBS. 2018. UBS Global Real Estate Bubble Index. Latest Index Scores for the Housing Markets of Select Cities. Zurich: UBS Chief Investment Office, Investment Research. [Google Scholar]
  62. Wong, Swee-Kee, Kwok Wing Chau, and Chung Yim Edward Yiu. 2007. Volatility Transmission in the Real Estate Spot and Forward Markets. Journal of Real Estate Finance and Economics 35: 281–93. [Google Scholar] [CrossRef]
  63. Xie, Zixiong, and Shyh-Wei Chen. 2015. Are there periodically collapsing bubbles in the REIT markets? Newevidence from the US. Research in International Business and Finance 33: 17–31. [Google Scholar] [CrossRef]
  64. Yiu, Matthew S., Jun Yu, and Lu Jin. 2013. Detecting bubbles in Hong Kong residential property market. Journal of Asian Economics 28: 115–24. [Google Scholar] [CrossRef] [Green Version]
  65. Zhou, Wei-Xing, and Didier Sornette. 2003. 2000–2003 real estate bubble in the UK but not in the USA. Physica A: Statistical Mechanics and Its Applications 329: 249–63. [Google Scholar] [CrossRef] [Green Version]
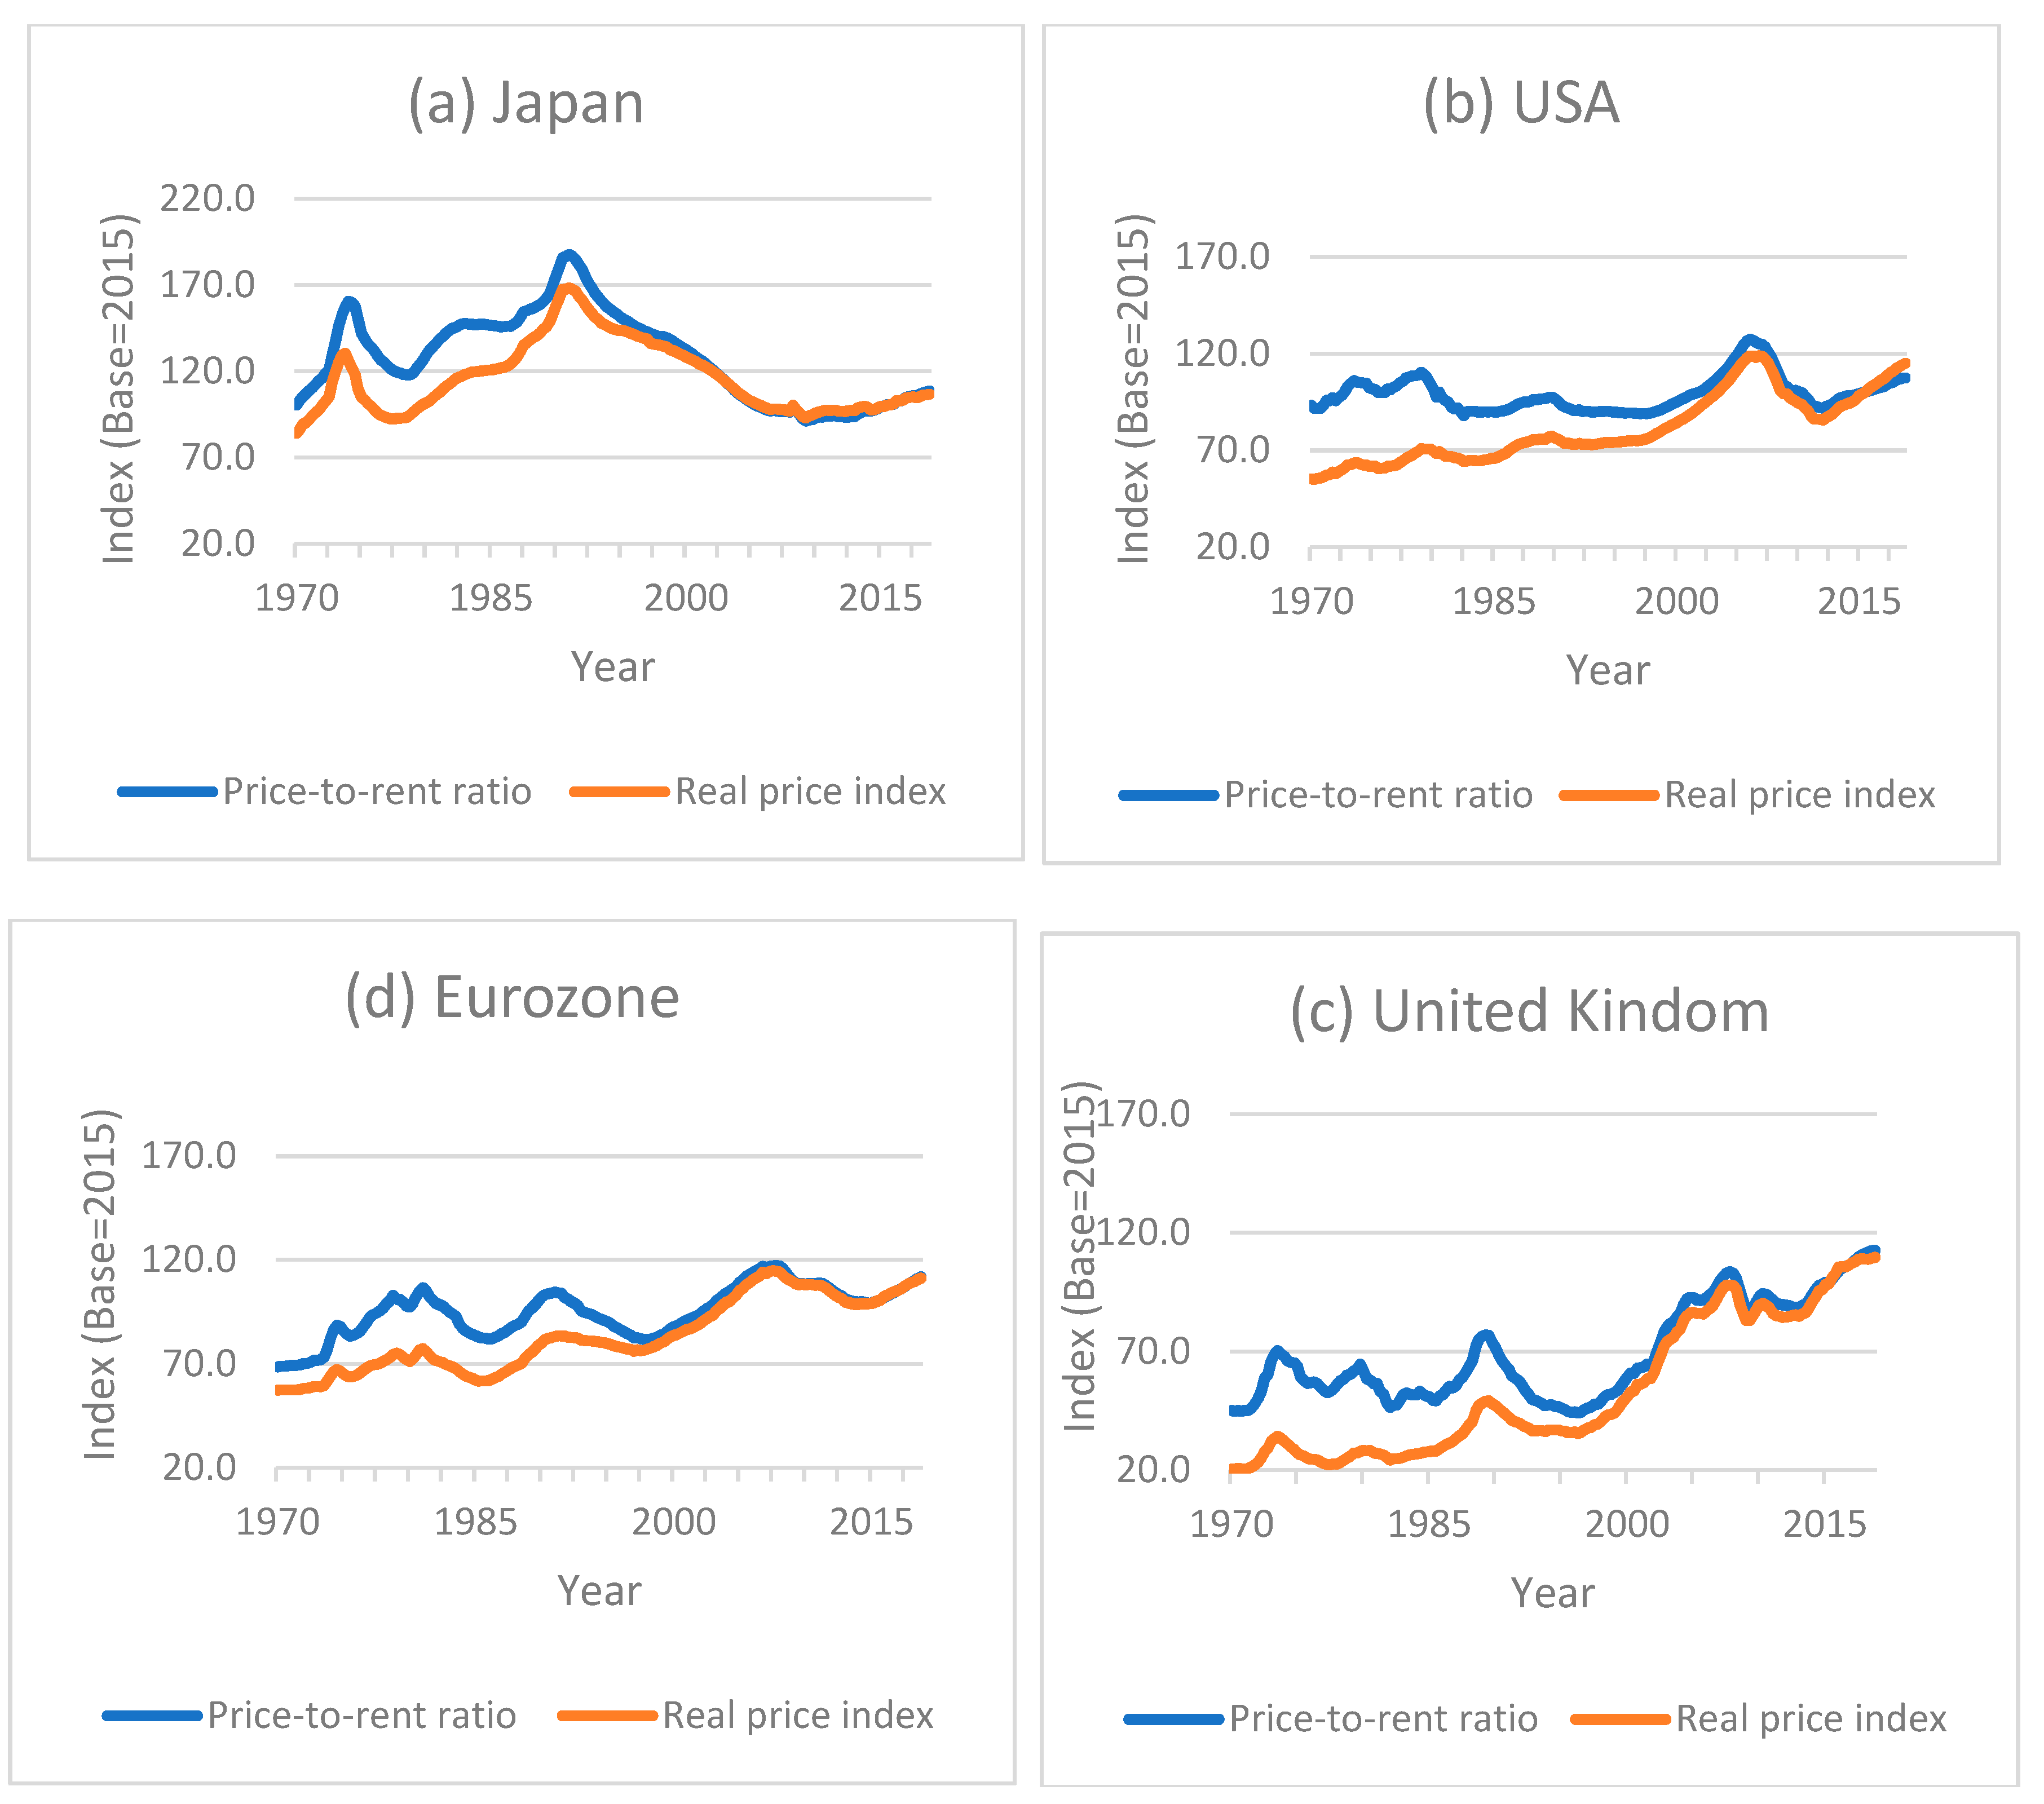
Figure 1. Evolution of price-to-rent and real price normalized indexes (base = 2015).
Jrfm 14 00287 g001
Figure 2. Real estate bubble detection using GSADF.
Jrfm 14 00287 g002
Figure 3. Housing price volatility spillover using DCC-GARCH.
Jrfm 14 00287 g003
Figure 4. Bubble contagion: the non-parametric time-varying coefficients.
Jrfm 14 00287 g004
Table 1. Descriptive statistics for the price-to-rent ratios (base = 2015).
CountryMeanSdMinMaxSkewnessKurtosis
Japan128.225.791.1187.70.272.08
United States99.029.187.9127.41.244.29
Eurozone95.1111.968.5117.1−0.332.53
United Kingdom69.1320.444.0112.50.571.92
Table 2. Unit root and stationary test.
ADFPPKPSS
CountryStatpvStatpvStatpv
Japan−1.7160.418−2.4680.3790.6380.01
United States−0.7560.774−2.2630.4650.2480.1
Eurozone−1.7800.390−1.9110.3270.7860.00
United Kingdom0.0540.959−1.9690.5880.9350.01
Table 3. GSADF test for exuberance detection in Japan, United States, Eurozone, and United Kingdom.
CountryPeriodOptimal LagsGSADFInterpretation
Japan1970Q1–2018Q4110.98 ***Presence of bubble
United States1970Q1–2018Q437.37 ***Presence of bubble
Eurozone1970Q1–2018Q453.34 ***Presence of bubble
United Kingdom1970Q1–2018Q413.83 ***Presence of bubble
Significant level: * p < 0.10, ** p < 0.05, *** p < 0.01.
Publisher’s Note: MDPI stays neutral with regard to jurisdictional claims in published maps and institutional affiliations.