Article

The Impact of Unsystematic Factors on Bitcoin Value

Libertas International University, Trg J. F. Kennedy 6b, 10 000 Zagreb, Croatia
*
Author to whom correspondence should be addressed.
J. Risk Financial Manag. 2021, 14(11), 546; https://doi.org/10.3390/jrfm14110546
Submission received: 30 September 2021 / Revised: 5 November 2021 / Accepted: 5 November 2021 / Published: 11 November 2021
(This article belongs to the Special Issue Financial Markets in Times of Crisis)

Abstract

:
The results of empirical analyses confirm that analysed unsystematic factors, the Stock-to-Flow index (S2F), and information on the Bitcoin (BTC) are directly correlated with BTC values. These results are expected and in line with the economic theory; however, this research paper aimed to investigate the impact of unsystematic factors on the value of decentralised virtual cryptocurrency BTC. Its aim was also to analyse the reasons for significant oscillations of market values in relation to the S2F and S2FX model and thus confirm the reliability of these models in the estimation of BTC value. The research further confirms the strong influence of non-technical information directly linked with the BTC. The limitations of this paper are the lack of possibilities for examining the impact of non-technical information affecting the Bitcoin price deviation regarding the S2F model. In addition to all mentioned limitations, the research results indicate the relevance of the S2F and S2FX models and show a strong impact of (half) the information on the value of cryptocurrencies.

1. Introduction

The 2008 financial crisis and the 2020 COVID-19 pandemic accelerated some of the expected changes in the management of financial systems. The consequences of these crises on the globalisation process, financial operations, production, and international trade affected all segments of the economy. The 2008 global financial crisis turned into a recession (Allen and Carlleti 2010). The global COVID-19 pandemic has caused a severe economic crisis in the supply and demand of goods and services in domestic and international markets (Kraus et al. 2020), and we also assume there will be strong changes in the functioning of the global financial system. The most evident impact of the COVID-19 crisis is on financial markets, especially the global stock market (Ozili and Arun 2020) and in the drop-in stock prices in almost all companies (Ding et al. 2020). The two major crises of the 20th century, the 2008–2009 Great Recession, and the 2020 COVID-19 crisis (Šonje and Kotarski 2020) are the introduction to a new century in which markets and technological progress will continue to drive growth. Priem (2021) states that “most individuals increased their equity positions during the pandemic”. In an economy in which most of the production is based on the minimum cost model with minimum stocks, as well as last-minute supply of raw materials and parts, supply chains have been disrupted and thus caused major market disruptions. According to available data, global trade dropped by 9% in 2020, foreign investment by 40%, and trade in services by 60%. It has become evident that current global economic growth is based on money printing. State interventions and incentives have delayed the expected changes in the economy burdened by debt, inflation, unemployment, and production decline. It is only a matter of time before the real economy succumbs to the burden of debts and money printing. Considering the dynamics of technological–technical changes, changing trends in consumer habits and needs, and strong decentralisation of the basic interfaces of the traditional sector, such as trade, investment, asset management, payments, and insurance is inevitable. Irreversibility and automation of financial contracts, complete control of funds, complete transparency of ecosystems, increasing price, and market efficiency are only some of the expected changes.
Changes in the environment have been strongly influenced in recent decades by new organisational forms in the process of globalisation of the world economy (Fučkan and Sabol 2013, p. 29). Globalisation and the development of financial systems have also influenced the development of cryptocurrencies.
Bitcoin (BTC) is the most famous and first cryptocurrency. The BTC is also the first limited digital commodity. It is a decentralised digital currency based on cryptography. Like other cryptocurrencies, Bitcoin can function without intermediaries and supervision by central authorities, such as the central bank, unlike state or fiat currencies, such as U.S. dollars or euros, which are controlled by countries’ central banks. Its decentralised nature allows it to operate on a peer-to-peer network, whereby users can send each other funds without intermediaries.
The decentralised cryptocurrency market ensures payment anonymity, low price, transaction speed, and is available online 24 h a day. Consequently, BTC provides financial services in areas with underdeveloped financial infrastructures Salvador is the first country to introduce Bitcoin as the official currency, so it will soon be possible to witness how cryptocurrencies, that is, Bitcoin, can replace underdeveloped financial infrastructures. The question is whether individuals can acquire sufficient technical skills and whether there is sufficiently strong Internet infrastructure in these countries to allow Bitcoin payments to unfold without any major difficulties.
The importance of the BTC is constantly growing. There are numerous research papers studying the reasons for and the movements of the value of this first cryptocurrency. The impact of systematic and unsystematic factors on the BTC value has often been analysed in the past few years. In a BTC trading study, the authors Masafumi et al. (2018, p. 587) and Balcilar et al. (2017, p. 74) conducted sensitivity analyses, but but only investigated shorter period of time (several months)and did not investigate the impact of (half) information on the movement of the market value of BTC.
This paper aims to investigate the impact of unsystematic factors on the value of BTC, that is, determine to what extent models developed for predicting the Bitcoin value—S2F and S2FX—as unsystematic factors, together with non-technical information, affect the Bitcoin market value and thus the changes expected in the forthcoming period. The purpose of this paper is to determine the reasons, such as systematic or unsystematic factors, which significantly affect the value of the BTC expressed in USD, and thus show that the rarity, that is, scarcity of the BTC is its most important feature. The described S2F model, based on the relation between stocks and inflows of fresh BTC, strongly determines the movement of its value with oscillations that need to be analysed and explained. This is the main motivation for this research, as well as its contribution.
The following chapters provide a detailed explanation of S2F and S2FX methodology for determining the BTC value. The Results and Discussion section outlines the impact of the so-called (half) information on the BTC market value. Deviations of the BTC market value in relation to the value determined by the S2F model have been analysed through a number of cases from the past 10 years.

2. Theoretical Framework

The cryptocurrency market is not regulated by countries or regulatory agencies, and the question is whether it can be compared to a regulated capital market, that is, whether the same assumptions can be applied to both markets.

2.1. Efficient Market

The original theoretical formulation of the Efficient Market Hypothesis by Samuelson in 1965 (Alajbeg et al. 2012) and its elaboration by Fama (1965) suggest that the stock price reflects all relevant information at the time they are created. Stock prices are accidental under “the random walk concept” developed by Bachelier (Malini 2019), which describes the movement of a variable in which future changes cannot be predicted because they are unsystematic. The Efficient Market Hypothesis, according to Fama (Malini 2019), refers to a weak, semi-strong, or strong form of information flow efficiency, that is, how quickly and how accurate the market reacts to any new information.
“Unpredictable and coincidental price trends are no evidence of market irrationality, but rather a consequence of intelligent investors competing in discovering significant information before the rest of the market becomes aware of them” (Bodie et al. 2008, p. 558). Technical and fundamental analyses are the main tools of stock exchange analysts and investors. The efficient market theory states that technical analysis is useless (Bodie et al. 2008) because it seeks a repeating and predictable pattern in the movement of stock prices. It also claims that the fundamental analysis in determining stock prices is mostly useless. The general conclusion is that the Efficient Market Hypothesis (Mishkin and Eakins 2003, p. 284) is “a good starting point, but it may not be the end of the story and therefore cannot be generalised for all behaviour in the financial market”.
The anomalies observed in the capital market cast doubt on the Efficient Market Hypothesis. The value effect, size effect, small-firm effect, January effect, market overreaction, excess volatility, and return to average value are some of the most frequently investigated anomalies (Barbić 2010; Caporale et al. 2019; Parveen et al. 2020; Nurdina et al. 2021). The size anomaly does not provide any opportunities for excess investor returns in Germany, Spain, and Italy, but provides an opportunity for size anomaly exploitation in France (Pandey et al. 2021). The market overreaction anomaly shows that (Mishkin and Eakins 2003, p. 283) “research indicates that stock prices can overreact to announcements in the news and that pricing errors can only be remedied slowly. If corporations announce a major change in earnings, such as a sharp drop, stock prices may overreact, and after an initial significant decline, they can rise back to normal levels over several weeks. This undermines the Efficient Market Hypothesis because an investor could, on average, earn extremely large yields by buying a stock after the announcement of bad earnings, and then sell it after a few weeks when it rises to the normal level again”. The economic anomaly of the overreaction of markets and investors affects investors’ decisions. “Investors who are overconfident and use representative heuristics overreact (Parveen et al. 2020, p. 224) to any new information that arrives in the market” and “make decisions under the influence of such anomaly”. The overreaction anomaly strategies (Caporale et al. 2019) are not profitable, and therefore the latter cannot be seen as inconsistent with the “Efficient Market Hypothesis”. The excessive overreaction (Nurdina et al. 2021, p. 370) “is useful in explaining many asset pricing anomalies, but personal information reacts more than public information”.
The Efficient Market Hypothesis and anomalies leading to certain deviations are also applicable to the cryptocurrency market. The capital market and the cryptocurrency market are constantly influenced by systematic and unsystematic risks, that is, factors.
Systematic and unsystematic factors (Van Horne and Wachowicz 2008) are a constant risk to investors trying to bridge them. Systematic factors affect the overall financial market, as they lead to changes in national economies, such as tax reforms, changes in the global energy situation, interest rate changes, industrial production, inflation, or exchange rates. Unsystematic factors are unique for a particular society or industry and do not depend on economic, political, or other factors. Some of the most significant unsystematic factors can be a strike of company employees, new competitors who start producing almost the same product, and a technological discovery that can make the existing product obsolete.
By effective portfolio diversification, unsystematic risks or factors can be reduced or even eliminated for most of the stocks, because they account for about 50% of the total risk (Van Horne and Wachowicz 2008, p. 105).
Apapo and Phiri (2021), based on the random walk model of stock returns, investigated the weak-form market efficiency hypothesis for Bitcoin and four of the most dominant cryptocurrencies (Ethereum, Litecoin, Bitcoin Cash, and Ripple). Their research confirms that the daily series are generally market-efficient, except for Litecoin, but all weekly returns are informationally inefficient. They conclude that (p. 9) “the cryptocurrencies are not market efficient enough to be considered as a more formal exchange system and more regulatory intervention is required in cryptocurrency markets”. This research hypothesises that limited Bitcoin production, and therefore its scarcity explained by S2F and S2FX methods in the situation of capital market development, strongly influences its constant growth, and that the market overreaction anomaly in non-technical (half) information on Bitcoin strongly affects the change in its value and deviations from the S2F model-based value.

2.2. Overview of the Previous Research

The aim of this paper is to investigate the influence of oscillations in Bitcoin market values due to unsystematic factors and to present the most important research in this field. Bitcoin first appeared in a scientific paper published in 2008 (Nakamoto 2008), where it was theoretically designed. The first production of Bitcoins emerged in 2009. Many subsequent studies have focused on understanding the factors affecting the value of cryptocurrencies and, indirectly, understanding the present moment in the development of decentralised financial platforms in which people are willing to lock (term) cryptocurrencies worth over USD 12 billion, according to data from June 2021. The answer is multi-layered, but certainly in the high yield area was realised through Yield Farming, and recognised management possibilities with the risk of change in cryptocurrency value. The better we perceive the situation and changes, the more capable we are of solving problems, and can thus become more powerful (Adizes 2006).
Identification of the properties and value of cryptocurrencies, as well as the most famous cryptocurrency Bitcoin, is an issue for scientists, economists, and legislators. Therefore, before the very analysis of the influences on cryptocurrency value, it is necessary to study Bitcoin features and answer the question of whether it is money or some other type of asset. In their research, Glaser et al. (2014) focused on the capacity of Bitcoin as an exchange medium in response to the question of how Bitcoin differs from cryptographic money (Chaum 1983) and other virtual currencies. They found that Bitcoin was fairly liquid because any currency could be exchanged for Bitcoin at any time, but because of its scarcity, it has liquidity constraints like other commodities. Many authors (Böhme et al. 2015; Glaser et al. 2014; Simser 2015; Wisniewska 2015) discuss Bitcoin as a digital currency and its suitability to be used as money. Bjerg (2016) developed his Bitcoin analysis according to the principle that Bitcoin is “commodity money without gold, fiat money without a state, and credit money without debt”. Most investors consider their investments in Bitcoin a speculative asset (Bjerg 2016; Glaser et al. 2014) and not a means of payment. The research conducted by Glaser et al. (2014) confirmed the identification of cryptocurrency, that is, Bitcoin as an asset rather than currency. International accounting standards (IAS) confirm the opinion of Glaser et al. (2014) that cryptocurrencies, that is, Bitcoin, are assets, not currencies. Cryptocurrencies can only be defined under IAS 38 Intangible Assets, which defines intangible assets as non-monetary assets which are without physical substance and can be identified separately. To meet the criteria for recognising cryptocurrencies as an intangible asset under IAS 38, future economic benefits need to flow from the intangible asset, the asset should be identified separately, and procurement costs can be determined. Cryptocurrencies meet the identification criterion in the definition of intangible assets because future economic benefits can also flow from their exchange, they can be identified separately, and they have no physical substance as a virtual currency. Institutional investors may, depending on their business model, evaluate cryptocurrencies under the provisions of IAS 2, Inventories if they are intended for sale.
Generally, economists compare Bitcoin with gold—that is, it is often referred to as “digital gold” (Dyhrberg 2015; Seys and Decaestecker 2016; Baur et al. 2017). Both gold and Bitcoin have some internal value, but this value does not justify their current market value. They get most of their value from the fact that they are scarce and expensive for extraction. Gold is used to maintain investors’ asset values as protection against market or legal currency oscillations, especially dollar oscillations. Kyriazis (2020) concludes in his research that gold is a better and safer investment than Bitcoin. Whether Bitcoin, as a leading cryptocurrency, may also serve to preserve investors’ asset values is the subject of numerous studies. In his paper, Dyhrberg (2015) determined the economic capacities of Bitcoin in risk management, portfolio analysis, and currency options. It was investigated whether Bitcoin behaves as a well-known financial asset or as something between commodity and currency through the analysis of several aspects of its price volatility by comparing Bitcoin with the value of gold and currencies, dollars, and euros. The results suggest that Bitcoin return is more affected by the demand for Bitcoin as a means of exchange and less by temporary price shocks, indicating similarities with currencies. Bitcoin and gold are similar in terms of volatility of returns, although there are also currency similarities. Hammoudeh and Yuan (2008) found that gold is much more affected by the demand for jewellery and recycling, because it is a precious metal rather than industrial metal, and less influenced by short-term shocks, that is, that good and bad news have no asymmetric impact on the volatility of gold yields. Bitcoin is similar to gold (Dyhrberg 2015), because it responds to similar variables, has similar protection options, and reacts symmetrically to both good and bad news. Furthermore, the research found that the position of Bitcoin on the market would be between gold and dollars and that Bitcoin could combine some of the advantages of commodities and currencies on financial markets and be a useful tool for portfolio management, risk analysis, and market sentiment analysis. Seys and Decaestecker (2016) analysed 1645 daily observations in their research on Bitcoin price variables between 01 July 2011 and 31 December 2015. Bitcoin price was set as the dependent variable, while the independent variables were set as follows: the London Brent crude oil price, the exchange rate between the American dollar and Chinese yuan, mining difficulty, the exchange ratio, the amount of Wikipedia searches, the volume of Bitcoin trade in China, the Cleveland Financial Stress Index2 (CFSI), and the price of gold. The authors concluded that London Brent crude oil price and USD/CNY exchange rate are statistically significant, and their price increase by 1% has a negative effect on the Bitcoin price, that is, it reduces Bitcoin by 0.23%, that is, 0.05% to 0.12%. Mining difficulty has a positive effect of 0.7% on the Bitcoin price. No impact of the price of gold on the Bitcoin price was identified in the research, nor any link between the Chinese trading volume and the Bitcoin price in USD. Baur et al. (2017) also found similarities between cryptocurrencies and gold reflected through their possible shortages, expensive mining, the fact that they have no government coverage, and decentralisation.
According to Kristoufek (2014), the formation of Bitcoin prices cannot be explained by standard economic theories, such as the discounted cash flow model, purchasing power parity, or uncovered interest rate parity, as there are several features of foreign currency supply and demand. Therefore, the most extensive research was carried out on possible internal and external factors affecting the price of cryptocurrencies, particularly the most famous Bitcoin cryptocurrency (Panagiotidis et al. 2019; Poyser 2017; Kavvadias 2017; Letra 2016; Hayes 2015; Kristoufek 2014; Bouoiyour et al. 2014).
Panagiotidis et al. (2019) concluded that uncertainty in economic policy and stock market volatility are among the most important variables between 41 examined potential drivers of Bitcoin returns. Internal and external factors affecting the Bitcoin price were defined by Poyser (2017) in his research. The main internal factors are Bitcoin supply and demand (Bitcoins in circulation, transaction volume, hashrates, and mining difficulties), while external factors are divided into cryptomarket attractiveness (attractiveness, trend, and speculation) and macro-financial factors (exchange rate, interest rate, price of gold). The results show that Bitcoin price is negatively linked to the neutral sentiment of investors, the price of gold, and the exchange rate of yuan against the U.S. dollar, while it is positively linked to the stock exchange index, the USD exchange rate against EUR, and the fluctuating signs among the search trends in different countries. In his research, Kavvadias (2017) conducted regression analysis on a Bitcoin price sample, as a dependent variable, on a daily and weekly basis in the period from 1 May 2014 to 12 June 2017. Hashrate, VIX index, that is, the Chicago Board Options Exchange Volatility Index, the Global Market Portfolio (S&P 500 and MSCI World), price of gold, transaction volume, number of Bitcoins in circulation, and Google trends were taken as an independent variable in the research. The analysis showed that hashrate (short-term daily) and the VIX index (short-term daily and weekly) have a negative impact on Bitcoin value. The volume of transactions has positive effects on Bitcoin price in short-term weekly analyses. The price of gold has short-term weekly and long-term negative effects on Bitcoin price. Representatives of the Global Market Portfolio (S&P 500 and MSCI World) have a long-term positive effect on Bitcoin price.
Letra (2016) also studied the impact on Bitcoin price using the Bitcoin price expressed in U.S. dollars, collected daily from 26 June 2012 to 31 August 2015, as a dependent variable. He grouped independent variables into three categories: attractiveness, economic and technical variables, and macroeconomic factors. In the category of Bitcoin attractiveness, he used data obtained by measuring the number of searches on Google and Wikipedia, the number of messages on Twitter tagged “Bitcoin”, and automatic analyses of people’s opinions on Twitter on the term “Bitcoin”. In the category of macroeconomic variables, the author uses the price of gold, while in the category of economic and technical variables, he classifies the ratio of the currency volume between the swap market and trade, the total number of transactions in a day, the total number of Bitcoins in circulation, the average number of transactions per block, miners’ revenues, the total number of unique Bitcoin transactions per day, number of unique Bitcoin addresses used per day, difficulties in finding a new block, and hashrate. The author concludes that the variables affecting the Bitcoin price are the number of Twitter messages having a positive impact on the value of 0.136169; Google searches having a negative impact of 0.02546441, and the total number of Bitcoins in circulation that also has a negative impact on the value of 0.00000738. Production costs have three main drivers (Hayes 2015) that affect the Bitcoin price, namely: mining difficulties, production unit rate, and cryptographic algorithm power with an emphasis on electricity cost. All the factors that reduce production costs negatively affect the Bitcoin price. Kristoufek (2014) analysed the influence of cryptocurrency attractiveness, cryptocurrency transaction volume, and the hashrate on the exchange rate between Bitcoin and the U.S. dollar. The research found that hashrate and transaction volume have a positive impact and attractiveness has a negative impact on the Bitcoin price. In their paper, Bouoiyour and Selmi (2014) concluded that hashrate has a positive effect on the Bitcoin price, while attractiveness (trends) has a negative impact. Many authors analysed Google trends data (Kavvadias 2017; Polasik et al. 2014; Garcia et al. 2014). In their research, Polasik et al. (2014) analysed Google trends data and concluded that Bitcoin price is primarily influenced by its popularity, sentiment expressed in the news reports on cryptocurrency, as well as the total number of transactions. Google trends are a statistically significant variable, and a 1% increase in Google searches increases return by approximately 53 to 62 basis points. The number of transactions is also a statistically significant variable that also influences the Bitcoin price, while the correlation between the Bitcoin yield and the fluctuation of major currencies is weak and statistically insignificant. In his paper, Jenssen (2014) provides a similar conclusion that the Bitcoin price is the result of a limited supply with increased demand. In their research (Garcia et al. 2014) conducted from mid-2010 to 5 November 2013 on Bitcoin price data and Google trends, they found that an increase in the search of the term “Bitcoin” has a negative effect on the Bitcoin price. Kavvadias (2017) found that Google trends have positive, short-term weekly effects and a long-term negative impact on the Bitcoin price.
Social networks like Twitter, Facebook, or Reddit are the main tools for advertising cryptocurrencies. The cryptocurrency industry consists of four sub-sectors: exchanges, wallets, settlements, and mining, as reported by Cambridge University on global crypto-graphic industry research (Hileman and Rauch 2017). Data on cryptocurrencies from social networks, primarily Twitter, were analysed by (Park and Lee 2019; Lu et al. 2017; Thelwall 2017; Kim et al. 2016; and Matta et al. 2015).
The analysis of social networks on the Twitter cryptocurrency account was used in the research conducted by Park and Lee (2019). The main conclusions are that (1) measuring the presence of cryptocurrencies on social networks may enable their more precise assessment, (2) existing dominant cryptocurrencies attempt to strengthen their network in order to reduce the uncertainty market, and new participants try to establish new networks or continuously expand their networks to reduce uncertainty, (3) there is a reasonable similarity in patterns between optimistic sentiments in tweets and bull trends on the market, and (4) it is too soon to conclude whether positive or negative sentiments are a guide to predicting prices in the cryptocurrency market. In their research, Lu et al. (2017) collected Taiwanese data from Twitter on cryptocurrencies for the period of 2013–2016. The most important conclusions of the research are that, after 2015, negative sentiments became predominant in the discussions as a result of hacking, which also increased the popularity of debates on security. Thelwall (2017) found that mutual recognition and networking in cryptocurrency communities can influence the overall success of individual cryptocurrencies. Kim et al. (2016) analysed online data (e.g., posts, responses, views, sentiments) of the cryptocurrency community to predict price fluctuations. Their mathematical model revealed that cryptocurrency prices had loopholes of approximately 8%, with the most precise prediction being for Bitcoin. Matta et al. (2015) concluded that the scope of tweets and data on Google trends correlated with Bitcoin prices. Although many consider decentralisation and non-regulation of the cryptocurrency market to be an advantage, this may also be the main cause of high volatility because Bitcoin price depends solely on the supply–demand relationship (Buterin et al. 2015, p. 11). Based on technical analysis, the authors determined that its price would decline in the future and that it is not a good investment opportunity, and that it has no future as a safe means of preserving value nor as a global currency, but that there is still a possibility for the Bitcoin to be imposed as a reliable and inexpensive way of transferring money. Desirable behaviours, rewards, and increasing demand create the value of cryptocurrency (Yoo 2021). It was also pointed out that “Bitcoin are choosing mining as a reward to secure scarcity for maintaining the value of cryptocurrency, limiting the amount of issuance, and burning the already issued cryptocurrency in the market”.
Weiss Ratings, an independent rating agency from the United States of America, also publishes cryptocurrency ratings. A cryptocurrency rating model has been developed based on four indices (Weiss Crypto Rating 2021a): (1) A crisis risk index based on price volatility; (2) a fee index that takes into account the average investment income; (3) a technical index that takes into account the content of the white book, Internet reputation, the openness and flexibility of the source code, anonymity, governance, energy efficiency, scalability, interoperability, and much more; and (4) a baseline index based on transaction speed, market penetration, network security, decentralisation, network coverage, and participation. According to Weiss Crypto Rating (2021b), on 23 July 2021, there was no class A cryptocurrency. Ethereum had the highest overall rating of B +, and Bitcoin was rated B.
In this time of high market volatility, Wyckoff’s rules (Dziadkowiec 2021) were verified in relation to his price action market theory, which continues to be a guiding principle in today’s commercial practice. In his first rule, Wyckoff states that the market is unique and that market prices will never move in the same way as they did in a previous period.
According to the second rule, since each price shift is unique, its analytical importance is compared to previous price behaviour. The Wyckoff method states that the price cycle of the traded instrument consists of four stages—the accumulation phase, the markup phase, the distribution phase, and the markdown phase.
Wyckoff highlights three laws that are the natural cause of the market cycle: (1) Supply vs. Demand; (2) Effort vs. Result; and (3) Cause vs. Effect. Whenever there is increased sales pressure caused by excessive supply, prices are likely to drop, and vice versa. Trading quantity data represent an example of the effort vs. result relationship. If there is an unusually large volume of trading, a large price shift can be expected. According to Wyckoff, each cause leads to a proportional effect in the market. Volume is of great importance for trading because it can provide valuable information about what is really happening “behind the scenes”. Wyckoff’s volume analysis confirms the progress of events during the price cycle.
Within the Wyckoff method (Figure 1), there are five phases:
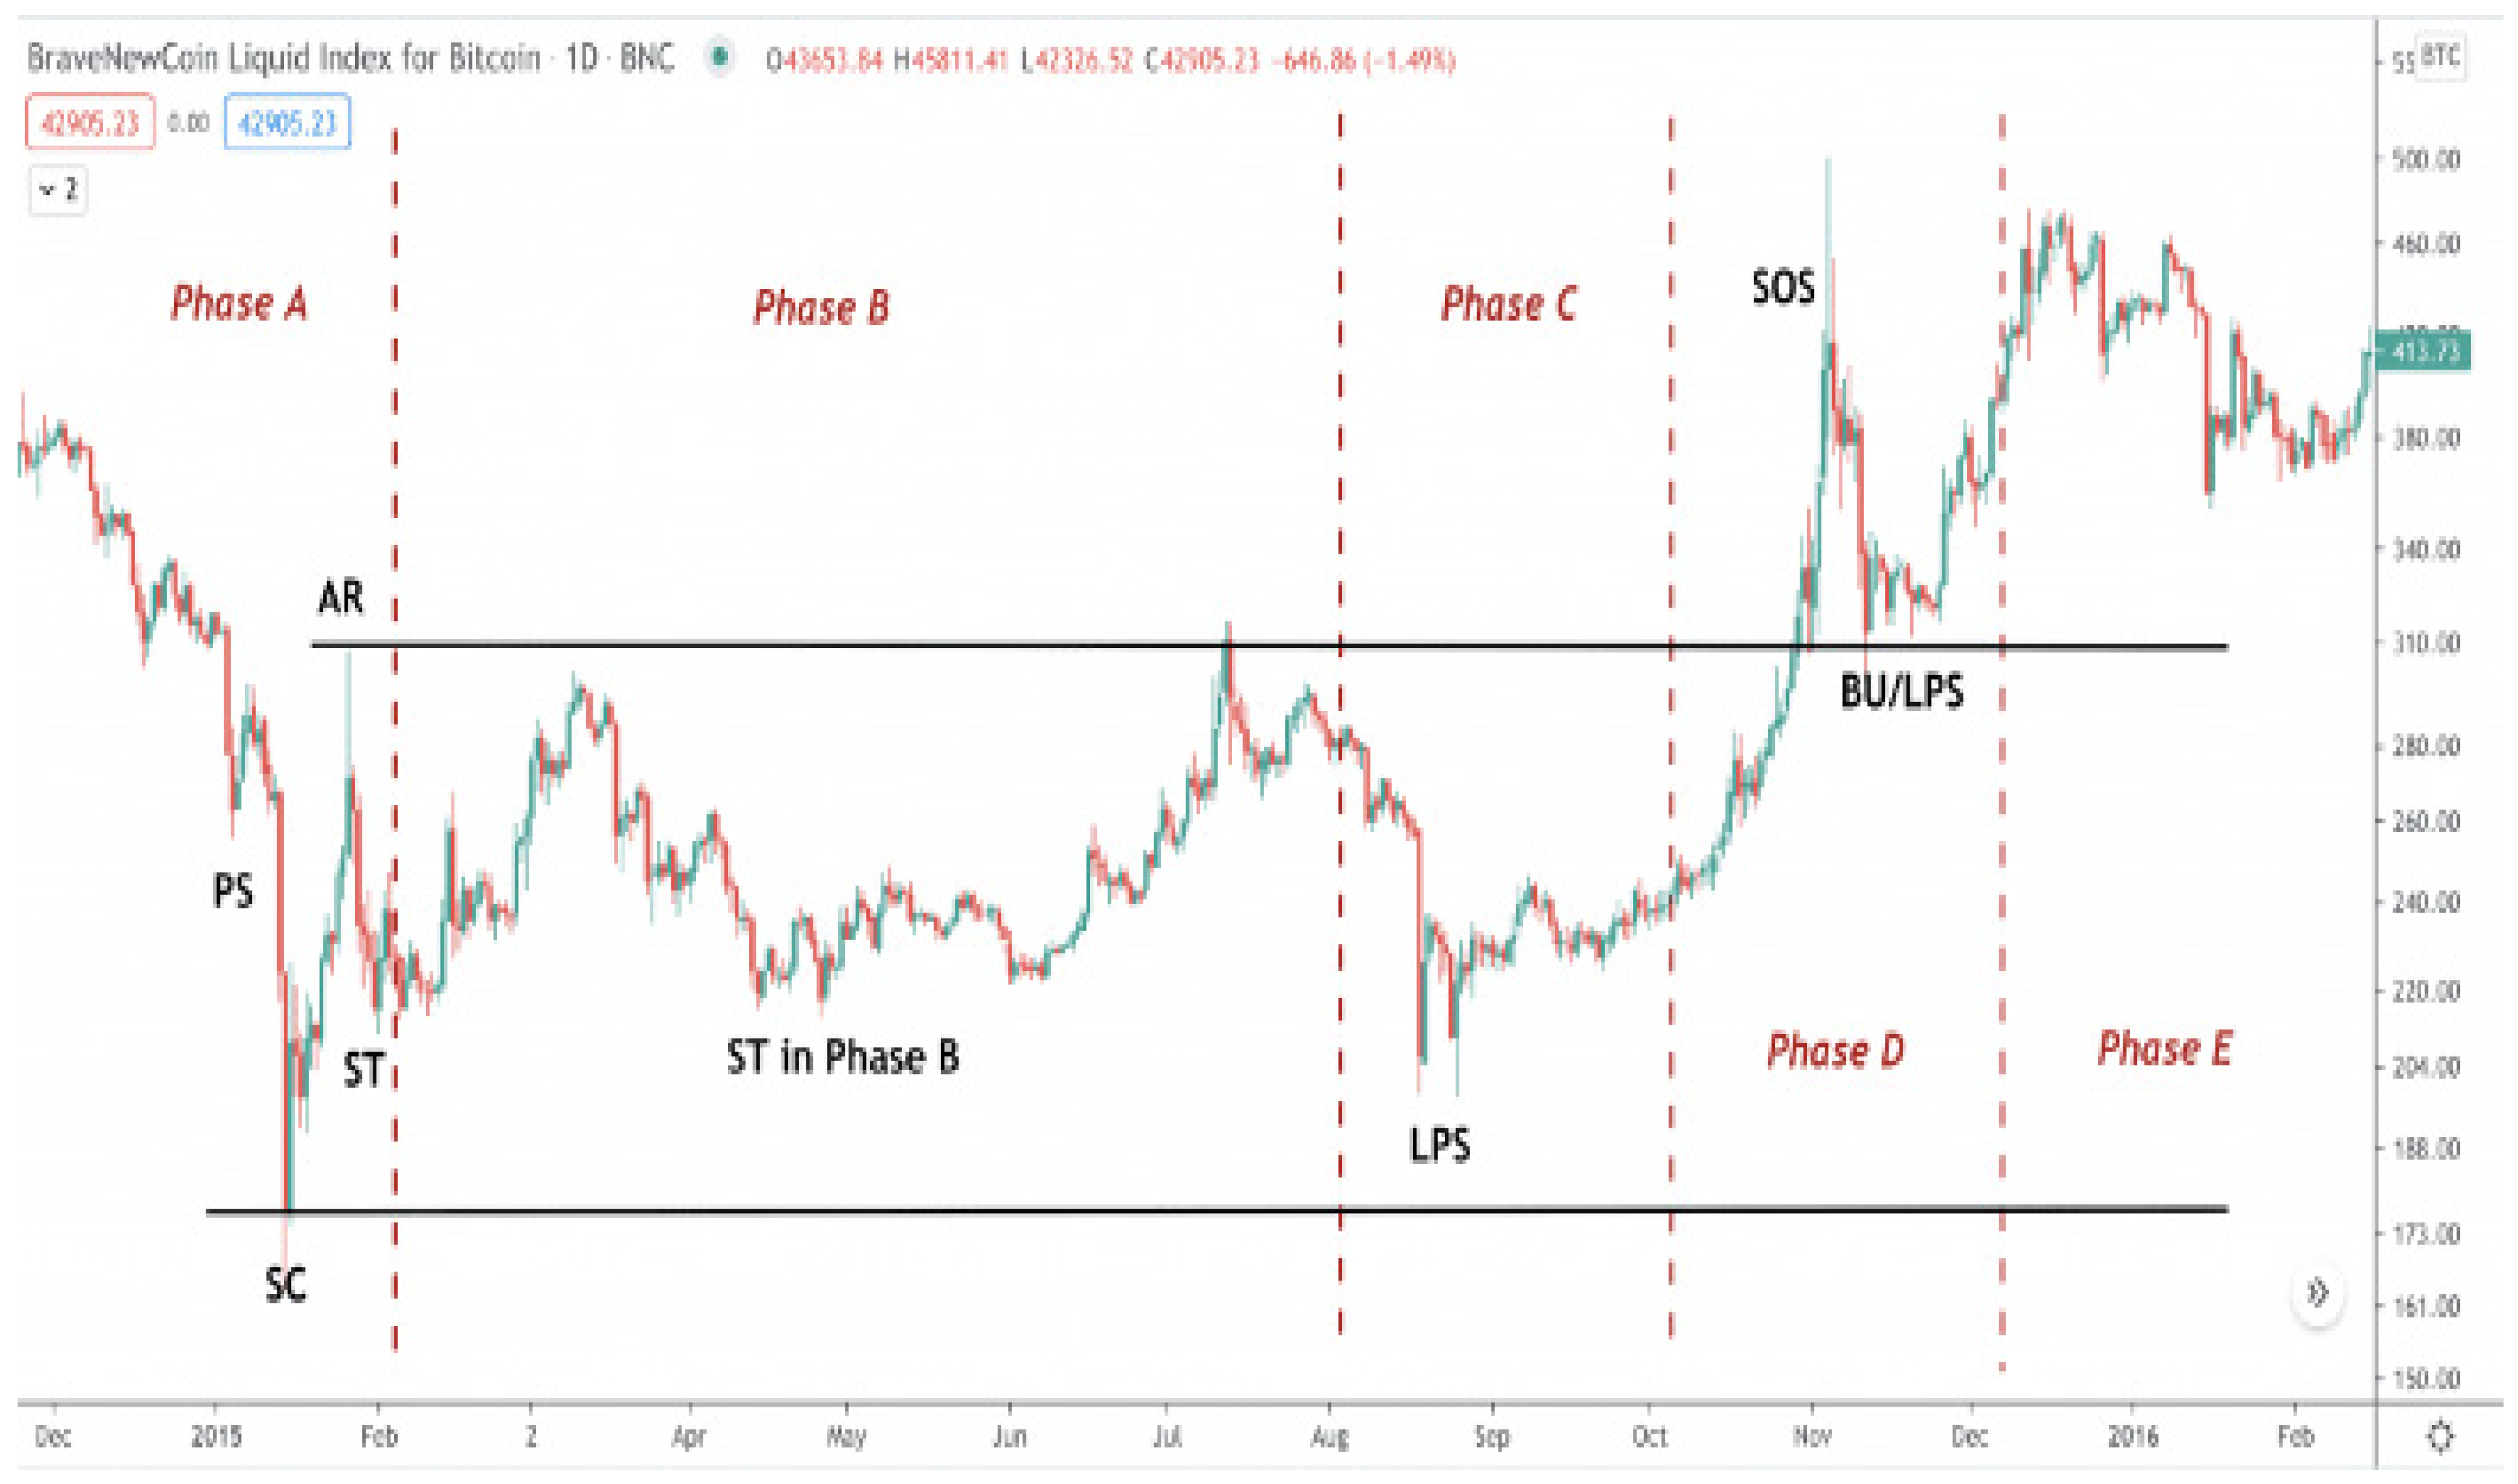
Phase A means stopping the previous downward trend. Up to this point, the offer was dominant. This signals preliminary support (PS) and sales peak (SC). Automatic purchase and active purchase then cause an automatic increase (AR). SC and AR denote the trading range of the accumulation phase.
Phase B—The period in which the assets are accumulated.
Phase C—The stock price goes through a decisive test of the remaining offer.
Phase D—This is a passing phase and is the last opportunity for investors and traders to buy at lower prices, and finally, there is last point support (LPS). This is the highest low before the market breaks through the resistance levels. Signs of support (SOS) occur where resistance prices used to be.
Phase E—Indicates an increase in market demand and an upward trend.
Following the decline in the Bitcoin price in May 2021, the Wyckoff Market Cycle graph explains the evolution of the Bitcoin prices, that is, that Bitcoin then entered phase C (Figure 1). After the price correction and its increase in line with Wyckoff’s graph, Bitcoin entered phase D, where it is expected to grow further, but also undergo certain price corrections. Legend: Phase A—Stopping the previous downward trend. Phase B—The period in which the assets are accumulated. Phase C—The stock price goes through a decisive test of the remaining offer. Phase D—This is a passing phase and is the last opportunity for investors to buy at lower prices. Phase E—Indicates an increase in market demand and an upward trend. PS—Signals preliminary support. SC—Sales peak. AC—Automatic purchase and active purchase. AR—Automatic increase. LPS—Last point support (LPS). SOS—Signs of support.
Previous research has shown that cryptocurrencies have some characteristics of money and can serve to preserve values (Frisby 2015) or they are only used for speculative investment with a pronounced inclination to speculative bubbles (Cheah and Fry 2015). Polasik et al. (2014) found that popularity strongly affects the Bitcoin price, that is, that an increase of 1% of the occurrence of the term “Bitcoin” on the Internet or in newspaper articles increases the return by about 31 to 36 basis points, while newspaper articles undermining the reputation of Bitcoin reduce its price.
Cryptocurrencies, that is, Bitcoin, are also used as a tool for risk limitation, but to a limited extent. Urquhart and Zhang (2019) conclude in their research that Bitcoin is a haven in unsafe times, but only for certain currencies, such as CAD, CHF, and GBP. In their research, Wang et al. (2019) concluded that Bitcoin is a haven in relation to international stock exchange indices, and Bouri et al. (2017) agree with regard to shares listed on the Asian market at the time of their decrease in value. In their research, Arnerić and Mateljan (2019) analysed two leading representatives of the capital market and cryptocurrency market, that is, the S&P 500 stock index and Bitcoin, respectively. Recent research has confirmed that the cryptocurrency market is a safe haven during periods of high volatility on the American capital market. In the report “In Gold We Trust” (Stöferle and Valek 2021, p. 334) the authors state that gold and Bitcoin are stronger together in the non-inflation solid money portfolio. Furthermore, the authors (Stöferle and Valek 2021, p. 254) disagree with the allegations that Bitcoin is new digital gold and consider Bitcoin and gold to be complementary assets, and do not expect Bitcoin to replace gold as a means of preserving the value of investors’ assets.

3. Methods and Research

The research hypothesis is that, in a situation of capital market development, Bitcoin’s scarcity explained by the S2F and S2FX methods strongly influences its constant growth, and non-technical (half) information on Bitcoin affects the change in its value.
The empirical research analyses the influence of selected determinants of the S2F and S2FX models and (half) information on Bitcoin value. The data necessary for the preparation of the paper were collected in the period from 2010 to July of 2021.
Bitcoin is the first rare digital object. The final number of this cryptocurrency cannot be increased, and any remaining, still undiscovered Bitcoins must undergo a procedure in which miners seek a “hash” value that satisfies Proof-of-Work (PoW). This fact made it special in the digital world at the beginning of 2009. The model, that is, the ratio of stocks to annual production, the so-called “Stock-to-Flow (S2F)” model, based on this paradigm, was presented about 10 years later in 2019, and explains at the fundamental level why the first digital object created is so valuable. The Stock-to-Flow model was created by an anonymous Twitter user called Plan B. The model is the calculation of the ratio based on the existing total supply of assets in relation to the annual new quantity of the entry of assets into circulation. The greater the ratio, the more time it takes for new property production, in our case, Bitcoin, to meet current demand, which increases its scarcity.
Although the idea behind this model is quite simple and easily understandable, the model was not accepted because of the frequent and very unpredictable oscillations in the market price of Bitcoin in comparison with the price calculated based on the formula presented by Plan B. The S2F indicator implies that the increase in the shortage or scarcity of an object, in this case, Bitcoin, continues to increase its price. In a nutshell, the model is based on the linear regression function: ln (BTC market value) = 3.3*ln (SF) + 14.6, and can be written as a power law function:
BTC market value = exp (14.6)*SF^3.3.
The possibility of applying the power law from 95% R2 to eight rows of size provides credibility to the model. The power law is a relationship in which a change in one variable causes a proportional change in another variable, regardless of the original value of these variables. For every halving, Bitcoin SF doubles and market value increases 10 times, which is a constant factor in the described model.
Limited supply, that is, the production of Bitcoins in relation to the total supply of 21 million Bitcoins with the current circulation of 19.5 million Bitcoins, creates increased demand due to promising profits resulting from the price projected by the S2F model.
Most of the time, and to a large extent over the past 10 years, the S2F model followed the Bitcoin price, with occasional strong oscillations, as shown in Figure 2. This has led to an intense discussion of model values. The S2F model is partly the reason why institutional investors have also become involved, to a certain extent, in the field of buying and selling cryptocurrencies, although many believe that oversimplification of supply and demand is an unreliable reason for investment and point out the shortcomings of the model.
There are two series in Figure 2: (1) End-of-day price: Coloured dots represent the actual end-of-day price (right-side Y-axis) in the selected currency. Different colours are there to indicate how many days are left until the next halving event. The colour scale is presented vertically on the right side of the chart. (2) Stock-to-flow 463 days: It has already been mentioned that stock-to-flow is a relationship between total stock and yearly production. Stock-to-flow value is then calculated.
For some other assets, such as gold, the current S2F ratio is about 62, which means that it would take 62 years of gold production to produce the current total existing quantity of gold in circulation. By comparison, silver has a ratio of 22 (Stöferle and Valek 2020, p. 225). The Bitcoin ratio in May 2020 was 58.9, after the network went through the third halving in 2020, reducing the miners’ reward from 12.50 to 6.25 Bitcoin. Miners’ rewards are an important feature of the Stock-to-Flow model. Raw materials such as gold and silver are struggling with a significant increase in supply that includes a gold prospecting process and ore mining containing precious metals. It is a very expensive process that takes a lot of time and has become more demanding financially.
The Stock-to-Flow model has been compared to Moore’s law. Additionally, several comprehensive analyses of the Stock-to-Flow model have been conducted. It was analysed by Fidelity Digital Assets, In Gold We Trust (Stöferle and Valek 2020), and, for example, BNY Mellon (Carney 2021), the world’s largest custodian bank, with more than $25 billion in assets, according to this model in its Bitcoin price forecast report. The shortcomings of this very simple model certainly exist. Due to strong market price fluctuations in relation to the price estimated by the S2F model, some analysts consider the theory impossible to refute because any price can be attributed as evidence that the model is correct.
Cardero (2020) points out that the “model is based on the claim that the market capitalisation of monetary goods (such as gold and silver) was derived directly from their new supply rate”. The fund manager claims that no evidence or research have been provided to substantiate the S2F model, except for unique data points selected for the planning of the market capitalisation of gold and silver in relation to the Bitcoin trends. Cordeiro also highlights the problems with Plan B’s claim that the price of gold continues to rise as scarcity increases. However, the market capitalisation of gold oscillated between $60 billion and $9 trillion, while the stock-to-flow ratio oscillated at these prices.
Unlike Cordeiro’s opinion, it is evident (Figure 2) that in the past 10 years, BTC has followed the value determined by S2F, and this paper investigates the reasons for occasional oscillations and finds them in (half) information appearing in the market.
After the 2019 S2F model, the S2FX Model was developed in 2020 in another attempt to explain market value oscillations in relation to the S2F price projection model (Figure 3).
Each of the four identified Bitcoin clusters has a very different combination of S2F market values that seems to be correlated with halving and changing the Bitcoin story:
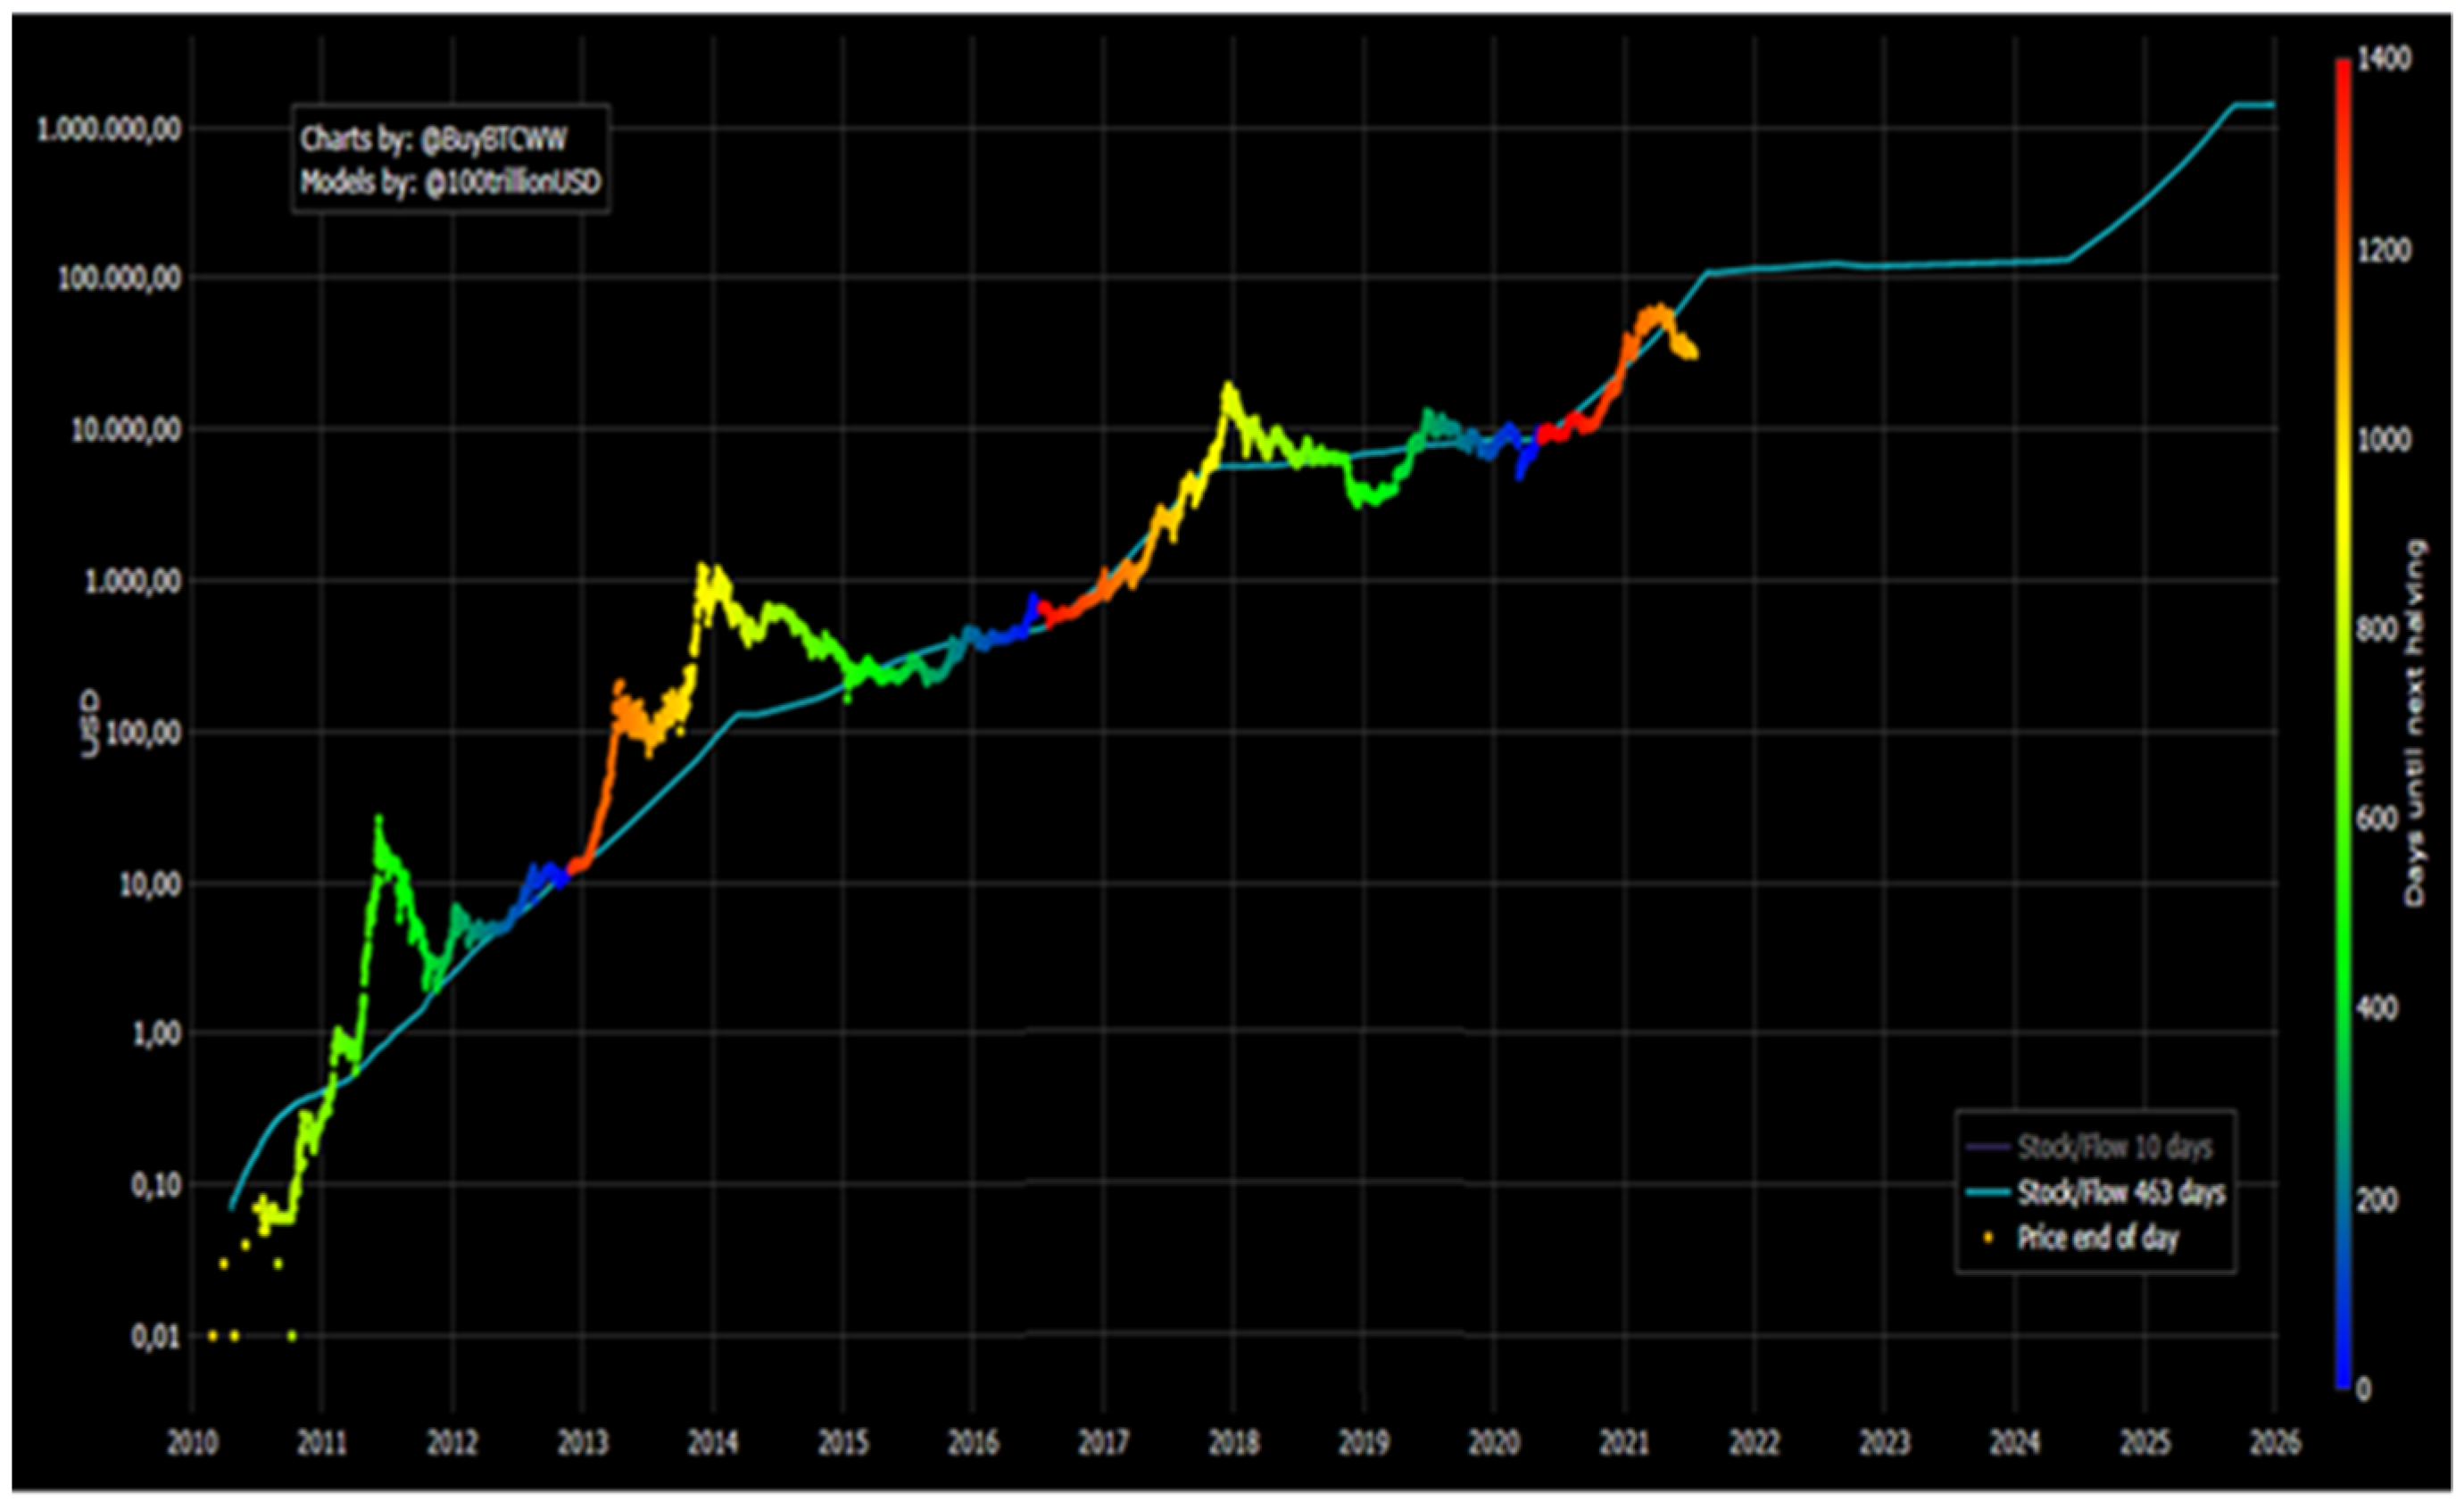
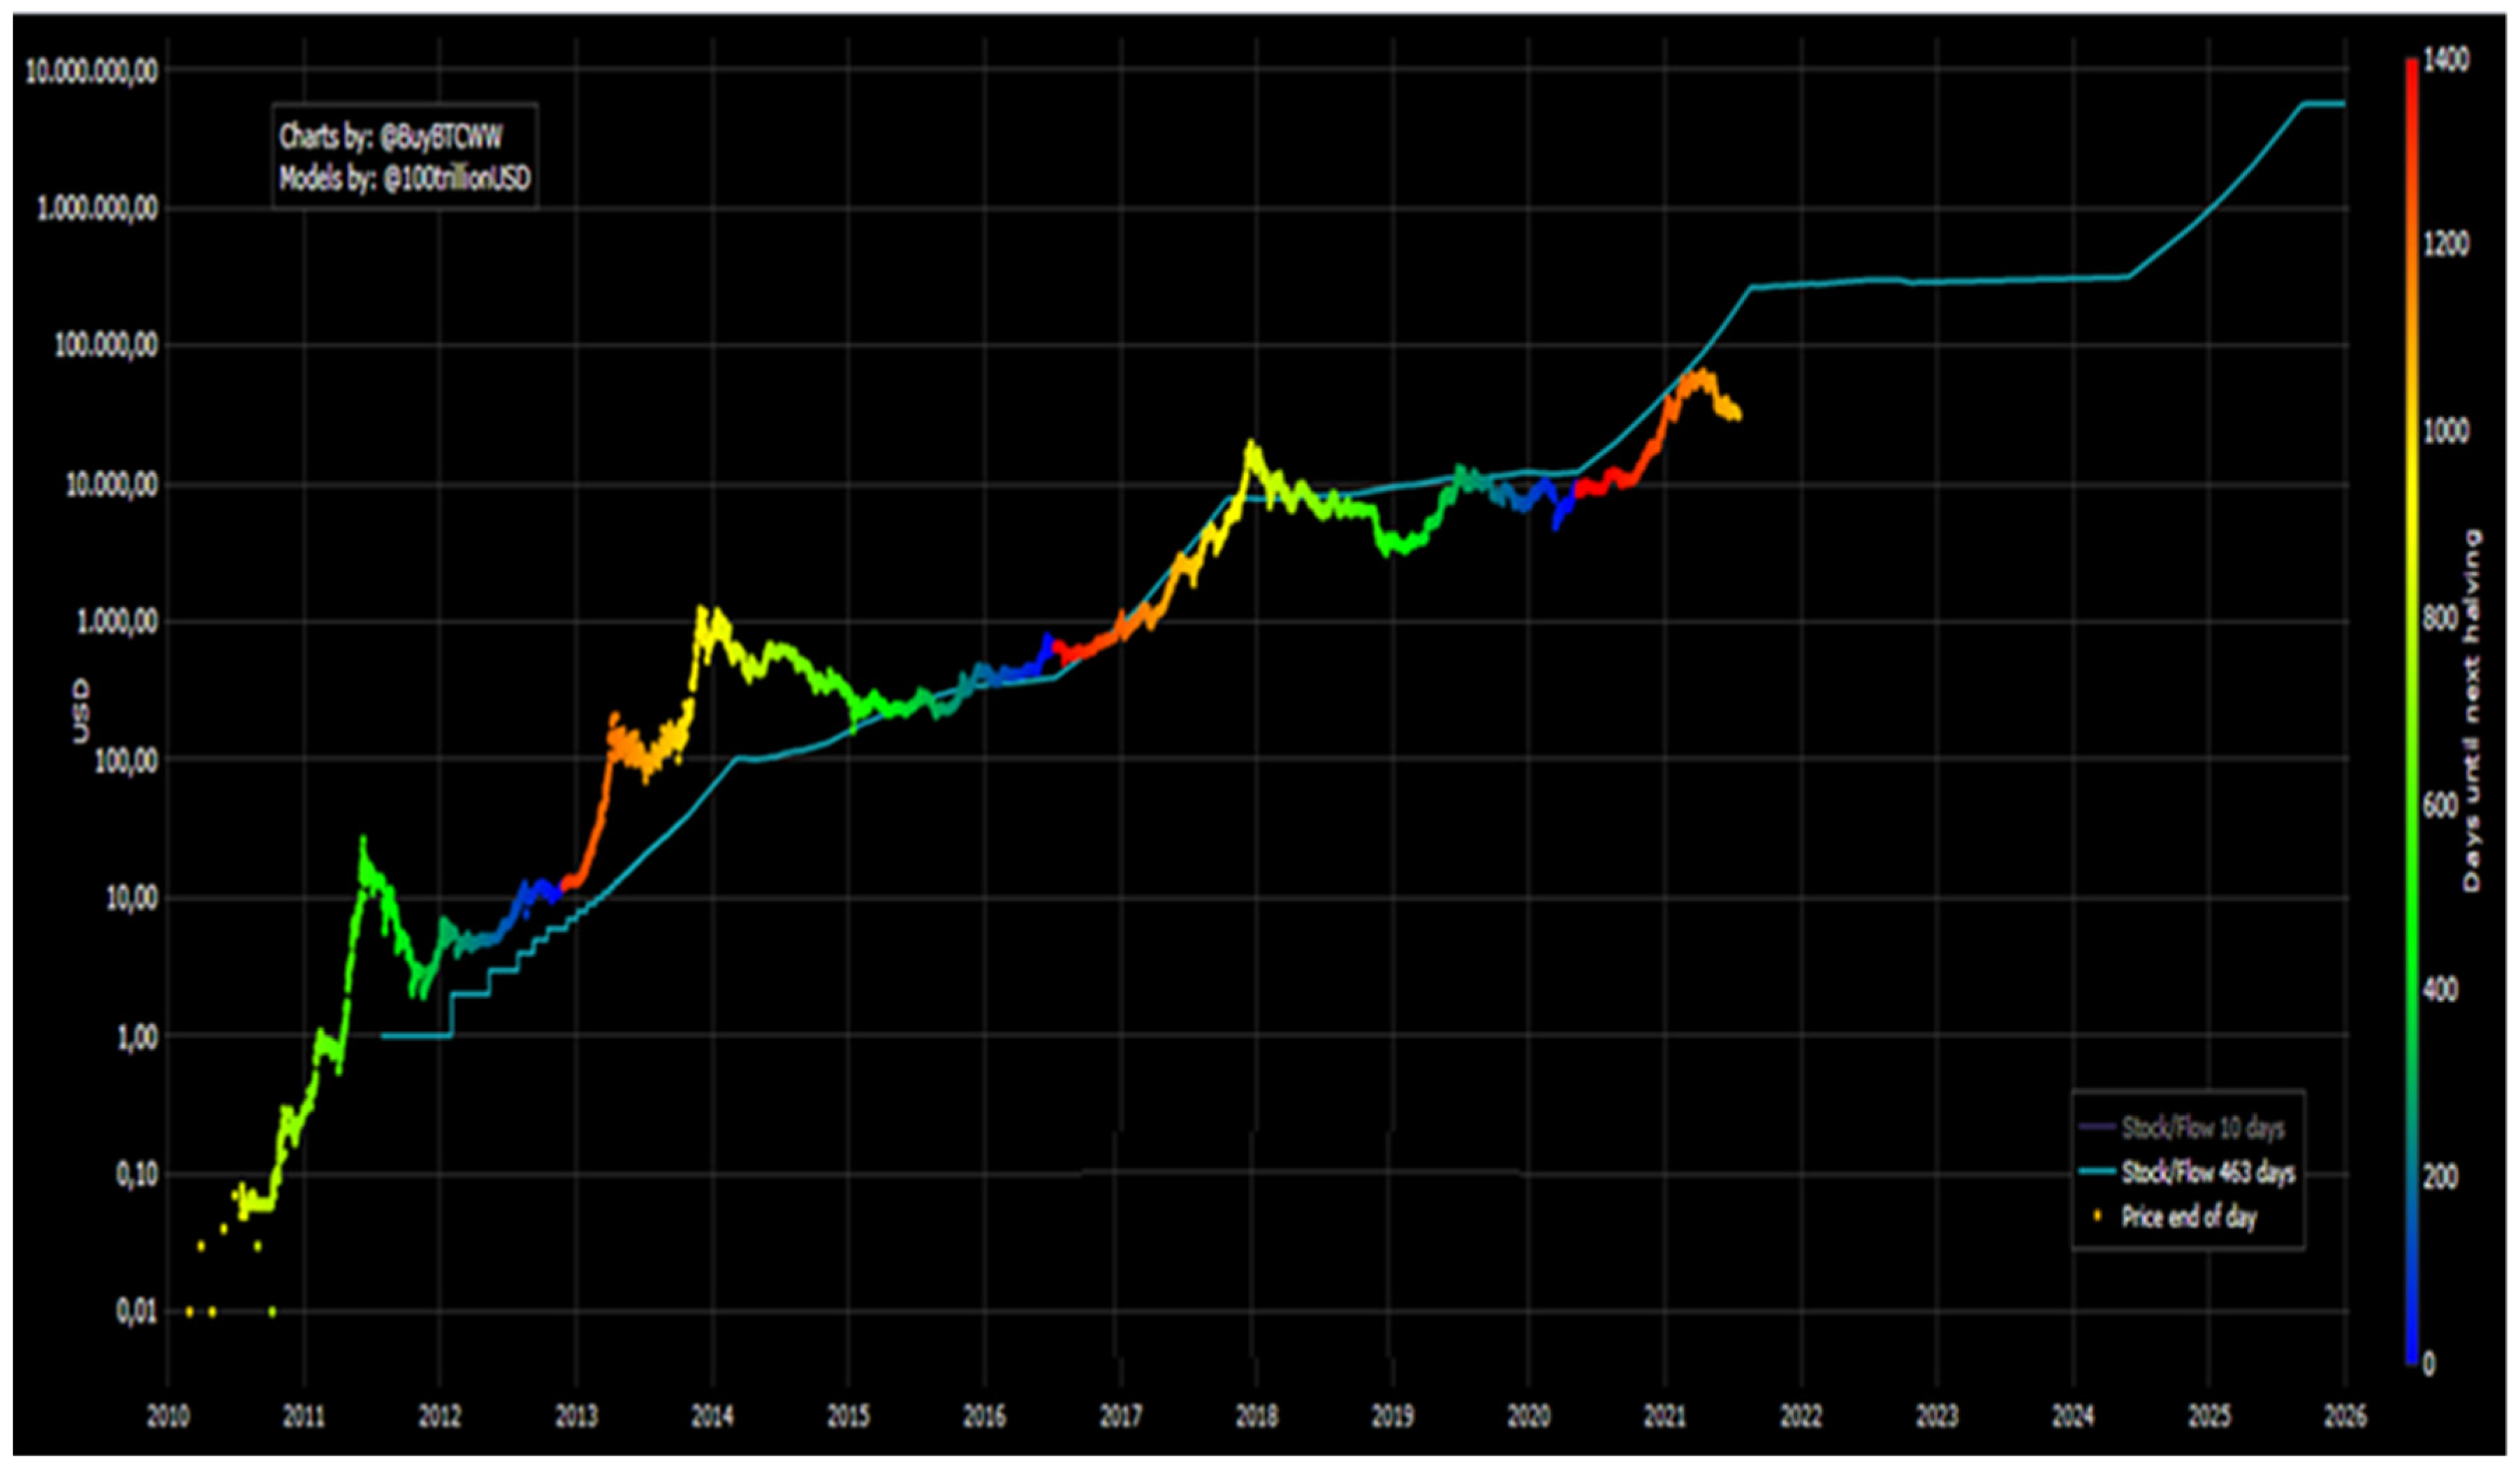
BTC “Concept Confirmation” (S2F index value—1.3 and market value of $1M);
BTC “Payment” (S2F index value—3.3 market value of $58M);
BTC “E-Gold” (S2F index value—10.2 market value of $5.6B);
BTC “Financial Assets” (S2F index value—25.1 market value of $114B).
To compare S2F values of precious metals:
Silver S2F 33.3 (900,000/27,000 tones) with market capitalisation of $561B;
Gold S2F 58.3 (190,000/3260 tons) with market capitalisation of $10,088B.
The S2FX model formula can be used to assess the market capitalisation of the following BTC phase/cluster (BTC S2F will be 56 in 2024):
Market capitalisation = exp (12.7598)*56^4.1167 = 5.5 T $.
Market capitalisation makes the predicted BTC price (in view of the 19 million BTC in 2020–2024) approximately 288,000 USD.
In his paper, Plan B further strengthened the basis of the current S2F model using the S2FX model by removing time and adding other assets (silver and gold) to the model. This new model is called the BTC S2F cross-asset model (S2FX). The S2FX model enables the evaluation of various assets, such as silver, gold, and BTC, according to a single formula.

4. Results and Discussion

After a thorough analysis of the impact of systematic and unsystematic factors on Bitcoin value and analysis of the identified shortcomings of the S2F and S2FX models, we have noticed that strong oscillations of Bitcoin values shown in Figure 1 around its value determined by the above models usually occur at the time of the emergence of (half) information that affect its value as an unsystematic factor. Having determined, through multiple regression analysis, the times in which this oscillation was the strongest or lasted longer, we established that each of these deviations could be explained by one of the global messages, news, or (half) information that preceded strong oscillations. Similar deviation differences are also present in relation to the S2FX model, which once again and in this way confirms the hypothesis that global (half) information are the ones that influence the oscillations of values around the S2F or S2FX models to the largest extent.
This research has developed a model that was used to calculate the estimated value using formulas for the calculation of the estimated market value (PV) according to the S2F and S2FX models using the daily ratio of the total number of Bitcoins (S) and the remaining Bitcoins for mining (F). The differences in values (RV) between the estimated market value (PV) and the achieved market value (TV) in a certain period of existence of (half) information were summed up in a certain period and we thus received the value of SV marking the significance of the information, that is, its impact on the change in the value of TV.
Short description of the model:
  • S = number of coins in a period of time;
  • F = remaining number of coins for mining;
  • S/F—stock-to-flow index;
  • PV (estimated value) BTC = exp (14.6) * SF ^ 3.3;
  • Square root RV (difference in value) = (PV—TV (market value) BTC) ^ 2;
  • SV (sum of RV in a period in which (half) information caused oscillations about the value) marks the significance that the information left on the BTC value.
Considering the obtained calculations of the SV value, it became evident that (half) information do not only have a significant effect on the BTC value, but that, in some cases, this effect lasted longer, with a lower or higher intensity being calculated. It has been observed that oscillations last for up to two years (the value increased in the period from 2013 to 2015, or up to about half a year (the value decreased in 2019). According to historical data, the recent strong deviation that has lasted for the past three months should end in autumn of 2021 at the latest, because time flow is apparently the only factor that restores the Bitcoin value into the framework of the S2F, that is, the S2FX model. The time needed to return the Bitcoin value to the values determined by S2F and S2FX models depends on the type of information and whether it is information based on true or false data. In any case, it can be concluded from historical data that, regardless of the information provided, over time, the market calms down and returns to the values predicted by the S2F model using a simple formula.
In this research, it focused on a total of eleven news that strongly affected the Bitcoin value.
Table 1 chronologically lists all such (half) information with the initial date of their publication. After such news, the Bitcoin value became global, and the Bitcoin value should have been valid at the time, assuming that the market value is determined exclusively based on the S2F and S2FX models.
A relative difference, source, and brief explanation of what it was and how it affected the Bitcoin value are presented for each of these pieces of news.
The market price under the influence of various information affecting price deviation from the S2F model can be presented as an equation:
X = S2F*(-%) negative information, that is, X = S2F*(-%) positive information.
Several pieces of information should be singled out in the analysis which, from the temporal perspective, had the longest impact on the deviation of values. In Table 1, this is information under the ordinal number 2, which was one of the first ones to inform potential buyers about the sudden rise in Bitcoin value over a short period. For example, the Guardian (Gibbs 2015) published: “The meteoric rise in Bitcoin has meant that within the space of four years, one Norwegian man’s $27 investment turned into a forgotten $886,000 windfall“. A large amount of such news in 2013 and 2014 held the Bitcoin value strongly above the values calculated based on the S2F model.
The information under ordinal number 8 from the end of 2018, published based on the research from October (Mora et al. 2018), strongly influenced the temporary decline in Bitcoin prices in relation to the value determined by the S2F model over several months. Namely, the Nature Portfolio website published the following information: “Bitcoin is a power-hungry cryptocurrency that is increasingly used as an investment and payment system. Here we show that projected Bitcoin usage, should it follow the rate of adoption of other broadly adopted technologies, could alone produce enough CO2 emissions to push warming above 2 °C within less than three decades”. This, and similar news about the impact of Bitcoin mining on climate change strongly kept the Bitcoin value below its value according to the S2F model for several months, until the Bitcoin market value reached the S2F value again in spring of 2019.

5. Conclusions

According to the research results in this paper, unsystematic factors defined by S2F and S2FX models and global (half) information on Bitcoin values have a strong impact on the value of the first BTC cryptocurrency. The impact of unsystematic factors defined by the S2F and S2FX models is dominant. However, given the complexity of the system, numerous systematic and unsystematic factors influence the value of cryptocurrencies and thus, indirectly, the trend of creation and implementation of decentralised digital financial platforms (DeFi) based on various blockchain protocols. Understanding the impact of various factors on the value of cryptocurrencies is of crucial importance in financial infrastructure. The research confirmed the hypothesis of this paper that, in a situation of capital market development, BTC should grow in accordance with the methodology described in the S2F and S2FX models. However, global non-technical (half) information on Bitcoin strongly affects the change in its value. Furthermore, the research theoretically confirmed that the development of the financial market is a precondition for verified trends, but that it is necessary to continue the research to determine to what extent the developed, that is, highly capitalised financial market ensures constant growth of Bitcoin in accordance with the defined methods and influences.
Limitations in the paper originate from the complexity of the environment concerning the impact on the value of cryptocurrencies, relatively new and insufficiently in-vestigated S2F and S2FX methodology, numerous systematic and unsystematic factors that could potentially affect the BTC value, and the anonymity of the authors of the above-mentioned model. Further research should completely exclude the impact of other systematic and unsystematic factors on cryptocurrency value.
Therefore, it is evident that, currently, until the community has found a way to contain excess Bitcoin value, this cryptocurrency cannot serve as a means of preserving the value of assets to small investors; it can only serve speculative investments.

Author Contributions

Conceptualization, Z.M. and V.R.; methodology, Z.M.; validation, Z.M., and V.R.; formal analysis, Z.M.; investigation, Z.M. and V.R.; resources, Z.M. and V.R.; data curation, Z.M.; writing—original draft preparation, V.R.; writing—review and editing, V.R.; visualization, M. Z and V.R.; supervision, Z.M. and V.R.; administration, V.R.; funding acquisition, Z.M. and V.R. All authors have read and agreed to the published version of the manuscript.

Funding

This research received no external funding.

Institutional Review Board Statement

Not applicable.

Informed Consent Statement

Not applicable.

Data Availability Statement

The data sources are given in the data and methodology section.

Conflicts of Interest

The authors declare no conflict of interest.

References

  1. Adizes, Ichak. 2006. Životni Ciklusi Tvrtke. Zagreb: M. E. P. Consult. [Google Scholar]
  2. Arnerić, Josip, and Mladen Mateljan. 2019. Analiza međuovisnosti tržišta kapitala i tržišta kriptovaluta. Ekonomska Misao i Praksa 2: 449–65. [Google Scholar]
  3. Alajbeg, Denis, Zoran Bubaš, and Velimir Šonje. 2012. The efficient market hypothesis: Problems with interpretations of empirical tests. Financial Theory and Practice 36: 53–72. [Google Scholar] [CrossRef]
  4. Allen, Franklin, and Elena Carlleti. 2010. An Overview of the Crisis: Causes, Consequences and Solutions. Urban Economics & Regional Studies eJournal 10: 1–26. [Google Scholar] [CrossRef]
  5. Apopo, Natalya, and Andrew Phiri. 2021. On the (in)efficiency of cryptocurrencies: Have they taken daily or weekly random walks? Heliyon 7. [Google Scholar]
  6. Balcilar, Mehmet, Bouri Elie, Gupta Rangan, and David Roubaud. 2017. Can Volume Predict Bitcoin Returns and Volatility? A Quantiles-Based Approach. Economic Modelling 64: 74–81. [Google Scholar] [CrossRef] [Green Version]
  7. Barbić, Tajana. 2010. Pregled razvoja hipoteze efikasnog tržišta. Privredna Kretanja i Ekonomska Politika 20: 29–61. [Google Scholar]
  8. Baur, Dirk G., Thomas Dimpfl, and Konstantin Kuck. 2017. Bitcoin, gold and the US dollar–A replication and extension. Finance Research Letters 25: 103–10. [Google Scholar] [CrossRef]
  9. Bjerg, Ole. 2016. How is Bitcoin Money? Theory, Culture & Society 33: 53–72. [Google Scholar]
  10. Bodie, Zvi, Alex Kane, and Alan J. Marcus. 2008. Investments, 7th ed. New York: McGraw-Hill. [Google Scholar]
  11. Böhme, Rainer, Christin Nicolas, Edelman Benjamin, and Moore Tyler. 2015. Bitcoin: Economics, Technology, and Governance. Journal of Economic Perspectives 29: 213–38. Available online: http://dx.doi.org/10.1257/jep (accessed on 12 September 2021).
  12. Bouoiyour, Jamal, and Refk Selmi. 2014. What Bitcoin looks like? MPRA Paper No. 58091. Available online: http://mpra.ub.uni-muenchen.de/58091/ (accessed on 18 September 2021).
  13. Bouoiyour, Jamal, Selmi Refk, and Tiwari Aviral. 2014. Is Bitcoin Business Income or Speculative Bubble? Unconditional vs. Conditional Frequency Domain Analysis. MPRA Paper. Munich: University Library of Munich, Available online: https://mpra.ub.uni-muenchen.de/59595/1/MPRA_paper_59595.pdf (accessed on 18 September 2021).
  14. Bouri, Elie, Peter Molnár, Georges Azzi, David Roubaud, and Lars Ivar Hagfors. 2017. On the hedge and safe haven properties of Bitcoin: Is it really more than a diversifier? Finance Research Letters 20: 192–98. Available online: https://isiarticles.com/bundles/Article/pre/pdf/100961.pdf (accessed on 14 September 2021).
  15. Bursztynsky, Jessica. 2020. Warren Buffett: Cryptocurrency ‘Has No Value’—‘I Don’t Own Any and Never Will’. Available online: https://www.cnbc.com/2020/02/24/warren-buffett-cryptocurrency-has-no-value.html (accessed on 14 September 2021).
  16. Buterin, Denis, Ribarić Eda, and Suzana Savić. 2015. Bitcoin-nova globalna valuta, investicijska prilika ili nešto treće? Zbornik Veleučilišta u Rijeci 3: 145–58. [Google Scholar]
  17. Buybit. 2021a. Available online: https://stats.buyBitcoinworldwide.com/stock-to-flow/ (accessed on 14 September 2021).
  18. Buybit. 2021b. Available online: https://stats.buyBitcoinworldwide.com/s2fx/ (accessed on 14 September 2021).
  19. Caporale, Guglielmo Maria, Gil-Alana Luis, and Plastun Alex. 2019. Long-term price overreactions: Are markets inefficient? Journal of Economics and Finance 43: 657–80. [Google Scholar] [CrossRef] [Green Version]
  20. Cardero, Niko. 2020. Why the Stock-to-Flow Bitcoin Valuation Model Is Wrong. Available online: https://www.coindesk.com/markets/2020/06/30/why-the-stock-to-flow-Bitcoin-valuation-model-is-wrong/ (accessed on 14 September 2021).
  21. Chaum, David. 1983. Blind Signatures for Untraceable Payments. Santa Barbara: University of California, Available online: http://www.hit.bme.hu/~buttyan/courses/BMEVIHIM219/2009/Chaum.BlindSigForPayment.1982.PDF (accessed on 14 September 2021).
  22. Cheah, Eng-Tuck, and John Fry. 2015. Speculative bubbles in Bitcoin markets? An empirical investigation into the fundamental value of Bitcoin. Economic Letters 130: 32–36. [Google Scholar] [CrossRef] [Green Version]
  23. Carney, Mark. 2021. Finding Value in Values. Available online: https://www.bnymellon.com/content/dam/bnymellon/documents/pdf/perspectives/mark_carney-finding_value_in_values.pdf.coredownload.pdf (accessed on 14 September 2021).
  24. Ding, Wenzhi, Ross Levine, Chen Lin, and Wensi Xie. 2020. Corporate Immunity to the COVID-19 Pandemic, Working Paper 27055. Available online: https://www.nber.org/papers/w27055 (accessed on 14 September 2021).
  25. Dyhrberg, Anne Haubo. 2015. Bitcoin, Gold and the Dollar—A GARCH Volatility Analysis. Finance Research Letters 16: 85–92. [Google Scholar] [CrossRef] [Green Version]
  26. Dziadkowiec, Jakub. 2021. Bitcoin (BTC) Peak: Wyckoff Distribution. 2013 Bull Run and Pi Cycle. May 20. Available online: https://finance.yahoo.com/news/Bitcoin-btc-peak-wyckoff-distribution-173000176.html (accessed on 14 September 2021).
  27. Fama, Eugene F. 1965. The behavior of stock-market prices. The Journal of Business 38: 34–105. [Google Scholar] [CrossRef]
  28. Financial Times. 2019. Bitcoin Is the 10-Year Treasury of Our Time. Available online: https://www.ft.com/content/b4d55f00-a8e6-3355-ae5c-8d7b6972e666 (accessed on 14 September 2021).
  29. Frisby, Dominic. 2015. Bitcoin: The Future of Money? 1st ed.London: Unbound. [Google Scholar]
  30. Fučkan, Đurđica, and Adrija Sabol. 2013. Planiranje Poslovnih Dometa. Zagreb: Hum Naklada d.o.o. [Google Scholar]
  31. Garcia, David, Tessone Claudio, J. Mavrodiev Pavlin, and Perony Nicolas. 2014. The digital traces of bubbles: Feedback cycles between socio-economic signals in the Bitcoin economy. Journal of the Royal Society Interface 11: 20140623. [Google Scholar] [CrossRef]
  32. Gibbs, Samuel. 2015. Man Buys $27 of Bitcoin, Forgets about Them, Finds They’re Now Worth $886. The Guardian. Available online: https://www.theguardian.com/technology/2015/dec/09/Bitcoin-forgotten-currency-norway-oslo-home (accessed on 14 September 2021).
  33. Glaser, Florian, Kai Zimmermann, Haferkorn Kai, Weber Martin, and Michael Moritz Christianand Siering. 2014. Bitcoin—Asset or Currency? Revealing Users’ Hidden Intentions. ECIS 2014 (Tel Aviv). Available online: https://ssrn.com/abstract=2425247 (accessed on 14 September 2021).
  34. Hammoudeh, Shawkat, and Yuan Yuan. 2008. Metal volatility in presence of oil and interest rate shocks. Energy Economics 30: 606–20. [Google Scholar] [CrossRef]
  35. Hawkins, Amy. 2017. Meet the Millennials Making Big Money Riding China’s Bitcoin Wave. Available online: https://www.theguardian.com/technology/2017/apr/11/meet-the-millennials-making-big-money-riding-chinas-Bitcoin-wave (accessed on 14 September 2021).
  36. Hayes, Adam. 2015. Cryptocurrency value formation: An empirical analysis leading to a cost of production model for valuing Bitcoin. Telematics and Informatics 34: 1308–21. [Google Scholar] [CrossRef]
  37. Hileman, Garrich, and Michel Rauch. 2017. Global Cryptocurrency Benchmarking Study; University of Cambridge. Available online: https://cdn.crowdfundinsider.com/wp-content/uploads/2017/04/Global-Cryptocurrency-Benchmarking-Study.pdf (accessed on 14 September 2021).
  38. Hunter, Gregor Stuart, and Chao Deng. 2016. China Buying Sparks Bitcoin Surge. The Wall Street Journal. Available online: https://www.wsj.com/articles/china-buying-sparks-Bitcoin-surge-1464608221 (accessed on 14 September 2021).
  39. Jenssen, Torbjørn Bull. 2014. Why Bitcoins Have Value, and Why Governments Are Sceptical. Master’s thesis, University of Oslo, Oslo, Norway. Available online: https://core.ac.uk/download/pdf/30902945.pdf (accessed on 14 September 2021).
  40. Kavvadias, Gerasimos. 2017. What Drives the Value of Cryptocurrencies? A Time Series Analysis of Bitcoin. Master’s thesis, Tilburg University, Tilburg, The Netherlands. Available online: http://arno.uvt.nl/show.cgi?fid=145139 (accessed on 14 September 2021).
  41. Kim, Young Bin, Jun Gi Kim, Wook Kim, Jae Ho Im, Tae Hyeong Kim, Shin Jin Kang, and Chang Hun Kim. 2016. Predicting fluctuations in cryptocurrency transactions based on user comments and replies. PLoS ONE 11: e0161197. [Google Scholar] [CrossRef] [Green Version]
  42. Kolodny, Lora. 2021. Elon Musk Says Tesla Will Stop Accepting Bitcoin for Car Purchases. Available online: https://www.cnbc.com/2021/05/12/elon-musk-says-tesla-will-stop-accepting-Bitcoin-for-car-purchases.html (accessed on 14 September 2021).
  43. Kraus, Sascha, Thomas Claus, Matthiasm Breier, Johannson Gast, Allessandro Zardinin, and Tiberius Victor. 2020. The economics of COVID-19: Initial empirical evidence on how family firms in five European countries cope with the corona crisis. International Journal of Entrepreneurial Behaviour & Research 26: 1067–92. [Google Scholar]
  44. Kristoufek, Ladislav. 2014. What Are the Main Drivers of the Bitcoin Price? Evidence from Wavelet Coherence Analysis. Available online: https://arxiv.org/pdf/1406.0268.pdf (accessed on 14 September 2021).
  45. Kyriazis, Nikolaos A. 2020. Is Bitcoin Similar to Gold? An Integrated Overview of Empirical Findings. Journal of Risk and Financial Management 13: 1–19. [Google Scholar] [CrossRef]
  46. Letra, Ivo. 2016. What Drives Cryptocurrency Value? A Volatility and Predictability Analysis. Master’s thesis, Lisbon School of Economics & Management, Lisboa, Portugal. Available online: https://www.repository.utl.pt/bitstream/10400.5/12556/1/DM-IJSL-2016.pdf (accessed on 14 September 2021).
  47. Lu, Hsin-Ke, Li-wei Yang, Peng-Chun Lin, Tzu-Han Yang, and Alexander N. Chen. 2017. A study on adoption of Bitcoin in Taiwan: Using big data analysis of social media. Paper presented at the 3rd International Conference on Communication and Information Processing, Tokyo Japan, November 24–26; pp. 32–38. [Google Scholar] [CrossRef]
  48. Mackintosh, James. 2017. Let’s Be Real: Bitcoin is a Useless Investment. The Wall Street Journal. Available online: https://www.wsj.com/articles/BL-MBB-58585 (accessed on 14 September 2021).
  49. Malini, Helma. 2019. Efficient Market Hypothesis and Market Anomalies of LQ 45 Index in Indonesia Stock Exchange. Sriwijaya International Journal of Dynamic Economics and Business 3: 107. [Google Scholar] [CrossRef]
  50. Masafumi, Nakano, Takahashi Akihiko, and Takahashi Soichiro. 2018. Bitcoin technical trading with artificial neural network. Physica A: Statistical Mechanics and its Applications 510: 587–609. [Google Scholar]
  51. Matta, Martina, Ilaria Lunesu, and Marchesi Michele. 2015. Bitcoin Spread Prediction Using Social and Web Search Media. Available online: http://ceur-ws.org/Vol-1388/DeCat2015-paper3.pdf (accessed on 14 September 2021).
  52. McKinnon, John D., and Ryan Tracy. 2014. IRS Says Bitcoin Is Property, Not Currency. The Wall Street Journal. Available online: https://www.wsj.com/articles/SB10001424052702303949704579461502538024502 (accessed on 16 September 2021).
  53. Medium. 2021. Available online: https://medium.com/coinmonks/the-Bitcoin-price-crash-smart-money-manipulation-of-the-market-217c4ada6b41 (accessed on 14 September 2021).
  54. Mishkin, Frederic S., and Stanly G. Eakins. 2003. Financijska Tržišta + Institucije. 4 izdanje. Zagreb: Mate d.o.o. [Google Scholar]
  55. Mora, Camilo, L. Rollins Randi, Katie Taladay, Michael B. Kantar, Mason K. Chock, Shimada Mia, and Erik C. Franklin. 2018. Bitcoin emissions alone could push global warming above 2 °C. Nature Climate Change 8: 931–33. [Google Scholar] [CrossRef]
  56. Nakamoto, Satoshi. 2008. Bitcoin: A Peer-to-Peer Electronic System. Available online: https://fimaplus.com/wp-content/uploads/2018/03/Bitcoin-Whitepaper.pdf (accessed on 12 September 2021).
  57. Nurdina, Nurdina, R. Yudi sidharta, and Mochamad Mochklas. 2021. Inefficient Markets, Anomalies, And Investor Behavior: A Literature Review. International Journal of Economics, Business and Accounting Research (IJEBAR) 5: 354–74. [Google Scholar] [CrossRef]
  58. O’Brien, Matt. 2015. Bitcoin Is Not the Future of Money Its Either a Ponzi Scheme or a Pyramid Scheme. The Washington Post. Available online: https://www.washingtonpost.com/gdpr-consent/?next_url=https%3a%2f%2fwww.washingtonpost.com%2fnews%2fwonk%2fwp%2f2015%2f06%2f08%2fBitcoin-isnt-the-future-of-money-its-either-a-ponzi-scheme-or-a-pyramid-scheme%2f (accessed on 14 September 2021).
  59. Ozili, Peterson, and Thankom Arun. 2020. Spillover of COVID-19: Impact on the Global Economy. Available online: https://papers.ssrn.com/sol3/papers.cfm?abstract_id=3562570 (accessed on 14 September 2021).
  60. Park, Han Woo, and Youngjoo Lee. 2019. How Are Twitter Activities Related to Top Cryptocurrencies’ Performance? Evidence from Social Media Network and Sentiment Analysis. Društvena istraživanja 28: 435–60. [Google Scholar] [CrossRef]
  61. Peck, Morgen. 2012. Years in, Bitcoin Digital Money Gains Momentum. Scientific American. Available online: https://www.scientificamerican.com/article/3-years-in-Bitcoin-digital-money-gains-momentum/ (accessed on 20 September 2021).
  62. Panagiotidis, Theodore, Stengos Thanasis, and Vravosinos Orestis. 2019. A Principal Component-Guided Sparse Regression Approach for the Determination of Bitcoin Returns. Journal of Risk and Financial Management 13. [Google Scholar] [CrossRef] [Green Version]
  63. Pandey, Asheesh, Anand Mittal, and Arjun Mittal. 2021. Size effect alive or dead: Evidence from European markets. Cogent Economics & Finance 9: 1897224. [Google Scholar] [CrossRef]
  64. Parveen, Shagufta, Zoya Wajid Satti, Qazi Abdul Subhan, and Sana Jamil. 2020. Exploring market overreaction, investors’ sentiments and investment decisions in an emerging stock market. Borsa Istanbul Review 20: 224–35. [Google Scholar] [CrossRef]
  65. Polasik, Michal, Anna Iwona Piotrowska, Tomasz Piotr Wisniewski, Radoslaw Kotkowski, and Geoffrey Lightfoot. 2014. Price Fluctuations and the Use of Bitcoin: An Empirical Inquiry. Available online: https://www.ecb.europa.eu/pub/conferences/shared/pdf/retpaym_150604/polasik_paper.pdf (accessed on 20 September 2021).
  66. Poyser, Obryan. 2017. Exploring the Determinants of Bitcoin’s Price: An Application of Bayesian Structural Time Series. Available online: https://arxiv.org/ftp/arxiv/papers/1706/1706.01437.pdf (accessed on 20 September 2021).
  67. Priem, Randy. 2021. An Exploratory Study on the Impact of the COVID-19 Confinement on the Financial Behavior of Individual Investors. Economics, Management, and Financial Markets 16: 9–40. [Google Scholar] [CrossRef]
  68. Seys, Jens, and Kjartan Decaestecker. 2016. The Evolution of Bitcoin Price Drivers: Moving Towards Stability? Master’s thesis, University of Ghent, Ghent, Belgium. Available online: https://libstore.ugent.be/fulltxt/RUG01/002/273/510/RUG01-002273510_2016_0001_AC.pdf (accessed on 14 September 2021).
  69. Simser, Jeffrey. 2015. Bitcoin and modern alchemy: In code we trust. Journal of Financial Crime 22: 155–69. [Google Scholar] [CrossRef]
  70. Stöferle, Ronald Peter, and Mark J. Valek. 2021. In Gold We Trust. Report; Monetary Climate Change; Incrementum AG. Available online: https://ingoldwetrust.report/igwt/?lang=en (accessed on 14 September 2021).
  71. Stöferle, Ronald Peter, and Mark J. Valek. 2020. In Gold We Trust. Report: The Dawning of a Golden Decade; Incrementum AG. Available online: https://ingoldwetrust.report/wp-content/uploads/2020/05/In-Gold-We-Trust-report-2020-Extended-Version-english.pdf (accessed on 14 September 2021).
  72. Šonje, Velimir, and Kristijan Kotarski. 2020. Korona Ekonomika: Pet Jahača Apokalipse. Zagreb: Arhivanalitika. [Google Scholar]
  73. Thelwall, Mike. 2017. Can social news websites pay for content and curation? The SteemIt cryptocurrency model. Journal of Information Science, 1–24. [Google Scholar] [CrossRef]
  74. Urquhart, Andrew, and Hanxiong Zhang. 2019. Is Bitcoin a hedge or safe haven for currencies? An intraday analysis. International Review of Financial Analysis 63: 49–57. [Google Scholar] [CrossRef]
  75. Van Horne, Jemes C., and John M. Wachowicz. 2008. Fundamentals of Financial Management, 13th ed. Harlow: Prentice-Hall, Inc., Pearson Education Limited. [Google Scholar]
  76. Wang, Pengfei, Wei Zhang, Xiao Li, and Dehua Shen. 2019. Is Cryptocurrency a Hedge or a Safe Haven for International Indices? A Comprehensive and Dynamic Perspective. Finance Research Letters 31: 1–18. [Google Scholar] [CrossRef]
  77. Weiss Crypto Rating. 2021a. The World’s First Ratings of Bitcoin, Ethereum, Ripple, Dash and 100+ Cryptocurrencies by a Financial Rating Agency. Available online: https://weisscryptocurrencyratings.com/reports/WCY/ext/468y/?ec=EWCYUA01&sc=WCAEZ&campid=WCY2018-10 (accessed on 16 September 2021).
  78. Weiss Crypto Rating. 2021b. Top Coins by Rating. Available online: https://weisscrypto.com/ (accessed on 14 September 2021).
  79. Wisniewska, Anna. 2016. Bitcoin as a Virtual Currency, Working Papers 1/2016. Institute of Economic Research revised Feb. Available online: https://econpapers.repec.org/scripts/redir.pf?u=http%3A%2F%2Fwww.badania-gospodarcze.pl%2Fimages%2FWorking_Papers%2F2016_No_1.pdf;h=repec:pes:wpaper:2016:no1 (accessed on 14 September 2021).
  80. Yoo, Soonduck. 2021. How to Design Cryptocurrency Value and How to Secure Its Sustainability in the Market. Journal of Risk and Financial Management 14. [Google Scholar] [CrossRef]
Figure 1. Bitcoin price movements according to the Wyckoff Market Cycle. Source: Medium (2021). https://medium.com/coinmonks/the-Bitcoin-price-crash-smart-money-manipulation-of-the-market-217c4 ada6b41 (accessed on 18 September 2021).
Jrfm 14 00546 g001
Figure 2. Oscillations of Bitcoin market values in relation to the value calculated on the basis of the S2F model in the period from 2010 to 2021, and projection of values by 2025. Source: Buybit (2021a) https://stats.buyBitcoinworldwide.com/stock-to-flow/ (accessed on 18 September 2021). Legend: Painted line: market price at the end of the day. Thin line: S2F value.
Jrfm 14 00546 g002
Figure 3. Oscillations of Bitcoin market values in relation to the value calculated on the basisof the S2FX model in the period from 2010 to 2021 and projection of values by 2025. Source: Buybit (2021b). https://stats.buyBitcoinworldwide.com/s2fx/ (accessed on 18 September 2021). Legend: Painted line: market price at the end of the day. Thin line: S2F value.
Jrfm 14 00546 g003
Table 1. The selected significant (half) information that had a strong impact on Bitcoin value and the difference in relation to the estimated value according to the S2F in the period from 2011 to 2020.
Ord. No.DatePrices According to S2F ModelMarket ValueRelative Deviation from Market ValueSourceShort Description
1.10 April 201320.45201.52885%(Peck 2012)Increase in acceptance of Bitcoin, second serious separation from S2F. The first is hard to explain with the news because the market was very small and not much capital is needed for it to move to the price above S2F.
2.02 December 201371.771022.951325%(Gibbs 2015)People start to realise thst it is possible to earn exceptional amounts of money through Bitcoin and that this is just the beginning of this revolutionary technology.
3.06 June 2014134.77650.41383%(McKinnon and Tracy 2014)The IRS had classsified Bitcoin into the assets class, after which the investors realised that cryptocurrency has earning potential although they are obligated to pay taxes.
4.25 August 2015343.29220.36−36%(O’Brien 2015)Because of this FUD, Bitcoin fell under the S2F level for the first time after 2012.
5.16 June 2016460.11762.1766%(Hunter and Deng 2016)China had a great influence on the cryptomarket at the time, and the news of adding a billion dollars to market capitalisation at the time stirred excitement among investors.
6.28 March 20171562.871044.25−33%(Mackintosh 2017)The Winklevoss brothers wanted to report the BTC to ETF, but they were rejected, and that is when the Bitcoin value became questionable in the public.
7.17 December 20175875.9619,065.00224%(Hawkins 2017)Bitcoin was moving below the S2F curve and this news sparked a bullish sentiment and pushed Bitcoin from the price of 1044$ to approximately 20,089$, which means that it grew almost 20x in approximately 9 months.
8.14 December 20186784.323253.46−52%(Mora et al. 2018)The drop below the S2F line instigated a research according to which Bitcoin mining could increase global warming by 2 °C.
9.10 July 20197867.5012,099.1254%(Financial Times 2019)The Financial Times promotes Bitcoin as a bond of our age.
10.12 March 20208600.124106.00−52%(Bursztynsky 2020)The COVID-19 crisis has affected the prices of everything, including Bitcoin. When Warren Buffet additionally depreciated Bitcoin, it created an exceptionally negative sentiment in the market and pushed Bitcoin again below the S2F curve by more than 50%.
11.12 May 202181,112.6833,804.20−58%(Kolodny 2021)Elon Musk initiated the bear market by announcing that Tesla will not be accepting Bitcoin transactions because they are not eco-friendly, which was complemented by the situation with Chinese miners, which together led to the lowest point in relation to S2F (excluding the situation before 2012).
Source: Authors according to different sources.
Publisher’s Note: MDPI stays neutral with regard to jurisdictional claims in published maps and institutional affiliations.

