Article

An Assessment of the Efficiency of Canadian Power Generation Companies with Bootstrap DEA

Research Group in Operations, Analytics and Decision Sciences (RGinOADS), School of Business Administration, Faculty of Management, Laurentian University, 935 Ramsey Lake Road, Sudbury, ON P3E 2C6, Canada
*
Author to whom correspondence should be addressed.
J. Risk Financial Manag. 2021, 14(10), 498; https://doi.org/10.3390/jrfm14100498
Submission received: 18 September 2021 / Revised: 9 October 2021 / Accepted: 12 October 2021 / Published: 18 October 2021
(This article belongs to the Special Issue Sustainability, Marketing and Communication)

Abstract

:
Power generation companies play an important role in the Canadian economy, as most of the economic activities in the manufacturing and service sectors are powered by electricity. The significance of the Canadian power generation industry shows that efficiency analysis is essential for efficiently managing power generation and distribution in Canada. However, there have been few attempts to study the relative efficiencies of the Canadian power generation companies. This study fills in this gap by assessing the overall technical, managerial, and scale efficiencies of a sample of Canadian power generation companies via the non-parametric bootstrap DEA methodology, with firm-level annual inputs and outputs data over an 18-year horizon. The results of our investigation indicate low levels of overall technical and managerial efficiencies but relatively high levels of scale efficiencies of the Canadian power generation companies over the entire study period. We also found that the 2007–2009 financial crisis impacted the relative performance of the Canadian power generation companies. Our results also allowed us to identify the benchmark power generation companies for each type of efficiency that the inefficient companies should target toward improving their efficiency.

1. Introduction

Canada is the world’s sixth-largest producer of electricity, with a production of 693,400 GWh in 2017 (BP Statistical Review of World Energy 2018), and the world’s second-largest producer of hydroelectricity (Electricity Facts, Natural Resources Canada 2019). Electricity is an important resource in Canada in terms of both generation and export, and the power generation companies play an important role in the accessibility and affordability of energy supply across the Canadian population. All other industries and businesses depend on a reliable, sustainable, and cost-effective electricity system for their daily operations.
Canadian power generation companies have been facing significant challenges due to the cumulative effects of several federal, provincial, and territorial regulations, which have affected their ability to operate efficiently and make optimal decisions about power generation (Mirnezami 2014). The efficiency of the power generation companies has been further affected by the changing and uncertain electricity demand and supply conditions over the economic cycles (Qudrat-Ullah 2013). The past economic recessions stalled the demand, thereby further widening the imbalance between electricity demand and supply. After the recession period, the electricity demand suddenly increased driven by the economic activities, whereas the supply did not follow due to a lack of operational efficiency of the power generation companies (Qudrat-Ullah 2013). To improve the operational efficiency of power generation companies, managers, and policy makers need to understand how inputs are being used for continuous improvement. However, there is a lack of academic literature and business practices that focus on exploring the performance of the Canadian power generation companies, which motivates this work.
Previous performance analysis studies of the Canadian power generation companies have been limited to the efficiency assessment of hydroelectric power-generating plants (Wang et al. 2014). These studies found that the overall efficiency of the hydropower generation in Canada improved in 2012, following a downtrend from 2005 to 2011 (Wang et al. 2014). Wang et al. (2014) also identified energy savings and social responsibility as the key factors that influence the efficiency of the sustainable hydropower production in Canada. Efficiency analysis of the power generation companies has received worldwide attention because of its significance to the national economies of many countries (Moeini and Afshar 2011). However, few studies have focused on analyzing the efficiency of Canadian power generation companies. The efficiency of power generation companies around the globe has also been studied through data envelopment analysis (DEA) (Lyu and Shi 2018; Jebali et al. 2017; Al-Refaie et al. 2016; Çelen 2013).
DEA is a non-parametric technique for comparing the relative efficiencies of decision-making units and benchmarking their performance. The DEA technique is used to estimate three typical types of efficiency: (i) the overall technical efficiency (OTE) measured by the CCR model, which assesses both the management and the scale of operations (Charnes et al. 1978); (ii) the pure technical efficiency (PTE) or managerial efficiency measured by the BCC model, which assesses the management of operations only (Banker et al. 1984); and (iii) the scale efficiency, defined as the ratio of the overall efficiency and the managerial efficiency, which measures the extent to which the overall technical efficiencies can be traced back to the whole operations’ scale rather than the management effectiveness (Banker et al. 1984). Since the DEA technique is based on a deterministic model, the bootstrap DEA methodology is suggested to take into account any uncertainty and find robust efficiency estimators (Simar and Wilson 1998). The choice of input and output variables plays a key role in accurately estimating the relative efficiencies of the decision-making units in the DEA methodology. Several studies have used various input and output variables to model the efficiency of power generation companies (e.g., Mahmoudi et al. 2019; Sueyoshi et al. 2019; Al-Refaie et al. 2016; Jamasb and Pollitt 2001). To the best of our knowledge, this is the first study of its kind in the Canadian context.
This research was conducted to evaluate the relative performance of Canadian power generation companies via bootstrap DEA models. The specific objectives were (i) to benchmark Canadian power generation companies across the country, the regions, the provinces, and the types of ownership; (ii) to study the evolution of the annual relative efficiencies of power generation companies over the study period (2001–2018); and (iii) to study the impact of the 2007–2009 financial crisis on the relative efficiency of the power generation companies. In particular, we are interested in the following research questions:
-
What are the most efficient power generation companies across the country?
-
Does the efficiency of the power generation companies vary across the provinces and the territories?
-
Does the type of ownership affect the overall technical efficiency of the Canadian power generation companies?
-
Did the 2007–2009 crisis negatively affect the overall technical efficiency of the Canadian power sector?
In addition, we hypothesize that since the publicly owned power generation companies are typically larger in size, and may have access to more financial resources, they may feature higher overall technical efficiency than their private sector counterparts. Second, we also conjecture that as the 2007–2009 financial hit all the sectors of the global economy relatively hard, the overall technical efficiency of the Canadian power generation might have declined over this period, compared to the pre- and the post-financial crisis periods.
To answer our research questions, and test our hypotheses, we will use the non-parametric bootstrap DEA methodology with firm-level annual input and output data from 17 power generation companies over the 18 years. The results will help identify the efficient benchmark power generation companies, which serve as targets for the inefficient companies to achieve their best practices. In particular, the results of our study may prove useful to power generation companies’ top management, authorities/decision makers, and individuals interested in the Canadian energy sectors, as they shed light on:
  • the main sources of operational inefficiency in the Canadian power generation companies;
  • the potential strategies to improve the operational efficiency of the inefficient companies;
  • the potential strategies to reduce the impact of future economic cyclical variations on the Canadian power generation companies; and
  • the understanding of the best practices in the power generation energy sector, and potential strategies for the inefficient companies to improve their overall technical and managerial efficiencies.
The remainder of the paper is organized as follows. Section 2 provides a literature review of the energy industry in Canada and the efforts related to measuring the efficiency of power generation companies. Section 3 presents the DEA methodology; the calculation of the so-called Malmquist productivity index (MPI), often used in DEA analysis to assess the betterment of the decline of companies’ efficiency over two consecutive periods; and our data collection strategy. Analysis of our empirical results is presented in Section 4. Section 5 provides managerial insights and Section 6 concluding remarks.

2. Literature Review

Canadian power companies produce, transport, and distribute electrical energy to industrial, commercial, residential, and institutional customers across the provinces and territories. They play a pivotal role in the national economic growth. However, these companies face many federal and provincial regulations for a low-carbon and clean energy future, which requires significant investments to reduce greenhouse gas (GHG) emissions and for renewable energy solutions. These regulations have significantly increased the cost of production for the power generation companies, thereby reducing their efficiency. This in turn affects the efficiency of many production and service organizations, which are dependent on the power generation companies for reliable, sustainable, and cost-effective electricity for their day-to-day operations.

2.1. The Canadian Energy Industry

In Canada, electricity is produced from both non-renewable resources, such as crude oil, coal, natural gas, uranium, and renewable resources, such as hydroelectric and wind production. Canada and the United States share a highly integrated electricity grid system, with more than 34 cross-border transmission lines. This integrated electricity system is highly impacted by the economic fluctuations in the United States market. Therefore, it is important not only to assess the efficiency of the power generation companies but also to understand how the efficiency is impacted by the economic fluctuations in the market.
In 2018, the Canadian energy sector produced approximately 32 percent more than in 2005, and in 2019 accounted for 10 percent of the nominal gross domestic product (GDP).1 According to the Canadian government, the energy sector generated 641.1 terawatt-hours (TWh) of electricity in 2018, of which hydro sources accounted for approximately 60 percent, nuclear 15 percent, non-hydro renewables 7 percent, coal 7 percent, and gas/oil/others 11 percent.2 It is estimated that by 2030, the domestic fuel consumption will be 12 percent lower, and 35 percent lower by 2050, whereas renewables and nuclear will grow by 31 percent by 2050 and become a larger share of the energy mix (Government of Canada 2020). In 2012, it was estimated that the power generation companies needed to invest at least $350 billion by 2030 to meet the growing demand and to modernize the aging infrastructure (The Conference Board of Canada 2012). In 2018, it was estimated that investments in infrastructure at the magnitude of $1.7 trillion would be necessary by 2050 in order for Canadian power generation companies to meet environmental regulations and move to a more resilient and low-carbon economy (The Conference Board of Canada 2018).
The power generation companies supply electricity to three sectors, namely (i) residential, (ii) commercial, and (iii) industrial, and the change in demand in each sector impacts the efficiency of the power generation companies. According to the Government of Canada, in 2016, the residential sector accounted for 33.3 percent of the total electricity produced. This includes energy for space and water heating, air conditioning, appliances, and other end-use energy devices. The residential sector demand in different provinces, which affects the efficiency of the power generation companies, is met by different sources. For example, in 2020, hydroelectricty accounted for 96.8 percent in Manitoba, 95.6 percent in Newfoundland and Labrador, 93.9 percent in Quebec, 88.7 percent in British Columbia, and 87.1 percent in Yukon, whereas natural gas accounted for 46.3 percent in Alberta, 39.2 percent in Saskatchewan, and 14.4 percent in Nova Scotia (Government of Canada 2020).3
The commercial sector, which includes offices, retail, warehousing, government, and institutional buildings, utilities, communications, and other service industries, accounted for 23.7 percent of the energy consumption in 2016 (Government of Canada 2020).4 The potential for growth of the demand for electricity in the commercial sector is high, as the Canadian economy is growing. This is amply supported by the growth in the GDP and new constructions across the country. However, more efficient heating/ventilation and air-conditioning systems lead to reduced energy demand. This growth in demand, on the one hand, and the possible reduction in demand, on the other hand, lead to demand uncertainty, thus affecting the efficiency of the power generation companies.
The industrial sector, which includes manufacturing, forestry, fisheries, agriculture, construction, and mining industries, accounted for 40.8 percent of the electricity demand in 2016 (Government of Canada 2020),5 contributes to environmental pollution, and is the target of several regulatory policies, which leads to its underlying demand uncertainty, thereby further impacting the efficiency of the power generation companies.

2.2. Efficiency Measurement of Power Generation Companies

The relative efficiency of electricity generation plants using DEA was assessed for the first time by Färe et al. (1983). They found that few electric utilities in Illinois were technically efficient, with a large variation in inefficiency across firms. Since then, a number of studies have been conducted for assessing the efficiency of energy generation and consumption through DEA. Zhou et al. (2008) conducted a detailed review of about 100 publications that assessed the relative efficiency in the field of energy and environmental studies through DEA.
DEA-based models are widespread in assessing the efficiency of the power generation companies around the globe. Lyu and Shi (2018) used the DEA methodology to analyze the financing efficiency of the renewable energy industry in different parts of the globe. They found low financing efficiency in most of the renewable energy industries, except for the wind power industry, which was found to have relatively high comprehensive financing efficiency (Lyu and Shi 2018). The latter studies aimed at analyzing the cause of the financing gap and proposed bond financing as a remedy (Ng and Tao 2016). Other work suggested key supportive policies to improve the financial efficiency of the renewable energy industry (Ng and Tao 2016).
On another front, Çelen (2013) analyzed the efficiency of 21 Turkish electricity companies using the DEA and Tobit models and found that the customer density in the region and the private ownership affect the efficiencies positively, and suggested privatization as a strategy to improve the efficiency of the public distribution companies. Most of the studies on the efficiency of the power generation companies have focused only on the hydropower efficiency around the globe. For example, Barros and Peypoch (2007) used the DEA frontier model to estimate the technical efficiency of the hydroelectric-generating plants in Portugal. Barros (2008) further divided the total productivity change into technical change and technological change and benchmarked the companies for best management practices. Jha and Shrestha (2006) used an input-oriented DEA model to evaluate the performance of hydropower plants in Nepal. They found that around 80 percent of the hydropower plants in Nepal were operating inefficiently and only a few hydropower plants such as Kaligandaki and Sundarijal were efficient (Jha and Shrestha 2006).
The efficiency of the hydropower generation in Canada has also been analyzed due to its significant contribution to the economy of many provinces. In Wang et al. (2014), this was done through the Technique for Order Preference by Similarity to Ideal Solution (TOPSIS) model. The results showed that the overall efficiency of the hydropower generation experienced a downtrend from 2005 to 2011, mainly due to the financial crisis, and suggested energy savings and social responsibility as key factors to improve the efficiency of the sustainable hydropower production (Wang et al. 2014).
To the best of our knowledge, no previous work assessed the overall, managerial, and scale efficiencies of power generation companies operating across different regions of Canada. Thus, this current work fills in this gap and takes a step further by identifying, for each type of efficiency, the benchmark companies that the inefficient companies should target for potential areas of improvement.

3. Methodology

3.1. Data Envelopment Analysis and Bootstrapping

Data envelopment analysis (DEA) is one of the most prolific decision-making techniques of the past four decades. DEA has extensively been applied to measure the performance or relative efficiency of private and public organizations across almost all sectors. For an exhaustive review of theoretical and applied studies in DEA, please refer to Emrouznejad and Yang (2018).
DEA has several advantages compared to its counterpart parametric models (Banker et al. 1989). First, it converts multiple inputs and outputs into a comprehensible measure of relative efficiency for a sample of decision-making units (DMUs). In addition, this technique allows performing benchmarking for the DMUs that are non-efficient without setting an a priori relationship between the inputs and outputs. DEA establishes an efficiency frontier by evaluating the efficiency of all DMUs relative to that frontier. A DMU is considered efficient if it is located on the frontier of excellence and if no other DMU can produce more outputs by using an equal or smaller quantity of inputs or if no other DMU can use fewer inputs to produce an equal or larger quantity of outputs (Lovell 1993; Fare et al. 1994). However, it has to be noted that DEA results may be sensitive to outliers (i.e., extreme observations, non-homogenous DMUs, etc.), and many techniques have been used to deal with that DEA limitation. Among these techniques, the bootstrap DEA methodology that we are using in this study is one of the solutions.
Consider n DMUs (in this study, Canadian power generation companies observed annually from 2001 to 2018) that transform four inputs, namely number of employees, total assets, operating expenses, and capital expenditures, to produce two outputs, total revenues and total electricity generation. These inputs and outputs variables were used in previous work (see Table 1 in the next sub-section). In the sequel, the inputs consumed by DMUj will be denoted as x j s , s = 1 , , 4 ; j = 1 , , n . Similarly, the outputs produced by DMUjwill be denoted as y j r , r = 1 , 2 . Let v s and μ r be the relative importance of input s and output r, respectively. In addition, let h j be the efficiency ratio of DMUj and ε a small positive number.
Assume we want to evaluate the efficiency of DMUj0, j 0 { 1 , 2 , , n } , and that constant returns to scale prevail. This may be cast into the following simple linear programming model (a linearized version of a fractional model), known as the CCR input-oriented model:
max   h 0 C C R = r = 1 2 μ r y j 0 r subject   to : r = 1 2 μ r y j r s = 1 4 v s x j s 0 ,   j = 1 , , n s = 1 4 v s x j 0 s = 1 μ r , v s ε ,                    r = 1 , 2 ;   s = 1 , , 4
Simply put, Model (1) maximizes the efficiency ratio of DMUj0 (under evaluation), while requiring that the efficiency ratio of each of the DMUs not exceed 1 or 100 percent. This way, this model captures the overall technical efficiency, including production practices as well as the efficiency in scale size due to economies of scale.
The above formulation is slightly modified as follows, if variable returns to scale apply, to obtain the so-called BCC model:
max   h 0 B C C = r = 1 2 μ r y j 0 r u 0 subject   to : r = 1 2 μ r y j r s = 1 4 v s x j s u 0 0 ,   j = 1 , , n s = 1 4 v s x j 0 s = 1 μ r , v s ε ,                    r = 1 , 2 ;   s = 1 , , 4
In Model (2), the sign of u 0 will indicate whether constant, increasing, or decreasing returns to scale prevail. For a further account, see Banker et al. (1984). The efficiency ratio, as defined in Model (2), represents the use of best management practices at a given scale size. By combining the efficiencies from the CCR and BCC models, we can determine both the portion of the overall (CCR) technical efficiency that is due to suboptimal production practices and the portion due to suboptimal scale (BCC). Since we are interested in the source of efficiencies and inefficiencies, we will consider the following ratio to evaluate whether DMUj0 operates at optimum scale size or with the right amount of resources via the following scale efficiency ratio:
h 0 S E = h 0 C C R h 0 B C C
DEA models also prove useful in identifying benchmark DMUs toward which inefficient DMUs may mend their practices in their pursuit of achieving efficiency. A DMU is considered efficient if its ratio h0, as defined in Models (1) and (2), is 1. Under constant returns to scale, the following dual problem, associated to Model (1), provides a suitable setting toward such an identification:
min θ 0 = z 0 ε ( i = 1 4 s i + i = 1 2 s i + ) subject   to : x i j 0 z 0 j = 1 n λ j x i j s i = 0 ,     i = 1 , , 4 j = 1 n λ j y r j s r + = y r j 0 ,               r = 1 , 2 λ j , s i , s r + 0 ;                          j = 1 , , n ; i = 1 , , 4 ; r = 1 , 2
θ 0 , the value of the objective function of Model (4), measures the efficiency ratio of the evaluated DMU, namely DMUj0. The benchmark DMUs, which form an envelope of the efficiency frontier, are identified by the non-zero λ j s , j = 1 , , n . For an inefficient DMU, z 0 measures the fraction of inputs needed to produce outputs equivalent to its benchmark DMUs. s i and s r + are slack variables associated with input i and output r, respectively. The dual of the BCC model is the same as Model (4), with the following additional convexity constraint:
j = 1 n λ j = 1
Notwithstanding the fact that the original versions of the DEA models can handle multiple inputs and outputs, they are limited by their deterministic nature. The efficiency ratios of DMUs are evaluated on a sample of observations χ = { ( x i j , y r j ) , i = 1 , , m ; r = 1 , , t ; j = 1 , , n } . As a result, such ratios may be viewed as point estimates of the true ratios, which are unknown. A few past studies have found that the conventional point estimators obtained from the classical DEA models do not provide consistent results (Toma et al. 2017).
We may assume that the sample χ is a particular realization of an unknown data-generating process, Ρ . The latter being unknown also means so are the true efficiency ratios. As a result, the solutions to the dual problems (Models (4) and (4–5)) are point estimates of the true efficiency scores. As Ρ is unavailable, we will use sample χ and bootstrapping to build an approximate distribution, P ^ , of Ρ , which we expect will replicate the statistical properties of Ρ . This way, we can generate B samples from P ^ , and for each DMUj, j = 1 , , n , solve Model (4) or Model (4–5) for each sample to obtain B estimates θ ^ j b , b = 1 , , B , thus obtaining a better estimation of the true efficiency scores, as compared to the regular DEA efficiency ones. In the numerical experiments, we will take B = 2000 to ensure sufficient coverage of the confidence intervals.

3.2. Efficiency Variation over Time

We will use a sample of 18 years to calculate the efficiency of the companies under study. As a result, we have panel data, which will allow analyzing the evolution of the efficiency of each of the company under study over time. Under this setting, each DMU is treated as a different unit over time. This way, the efficiency of a DMU in a time period t may be contrasted against its own efficiencies in other time periods, in addition to the efficiency of the other units (Asmild et al. 2004). This can be achieved under the umbrella of DEA window analysis, introduced by Charnes et al. (1985). However, if year-over-year comparisons are sought, the so-called Malmquist productivity index (MPI), which is often combined with DEA window analysis, e.g., Al-Refaie et al. (2016), may prove a suitable device. Developed by Malmquist (1953), the MPI reflects the increase, decrease, or stationarity in the efficiency of DMUs over two consecutive periods. Thus, the productivity/efficiency of a DMU is improved from period t to period t+1 if the index is larger than 1, deteriorated if the index is lower than 1, and remains unchanged if the index is 1 (Al-Refaie et al. 2016).
Let θ 0 t ( x 0 t , y 0 t ) and θ 0 t ( x 0 t + 1 , y 0 t + 1 ) denote the efficiency measures of DMU0 for a reference technology at period t based on its inputs–outputs at periods t and t+1, respectively. Similarly define the efficiency measures θ 0 t + 1 ( x 0 t , y 0 t ) and θ 0 t + 1 ( x 0 t + 1 , y 0 t + 1 ) . The MPI is then given by (Al-Refaie et al. 2016):
M P I t t + 1 = [ θ 0 t ( x 0 t , y 0 t ) θ 0 t ( x 0 t + 1 , y 0 t + 1 ) θ 0 t + 1 ( x 0 t , y 0 t ) θ 0 t + 1 ( x 0 t + 1 , y 0 t + 1 ) ] 1 2 × θ 0 t + 1 ( x 0 t + 1 , y 0 t + 1 ) θ 0 t ( x 0 t , y 0 t )
Observe that θ t ( x 0 t , y 0 t ) and θ t + 1 ( x 0 t + 1 , y 0 t + 1 ) are obtained from Model (4). Following Al-Refaie et al. (2016), θ t ( x 0 t + 1 , y 0 t + 1 ) and θ t + 1 ( x 0 t , y 0 t ) are calculated through Model (7) and Model (8), respectively, which are slight modifications of Model (4):
min   θ 0 t = z 0 ε ( i = 1 4 s i + i = 1 2 s i + ) subject   to : x i j 0 t z 0 j = 1 n λ j x i j t + 1 s i = 0 ,     i = 1 , , 4 j = 1 n λ j y r j t s r + = y r j 0 t + 1 ,               r = 1 , 2 λ j , s i , s r + 0 ;                          j = 1 , , n ; i = 1 , , 4 ; r = 1 , 2
min   θ 0 t + 1 = z 0 ε ( i = 1 4 s i + i = 1 2 s i + ) subject   to : x i j 0 t + 1 z 0 j = 1 n λ j x i j t s i = 0 ,     i = 1 , , 4 j = 1 n λ j y r j t + 1 s r + = y r j 0 t ,               r = 1 , 2 λ j , s i , s r + 0 ;                          j = 1 , , n ; i = 1 , , 4 ; r = 1 , 2

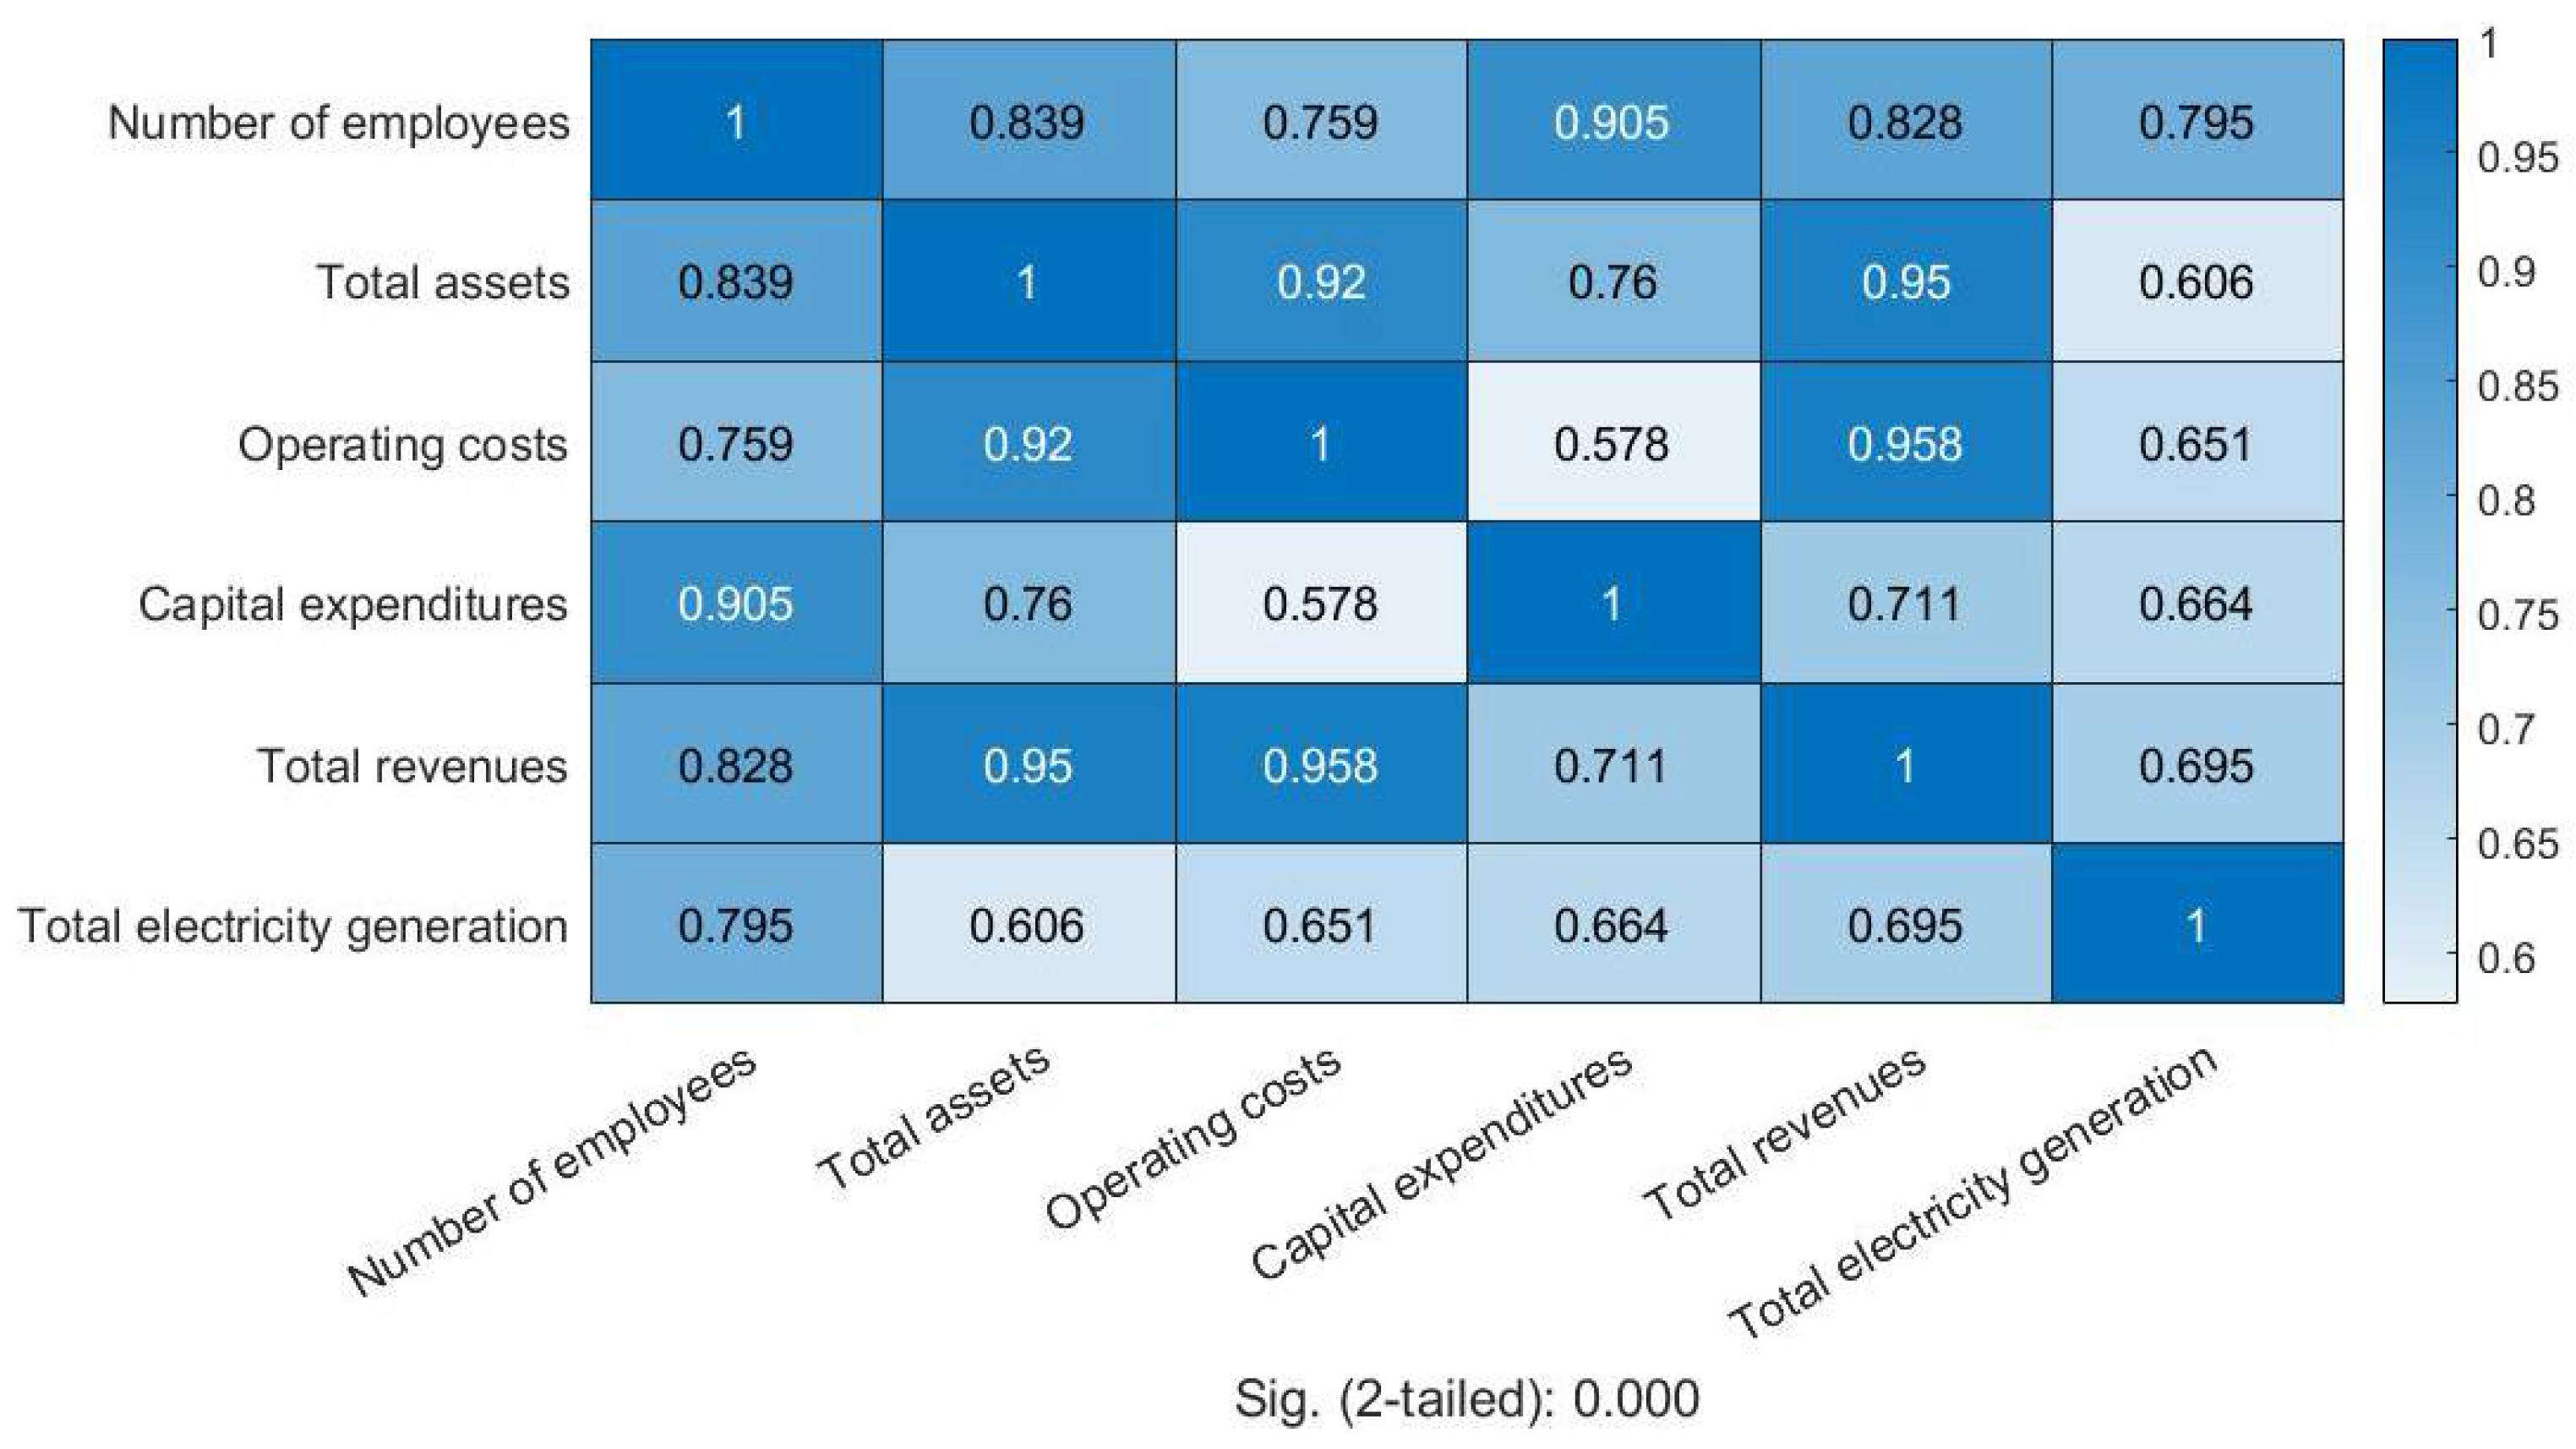
3.3. Selection of the Inputs and Outputs

The choice of input and output variables significantly influences the results obtained from a DEA model. Table 1 provides a sample of input and output variables used in previous studies on the energy efficiency of power generation companies. As discussed in the literature review section, most of the studies using the DEA methodology focused on the energy efficiency from an ecological and environmental point of view, with few assessing the overall technical, managerial, and scale efficiencies of power generation companies.
The studies listed in Table 1 used both physical and financial variables as inputs and outputs. The most commonly used physical input variables include power generation capacity, annual capacity, hours of operation, fuel consumption, and number of employees, whereas most of studies consider the cost of power generation, capital expenditures, total assets, fixed assets, and operating cost as financial input variables. Electricity generation and capacity utilization are popular desirable physical output variables, while CO2 and SO2 emissions and greenhouse gas emissions are commonly used undesirable physical output variables. Lastly, total revenue, GDP contribution, gross value added, and sales are among the most popular financial output variables considered in previous studies.
In this vein, as aforementioned, our input variables are the number of employees, the total assets (in CAD million), the operating costs or expenses (in CAD million), and the capital expenditure (in CAD million) and our output variables are the total revenues or sales (in CAD million) and the total electricity generated (in gigawatt-hours (GWh)).

4. Empirical Study

4.1. Sample and Data

We constructed our sample as follows. First, we identified all 27 power generation companies, small and large, publicly owned or state owned, operating across the 10 provinces and 3 territories of Canada. Then, we verified whether these power generation companies had been in operation over the 2001–2018 period, as well as the availability of data relevant to our study. In the end, 17 power generation companies constituted our final sample for 18 years (with the exception of Nalcor Energy (NFL) and Algonquin Power & Utilities Corp (ON), for which the data were available for only 15 years and 10 years, respectively). The 17 power generation companies are from 10 Canadian provinces and territories (see Table 2). We collected the relevant inputs and outputs data for these 17 power generation companies and ended up with a sample of 295 firm-year companies observed annually.
We can notice from Table 2 the important fluctuations of the number of employees among the companies, with the largest employers located in the central region and more specifically in Quebec and Ontario, while the smallest employer is located in the northern region in Yukon. Similarly for the total assets, except that other companies with large assets are located in the western region and more specifically in Alberta and British Columbia. Companies located in the central region feature the highest operating costs, followed by those in the western region, while the northern region, with only one company in Yukon, features the lowest operating costs. Capital expenditures appear to be significantly higher for the state-owned companies located in Quebec and Manitoba compared to the others. The total revenues exhibit a similar behavior as the operating costs. Finally, the total electricity generation clearly shows that the big electricity producers are located in the central region in Quebec and Ontario, followed by the western region in British Columbia.
One of the requirements for the application of DEA is isotonicity, or positive correlations between the selected factors (inputs and outputs). Factors with weak or negative correlations with other inputs or outputs should be deleted in the DEA model. Similarly, if two factors are perfectly correlated, only one is needed (Chung et al. 2008). Figure 1 reports the Pearson correlations between our selected factors, which are all positive and statistically significant at the 0.1 percent level, thus indicating the explanatory power of the inputs and outputs in our DEA models.

4.2. Results Analysis

We computed the regular overall technical efficiency ratios (ROTE), regular managerial (pure technical) efficiency ratios (RPTE), and the regular scale technical efficiency ratios (RSE) using our 295 firm-year sample and performing a pooled efficiency analysis. In addition, we computed bootstrapped overall technical efficiency ratios (BOTEMean) and bootstrapped pure technical efficiency ratios (BPTEMean), as described in Section 3.1. In the sequel, we report the regular efficiencies scores as well as the averages of the corresponding bootstrapped estimates.
We performed three types of analysis. First, we performed the benchmarking of the assessed 17 power generation companies. We identified the benchmark companies across the country, the regions, the provinces, and the type of ownership. Then, we studied the evolution of the annual efficiencies over the period of 2001–2018. Finally, we assessed the impact of the 2007–2009 financial crisis on the efficiency of the power generation companies.

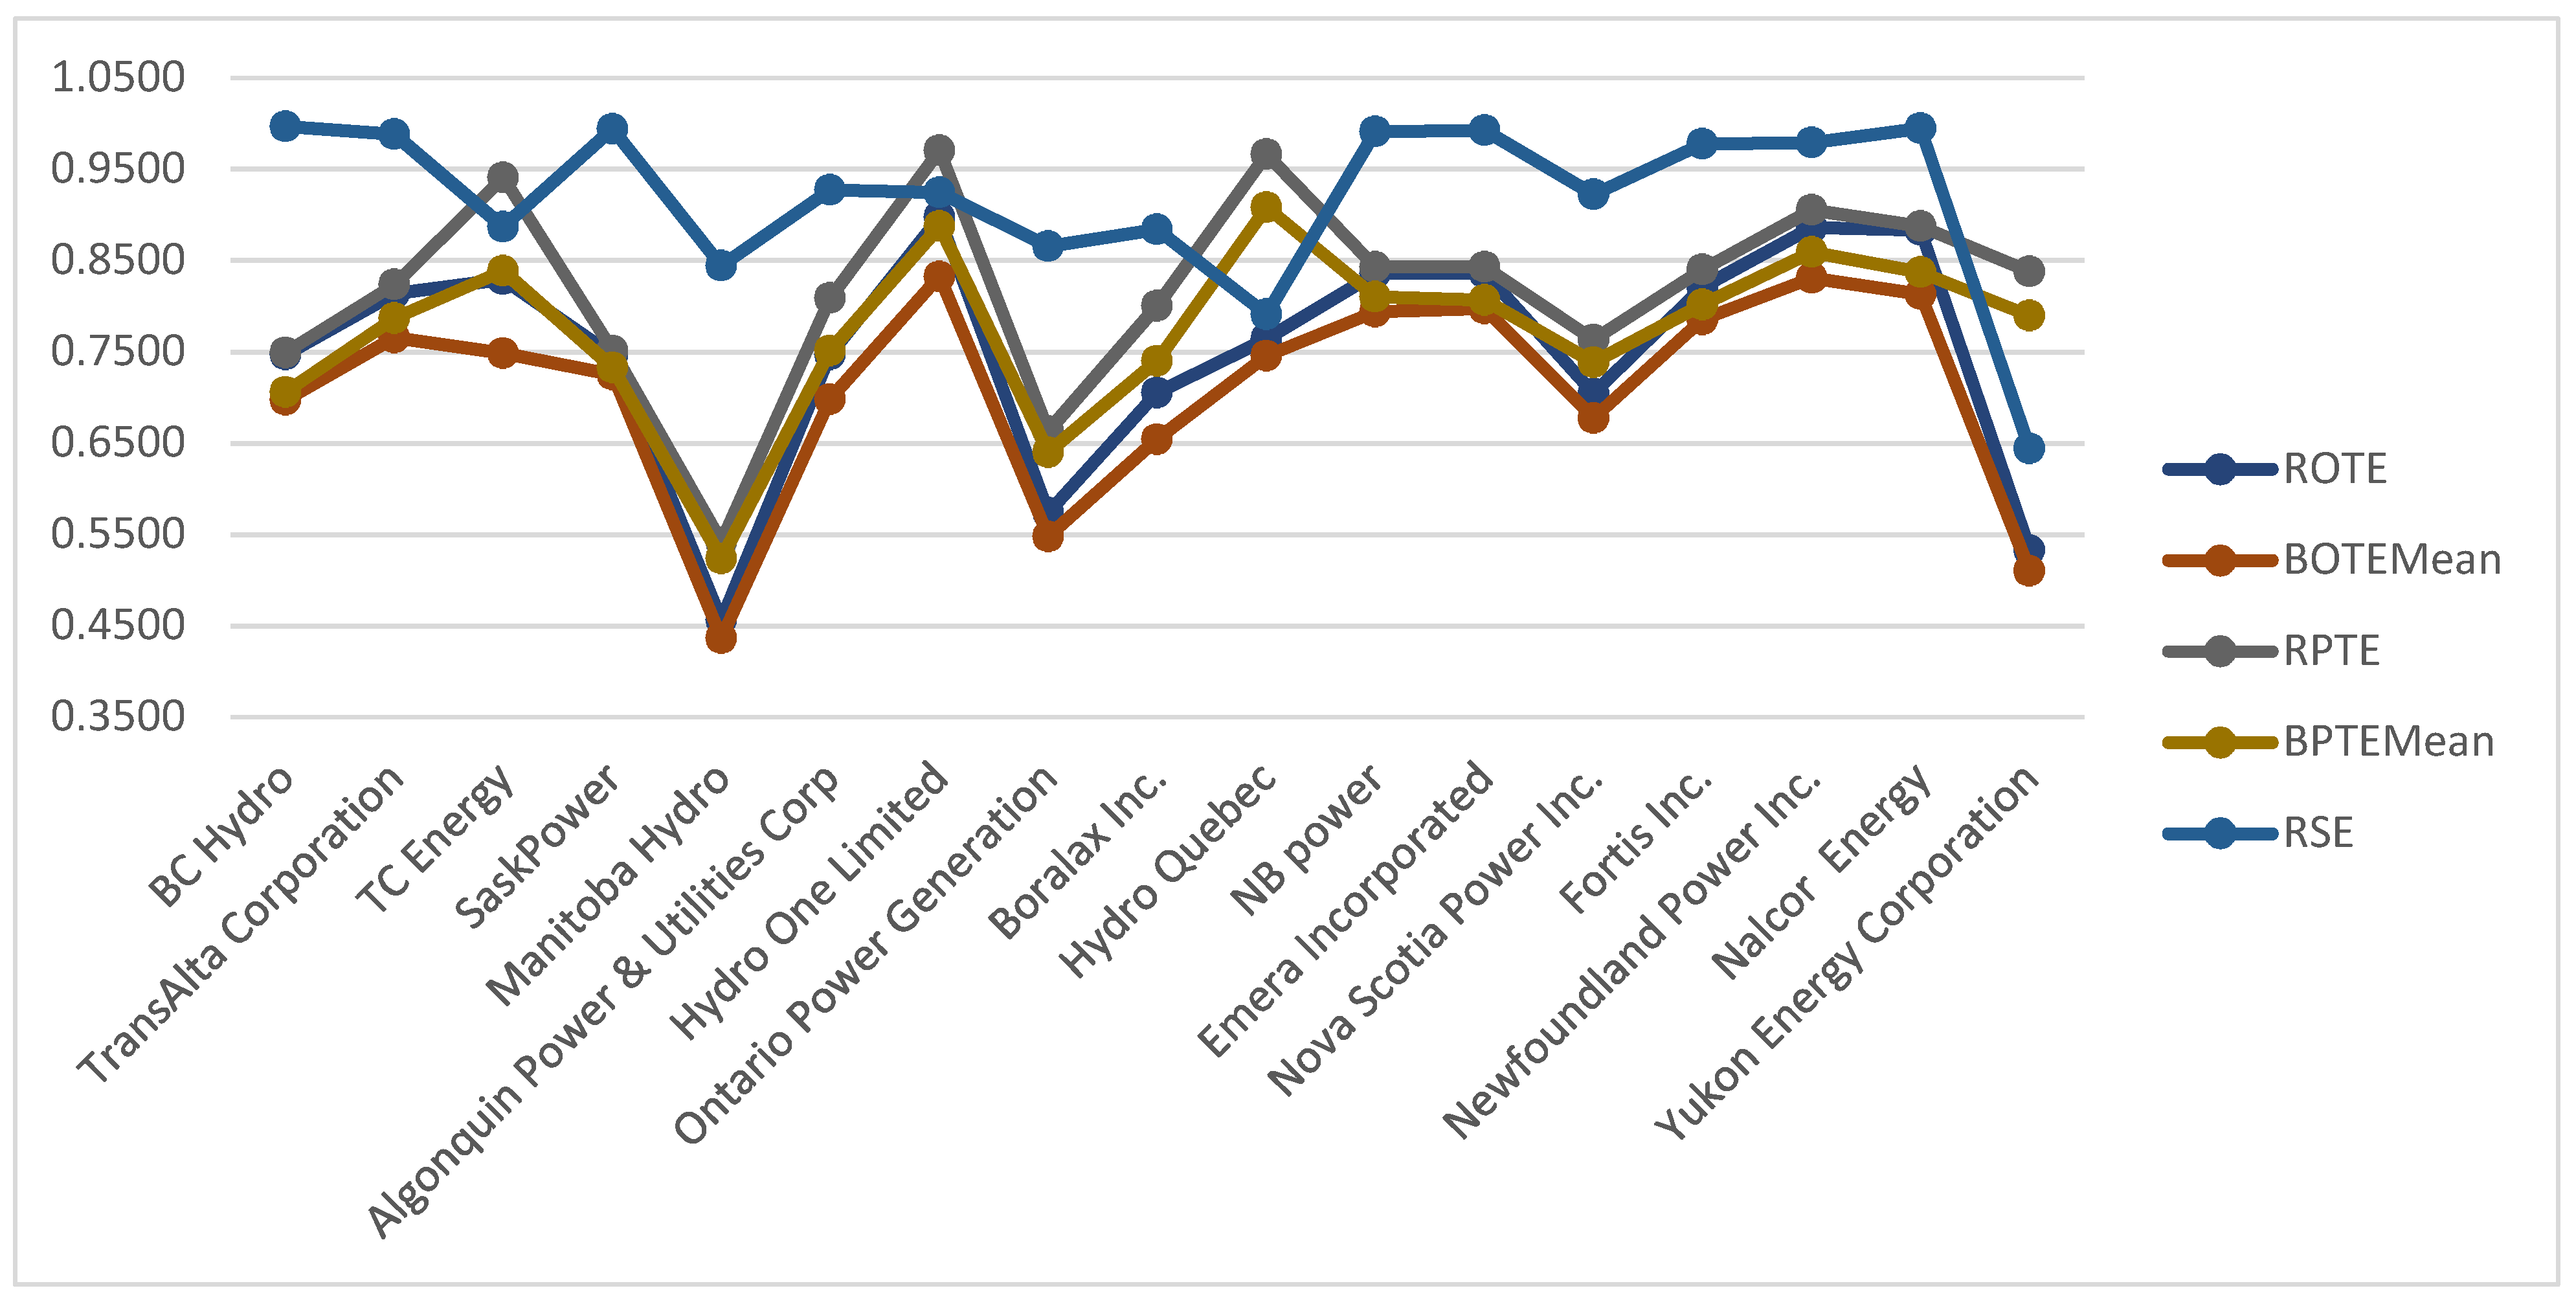
4.2.1. Benchmarking of the Power Generation Companies across the Country

The DEA models results presented in Table 3 and Figure 2 show that the power generation companies exhibit high efficiency ratios, with averages of 0.7506 (0.7086 for average bootstrap), 0.8194 (0.7741 for average bootstrap), and 0.9169 for overall technical, pure technical, and scale efficiencies, respectively. The average regular and bootstrapped overall technical efficiency ratios range from 0.4362 to 0.8972. Pure technical efficiency ratios range from 0.5233 to 0.9708. Finally, the average scale efficiency scores range from 0.7914 to 0.9946. We can therefore infer that the inefficiencies in the power generation companies are mainly due to managerial issues, as the scale efficiencies are high.
In terms of overall technical efficiency, the three top benchmark power generation companies are, respectively, Hydro One Limited (Ontario, central region, publicly owned), Newfoundland Power Inc. (Newfoundland and Labrador, eastern region, state owned), and Nalcor Energy (Newfoundland and Labrador, eastern region, state owned). On the front of pure technical efficiency, the three top benchmark power generation companies are, respectively, Hydro One Limited (Ontario, central region, publicly owned), Hydro Quebec (Quebec, central region, state owned), and TC Energy (Alberta, western region, publicly owned). Finally, for scale efficiency, the three top benchmark power generation companies are, respectively, BC Hydro (British Columbia, western region, state owned), Nalcor Energy (Newfoundland and Labrador, eastern region, state owned), and SaskPower (Saskatchewan, western region, state owned).

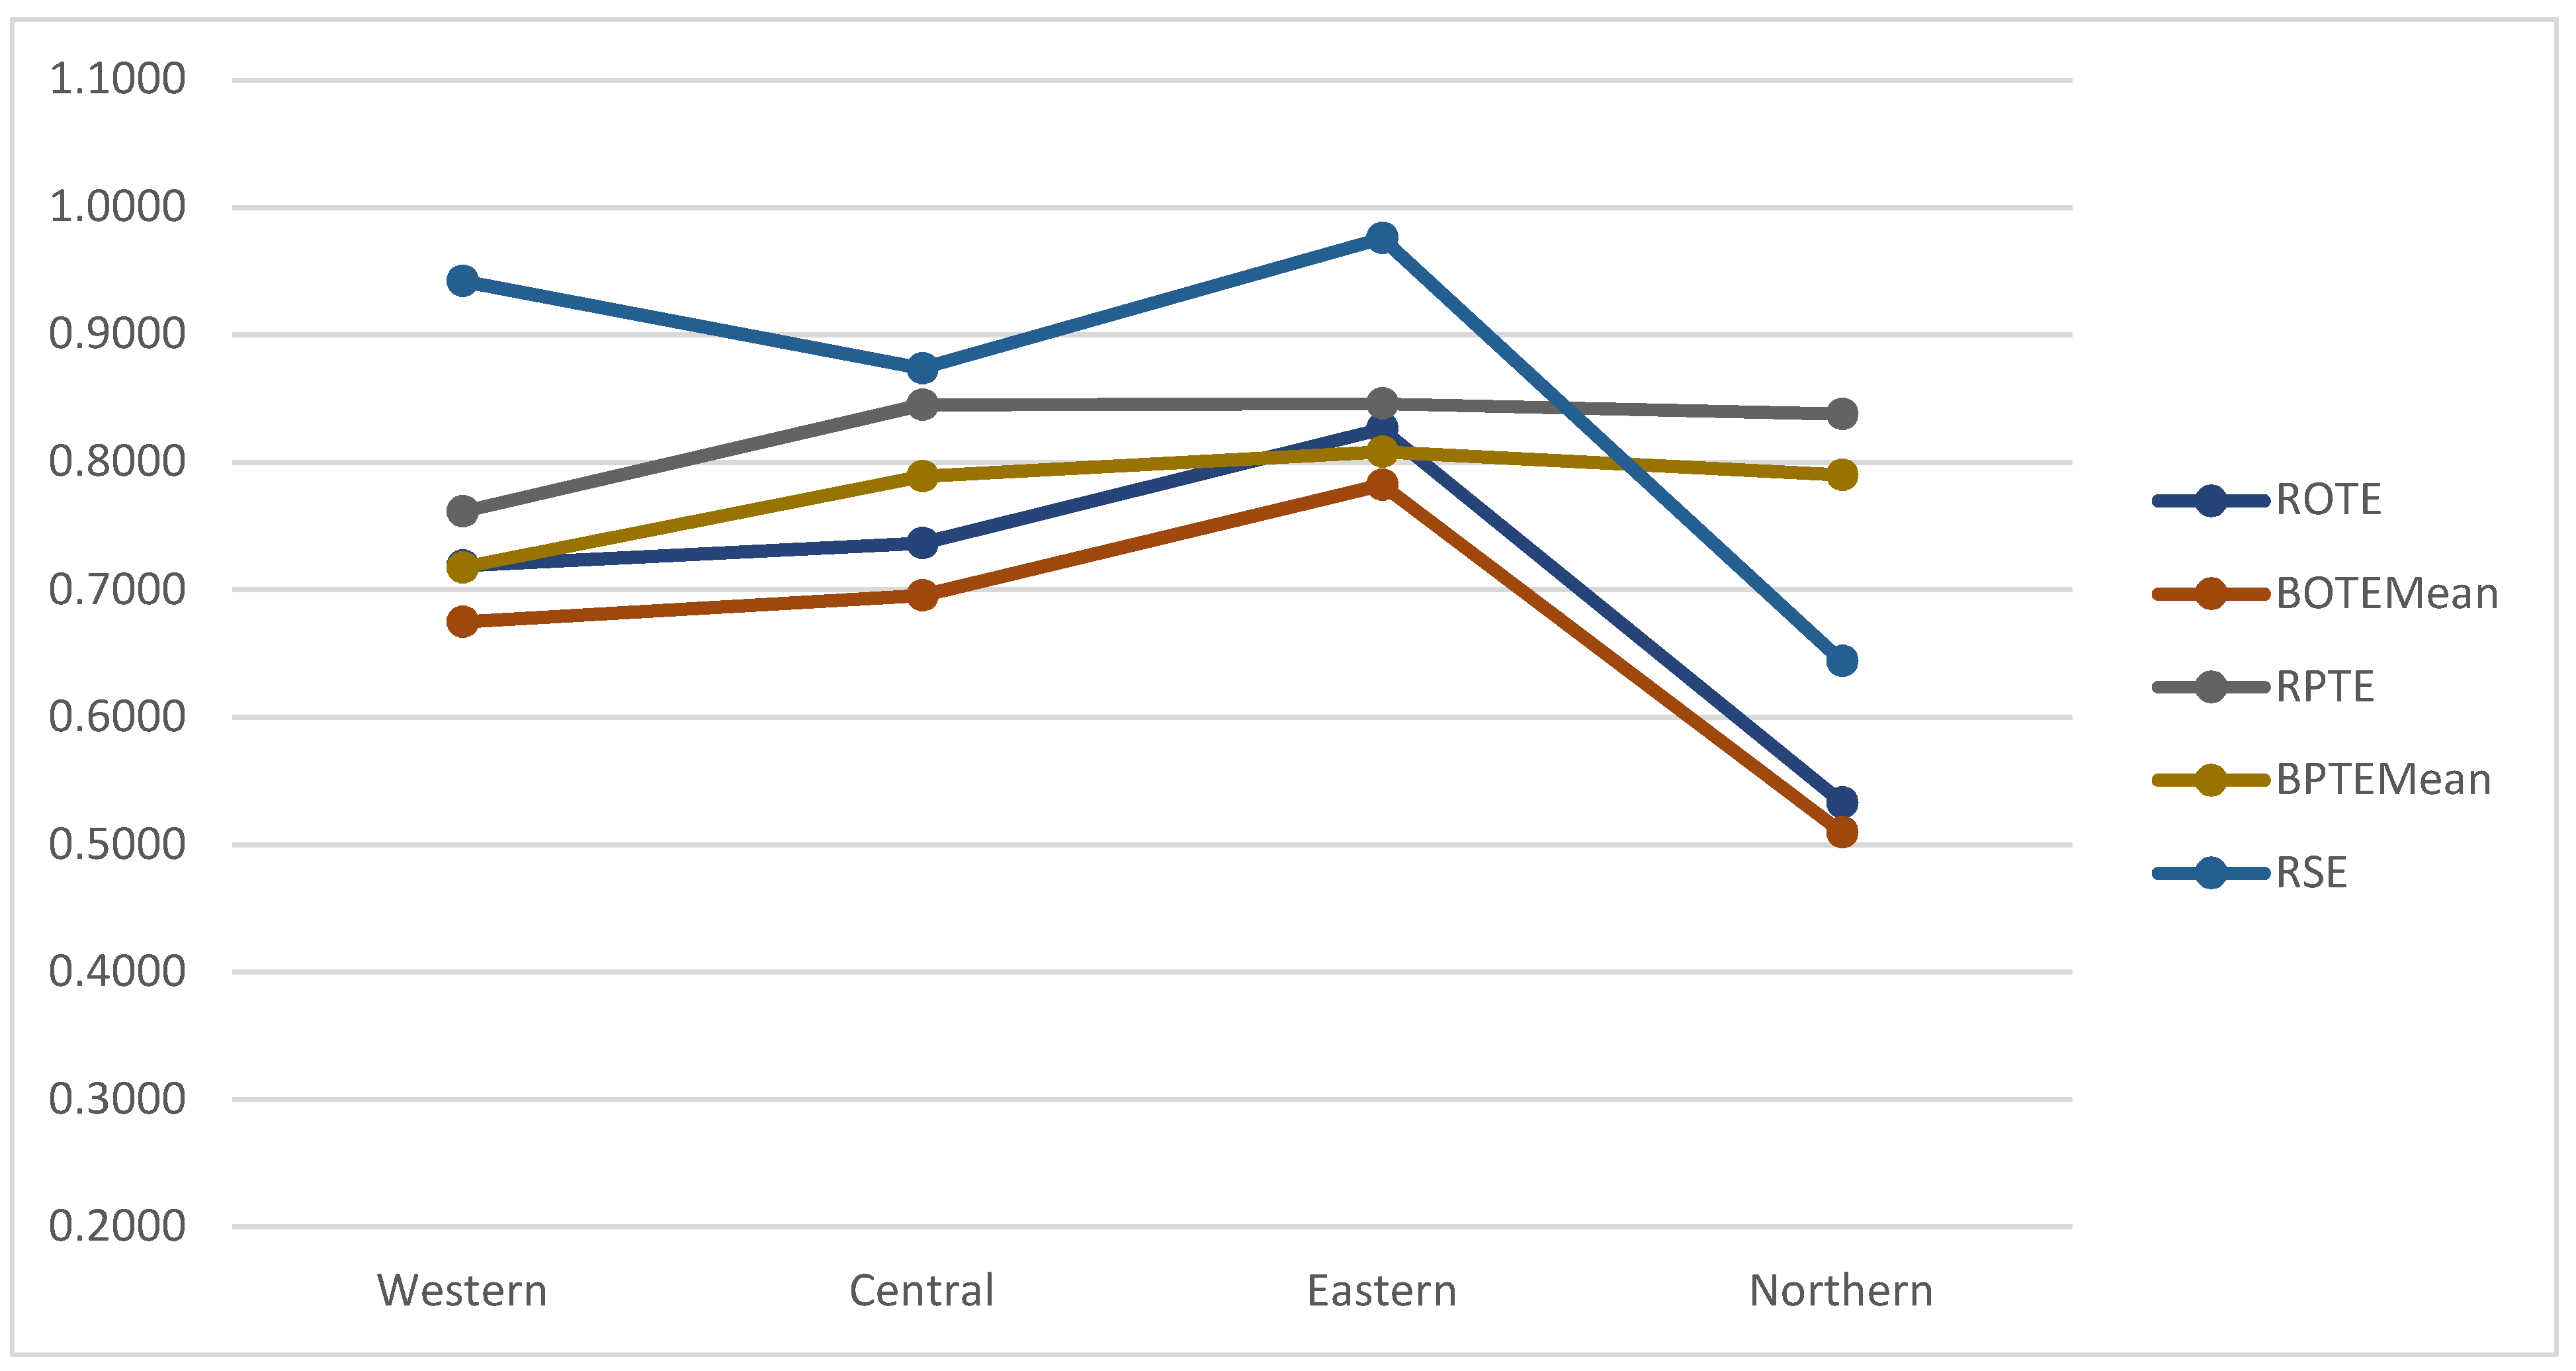
4.2.2. Benchmarking of the Power Generation Companies across the Regions

Region-wise, as reported in Figure 3, the power generation companies of the eastern side feature the highest efficiency scores regardless of the type of efficiency considered (overall technical, pure technical or managerial, and scale). This region appears to be the benchmark region for the other regions. The northern region is the weakest in terms of overall technical and scale efficiencies, while the western region is the weakest in terms of pure technical or managerial efficiency. The central region falls in the middle on all three types of efficiency.

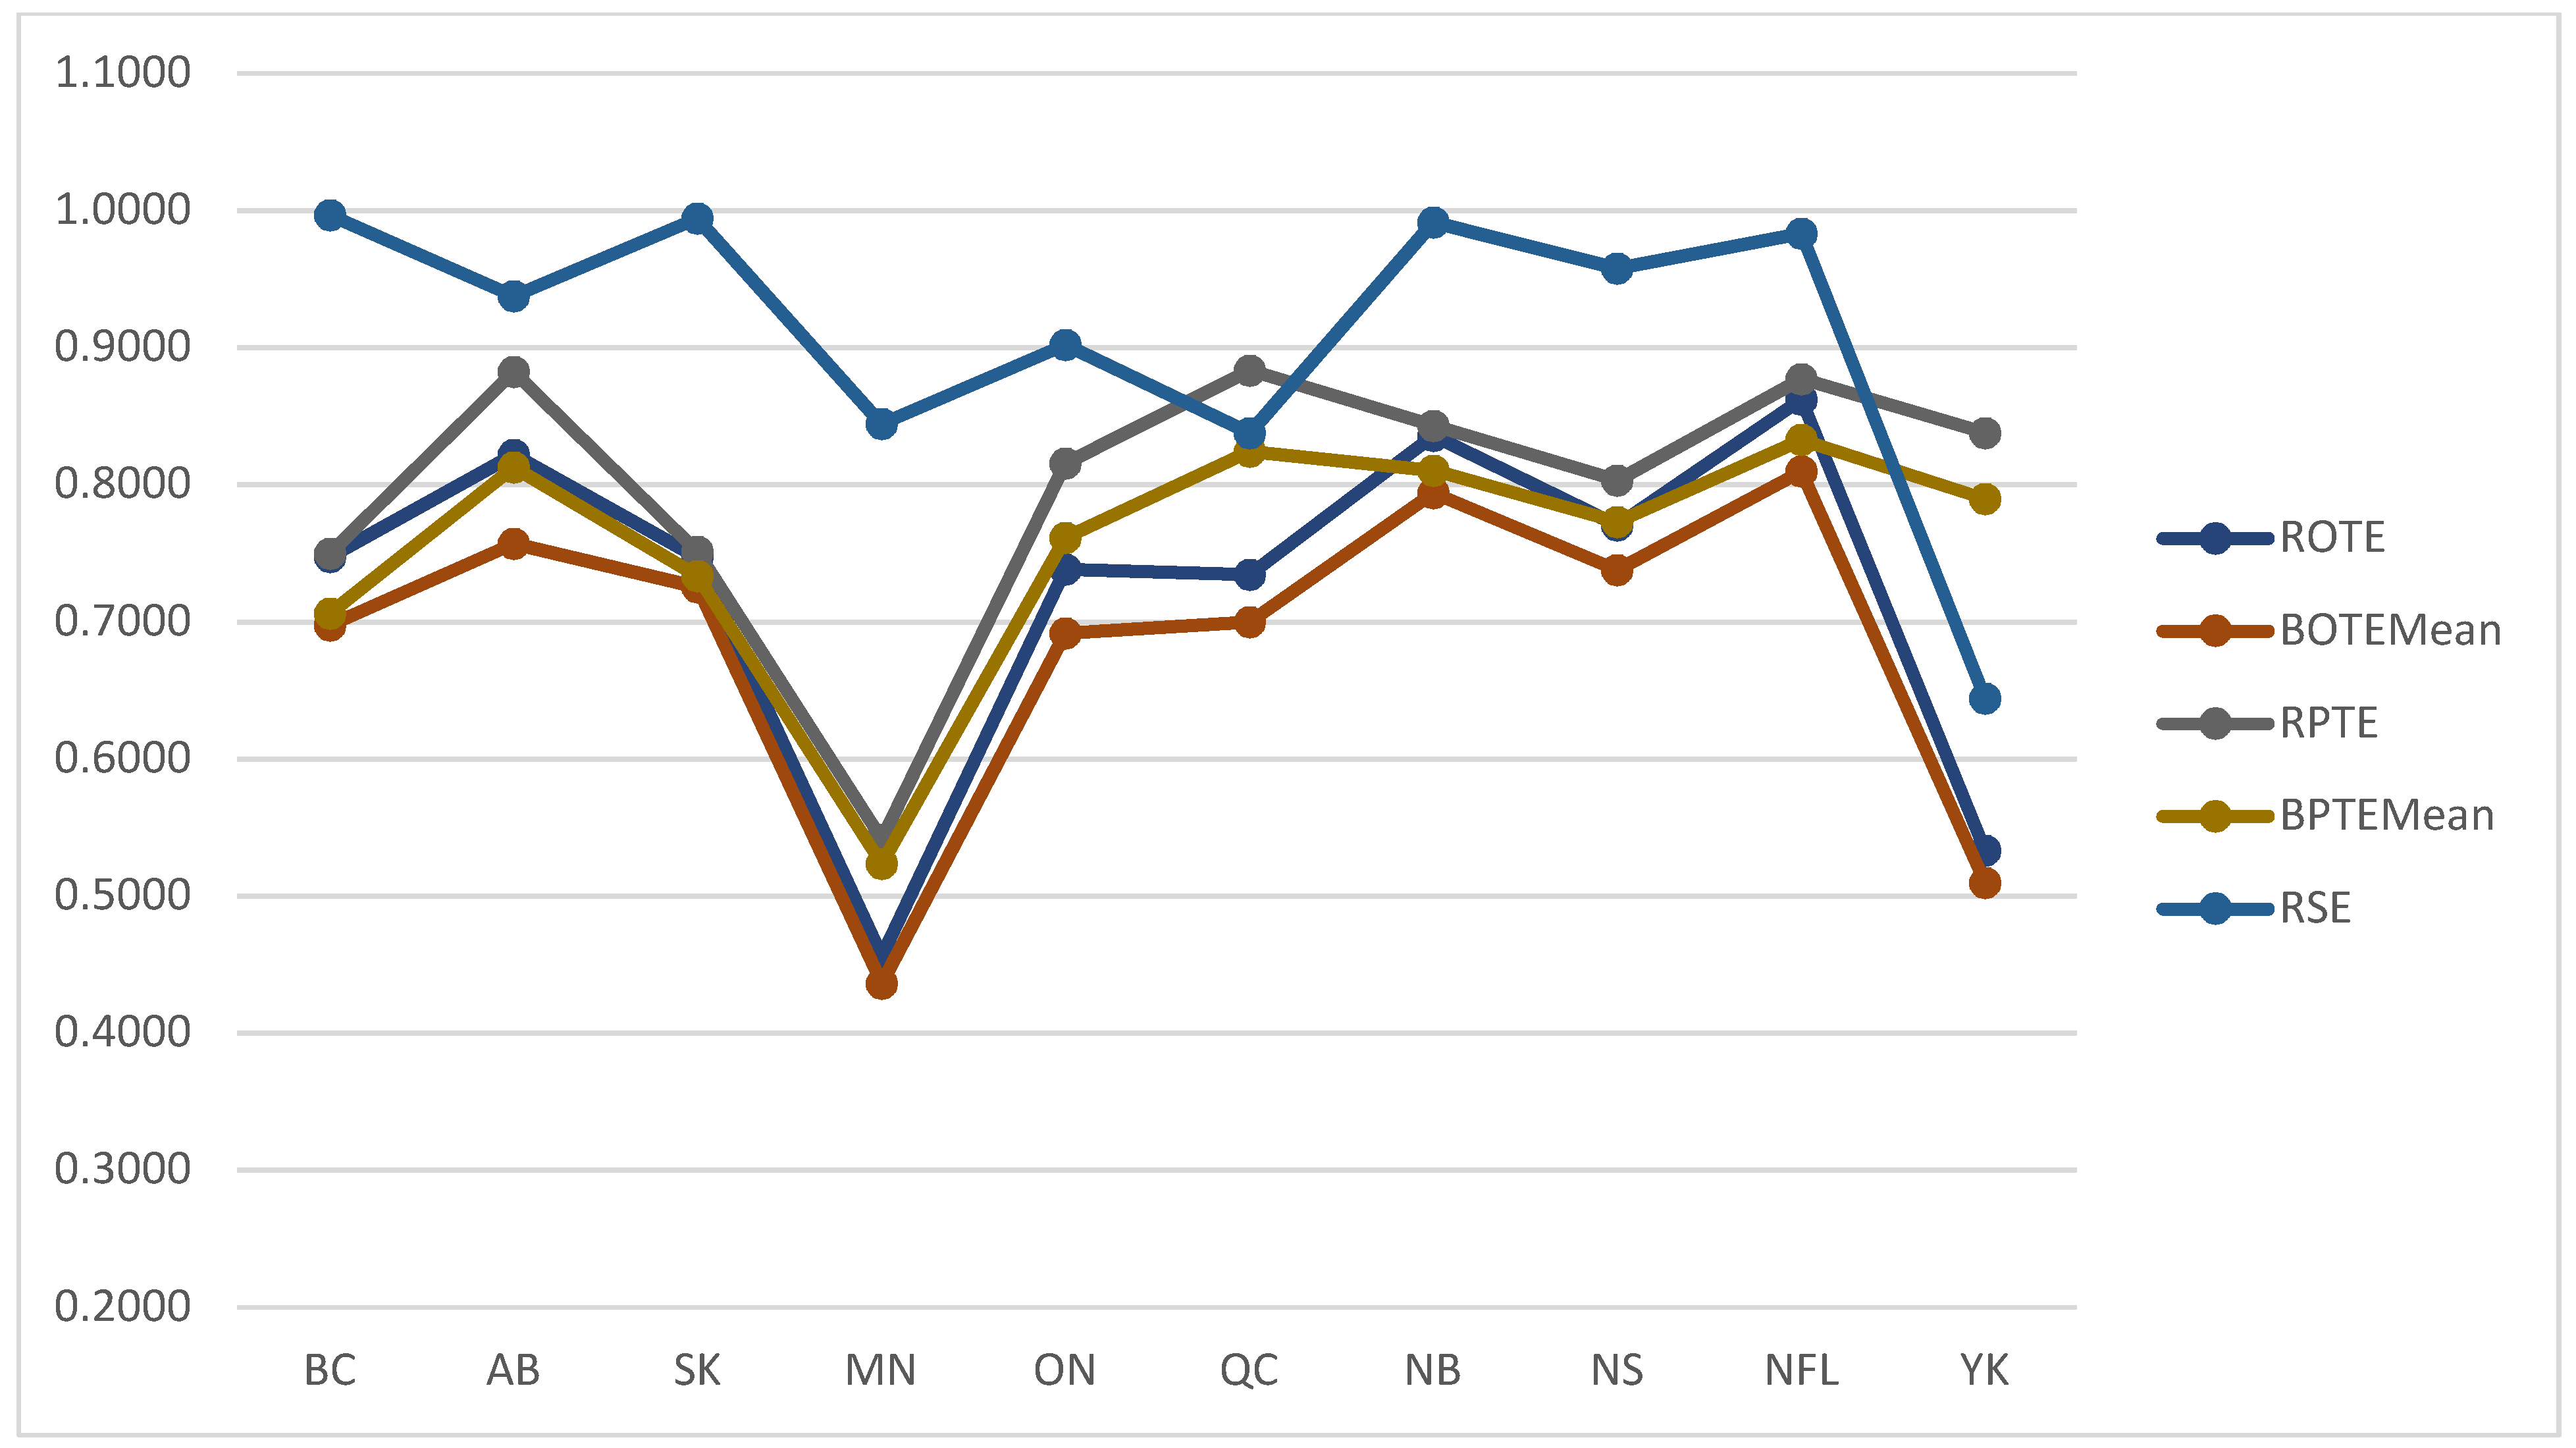
4.2.3. Benchmarking of the Power Generation Companies across the Provinces and Territories

Let us now focus on the provinces and territories. As reported in Figure 4, Manitoba’s power generation companies feature the lowest overall technical efficiency and pure technical (or managerial) efficiency scores. This tells that the inefficiencies of Manitoba’s power generation companies are mainly due to managerial issues. For the overall technical efficiency, Newfoundland and Labrador, New Brunswick, and Alberta have, respectively, the top three average scores and represent the benchmarks for their power generation companies. As for pure technical or managerial efficiency, Quebec, Alberta, and Newfoundland and Labrador have, respectively, the top three average scores and are the benchmarks, which might suggest that their power generation companies are better managed than their counterparts in the other provinces or territories. Finally, for scale efficiency, British Columbia, Saskatchewan, and New Brunswick have, respectively, the top three average scores and represent the benchmarks for their power generation companies, suggesting that resources are likely better allocated in their power generation companies compared to the others in the other provinces or territories.

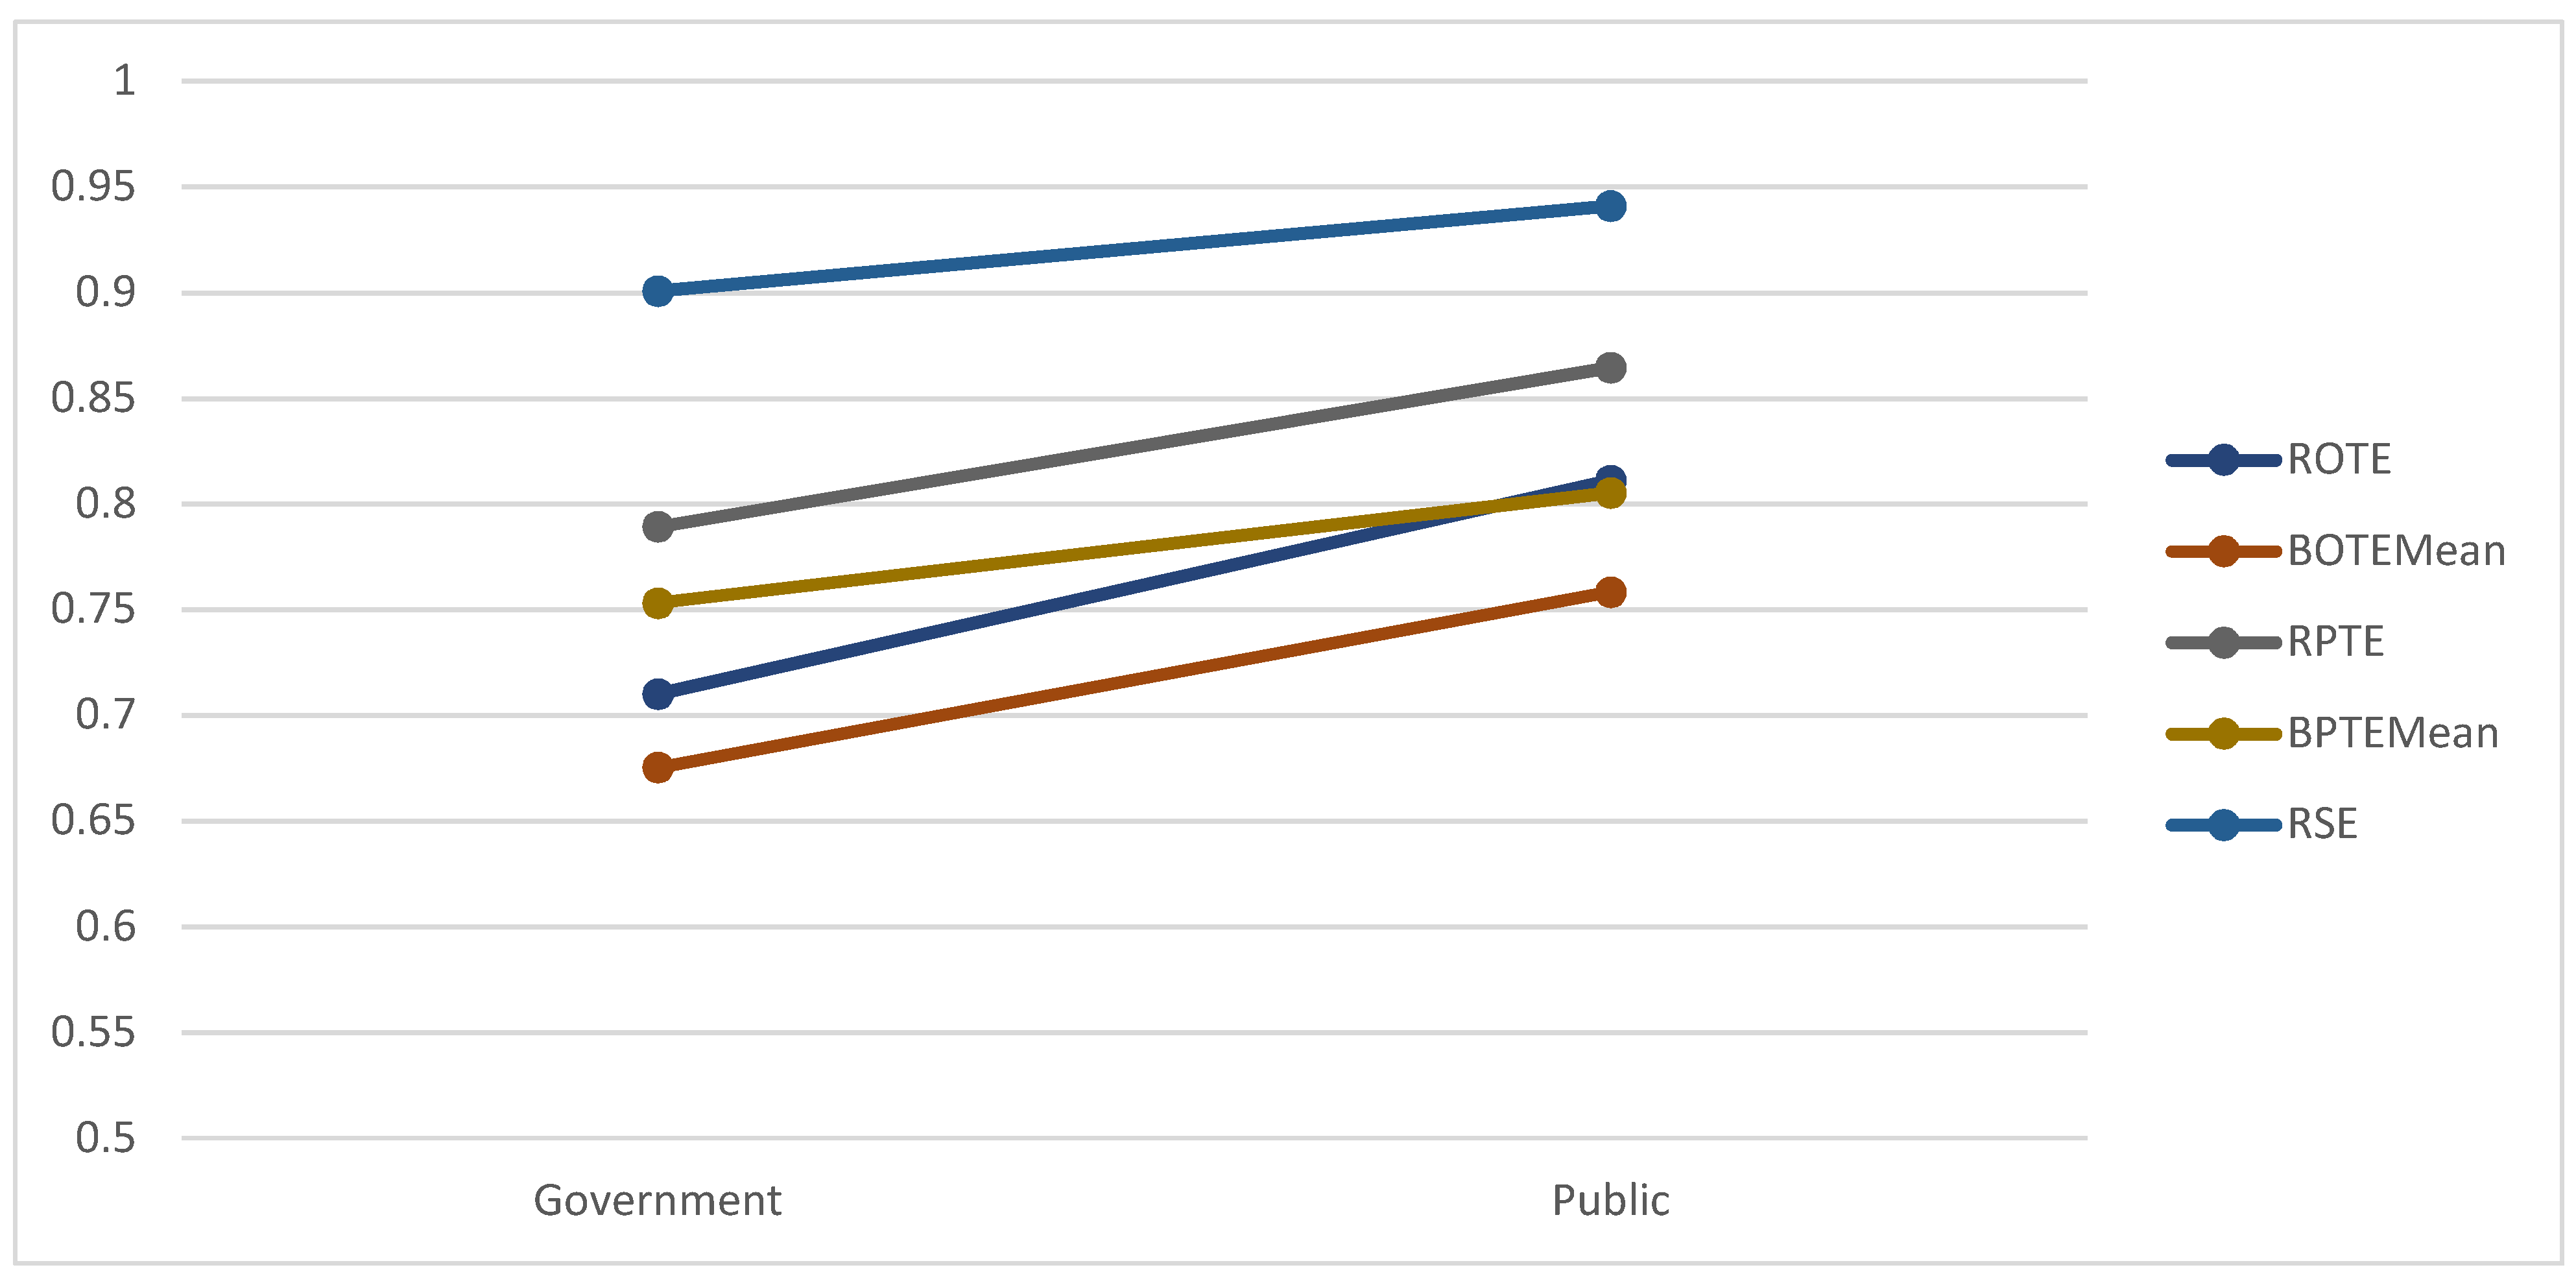
4.2.4. Benchmarking of the Power Generation Companies Based on the Type of Ownership

The results reported in Figure 5 and Table 4 reveal that the publicly owned companies are overall more efficient in all points of view (overall technical, pure technical (or managerial), and scale efficiencies) when compared to their state-owned counterparts. This conclusion is clearly supported by the statistical significance of the ANOVA tests presented in Table 4.

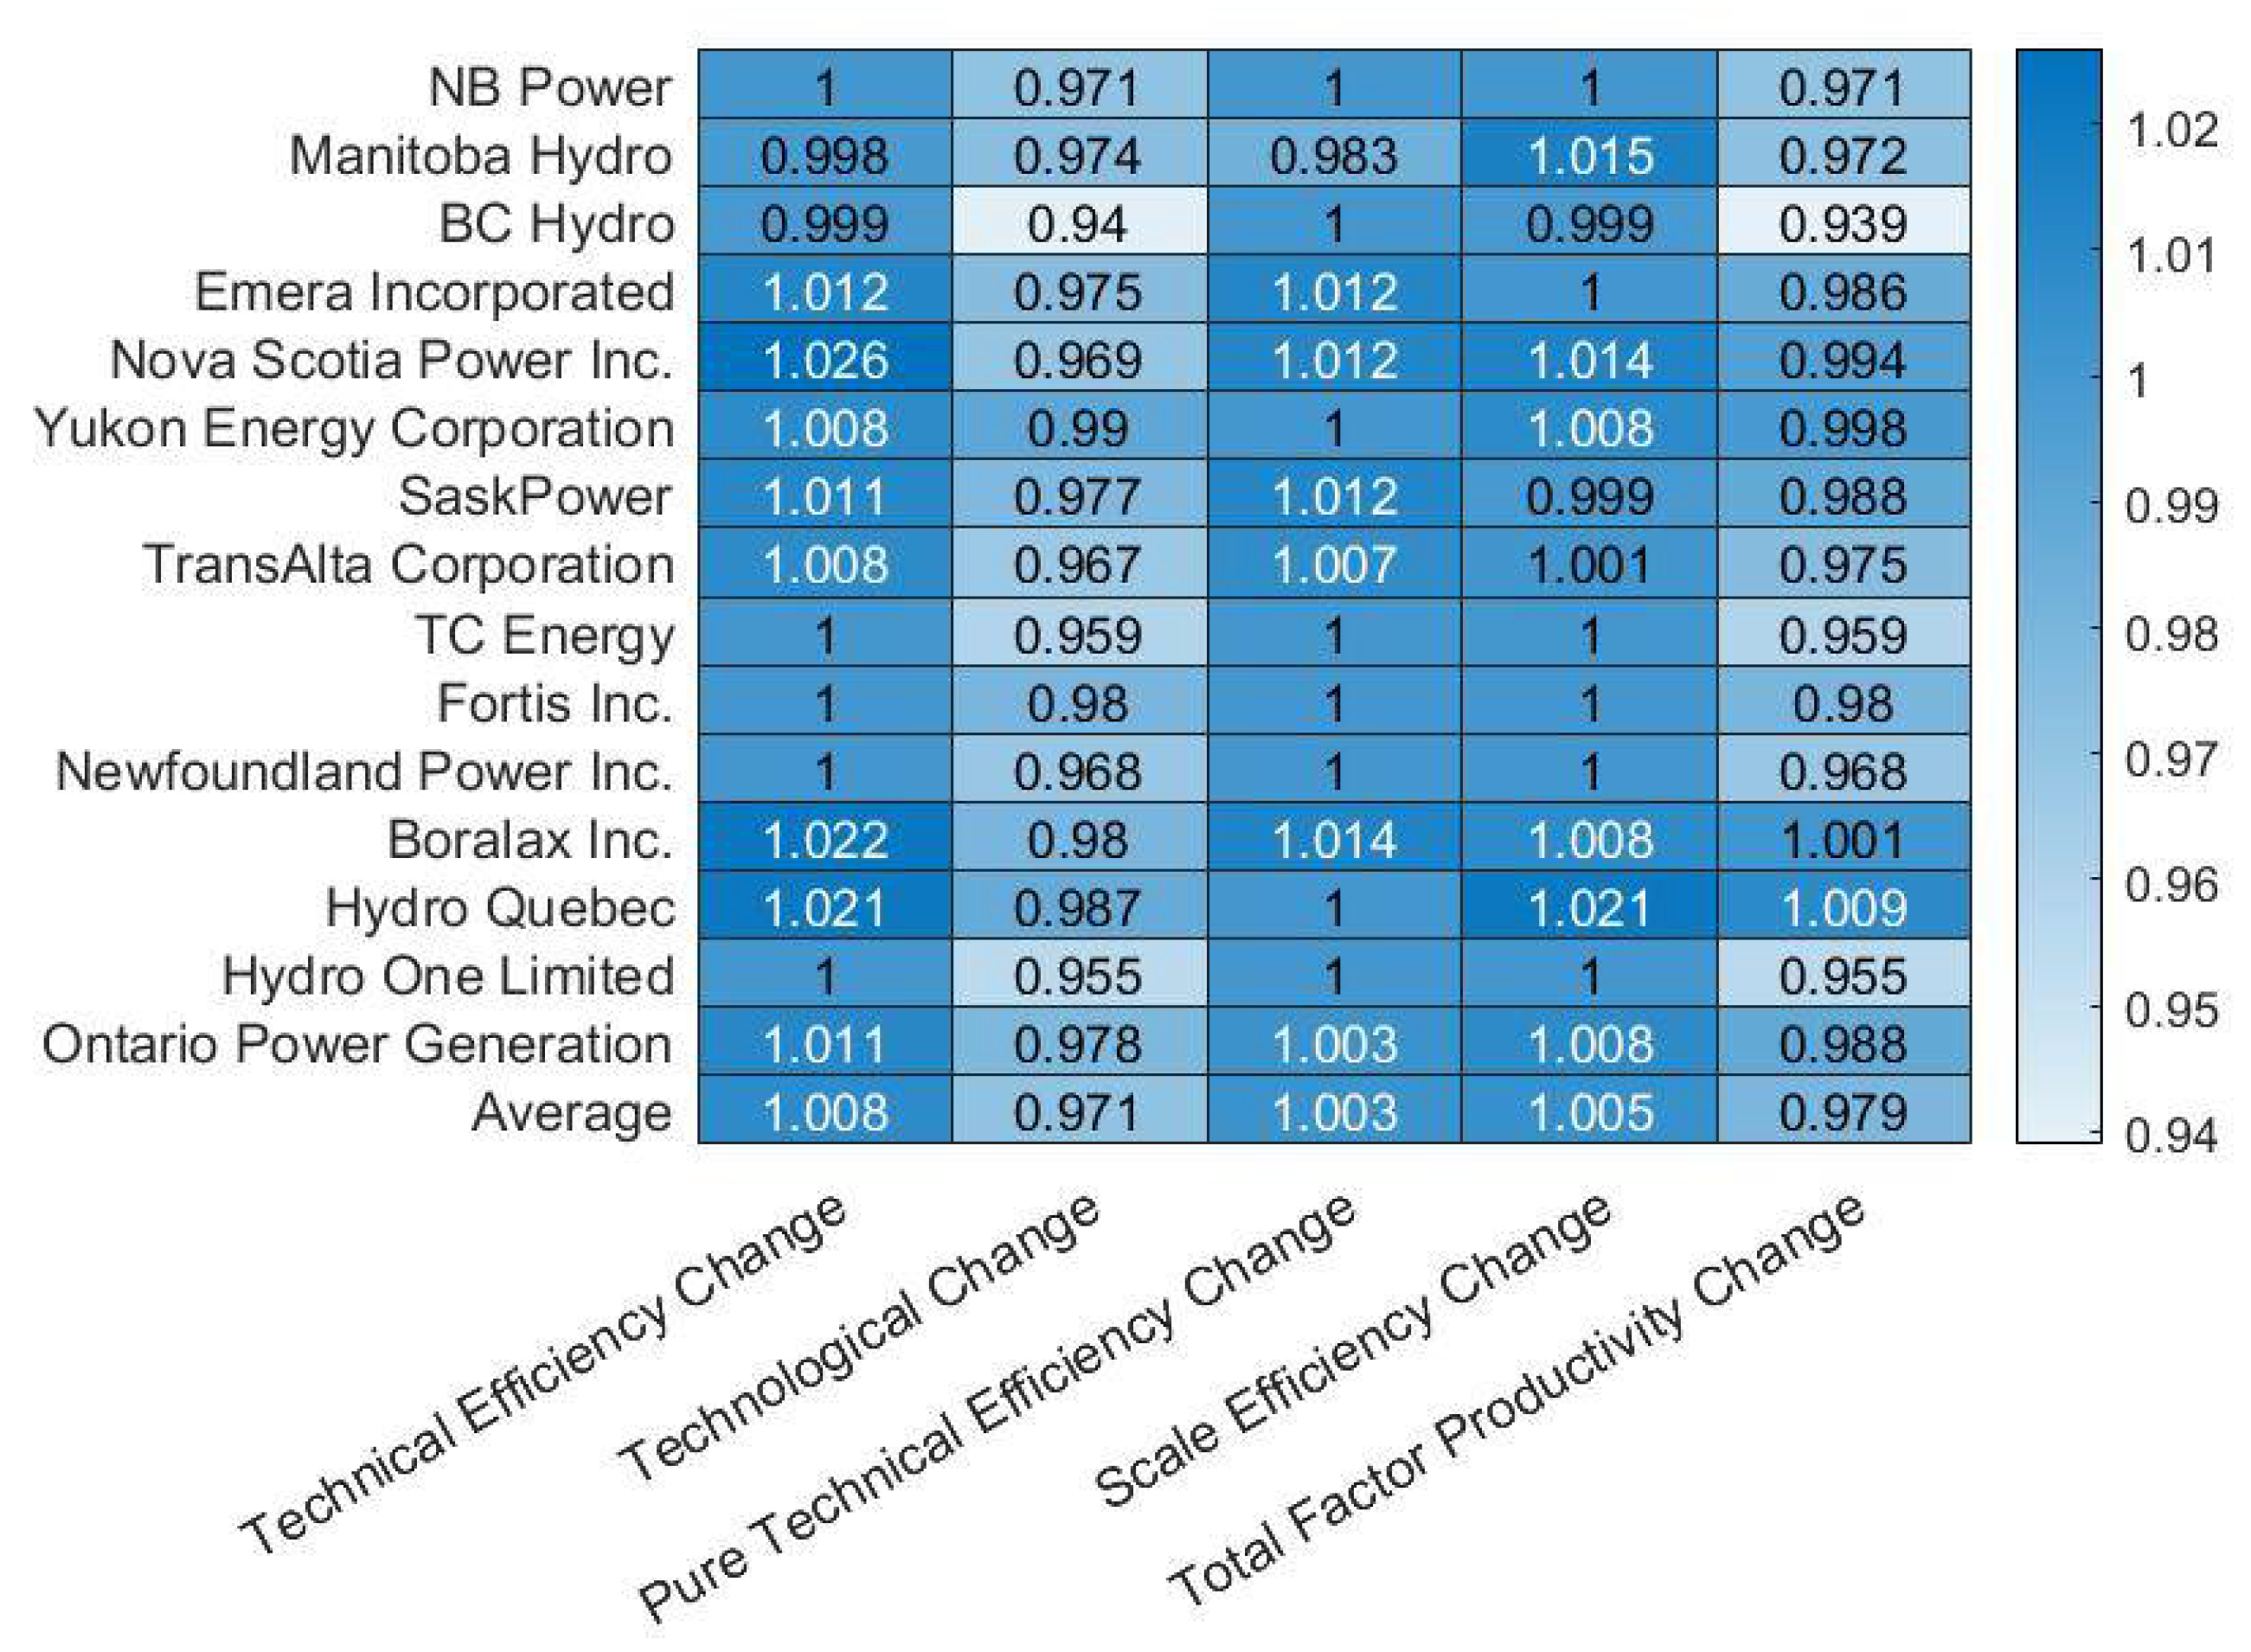
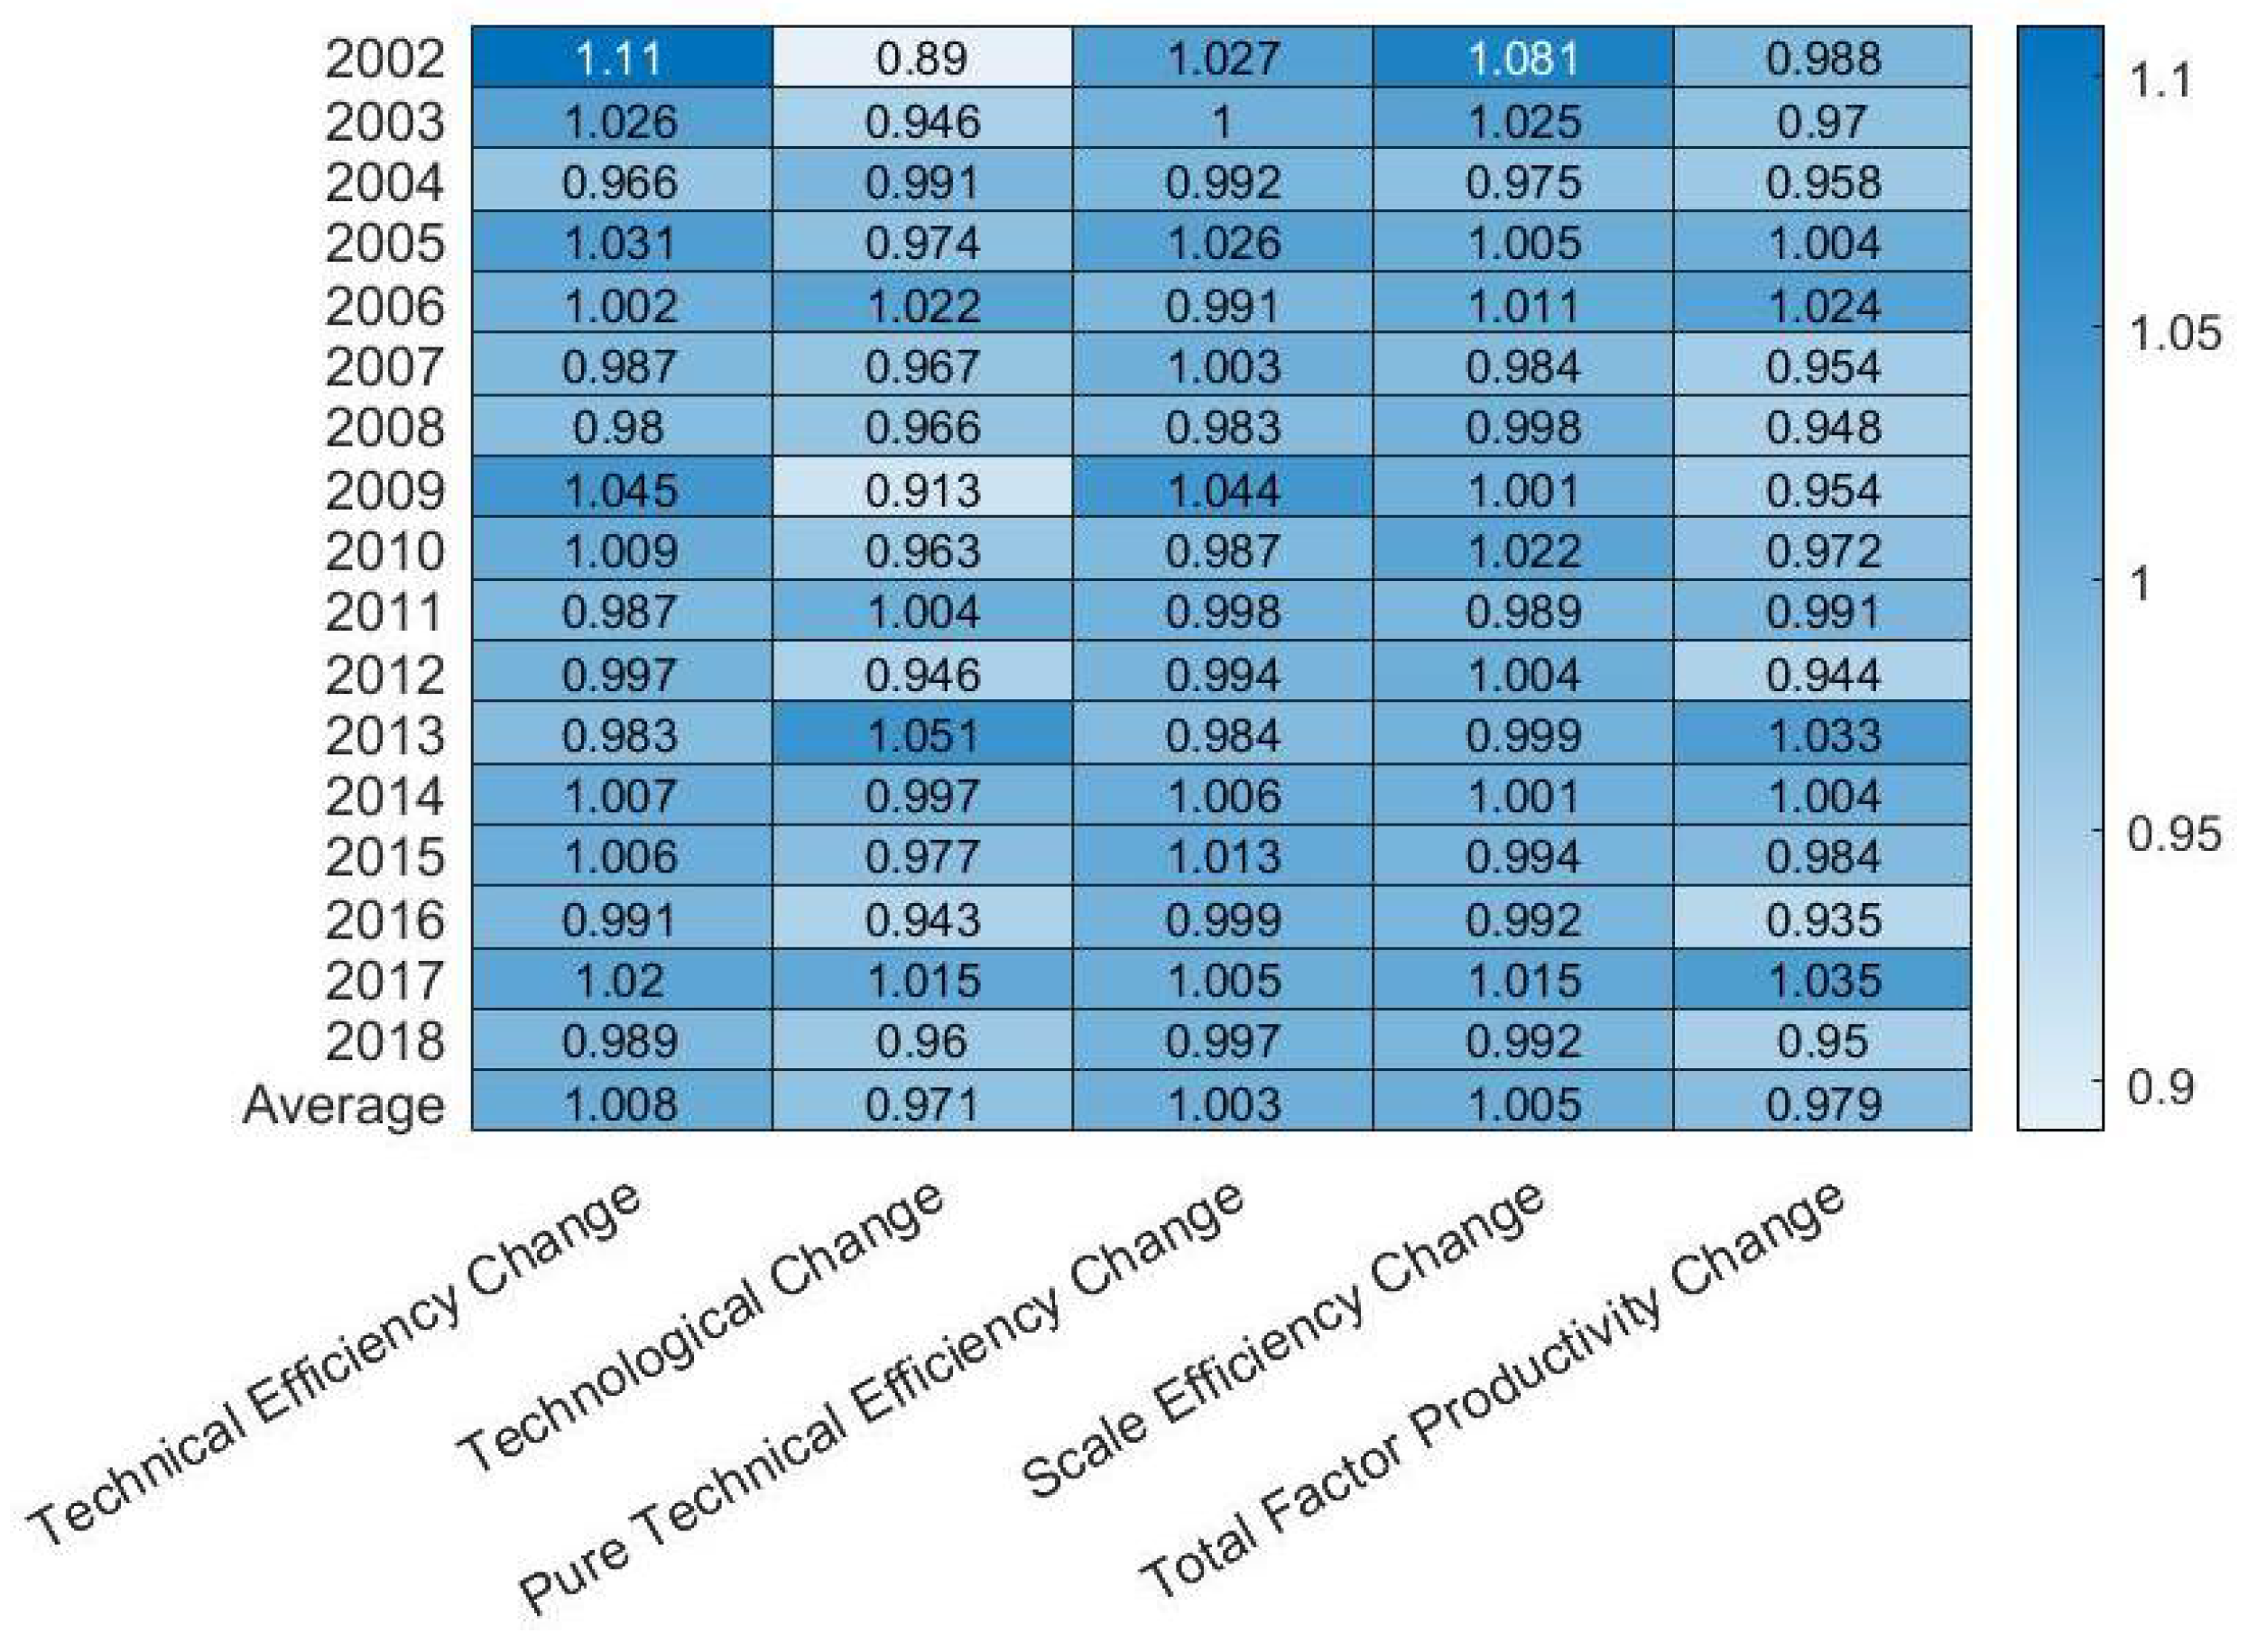
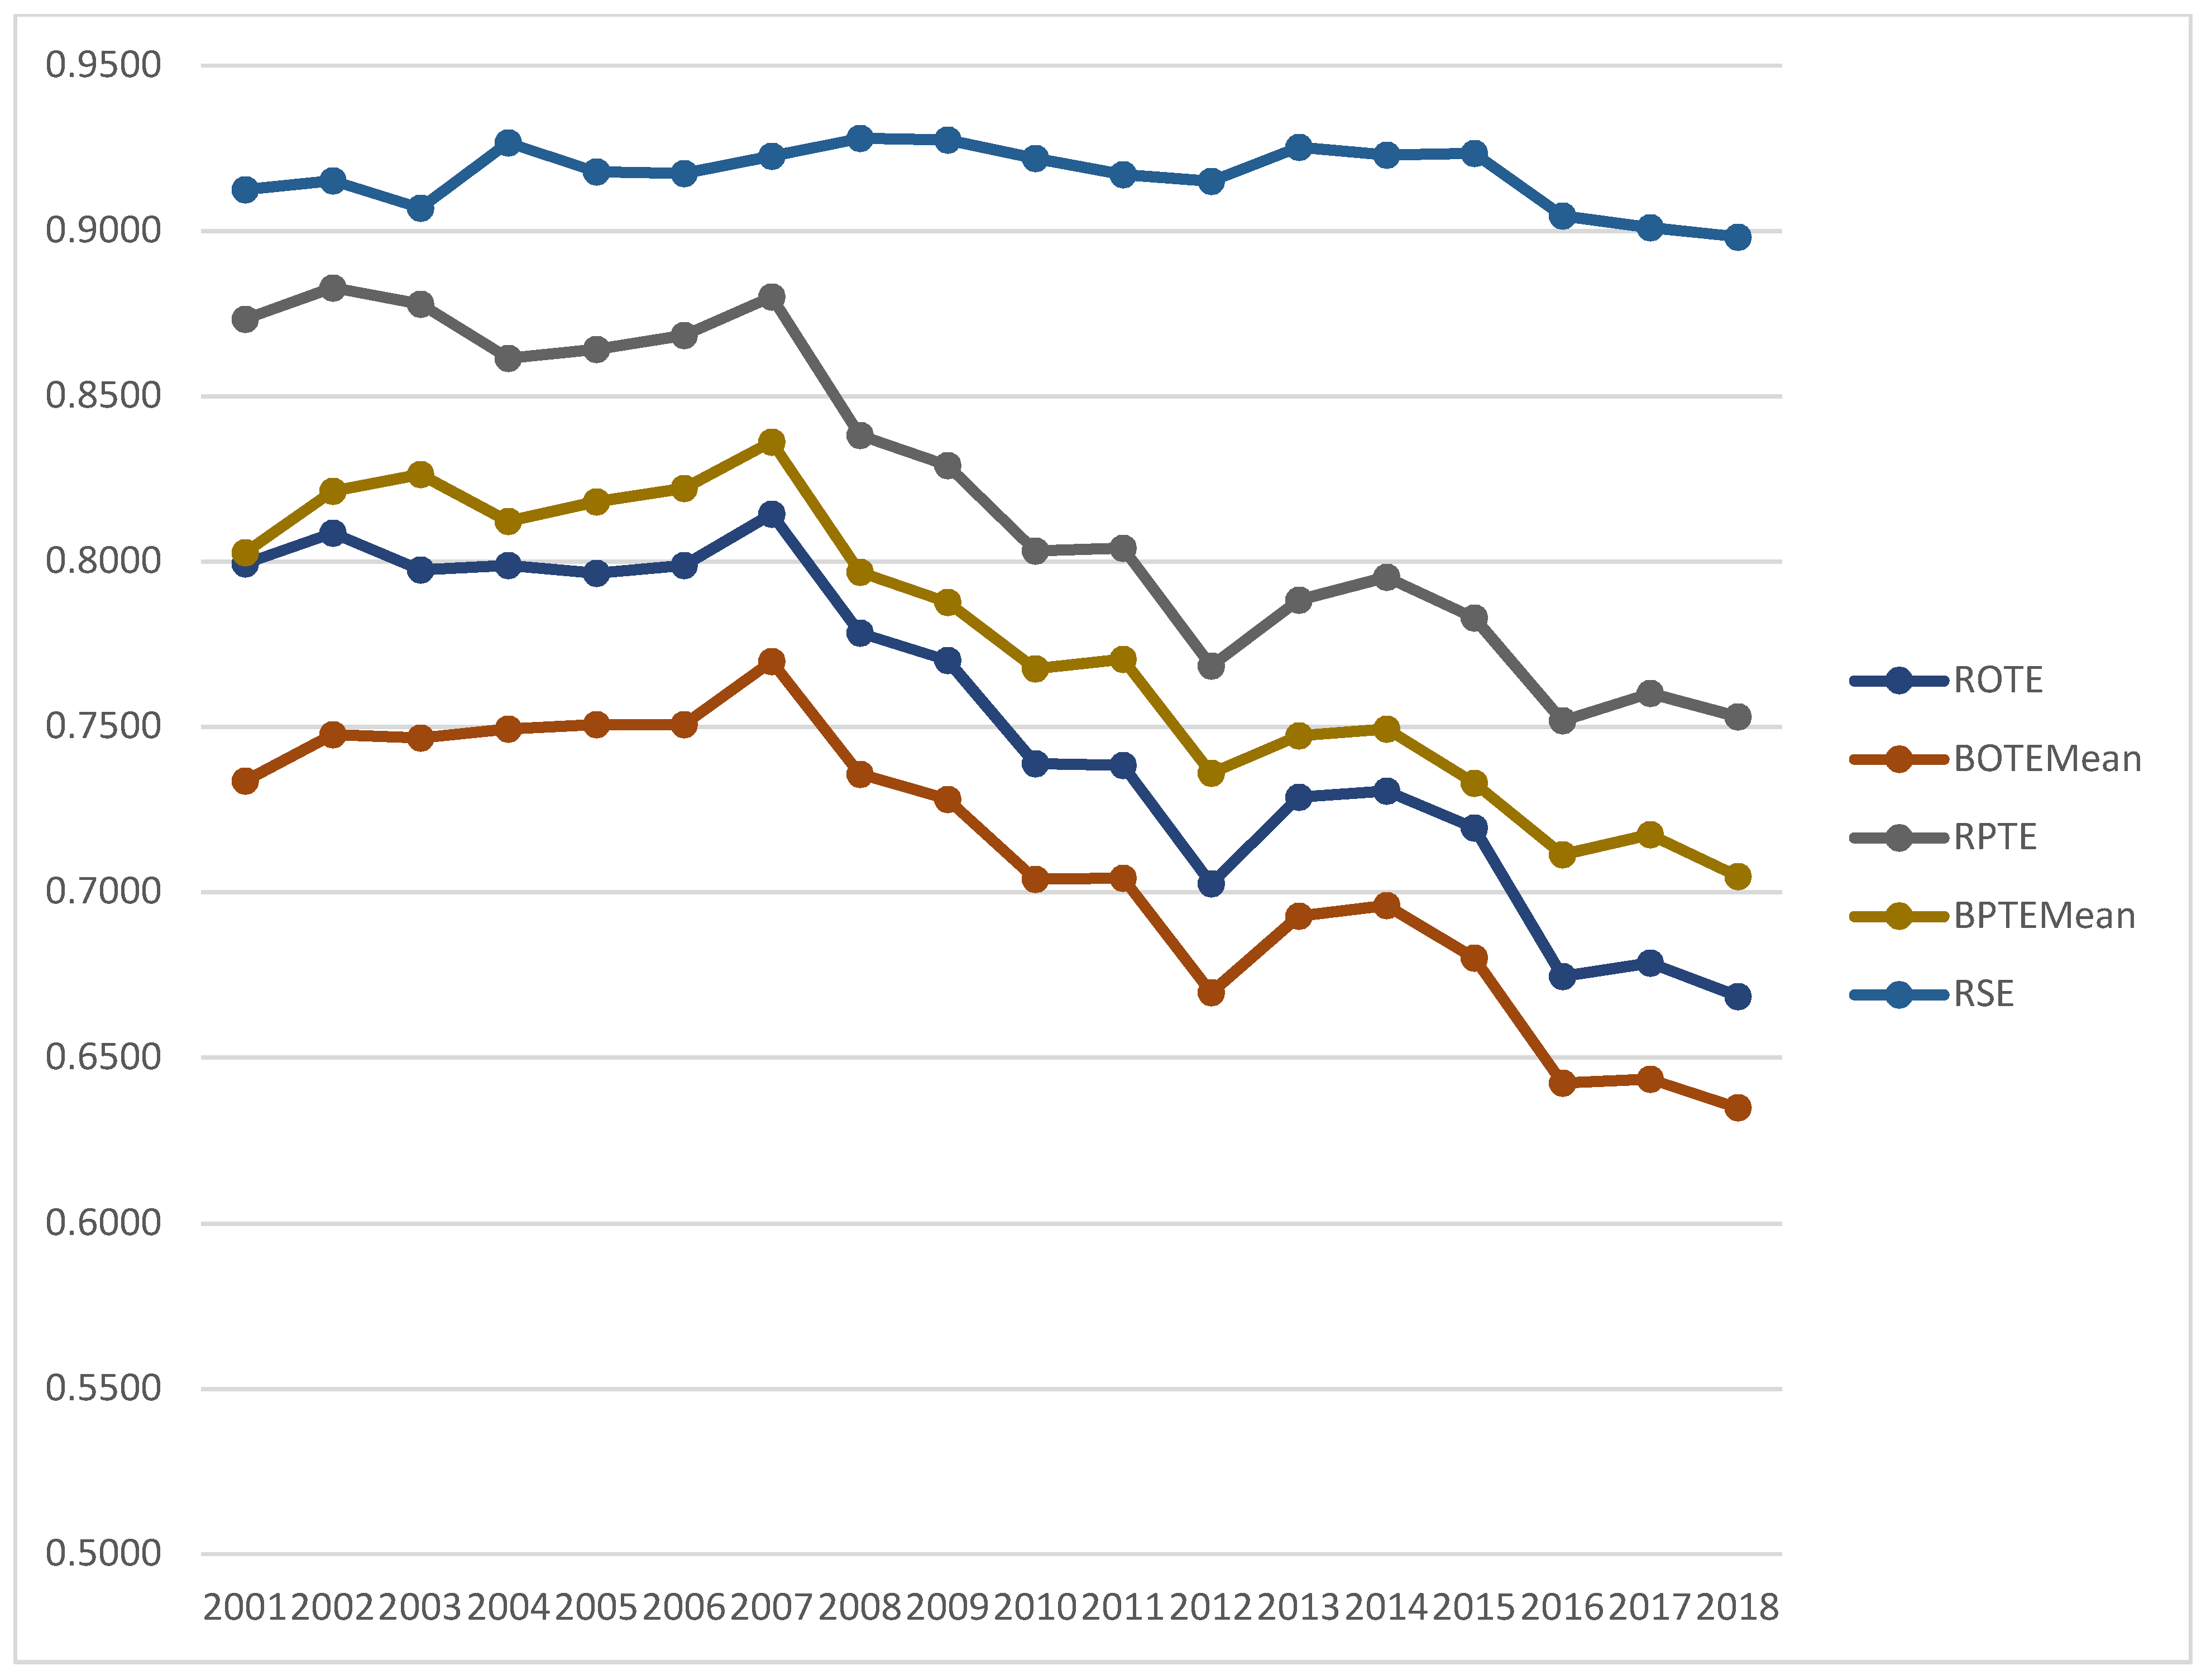
4.2.5. Annual Efficiencies of the Power Generation Companies over the Period of 2001–2018

We also investigated the evolution of the efficiency of the power generation companies over the 18-year study horizon. Table 5 presents a summary of the average efficiency scores over the 18 years (2001 to 2018), and Figure 6 their trends over the same period. The results of the one-way ANOVA test show that the overall technical efficiency and pure technical (managerial) efficiency ratios over the period of the study are statistically different, which is not the case for the scale efficiency ratios (see Table 5). We can also observe in Figure 5 that the scale efficiency is almost flat, fluctuating between 0.8982 and 0.9279, and is constantly above the trend lines of the overall technical and pure technical (managerial) efficiencies. Furthermore, both the overall technical efficiency and the pure technical (managerial) efficiency are relatively steady from 2001 to 2006, followed by a small jump in 2007, and a significant decline until 2018, except for two sporadic increases in 2013–2015 and 2017. Again, the observations above point to managerial issues, even more significantly over the 2007–2009 crisis, which hit the energy sector.
We also analyzed the year-over-year evolution of the efficiency of each company under study from the lenses of the MPIs. The geometric means are reported in Figure 7 and Figure 8. Figure 7 shows an overall decline in the productivity over the entire study period for all the companies, but two Quebec companies, namely Boralax Inc. and Hydro Quebec. Hydro Quebec features the highest productivity, with a total factor productivity change of 1.009 over the 18 years. Overall, the power generation companies show a decline of productivity, with a total factor productivity change of 0.979, with a technological index change below 1. We also observe that overall, the companies improved their technical efficiency, pure technical efficiency, and scale efficiency, which attenuated their productivity decline. Only two companies (Manitoba Hydro (MN) and Emera Inc. (NS)) had a decline of the overall technical efficiency. Only one company (Manitoba Hydro) appears to be poorly managed, with a pure technical efficiency change of 0.983. In addition, only two companies (BC Hydro (BC) and SaskPower (SK)) operated with decreasing returns to scale over the 18 years, with a scale efficiency change of 0.999 each. All the other companies operated under constant returns to scale or increasing returns to scale.
In addition, Figure 8 shows that during the financial crisis period, 2008 was the year in which the companies experienced a decline in all indexes, similar to 2004, 2016, and 2018. We can also observe the consistency of these results with those reported in Figure 6.

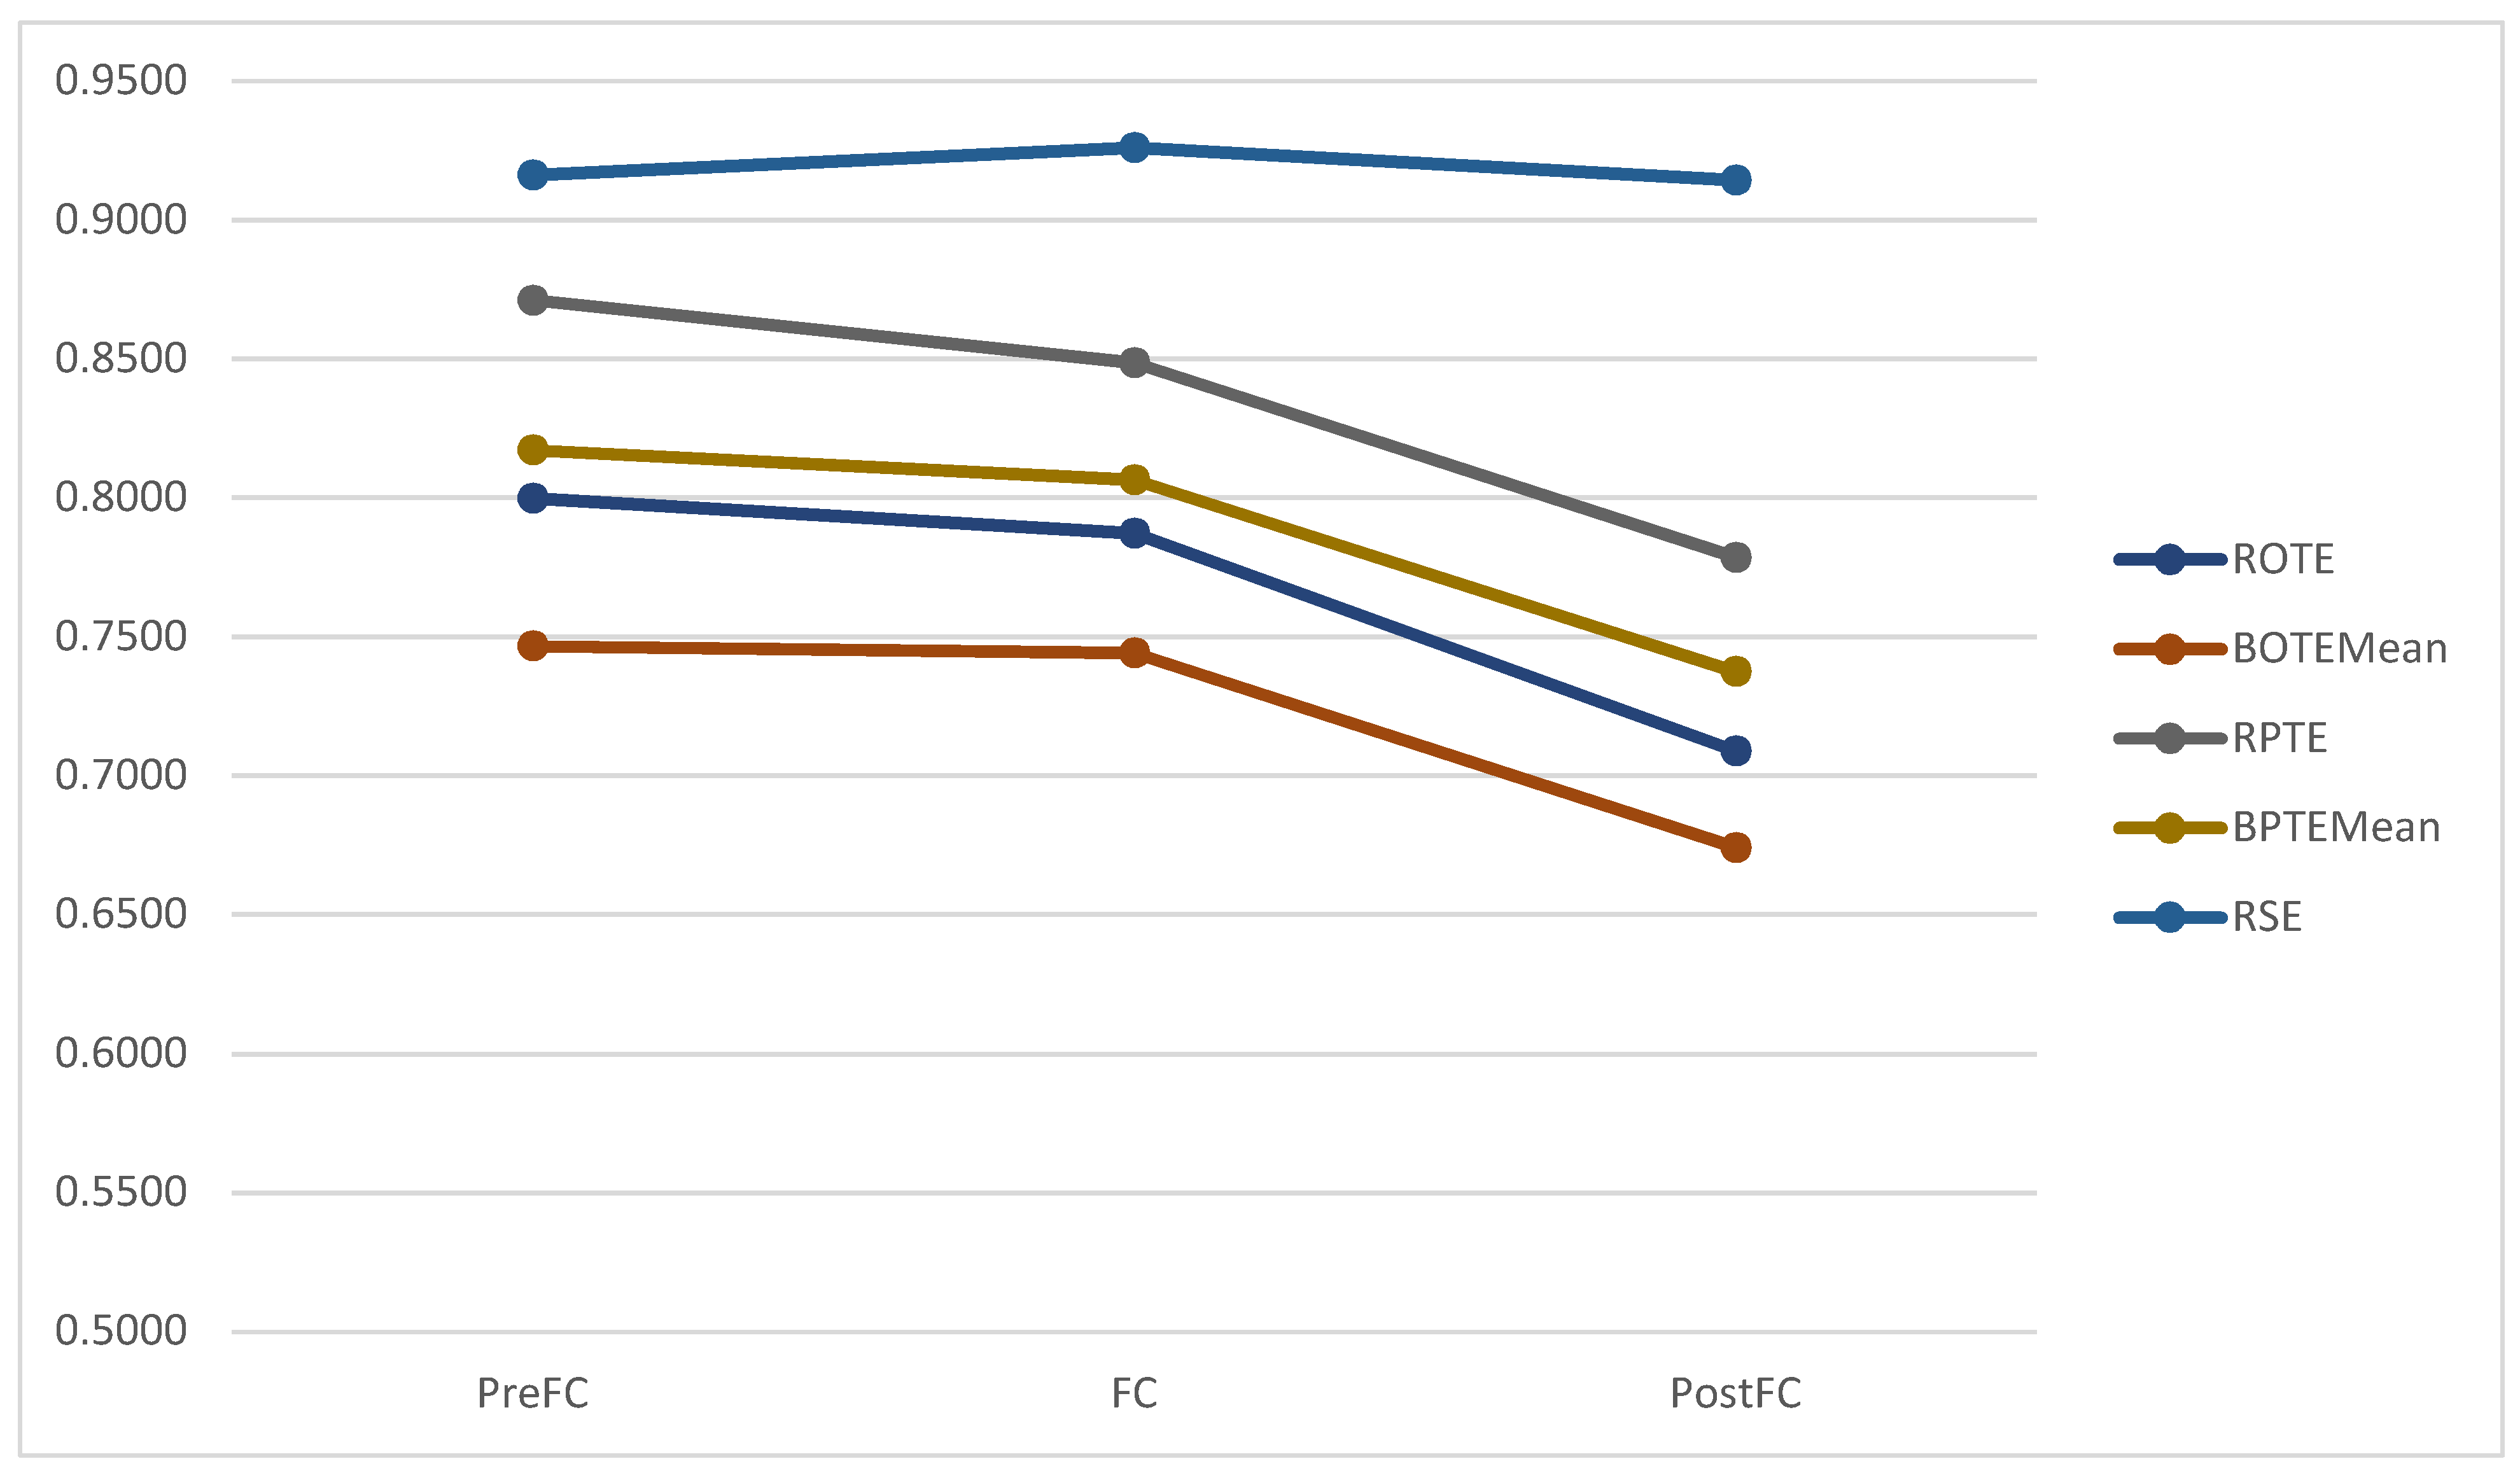
4.2.6. Impact of the 2007–2009 Financial Crisis on the Power Generation Companies

Lastly, we assessed whether the 2007–2009 financial crisis had an impact on the performance of the power generation companies. Toward this end, we divided the 18-year horizon into three subperiods: 2001–2006 (pre-financial crisis), 2007–2009 (financial crisis), and 2010–2018 (post-financial crisis). Table 6 reports a summary of the efficiencies scores over the three subperiods as well as the results of a one-way ANOVA test, and the trends are illustrated in Figure 9. The results of the test show that the overall technical efficiency and pure technical (managerial) efficiency ratios are statistically different over the three periods, while the opposite is observed for the scale efficiency ratios (see Table 6).
Furthermore, Tukey’s test of multiple comparison of means (Table 7) for the efficiencies of the power generation companies for the three periods shows that the overall technical and pure technical (managerial) efficiencies during the pre-financial crisis period (2001–2006) are significantly higher than those of the post-financial crisis period (2010–2018; p-values of 0.000) and that the efficiencies during the financial crisis period (2007–2009) are significantly higher than those of the post-financial crisis period (2010–2018; p-values vary between 0.001 and 0.003), but there is no significant difference between these efficiencies during the pre-financial crisis period (2001–2006) and the financial crisis period (2007–2009; p-values vary between 0.587 and 0.994). For scale efficiency, there are no statistical differences between the periods regardless of the comparison pairs considered (p-values vary between 0.785 and 0.991).

5. Managerial Insights

Canadian power generation companies, which significantly contribute to the provincial and national economic development, have been facing substantial challenges due to the cumulative impact of several federal and provincial regulations, which have impacted their ability to operate efficiently. These companies have to make substantial modifications to the production process in order to meet the regulations imposed due to climate change and other environmental issues, as a low-carbon and clean energy future is envisioned.
The results of our study clearly indicate that the main source of operational inefficiency in the Canadian power generation companies has been managerial and technical issues and not scale issues. This has resulted in the inputs not being efficiently used for electricity production. Therefore, policy makers and industry stakeholders should focus their attention on improving the operational efficiency of the power generation companies through streamlining production processes, reducing costs, and making capital investments in new and improved infrastructure.
The results of our study found that the 2007–2009 financial crisis further impacted the performance of the power generation companies in Canada. This is especially so because the United States, which is the biggest power-trading partner, has been widely impacted by the major economic depression resulting from the 2007–2009 financial crisis. To reduce the impact of future economic cyclical variations on the Canadian power generation companies, it is important that knowledge in this area be continuously developed, transferred, and adapted by the energy industry. This requires a close working relationship of the energy industry with academia and research organizations through research projects, and continuous trainings and workshops. The energy industry should make use of the operational and tactical decision- support tools that monitor the production processes and provide process control information in order to improve their strategic decision making.
Finally, benchmarking of the efficient power generation companies may help managers understand the best practices in the power generation energy sector, and provide management insights into how the inefficient companies can improve their overall technical and managerial efficiencies. By studying the companies with superior performance and comparing the processes of those power generation companies, an inefficient company can implement changes that might yield significant improvements. The inefficient companies should adopt new and emerging technologies and business processes that offer innovative ways of generating social and economic values. Benchmarking may also enhance familiarity of employees with the key performance metrics and opportunities for continuous improvement.
The results of our study provide policy makers and energy industry management with comprehensive details and managerial insights so that future resources may be reallocated to improve the performance of the power generation companies in Canada. Nonetheless, these results must be interpreted with caution, as the DEA methodology has some limitations. Since there is complete weight flexibility in the evaluation of DEA efficiency scores, it may result in identifying a DMU with an extreme weighting scheme to be efficient. Such false-positive DMUs may perform well with respect to the input/output measures considered but may not be following the best overall management practices. Therefore, the results of the relative efficiencies from this study should be considered along with other performance measures in the decision-making process.

6. Conclusions

This study assessed the relative efficiencies of Canadian power generation companies through the non-parametric bootstrap DEA approach. The results of the relative technical efficiency measures found that although those companies had high levels of scale efficiencies over the study period, their overall technical and managerial efficiencies were lower. The lower levels of technical efficiencies suggest that the focus of improvement in the power generation companies should be on streamlining the production processes, reducing costs, improving raw material usage, and making capital investments in new and improved technology. The economic fluctuations and uncertain market demand conditions have further impacted the performance of the companies. The impact of future economic recessions can only be reduced if the performance of the Canadian power generation companies is continuously evaluated and the knowledge developed in this area is regularly shared with the managers and adapted in the industry for strategic decision making. This will probably be more challenging in the aftermath of the COVID-19 pandemic, which, at the time of writing, is hitting the global economies so severely.
The results of this study highlight that the focus of policy measures should be on improving the production and efficiently using the inputs, using new and emerging technologies and business processes that offer innovative ways of generating social and economic values from the inputs in the power generation companies. Our study is unique in analyzing the performance measures of the Canadian power generation companies with respect to comparing their overall technical, managerial, and scale efficiencies. However, our results are limited by the limited input and output data that we were able to collect. More input and output data would further improve the results, in particular undesirable outputs such as CO2 and SO2 emissions, in the context of climate change.
In closing, it is worth pointing out that the results presented in the paper are context dependent, and as a result, though they may provide managerial insights to stakeholders in the power sector, they cannot be generalized to other contexts. As pointed out in Section 5, the DEA methodology is not without any limitations; therefore, the efficiency scores calculated in this work should be used along other preface measures in the decision-making process.

Author Contributions

Conceptualization, M.D., S.K.S. and L.Z.; methodology, M.D., S.K.S. and L.Z.; software, M.D.; validation, M.D., S.K.S. and L.Z.; formal analysis, M.D., S.K.S. and L.Z.; investigation, M.D. and S.K.S.; resources, M.D., S.K.S. and L.Z.; data curation, M.D.; writing—original draft preparation, M.D. and S.K.S.; writing—review and editing, M.D., S.K.S. and L.Z. All authors have read and agreed to the published version of the manuscript.

Funding

This research received no external funding.

Conflicts of Interest

The authors declare no conflict of interest.

Notes

1
2
3
4
5

References

  1. Al-Refaie, Abbas, Mohammad Hammad, and Ming-Hsien Li. 2016. DEA window analysis and Malmquist index to assess energy efficiency and productivity in Jordanian industrial sector. Energy Efficiency 9: 1299–313. [Google Scholar] [CrossRef]
  2. Asmild, Mette, Joseph C. Paradi, Vanita Aggarwall, and Claire Schaffnit. 2004. Combining DEA window analysis with the Malmquist index approach in a study of the Canadian banking industry. Journal of Productivity Analysis 21: 67–89. [Google Scholar] [CrossRef]
  3. Banker, Rajiv D., Abraham Charnes, and William Wager Cooper. 1984. Some models for estimating technical and scale efficiencies in data envelopment analysis. Management Science 30: 1078–92. [Google Scholar] [CrossRef] [Green Version]
  4. Banker, Rajiv D., Abraham Charnes, and William Wager Cooper. 1989. Constrained game formulations and interpretations for data envelopment analysis. European Journal of Operational Research 40: 299–308. [Google Scholar] [CrossRef]
  5. Barros, Carlos Pestana. 2008. Efficiency analysis of hydroelectric generating plants: A case study for portugal. Energy Economics 30: 59–75. [Google Scholar] [CrossRef]
  6. Barros, Carlos P., and Nicolas Peypoch. 2007. The determinants of cost efficiency of hydroelectric generating plants: A random frontier approach. Energy Policy 35: 4463–70. [Google Scholar] [CrossRef]
  7. BP Statistical Review of World Energy. 2018. Available online: https://www.bp.com/content/dam/bp/en/corporate/pdf/energy-economics/statistical-review/bp-stats-review-2018-full-report.pdf (accessed on 17 July 2019).
  8. Çelen, Aydın. 2013. Efficiency and productivity (TFP) of the Turkish electricity distribution companies: An application of two-stage (DEA & Tobit) analysis. Energy Policy 63: 300–10. [Google Scholar]
  9. Charnes, Abraham, Charles T. Clark, William W. Cooper, and Boaz Golany. 1985. A Developmental Study of Data Envelopment Analysis in Measuring the Efficiency of Maintenance Units in the US Air Forces. Annals of Operations Research 2: 95–112. [Google Scholar] [CrossRef]
  10. Charnes, Abraham, William W. Cooper, and Edwardo Rhodes. 1978. Measuring the efficiency of decision-making units. European Journal of Operational Research 2: 429–44. [Google Scholar] [CrossRef]
  11. Chung, Shu-Hsing, Amy Hsin-I. Lee, He-Yau Kang, and Chih-Wei Lai. 2008. A DEA window analysis on the product family mix selection for a semiconductor fabricator. Expert Systems with Applications 35: 379–88. [Google Scholar] [CrossRef]
  12. Emrouznejad, Ali, and Guo-liang Yang. 2018. A survey and analysis of the first 40 years of scholarly literature in DEA: 1978–2016. Socio-Economic Planning Sciences 61: 4–8. [Google Scholar] [CrossRef]
  13. Färe, Rolf, Shawna Grosskopf, and James Logan. 1983. The relative efficiency of Illinois electric utilities. Resources and Energy 5: 349–67. [Google Scholar] [CrossRef]
  14. Fare, Rolf, Shawna Grosskopf, and C.A. Lovell. 1994. Production Frontiers. Cambridge: Cambridge University Press. [Google Scholar]
  15. Goto, Mika, and Toshiyuki Sueyoshi. 2014. DEA efficiency analysis of solar photovoltaic power stations in Germany and the United States. Paper presented at 37th IAEE International Conference on Energy & the Economy, New York City, NY, USA, June 15–18. [Google Scholar]
  16. Government of Canada. 2020. Canada Energy Regular. Canada’s Energy Future. CER—Canada’s Energy Future. Available online: cer-rec.gc.ca (accessed on 3 October 2021).
  17. Jamasb, Tooraj, and Michael Pollitt. 2001. Benchmarking and regulation: International electric experience. Utilities Policy 9: 107–30. [Google Scholar] [CrossRef]
  18. Jebali, Eya, Hédi Essid, and Naceur Khraief. 2017. The analysis of energy efficiency of the Mediterranean countries: A two-stage double bootstrap DEA approach. Energy 134: 991–1000. [Google Scholar] [CrossRef]
  19. Jha, Deependra Kumar, and Rabin Shrestha. 2006. Measuring efficiency of hydropower plants in Nepal using data envelopment analysis. IEEE Transactions on Power Systems 21: 1502–11. [Google Scholar] [CrossRef]
  20. Lovell, Knox. 1993. Production frontiers and productive efficiency. In The Measurement of Productive Efficiency: Techniques and Applications. Edited by Harold O. Fried, Knox Lovell and Shelton Schmidt. Oxford: Oxford University Press, pp. 3–67. [Google Scholar]
  21. Lyu, Xiaohuan, and Anna Shi. 2018. Research on the renewable energy industry financing efficiency assessment and mode selection. Sustainability 10: 222. [Google Scholar] [CrossRef] [Green Version]
  22. Mahmoudi, Reza, Ali Emrouznejad, Hossein Khosroshahi, Mehdi Khashei, and Parisa Rajabi. 2019. Performance evaluation of thermal power plants considering CO2 emission: A multistage PCA, clustering, game theory and data envelopment analysis. Journal of Cleaner Production 223: 641–50. [Google Scholar] [CrossRef] [Green Version]
  23. Malmquist, Sten. 1953. Index numbers and indifference surfaces. Trabajos de Estadística 4: 209–42. [Google Scholar] [CrossRef]
  24. Mirnezami, Seyed Reza. 2014. Electricity inequality in Canada: Should pricing reforms eliminate subsidies to encourage efficient usage? Utilities Policy 31: 36–43. [Google Scholar] [CrossRef]
  25. Moeini, Ramtin, and Mohammad H. Afshar. 2011. Arc-based constrained ant colony optimization algorithms for the optimal solution of hydropower reservoir operation problems. Canandian Journal of Civil Engineering 38: 811–24. [Google Scholar]
  26. Natural Resources Canada. 2019. Electricity Facts. Available online: https://www.nrcan.gc.ca/science-and-data/data-and-analysis/energy-data-and-analysis/energy-facts/electricity-facts/20068 (accessed on 3 October 2021).
  27. Ng, Thiam Hee, and Jacqueline Yujia Tao. 2016. Bond financing for renewable energy in Asia. Energy Policy 95: 509–17. [Google Scholar] [CrossRef] [Green Version]
  28. Qudrat-Ullah, Hassan. 2013. Understanding the dynamics of electricity generation capacity in Canada: A system dynamics approach. Energy 59: 285–94. [Google Scholar] [CrossRef]
  29. Shi, Guang-Ming, Jun Bi, and Jin-Nan Wang. 2010. Chinese regional industrial energy efficiency evaluation based on a DEA model of fixing non-energy inputs. Energy Policy 38: 6172–79. [Google Scholar] [CrossRef]
  30. Simar, Leopold, and Paul W. Wilson. 1998. Sensitivity analysis of efficiency scores: How to bootstrap in nonparametric frontier models. Management Science 44: 49–61. [Google Scholar] [CrossRef] [Green Version]
  31. Song, Ma-Lin, Lin-Ling Zhang, Wei Liu, and Ron Fisher. 2013. Bootstrap-DEA analysis of BRICS’ energy efficiency based on small sample data. Applied Energy 112: 1049–55. [Google Scholar] [CrossRef]
  32. Sozen, Adnan, İhsan Alp, and Cuma Kilinc. 2012. Efficiency assessment of the hydro-power plants in Turkey by using data envelopment analysis. Renewable Energy 46: 192–202. [Google Scholar] [CrossRef]
  33. Sueyoshi, Toshiyuki, Aijun Li, and Xiaohong Liu. 2019. Exploring sources of china’s CO2 emission: Decomposition analysis under different technology changes. European Journal of Operational Research 279: 984–95. [Google Scholar] [CrossRef]
  34. Tavana, Madjid, Kaveh Khalili-Damghani, Francisco J. Santos Arteaga, and Arousha Hashemi. 2019. A Malmquist productivity index for network production systems in the energy sector. Annals of Operations Research 284: 415–45. [Google Scholar] [CrossRef]
  35. The Conference Board of Canada. 2012. Infrastructure Investments. Available online: https://www.conferenceboard.ca/e-library/abstract.aspx?did=4673 (accessed on 17 July 2019).
  36. The Conference Board of Canada. 2018. Climate Change and Infrastructure. Available online: https://www.conferenceboard.ca/e-library/abstract.aspx?did=9535 (accessed on 17 July 2019).
  37. Toma, Pierluigi, Pier Paolo Miglietta, Giovanni Zurlini, Donatella Valente, and Irene Petrosillo. 2017. A non-parametric bootstrap-data envelopment analysis approach for environmental policy planning and management of agricultural efficiency in EU countries. Ecological Indicators 83: 132–43. [Google Scholar] [CrossRef]
  38. Wang, Bing, Ioan Nistor, Tad Murty, and Yi-Ming Wei. 2014. Efficiency assessment of hydroelectric power plants in Canada: A multi criteria decision making approach. Energy Economics 46: 112–21. [Google Scholar] [CrossRef]
  39. Wang, Zhaohua, and Chao Feng. 2015. A performance evaluation of the energy, environmental, and economic efficiency and productivity in China: An application of global data envelopment analysis. Applied Energy 147: 617–26. [Google Scholar] [CrossRef]
  40. Wegener, Matthew, and Gholam R. Amin. 2019. Minimizing greenhouse gas emissions using inverse dea with an application in oil and gas. Expert Systems with Applications 122: 369–75. [Google Scholar] [CrossRef]
  41. Zha, Yong, Linlin Zhao, and Yiwen Bian. 2016. Measuring regional efficiency of energy and carbon dioxide emissions in china: A chance constrained DEA approach. Computers & Operations Research 66: 351–61. [Google Scholar]
  42. Zhang, Shanshan, Tommy Lundgren, and Wenchao Zhou. 2016. Energy efficiency in Swedish industry: A firm-level data envelopment analysis. Energy Economics 55: 42–51. [Google Scholar] [CrossRef]
  43. Zhou, Peng, Beng Wah Ang, and Kim-Leng Poh. 2008. A survey of data envelopment analysis in energy and environmental studies. European Journal of Operations Research 189: 1–18. [Google Scholar] [CrossRef]
Figure 1. Pearson correlation pair coefficients between the selected inputs and outputs.
Jrfm 14 00498 g001
Figure 2. Efficiency scores for the 17 power-generating companies.
Jrfm 14 00498 g002
Figure 3. Efficiency scores of the power-generating companies per region.
Jrfm 14 00498 g003
Figure 4. Efficiency scores of the power-generating companies per province/territory.
Jrfm 14 00498 g004
Figure 5. Efficiency scores of the power-generating companies per ownership type.
Jrfm 14 00498 g005
Figure 6. Annual efficiency scores of power-generating companies.
Jrfm 14 00498 g006
Figure 7. Geometric mean of the company-wise MPIs.
Jrfm 14 00498 g007
Figure 8. Geometric mean of the overall annual MPIs.
Jrfm 14 00498 g008
Figure 9. Efficiency scores of power-generating companies per subperiod (PreFC, FC, PostFC).
Jrfm 14 00498 g009
Table 1. Summary of inputs and outputs used in previous studies.
Energy Efficiency AnalysisModel UsedInputsOutputsReference
Energy efficiency of thermal power plants Shanon entropy
Game theory
Generation capacity
Hours of operation
Fuel consumption
Number of employees
Cost of power generation
Cost of training
Total revenue
Electricity generated
CO2 emissions
Mahmoudi et al. (2019)
Energy efficiency of power plants in ChinaDEA
Production decomposition analysis (PDA)
Index decomposition analysis
Energy consumption
Capital
Labor
GDP
CO2 emissions
Sueyoshi et al. (2019)
Energy efficiency of oil and gas companies Directional distance DEANumber of employees
Capital expenditure
Total assets
Production
Greenhouse gas emissions
Wegener and Amin (2019)
Energy efficiency of Iranian oil refineriesNetwork DEA Malmquist indexConsumption of oil
Consumption of fuel
Actual capacity
Complexity index
Number of employees
Consumption of Super gasoline
LPG
Gasoline
Kerosene
Gas oil,
fuel oil
Tavana et al. (2019)
Renewable energy financing efficiency in different parts of the globeDEA and
Malmquist index
R&D investment
Development of the stock market
Project financing
Venture capital
Renewable energy generationLyu and Shi (2018)
Energy efficiency in Mediterranean countriesDEA and
double bootstrap
Energy consumption
Labor force
Gross fixed capital
GDP Jebali et al. (2017)
Energy efficiency and productivity growth in Jordanian power generationDEA and
Malmquist index
Number of employees
Number of establishments
Energy consumption
Employee compensation
Intermediate consumption
Gross value added
CO2 emissions
Al-Refaie et al. (2016)
Energy regional efficiency of power plants in ChinaRadial distance DEALabor
Capital
Coal
Natural gas
GDP
CO2
Zha et al. (2016)
Energy efficiency of power plants in SwedenDEA
Regression
Labor
Capital
Fossil fuel
Non-fossil fuel
Sales
SO2
NOx
Zhang et al. (2016)
Energy, environmental, and economic efficiency of power plants in ChinaDEA and
Malmquist index
Capital stock
Labor
Energy consumption
GDP
SO2
Chemical oxygen demand
Wang and Feng (2015)
Energy Efficiency Of Photovoltaic Power Stations In Germany And The United StatesRadial distance DEAInsolation
Average sunshine
Photovoltaic land area
Annual modulesGoto and Sueyoshi (2014)
Energy efficiency among BRICS countriesBootstrap DEA
Super-SBM model
Economically active population
Capital formation rate
Energy consumption
GDPSong et al. (2013)
Energy efficiency of power plants in TurkeyDEACapacity usage factor (%)
Installed capacity
Water collection
Unit cost
Operations cost
Net generation
Gross generation
Sozen et al. (2012)
Energy efficiency of 28 administrative regions of ChinaDEAFixed assets
Energy consumption
Labor
Industrial added value
Volume of industrial waste gas
Shi et al. (2010)
Investigation of best practices toward improved performance in
the energy market
DEA and
Malmquist index
Labor
Capital
Operational cost
Investment
Energy
Production
Capacity utilization in %
Barros (2008)
Table 2. Statistics pertaining to the inputs–outputs for the 17 power-generating companies.
RegionProvince/TerritoryCompany NameNStatisticsNumber of EmployeesTotal Assets (CAD Millions)Operating Costs (CAD Millions)Capital Expenditures (CAD Millions)Total Revenues (CAD Millions)Total Electricity Generation (GWh)
WesternBCBC Hydro18Mean5470.0019,317.064515.831436.944925.7283,348.28
Median5740.0017,211.004365.501458.004792.5083,388.00
Std. deviation634.607680.231115.13779.621207.255853.36
ABTransAlta Corporation18Mean2415.728990.892172.22580.722519.6744,647.83
Median2384.509465.502175.00529.502589.0045,369.00
Std. deviation251.491241.12234.70232.68298.096596.80
ABTC Energy18Mean4238.4446,706.946134.004212.618642.6116,638.83
Median4100.0045,215.004737.003800.008341.5015,728.00
Std. deviation1884.5824,741.473446.802845.382702.843202.53
SKSaskPower18Mean2720.616603.611627.89643.001753.7821,840.22
Median2677.005303.501446.50581.501602.5021,618.00
Std. deviation325.513028.25505.06355.58509.062097.15
MNManitoba Hydro18Mean5926.8313,851.222017.1111,308.672108.3323,363.72
Median6039.0012,102.001959.509755.002104.0023,426.00
Std. deviation573.654576.88287.554609.61209.031545.14
CentralONAlgonquin Power & Utilities Corp10Mean1441.804467.00636.90240.20792.302875.60
Median1230.003795.00688.00181.00809.503031.00
Std. deviation575.013204.65408.64207.59541.121171.34
ONHydro One Limited18Mean5624.3317,452.114092.111206.785157.78172,977.78
Median5572.0016,478.504027.501417.004934.00170,600.00
Std. deviation1417.785657.48857.70421.85992.257555.64
ONOntario Power Generation18Mean10,720.7231,362.063728.0615,479.444342.5695,455.56
Median10,950.0028,580.503677.0013,268.004428.0088,600.00
Std. deviation1035.5911,413.68284.914001.13414.2318,407.49
QCBoralax Inc.18Mean276.671372.56135.61780.67197.501777.83
Median280.00920.50104.00528.50184.501559.50
Std. deviation62.311315.4297.58634.85109.67710.51
QCHydro Quebec18Mean20,164.0667,034.067016.2256,231.7811,851.39192,614.72
Median19,790.0065,363.507041.0055,920.0012,257.00192,237.50
Std. deviation1745.996705.20878.675003.291843.139656.30
EasternNBNB power18Mean2581.285414.611393.61283.721578.6718,799.72
Median2597.005505.501487.00279.001625.5018,692.00
Std. deviation128.931502.81210.28104.23189.801480.49
NSEmera Incorporated18Mean3540.2810,009.721836.33560.172328.9416,932.78
Median2819.005686.001206.50470.501545.0015,603.50
Std. deviation1856.119561.921365.34529.261691.983092.87
NSNova Scotia Power Inc.18Mean1806.393778.72888.722907.061157.0011,686.22
Median1805.003694.00944.502733.001192.5011,781.50
Std. deviation110.78769.94198.70587.25198.27711.99
NFLFortis Inc.18Mean4448.7817,614.332879.061187.563737.7832,369.00
Median2950.5012,775.002900.501047.503650.5027,732.50
Std. deviation2450.8316562.141879.50931.062537.4910,539.50
NFLNewfoundland Power Inc.18Mean669.721165.78409.17920.94527.895678.39
Median640.501222.50383.00863.00541.005673.50
Std. deviation105.90325.74161.45299.98111.58459.78
NFLNalcor Energy15Mean1311.273020.60611.131039.33697.1339,313.93
Median1290.002712.00585.00254.00714.0039,242.00
Std. deviation145.75846.78147.421244.89151.191583.63
NorthernYKYukon Energy Corporation18Mean81.11326.8326.94287.3933.89373.56
Median85.00325.5023.00250.0032.50379.00
Std. deviation15.58145.249.83131.138.1867.59
All samples All companies295Mean4428.5315,620.302424.576042.333165.8447,157.78
Median2657.007878.001746.00949.001869.0021,875.00
Std. deviation4902.1419,709.692316.8913,634.643326.8257,366.17
Table 3. Statistics pertaining to the efficiency scores for the 17 power-generating companies.
RegionProvince/TerritoryCompany NameNStatisticsROTEBOTEMeanRPTEBPTEMeanRSE
WesternBCBC Hydro18Mean0.74730.69720.74950.70620.9967
Median0.69630.67210.69840.67560.9988
Std. deviation0.10590.07510.10470.08190.0057
ABTransAlta Corporation18Mean0.81410.76560.82370.78690.9882
Median0.83210.77940.83920.80590.9890
Std. deviation0.09430.08660.09440.09010.0083
ABTC Energy18Mean0.82970.74880.94090.83840.8866
Median0.82480.75641.00000.85730.9808
Std. deviation0.14620.12010.07410.04690.1604
SKSaskPower18Mean0.74670.72530.75120.73320.9943
Median0.78210.76200.78570.76960.9947
Std. deviation0.07210.07060.07480.07370.0042
MNManitoba Hydro18Mean0.45580.43620.54150.52330.8443
Median0.45350.43290.53630.51550.8476
Std. deviation0.03720.03230.05740.05490.0307
CentralONAlgonquin Power & Utilities Corp10Mean0.74730.69830.80870.75150.9271
Median0.71570.67610.77290.72540.9537
Std. deviation0.09500.06550.10620.07010.0646
ONHydro One Limited18Mean0.89720.83250.97080.88780.9246
Median0.85760.81520.98160.89260.9549
Std. deviation0.07910.05260.03750.03120.0761
ONOntario Power Generation18Mean0.57410.54760.66370.63980.8655
Median0.56840.54690.65420.63530.8632
Std. deviation0.03400.02870.04370.04090.0145
QCBoralax Inc.18Mean0.70490.65440.80060.74020.8837
Median0.66420.63170.75260.70340.9056
Std. deviation0.13080.11540.14210.11500.0817
QCHydro Quebec18Mean0.76430.74540.96610.90840.7914
Median0.77190.75410.98440.92130.7926
Std. deviation0.03610.03770.04940.04470.0130
EasternNBNB power18Mean0.83590.79410.84290.81030.9913
Median0.83320.78360.83660.80270.9915
Std. deviation0.08920.07970.08660.07680.0054
NSEmera Incorporated18Mean0.83660.79780.84260.80650.9930
Median0.81400.78140.81790.79120.9940
Std. deviation0.09260.08460.09380.09040.0055
NSNova Scotia Power Inc.18Mean0.70430.67730.76370.73870.9226
Median0.70380.68270.75890.73280.9273
Std. deviation0.03160.03650.03150.03150.0332
NFLFortis Inc.18Mean0.82080.78540.84040.80210.9777
Median0.79710.76950.82460.79830.9976
Std. deviation0.08660.08160.08530.07770.0487
NFLNewfoundland Power Inc.18Mean0.88610.83060.90510.85940.9790
Median0.89960.84890.92190.87870.9776
Std. deviation0.07130.06320.07140.06360.0084
NFLNalcor Energy15Mean0.88320.81330.88760.83710.9946
Median0.90440.84030.90800.86550.9957
Std. deviation0.09620.07000.09360.07370.0043
NorthernYKYukon Energy Corporation18Mean0.53290.50970.83760.78980.6439
Median0.53950.51270.86090.82800.6438
Std. deviation0.05110.04760.13340.11830.0588
All samples All companies295Mean0.75060.70860.81940.77410.9169
Median0.76790.73340.82500.78550.9767
Std. deviation0.14980.13370.13570.11700.1073
One-way F39.30745.11828.44528.57653.338
ANOVA p-value0.0000.0000.0000.0000.000
Table 4. ANOVA test: results of comparison of power-generating companies per ownership type.
OwnershipNStatisticsROTEBOTEMeanRPTEBPTEMeanRSE
Government177Mean0.71020.67540.78930.75320.9008
Std. deviation0.15470.14050.14230.12790.1145
Public118Mean0.81130.75850.86460.80530.9410
Std. deviation0.11920.10510.11130.09040.0906
Total295Mean0.75060.70860.81940.77410.9169
Std. deviation0.14980.13370.13570.11700.1073
One-way F36.08830.06723.50914.67810.261
ANOVA p-value0.0000.0000.0000.0000.002
Table 5. Statistics pertaining to the annual efficiency scores of the power-generating companies.
YearNStatisticsROTEBOTEMeanRPTEBPTEMeanRSE
200115Mean0.79930.73370.87320.80270.9125
Median0.78560.76440.84370.81650.9921
Std. deviation0.19090.15570.13600.10210.1361
200215Mean0.80870.74770.88280.82140.9151
Median0.84220.81480.94220.87500.9911
Std. deviation0.17360.14660.14150.11790.1174
200315Mean0.79750.74670.87790.82630.9069
Median0.81620.78560.90060.86660.9889
Std. deviation0.17740.15420.13900.11820.1273
200416Mean0.79890.74940.86150.81210.9266
Median0.83840.77870.90530.86310.9869
Std. deviation0.16680.14570.14570.12640.1100
200516Mean0.79640.75070.86420.81810.9178
Median0.85410.79150.88490.85460.9873
Std. deviation0.16310.14720.11490.10010.1194
200616Mean0.79880.75080.86850.82220.9173
Median0.81620.79000.87780.83700.9837
Std. deviation0.15430.13990.11160.09850.1142
200716Mean0.81440.76980.88000.83620.9227
Median0.82850.79690.93020.87120.9864
Std. deviation0.16200.14710.12350.10800.1114
200816Mean0.77840.73570.83820.79670.9279
Median0.78270.75860.85610.80990.9845
Std. deviation0.14960.13370.12350.11100.1082
200917Mean0.77020.72810.82900.78780.9274
Median0.76580.74000.83470.79680.9854
Std. deviation0.14280.12660.11320.09740.1040
201017Mean0.73900.70390.80320.76760.9219
Median0.77720.73200.79620.77750.9786
Std. deviation0.12520.11780.11760.10900.1017
201117Mean0.73830.70420.80400.77050.9170
Median0.77850.74530.79540.77380.9463
Std. deviation0.13770.12970.12110.11400.0958
201217Mean0.70260.66960.76840.73600.9150
Median0.70010.67950.75550.73020.9329
Std. deviation0.12160.11530.12020.11160.0889
201317Mean0.72880.69280.78840.74740.9252
Median0.74740.71830.77960.75500.9541
Std. deviation0.13460.12130.13600.11520.0865
201417Mean0.73060.69600.79530.74930.9229
Median0.77590.71460.79170.77310.9719
Std. deviation0.12370.11340.13630.10840.0958
201517Mean0.71950.68010.78290.73300.9234
Median0.73890.69950.75190.72270.9754
Std. deviation0.13120.11610.14180.11340.1008
201617Mean0.67450.64230.75180.71130.9046
Median0.68340.65190.72560.70070.9525
Std. deviation0.12410.11800.14060.11990.1220
201717Mean0.67860.64340.76020.71750.9011
Median0.69650.66190.71320.68580.9529
Std. deviation0.11710.10760.14010.11800.1150
201817Mean0.66850.63480.75310.70480.8982
Median0.69410.66470.72820.70520.9427
Std. deviation0.12360.11900.15350.12660.1216
Total195Mean0.75060.70860.81940.77410.9169
Median0.76790.73340.82500.78550.9767
Std. deviation0.14980.13370.13570.11700.1073
One-way F1.8941.7212.1582.4740.114
ANOVA p-value0.0180.0390.0060.0011.000
Table 6. Results of the ANOVA test: comparison of the efficiencies of the power-generating companies during the financial crisis period.
PreFCPostNStatisticsROTEBOTEMeanRPTEBPTEMeanRSE
PreFC93Mean0.79990.74660.87110.81710.9162
Median0.83010.78800.89180.85570.9883
Std. deviation0.16640.14420.12840.10820.1176
FC49Mean0.78730.74420.84870.80650.9261
Median0.80590.76930.85000.81790.9854
Std. deviation0.14950.13420.11960.10540.1056
PostFC153Mean0.70890.67410.77860.73750.9144
Median0.72950.69830.76680.73530.9622
Std. deviation0.12620.11750.13250.11430.1016
Total295Mean0.75060.70860.81940.77410.9169
Median0.76790.73340.82500.78550.9767
Std. deviation0.14980.13370.13570.11700.1073
One-way F13.46411.31316.34917.3970.222
ANOVA p-value0.0000.0000.0000.0000.801
Table 7. Results of Tukey’s multiple comparisons of the means of the efficiencies for the periods PreFC, FC, and PostFC.
EfficienciesPeriod ComparisonDifferencep-Value
ROTEPreFC vs. FC0.01260.873
PreFC vs. PostFC0.09090.000
FC vs. PostFC0.07830.003
BOTEMeanPreFC vs. FC0.00240.994
PreFC vs. PostFC0.07250.000
FC vs. PostFC0.07000.003
RPTEPreFC vs. FC0.02250.587
PreFC vs. PostFC0.09250.000
FC vs. PostFC0.07010.003
BPTEMeanPreFC vs. FC0.01060.850
PreFC vs. PostFC0.07960.000
FC vs. PostFC0.06900.001
RSEPreFC vs. FC−0.00990.862
PreFC vs. PostFC0.00180.991
FC vs. PostFC0.01170.785
Publisher’s Note: MDPI stays neutral with regard to jurisdictional claims in published maps and institutional affiliations.

