Article

What Drives the Declining Wealth Effect of Subsequent Share Repurchase Announcements?

by
David K. Ding
1,2,
Hardjo Koerniadi
3,* and
Chandrasekhar Krishnamurti
4
1
Lee Kong Chian School of Business, Singapore Management University, Singapore 178899, Singapore
2
School of Economics and Finance, Massey University, Auckland 0745, New Zealand
3
Department of Finance, Faculty of Business, Economics and Law, Auckland University of Technology, Private Bag 92006, Auckland 1142, New Zealand
4
UniSA Business, University of South Australia, Adelaide 5001, Australia
*
Author to whom correspondence should be addressed.
J. Risk Financial Manag. 2020, 13(8), 176; https://doi.org/10.3390/jrfm13080176
Submission received: 16 July 2020 / Revised: 29 July 2020 / Accepted: 5 August 2020 / Published: 7 August 2020
(This article belongs to the Special Issue Corporate Finance)

Abstract

:
Recent academic studies document that open market share repurchase announcements in the United States generate significantly lower returns than those reported in earlier studies. We find that the lower announcement return is associated with an increasing number of subsequent announcements in the more recent periods. Although the announcement period return from the initial announcement is positive, subsequent announcement returns are significantly decreasing. Further, we find that the decreasing returns of subsequent announcements are attributed to firms with negative past repurchase announcement returns. Our multivariate regression test results are consistent with the notion that the decreasing subsequent repurchase announcement returns are driven by hubris-endowed managers.

Graphical Abstract

1. Introduction

SEC Rule 10b-18 of the United States’ Securities and Exchange Commission, introduced in 1982, allows a company to announce its intention to repurchase its shares at the going market price. Market reactions to open market share repurchase announcements in the 1980s were very positive with average cumulative announcement returns recorded of more than 3 percent (see, for example, (Vermaelen 1981; Ikenberry et al. 1995)).1 Since then, however, the cumulative abnormal announcement returns are reported to decline over the years with average cumulative announcement returns of around 1% in 2004 (Bonaimé 2012; Yook and Gangopadhyay 2011). The goal of this paper is to explain why some firms, in light of the evidence of declining average announcement period returns, continue to repeat their open market share repurchases.
What has caused the depletion of open market repurchase announcement returns? One possible explanation is that it could be related to the increasing number of frequent repurchase announcements.2 Jagannathan and Stephens (2003) find that the market reacts less positively to announcements made by frequent repurchasers than to those made by non-frequent repurchasers. The number of frequent repurchase announcements in their sample, during the period from 1986 to 1996, accounts for about half of their total sample. Since 2003, however, the frequency of announcing subsequent open market repurchase programs is reported to have been increased substantially (Fu and Huang 2016).3
Busch and Obernberger (2017) document that share repurchases help to maintain accurate stock prices by providing price support at fundamental values. They find no evidence of managers using share repurchases to manipulate stock prices when selling their equity holdings or exercising stock options. Similarly, Liu and Swanson (2016) provide evidence that a key motive for increasing share repurchases is to provide price support.
If the market reacts less favorably to subsequent repurchase program announcements, why would some firms keep repeating such a program? Ben-David et al. (2007) argue that hubristic managers are not only responsive to excess cash flows, but also prone to believe that their firms’ stock prices are less than what they should be and are likely to communicate their (biased) belief to the market by launching open market repurchase programs.4 Ben-David et al.’s (2007) argument is consistent with Jagannathan and Stephens’ (2003) findings that repeat repurchasing firms have large excess cash flows and high growth opportunities. As empirical evidence in the literature suggests that hubristic bias is pervasive among managers,5 this paper examines whether managerial hubris bias can explain the decreasing magnitude of open market repurchase announcement period returns. The empirical results are consistent with this conjecture.
It should be pointed out that the term hubris has been used in the context of takeovers by Roll (1986) to describe the managerial motive behind takeovers. Managerial hubris refers to overconfident managers who attribute their success to their individual superior abilities. There is no direct instrument available to measure CEO/managerial hubris. Prior work has used the following indicators to infer managerial hubris: recent organizational success (Meindl et al. 1985; Hayward and Hambrick 1997), recent media praise (Chen and Meindl 1991; Salancik and Meindl 1984), CEO’s self-importance (Manfred et al. 1984; Miller and Droge 1986; Finkelstein 1992), and the moneyness of CEO’s option (Kim et al. 2016). Following these works, particularly Hayward and Hambrick (1997), we infer about managerial hubris based on a firm’s prior performance.
This paper finds that, during the sample period from 1996 to 2014, the number of repeat or subsequent open market repurchase announcements has been increasing over the years. On average, the number of repeat announcements in a year accounts for about 68% of total open market repurchase announcements.6 Consistent with prior studies, compared with firms that do not repeat share repurchase announcements, firms that repeat their share repurchase programs have higher growth opportunities, have more free cash flows, are more profitable, less undervalued, larger, and have significantly lower cumulative abnormal announcement period returns (3.56% vs. 1.83%, respectively). It is, therefore, an empirical question why such firms, having high growth opportunities and large cash flows, would keep investing in their own stocks rather than investing in the real sector.
This paper documents firms that repeat open market share repurchase programs experience an average cumulative announcement period abnormal return of 2.51% from their initial announcement. However, when these firms repeat their repurchase programs, the market reacts less favorably to the second announcement, that the cumulative announcement period return drops significantly to 1.77%. The cumulative announcement period return continues to drop further to only 0.89% when firms make five or more open market repurchase announcements. In a further analysis, this study finds that firms with negative past announcement returns experience decreasing subsequent announcement returns, which is consistent with the notion that managers endowed with hubris are associated with decreasing subsequent announcement returns.
This study sheds light in explaining the declining open market share repurchase announcement returns and attempts to contribute to the literature in several aspects. First, this study employs a more recent sample period (from 1996 to 2014) and documents that the number of repeat open market share repurchase announcements has significantly increased over the years, suggesting that there is a systematic change in repurchasing behavior during the sample period. Second, the present study is the first to document that, not only the announcement returns of repeat announcements are lower than those of non-repeat announcements, but also that the magnitude of subsequent announcement returns is decreasing significantly. Third, this paper proposes a managerial motivation bias to explain the increasing number of repeat open market share repurchase programs. The empirical results are consistent with the hubris bias hypothesis that firms with managers endowed with hubris bias and equipped with excessive cash flows, are more likely to repeat their open market share repurchase programs even though their decisions generate lower subsequent announcement returns.
The rest of the paper is organized as follows. Section 2 develops and discusses the hypotheses. Section 3 describes the sample and data collection processes. The empirical results are reported in Section 4 and Section 5 concludes.

2. Hypothesis Development

The literature documents that firms that repeat their repurchase programs have higher growth opportunities, have more free cash flows, are less undervalued and are larger than those with infrequent repurchases (Jagannathan and Stephens 2003). Firms with such characteristics provide an ideal research setting for examining the managerial hubris hypothesis in subsequent share repurchase programs as hubristic managers are significantly more responsive to the generation of excess cash flows by their firms and tend to over-invest by repurchasing their firms’ shares (Ben-David et al. 2007; Malmendier and Tate 2005; Campbell et al. 2011).7 Supported with large amounts of free cash flows, managers may feel confident in their ability to meet the firm’s obligations and may also be over-confident in using the excess free cash flows on a subsequent open market repurchase program when they believe their firms’ equity value is underpriced, regardless of firms’ high growth opportunities and could have invested in real capital projects instead. If a repeat repurchase program is not in the best interest of shareholders, the market will react less favorably to a firm’s subsequent announcement. As such, we test the following hypothesis:
Hypotheses 1 (H1).
Subsequent open market repurchase announcements by hubristic managers will experience lower announcement period returns due to their overpayment for the shares.
Managers may develop a hubris bias when their previous open market repurchase program is successful (learning hubris) and, therefore, may overestimate their ability to repeat their previous success by launching a subsequent repurchase program. On the other hand, managers can also be hubristic if they are already endowed with it. Prior studies in the psychology literature document that people endowed with hubris are likely to ignore negative feedback of their behavior (Snyder et al. 1977; Swann and Read 1981; Taylor and Gollwitzer 1995). Thus, managers endowed with hubris are likely to ignore negative feedback from the market (Roll 1986; Billett and Qian 2008). Because they are biasedly optimistic about their ability to succeed, even though their firm’s past announcement return from the previous program is negative, if they believe that their current stock price is undervalued, they would likely attempt to correct the stock price by repeating a repurchase program. Therefore, we expect that the subsequent announcement returns of such firms to be lower, or even negative. Thus, the second hypothesis is:
Hypotheses 2 (H2).
If repeat repurchase announcements are attributed to endowed hubris, then firms with negative past announcement period returns will experience even lower subsequent announcement returns.
Managers with endowed hubris bias may likely repeat a subsequent share repurchase announcement within a shorter period, as they would like to repeat their previous success. The shorter the number of days between a previous and a current announcement, the lower is the expected current announcement period return. Consequently, the third hypothesis is:
Hypotheses 3 (H3).
The time between two subsequent announcements is positively related to the announcement period return.

3. Sample

This study collects open market share repurchase announcement dates of non-financial and non-utility firms in the U.S. from January 1996 to September 2014 from Thomson Reuters SDC Platinum. Price and accounting variable data of these firms were obtained from Thomson Reuters Datastream. Market-adjusted announcement period abnormal returns were computed with market value-weighted returns obtained from Kenneth French’s website8 as the benchmark. This study does not use the market model to estimate abnormal announcement returns as several firms in the sample repeat their announcements in less than a year period, and thus would bias the measurement of normal period return.9 Merging the data obtained from SDC Platinum and Thomson Reuters Datastream reduces the sample size to 3122 announcement-year observations. To mitigate the effects of outliers, these variables are winsorized at the 1% and 99% levels.
Table 1 shows the number of non-repeat and repeat announcements from 1996 to 2014, their corresponding announcement period returns, and the associated size programs during the sample period. In Panel A of Table 1, the total number of open market share repurchase announcements increases from 227 in 1996 to 405 in 2008 and then declines to 82 in 2014. The lowest (highest) total number of announcements is in 2012 (1998) with 36 (405) announcements. The percentage of announcements made by repeat repurchasers decreases from 59% in 1996 to less than half in 1999. Since then, it has increased to, on average, around three-fourths of all repurchase announcements every year in the sample period. Panel B shows that the lowest (highest) 2-day cumulative abnormal returns or CARs (days 0, +1) is 0.4% (4.7%) in year 2006 (1999). The average 2-day CARs since year 2000 is 1.78% per year, which is much lower than those reported in earlier studies in the open market repurchase literature. The average cumulative announcement abnormal return for the whole sample period is 2.4%. We observe that the size of repurchase programs increases over time with the average smallest (largest) program launched in 2004 (2012). On average, repurchasing firms plan to buy back around 7.56% of their outstanding stocks. The (untabulated) correlation coefficient between the percentage of repeat announcements and announcement returns is negative. These statistics clearly show that open market share repurchase announcements in more recent periods are dominated by repeat repurchase announcements with significantly lower announcement period returns.

4. Methods and Results

Fu and Huang (2016) report the disappearance of long run abnormal returns following stock repurchase programs from 2003 to 2012. They argue that the U.S. stock markets have become more efficient since 2003 due to several regulatory changes, such as the decimalization of stock prices and the enactment of the Sarbanes–Oxley Act of 2002 (SOX). These are expected to affect not only market and regulatory environments, but also reduce managers’ incentives to manipulate earnings. Thus, to examine whether the lower cumulative announcement period return is attributed to increased efficiency of the U.S. stock market since 2003, this study splits per year announcement period returns based on whether they are the first or subsequent announcements made by the repurchasing firms.
The results, as reported in Table 2, show that, on average, subsequent announcement returns are significantly lower than those of initial announcements at the 95% confidence level. These results remain consistent when the sample is sorted based on pre- and post-2003 periods. Hence, the findings suggest that the increased efficiency of the U.S. stock market alone cannot explain the decline in open market repurchase announcement period returns, but that subsequent announcements may also explain the lower repurchase announcement period returns. We also find that the average announcement returns in the 2003–2014 period (post-SOX) are significantly lower than those in the 1996–2002 period for both the first and subsequent repurchase announcements.
Panel A of Table 3 shows the differences of announcement returns sorted by firms that announce only one repurchase during the sample period versus firms that repeat their repurchase announcements. The cumulative abnormal return of open market repurchase programs announced by firms that do not repeat their open market repurchase programs is 3.56% and significantly higher than that of firms that repeat their announcements (1.83%), which is consistent with the findings of Jagannathan and Stephens (2003). In Panel B, announcement returns are sorted based on the order of repeat announcements. On average, repeat repurchasers earn 2.51% from their initial announcements. The average cumulative abnormal return in the second announcements, however, drops significantly to 1.77%. Third announcements experience a further decline in cumulative announcement return to 1.25%. The cumulative announcement return continues to decline when firms announce more open market repurchase programs (0.89%).
To examine if the declining subsequent announcement returns are attributed to hubristic bias, this study sorts the announcement returns based on the sign of past announcement returns. Panel A of Table 4 shows that the mean (median) return of the second repurchase announcements of firms that experience a negative announcement return from their initial announcements is 1.59% (1.29%) during the two-day announcement window period. When firms make subsequent announcements, their mean (median) announcement return drops significantly to 0.16% (−0.16%) during the two-day window period. However, there is no evidence of decreasing subsequent announcement returns for firms with positive past announcement returns (Panel B). These results suggest that the decreasing subsequent announcement returns can be attributed to firms experiencing negative past announcement returns that keep repeating their repurchase programs.
Table 5 shows the descriptive statistics of the sample sorted by the frequency of announcements made by repurchasing firms. Consistent with prior studies, repeat repurchasing firms are bigger, more profitable, have more free cash flows, have higher growth opportunities, and are less underpriced than those of non-repeat repurchasing firms (the mean of RUNUP is −7.3% vs. −9.2%, respectively). The less underpricing of repeat repurchasing firms suggests that the motivation of firms that frequently announce open market share repurchase programs may be less attributable to undervaluation but seems to be more consistent with the distribution of excess cash flows. According to the free cash flows hypothesis, when there are no growth opportunities available, managers distribute excess cash to the firm’s shareholders to maximize their firm value. These firms, however, have higher and increasing growth opportunities than non-repeat repurchasing firms as indicated by their book-to-market ratios. Thus, instead of investing in the real sectors, these firms choose to invest in the firms’ stocks by announcing subsequent repurchase programs, which is inconsistent with the free cash flow hypothesis but is more consistent with the hubris bias hypothesis.
Table 5 also shows that the stock performance of repeat repurchasers prior to subsequent announcements (RUNUP) is negative. The hubris bias hypothesis predicts that when hubristic managers believe their firms’ shares are undervalued, they are likely to repurchase shares by repeating their repurchase program. Furthermore, due to their illusory belief that they can repeat their past success of announcing such programs, these managers may also increase the size of their repurchase programs in subsequent announcements. The size of the repurchase program (SIZEPROG) reported in Table 5 is consistent with this conjecture. The size of the programs announced by repeat repurchasers from the initial announcement to subsequent announcements increases from 6.78% of the total outstanding shares to 7.50% in subsequent announcements, and further up to 7.69% for more than three subsequent announcements.
The results displayed in Table 5 suggest that firm characteristics of repeat repurchasers are different from those of non-repeat repurchasers and that they have the propensity to repeat open market share repurchase programs. Hence, this study conducts a logit analysis to examine the determinants or the likelihood of these firms to announce a share repurchase program:
REPEAT REPURCHASE = α + β1RUNUP + β2SIZE + β3B/M + β4SIZEPROG +
β5LEVERAGE + β6STDEV + β7ROA + β8OPTION + Industry and Year Control + ε
where REPEAT REPURCHASE is a dummy of 1 for announcements made by repeat repurchasers.
The results reported in Table 6 are consistent with the firm characteristics reported in Table 5. RUNUP is positively related to the likelihood to a repeat repurchase, suggesting that repeat repurchasers are not motivated by under-performance. Large firms with large cash flows are more likely to repeat share repurchase programs. Firms repeating repurchase announcements are also likely to increase their program size.
To examine whether hubris explains the lower subsequent repurchase announcement returns, this study controls for the probability of repeating a repurchase program measured by the fitted value from the logistic regression reported in Table 6. If the market is able to anticipate that a subsequent repurchase program would be launched by a repeat repurchaser, then the coefficient of this variable should be significantly related to the announcement period return and that the market should not react significantly to subsequent or repeat share repurchase announcements.
The results of cross-sectional regressions of share repurchasers’ announcement abnormal returns on hubris and control variables are reported in Table 7. Consistent with the second hypothesis, the results show that the decreasing subsequent announcement period returns are attributed to hubris-endowed managers. The coefficients of the probability of repeating a repurchase are not statistically significant, suggesting that the market may fail to anticipate subsequent repurchase announcements. The last column in Table 7 shows that firms that repeat their repurchase announcements within a shorter period experience significantly lower returns, which is consistent with the third hypothesis.

Robustness Tests

The sample period starts from the beginning of 1996. However, there could be a concern that this might not be representative of the start of an initial open market repurchase program. For added robustness, this study follows (Song and Walkling 2000; Cai et al. 2011; Aktas et al. 2013) by imposing an initial time lag of two years (1996 and 1997) during which time the repurchasing firms are not active. Only those firms that have not undertaken any transactions during the initial dormant period (1996 and 1997) are included in the sample. The results are similar to those reported in the main analysis.
Additionally, this study redefines the measure for repeat repurchasers as firms that announce subsequent open market share repurchase programs within five years of their initial issue. Although this alternative measure may suffer from a sample selection bias due to the restriction, this study finds that the results are also similar to those already reported. This study also considers the average abnormal returns on the announcement day (day 0) and three (−1, +1), four (−2, +2), and ten (−5, +5) days of return window periods in the analysis and finds that the results remain the same.
The present study examines managerial hubris at the firm level for several reasons. First, the most popular proxy for hubris at the CEO level is the option-related measure developed by Malmendier and Tate (2005). However, according to Malmendier and Tate (2015), Execucomp data prior to 2006 cannot be used to calculate this measure, while noting that our sample period runs from 1996 to 2014. Second, a recent study by Bayat et al. (2016) suggests that this option-based measure does not accurately measure hubris at the CEO level; rather, it measures firm characteristics. They find that CEOs who are considered hubristic according to the option-based measure are not considered as hubristic when they change their affiliation.
As prior studies suggest that hubristic managers with large cash flows tend to over-invest, therefore, we consider hubristic managers as those in firms that have the highest investments. Following Campbell et al. (2011), we measure a firm’s industry-adjusted investments as the difference between the firm’s capital expenditures scaled by its beginning of year gross property, plant, and equipment (PPE), and the average industry investment based on 2-digit Standard Industrial Classification (SIC) codes. These variables were downloaded from the Research Insight database and matched the variables to the final sample. This study then creates quintiles based on the industry-adjusted investments and examine only those firms that belong to the highest quintile (the largest investments) as they are considered to have hubris bias. The matching procedure and examining only the highest quintile, however, reduce the number of observations quite significantly. After re-running the regression models, we find similar results. The endowed hubris variable is significantly and negatively associated with the announcement period cumulative returns.
The other two proxies are a dummy variable of 1 for subsequent announcements as hubristic managers are expected to repeat a repurchase program and the number of previous repurchase announcements. A manager who has experience in launching more than one share repurchase program can develop hubris bias and feel more confident in repeating a program but result in negative announcement returns. The results are like those reported earlier. Both proxy variables are negatively related to the announcement period returns; however, only the coefficient of the dummy variable is statistically significant.
For added robustness, we include a time trend (TREND) in place of year effects in Table 7. The results shown in Table 8 are consistent with the earlier findings, albeit with a slight reduction of significance (p-value of 0.053) for ENDWHUBRIS.

5. Conclusions

This paper examines open market share repurchase announcements from January 1996 to September 2014. This paper documents that repeat announcements, which generate decreasing announcement returns, dominate the number of open market share repurchase announcements in the later period. Large firms with large cash flows are more likely to repeat share repurchase programs. Firms repeating repurchase announcements are also likely to increase their program size. This paper also finds that the decreasing announcement returns are attributable to subsequent announcements made by firms experiencing negative past repurchase announcement returns.
Our results are robust to alternative definitions of repeat purchases and are consistent with the notion that managers endowed with hubris or self-confidence drive the declining wealth of repeat repurchasing firms’ shareholders. A word of caution is in order. Corporate board members should be more mindful of the adverse impact of repeat share repurchases made by their over-confident managers to shareholders before approving such offers.
We acknowledge the limitation in the sampling period of our study and recommended future research to include data from more recent years. It would also be interesting to compare the results of this study to those in other countries that may have a similar regulatory framework to see if the conclusions are similar.

Author Contributions

Data curation, D.K.D.; formal analysis, D.K.D., H.K. and C.K.; methodology, H.K. and C.K. All authors have read and agree to the published version of the manuscript.

Funding

This research received no external funding.

Conflicts of Interest

The authors declare no conflict of interest.

References

  1. Aktas, Nihat, Eric de Bodt, and Richard Roll. 2013. Learning from repetitive acquisitions: Evidence from the time between deals. Journal of Financial Economics 108: 99–117. [Google Scholar] [CrossRef]
  2. Aktas, Nihat, Eric De Bodt, Hellen Bollaert, and Richard Roll. 2016. CEO narcissism and the takeover process: From private initiation to deal completion. Journal of Financial and Quantitative Analysis 51: 113–37. [Google Scholar] [CrossRef] [Green Version]
  3. Bagwell, Laurie Simon. 1991. Share repurchase and takeover deterrence. Rand Journal of Economics 22: 72–88. [Google Scholar] [CrossRef]
  4. Bagwell, Laurie Simon, and John B. Shoven. 1988. Share repurchase and acquisitions: An analysis of which firms participate. In Corporate Takeovers: Causes and Consequences. Edited by A. J. Auerbach. Chicago: University of Chicago Press. [Google Scholar]
  5. Bayat, Ali, Reza Salehnejad, and Peter Kawalek. 2016. Does CEO’s Holding of Vested Options Measure Overconfidence? Working Paper. Manchester: Alliance Manchester Business School. [Google Scholar]
  6. Ben-David, Itzhak, John R. Graham, and Campbell R. Harvey. 2007. Managerial Overconfidence and Corporate Policies No. w13711. Cambridge: National Bureau of Economic Research. [Google Scholar]
  7. Billett, Matthew T., and Yiming Qian. 2008. Are overconfident CEOs born or made? Evidence of self-attribution bias from frequent acquirers. Management Science 54: 1037–51. [Google Scholar] [CrossRef]
  8. Bonaimé, Alice A. 2012. Repurchases, reputation and returns. Journal of Financial and Quantitative Analysis 47: 469–91. [Google Scholar] [CrossRef]
  9. Busch, Pascal, and Stefan Obernberger. 2017. Actual share repurchases, price efficiency, and the information content of stock prices. The Review of Financial Studies 30: 324–32. [Google Scholar] [CrossRef]
  10. Cai, Jie, Moon H. Song, and Ralph A. Walkling. 2011. Anticipation, acquisitions, and bidder returns: Industry shocks and the transfer of information across rivals. Review of Financial Studies 24: 2242–85. [Google Scholar] [CrossRef]
  11. Campbell, T. Colin, Michael Gallmeyer, Shane A. Johnson, Jessica Rutherford, and Brooke W. Stanley. 2011. CEO optimism and forced turnover. Journal of Financial Economics 101: 695–712. [Google Scholar] [CrossRef]
  12. Chang, Shao-Chi, Sheng-Syan Chen, and Li-Yu Chen. 2010. Does prior record matter in the wealth effect of open market share repurchase announcements? International Review of Economics and Finance 19: 427–35. [Google Scholar] [CrossRef]
  13. Chatterjee, Arijit, and Donald C. Hambrick. 2007. It’s all about me: Narcissistic chief executive officers and their effects on company strategy and performance. Administrative Science Quarterly 52: 351–86. [Google Scholar] [CrossRef]
  14. Chen, Chao C., and James R. Meindl. 1991. The construction of leadership images in the popular press: The case of Donald Burr and People Express. Administrative Science Quarterly 36: 521–55. [Google Scholar] [CrossRef]
  15. De Ridder, Adri, and Jonas Rasbrandt. 2014. Share repurchases: Does frequency matter? Studies in Economics and Finance 31: 88–105. [Google Scholar] [CrossRef] [Green Version]
  16. Dittmar, Amy. K. 2000. Why do firms repurchase stock? Journal of Business 73: 331–55. [Google Scholar] [CrossRef] [Green Version]
  17. Fenn, George W., and Nellie Liang. 2001. Corporate payout policy and managerial stock incentives. Journal of Financial Economics 60: 1–44. [Google Scholar] [CrossRef] [Green Version]
  18. Finkelstein, Sydney. 1992. Power in top management teams: Dimensions, measurement and validation. Academy of Management Journal 3: 505–38. [Google Scholar]
  19. Fu, Fangjian, and Sheng Huang. 2016. The persistence of long-run abnormal reruns following stock repurchases and offerings. Management Science 62: 964–84. [Google Scholar] [CrossRef] [Green Version]
  20. Hayward, Matthew L. A., and Donald C. Hambrick. 1997. Explaining the premiums paid for large acquisitions: Evidence of CEO hubris. Administrative Science Quarterly 42: 103–27. [Google Scholar] [CrossRef]
  21. Howe, Keith M., Jia He, and G. Wenchi Kao. 1992. One-Time Cash Flow Announcements and Free Cash-Flow Theory: Share Repurchases and Special Dividends. Journal of Finance 47: 1963–75. [Google Scholar] [CrossRef]
  22. Ikenberry, David, Josef Lakonishok, and Theo Vermaelen. 1995. Market underreaction to open market share repurchases. Journal of Financial Economics 39: 181–208. [Google Scholar] [CrossRef] [Green Version]
  23. Jagannathan, Murali, and Clifford P. Stephens. 2003. Motives for multiple open market repurchase programs. Financial Management 32: 71–91. [Google Scholar] [CrossRef]
  24. Jensen, Michael C. 1986. Agency costs of free cash flow, corporate finance and takeover. American Economic Review 76: 323–29. [Google Scholar]
  25. Kahle, Kathleen M. 2002. When a buyback isn’t a buyback: Open market repurchases and employee options. Journal of Financial Economics 63: 235–61. [Google Scholar] [CrossRef]
  26. Karolyi, G. Andrew, Rose C. Liao, and Gilberto Loureiro. 2015. The Decreasing Returns of Serial Acquirers around the World. Working Paper. Ithaca: Cornell University, New Brunswick: Rutgers University, Braga: University of Minho. [Google Scholar]
  27. Kim, Jeong-Bon, Zheng Wang, and Liandong Zhang. 2016. CEO overconfidence and stock price crash risk. Contemporary Accounting Research 33: 1720–49. [Google Scholar] [CrossRef]
  28. Lakonishok, Josef, and Theo Vermaelen. 1990. Anomalous price behavior around repurchase tender offers. Journal of Finance 45: 455–77. [Google Scholar] [CrossRef]
  29. Lehn, Kenneth, and Annette Poulsen. 1989. Free Cash Flow and Stockholder Gains in Going Private Transactions. Journal of Finance 44: 771–87. [Google Scholar] [CrossRef]
  30. Liu, Harrison, and Edward P. Swanson. 2016. Is price support a motive for increasing share repurchases? Journal of Corporate Finance 38: 77–91. [Google Scholar] [CrossRef]
  31. Malmendier, Ulrike, and Geoffrey Tate. 2005. CEO overconfidence and corporate investment. Journal of Finance 60: 2661–700. [Google Scholar] [CrossRef] [Green Version]
  32. Malmendier, Ulrike, and Geoffrey Tate. 2008. Who makes acquisitions? CEO overconfidence and the market’s reaction. Journal of Financial Economics 89: 20–43. [Google Scholar] [CrossRef] [Green Version]
  33. Malmendier, Ulrike, and Geoffrey Tate. 2015. Behavioral CEOs: The role of managerial overconfidence. Journal of Economic Perspectives 29: 37–60. [Google Scholar] [CrossRef] [Green Version]
  34. Manfred, F. R., Kets de Vries, and Danny Miller. 1984. Neurotic style and organizational pathology. Strategic Management Journal 5: 35–55. [Google Scholar]
  35. Meindl, James R., Sanford B. Ehrlich, and Janet M. Dukerich. 1985. The romance of leadership. Administrative Science Ouarterly 30: 78–102. [Google Scholar] [CrossRef]
  36. Miller, Danny, and Cornelia Droge. 1986. Psychological and traditional determinants of structure. Administrative Science Quarterly 31: 539–60. [Google Scholar] [CrossRef]
  37. Mishra, Dev, Marie D. Racine, and Luke Schmidt. 2011. Credibility of Corporate Announcements and Market Reaction: Evidence from Canadian Share Repurchase Programs. Canadian Journal of Administrative Sciences 28: 83–100. [Google Scholar] [CrossRef] [Green Version]
  38. Peyer, Urs, and Theo Vermaelen. 2009. The Nature and Persistence of Buyback Anomalies. Review of Financial Studies 22: 1693–745. [Google Scholar] [CrossRef]
  39. Roll, Richard. 1986. The hubris hypothesis of corporate takeovers. Journal of Business 59: 197–216. [Google Scholar] [CrossRef]
  40. Salancik, Gerald R., and James R. Meindl. 1984. Corporate attributions as strategic illusions of management control. Administrative Science Quarterly 29: 238–54. [Google Scholar] [CrossRef]
  41. Skinner, Douglas J. 2008. The evolving relation between earnings, dividends, and stock repurchases. Journal of Financial Economics 87: 582–609. [Google Scholar] [CrossRef]
  42. Snyder, C. R., Randee Jae Shenkel, and Carol R. Lowery. 1977. Acceptance of personality interpretations: The “Barnum effect” and beyond. Journal of Consulting and Clinical Psychology 45: 104–14. [Google Scholar] [CrossRef]
  43. Song, Moon H., and Ralph A. Walkling. 2000. Abnormal Returns to Rivals of Acquisition Targets: A Test of the “Acquisition Probability Hypothesis”. Journal of Financial Economics 55: 143–72. [Google Scholar] [CrossRef]
  44. Stephens, Clifford P., and Michael S. Weisbach. 1998. Actual share reacquisition in open market repurchase programs. Journal of Finance 53: 313–33. [Google Scholar] [CrossRef]
  45. Swann, William B., and Stephen J. Read. 1981. Acquiring self-knowledge: The search for feedback that fits. Journal of Personality and Social Psychology 41: 1119–28. [Google Scholar] [CrossRef]
  46. Taylor, Shelley E., and Peter M. Gollwitzer. 1995. Effects of mindset on positive illusions. Journal of Personality and Social Psychology 69: 213–26. [Google Scholar] [CrossRef] [PubMed]
  47. Vermaelen, Theo. 1981. Common stock repurchases and market signaling. Journal of Financial Economics 9: 139–83. [Google Scholar] [CrossRef]
  48. Yook, Ken C., and Partha Gangopadhyay. 2011. A comprehensive examination of the wealth effects of recent stock repurchase announcements. Review of Quantitative Finance and Accounting 37: 509–29. [Google Scholar] [CrossRef]
1
The main motive for open market share repurchases is mainly either to buy back undervalued stocks (Lakonishok and Vermaelen 1990; Peyer and Vermaelen 2009), or to distribute temporary free cash flows, in lieu of dividends, to shareholders (Stephens and Weisbach 1998; Dittmar 2000; Skinner 2008). Other theories used to explain repurchases are: (1) to improve their leverage ratios (Bagwell and Shoven 1988); (2) to discourage takeover attempts (Bagwell 1991); and (3) to counter the dilution effect of stock option plans (Fenn and Liang 2001; Kahle 2002).
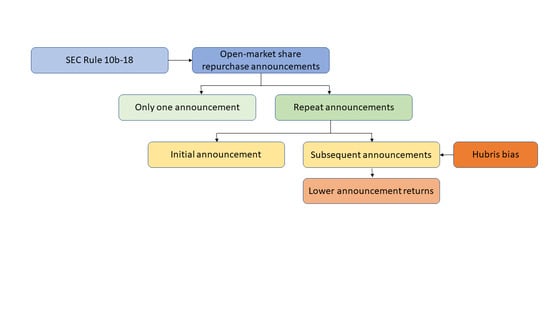
2
Another possible explanation could be due to lower past repurchase completion rates. (Bonaimé 2012; Mishra et al. 2011; Chang et al. 2010) argue that when a firm launches an open market share repurchase program but does not follow it through or repurchase less than the number of shares announced in the program, the market considers the firm as having a bad reputation. Consequently, the market will react less favourably when the firm announces a subsequent open market share repurchase program. Low past completion rates, however, cannot explain why some firms keep repeating open market repurchase programs. If the motivation to repurchase is related to stock undervaluation, which is one of the most common motives to launch an open market repurchase program, a positive market reaction to the repurchase announcement may be sufficient for the announcing firm to not fully follow through on its announced repurchase plan, and therefore may explain its lower repurchase completion rate. Similarly, if a firm’s subsequent open market repurchase program is motivated by distributing excess cash flows or stock options, it should not have a low repurchase completion rate.
3
A similar pattern has also been observed in the Swedish stock market. De Ridder and Rasbrandt (2014) find that repeat repurchasers make two out of three Swedish share repurchase announcements.
4
For the purposes of the current research work, we refer to hubris as an individual’s personal attribute of self- or over-confidence. We define the term managerial hubris as the over-confident behavior of corporate managers.
5
The finance literature documents that some managers are prone to self-attribution bias, which leads them to be hubristic. Ben-David et al. (2007) find that among other corporate actions, these managers are more likely to be associated with less efficient investments. Hayward and Hambrick (1997) find that CEO’s hubris (or exaggerated self-confidence) is strongly positively associated with the size of premiums paid for acquisitions. Malmendier and Tate (2008) find evidence consistent with the view that hubristic CEOs overestimate their ability to generate returns. Hence, they overpay for target companies and undertake value-destroying mergers. Another managerial trait—CEO narcissism—has also been shown to be positively related to the number and size of acquisitions. (Chatterjee and Hambrick 2007; Billett and Qian 2008; Karolyi et al. 2015) find evidence consistent with hubristic managers explaining the declining returns of serial acquirers. Recent work by Aktas et al. (2016) show that both acquirer and target CEO narcissism affect the characteristics of the takeover process. No prior studies have studied stock repurchases using the lens of managerial hubris.
6
Drops only in 1998 and 1999 to less than half of the total announcements in a year (48% and 45%, respectively).
7
Lehn and Poulsen (1989) find that firms with undistributed free cash flows tend to pay a significant premium for stock repurchases related to going private transactions. Howe et al. (1992) investigate whether Jensen’s (1986) free cash flow theory explains the market reaction to tender offer share repurchases and specially designated dividends where the cash distribution is not expected to be repeated. They find that free cash flows do not explain the announcement returns very well and conclude that their results are inconsistent with Jensen’s free cash flow hypothesis but consistent with the information-signaling hypothesis. They offer the entrenchment hypothesis as a possible explanation for their conflicting findings with those of Jensen’s.
8
9
This methodology is also used in studies on repeat acquisitions, such as (Karolyi et al. 2015; Billett and Qian 2008).
Table 1. Sample distribution and market adjusted returns.
Panel A. Number of Repurchases
YEARONLY ONEREPEATTOTAL% REPEAT
19969413322759%
199712212825051%
199821119440548%
199914712226945%
20009611220854%
2001438212566%
20025710916666%
2003237910277%
20042513215784%
20054715620377%
200647147419476%
20074114218378%
2008329212474%
200912597183%
2010309712776%
20112810613479%
201212243667%
201316435973%
201436468256%
Panel B. Cumulative Abnormal Announcement Returns
YEAR2-day Cumulative Abnormal Returns [CAR (0, +1)]SIZE OF PROGRAM (%)
(SIZEPROG)
19960.0246.656
19970.0206.538
19980.0307.358
19990.0477.917
20000.0457.631
20010.0237.413
20020.0406.617
20030.0166.826
20040.0136.465
20050.0197.010
20060.0047.459
20070.0228.649
20080.0258.025
20090.0207.441
20100.0158.753
20110.0108.201
20120.0209.407
20130.0088.177
20140.0147.055
ONLY ONE refers to firms that announce only one repurchase during the sample period. REPEAT is firms that announce to repurchase the first time and will repeat during the sample period. SIZEPROG is percent of shares authorized at initial authorization date.
Table 2. First and subsequent market-adjusted announcement returns.
PERIODFirst AnnouncementSubsequent AnnouncementsDifference
Average Total period0.026 ***0.016 ***0.010 **
Average 1996–20020.037 ***0.022 ***0.015 **
Average 2003–20140.020 ***0.013 ***0.007 **
Difference0.017 ***0.009 **
This table displays the cumulative market-adjusted returns (0, +1) from first and subsequent open market share repurchase announcements and the difference between the two. It also shows the difference of the average announcement returns between the two sub-periods. *** and ** denote statistical significance at the 1% and 5% respectively.
Table 3. Cumulative abnormal announcement returns (0, +1).
Panel A. Only One Repurchase vs. Repeat Repurchases
ONLY ONEREPEATDifference
3.56% ***1.83% ***−1.73% ***
Panel B. Cumulative announcement abnormal returns of repeat repurchasers
Initial announcementSecond announcementDifference
2.51% ***1.77% ***−0.73% **
Second announcementThird announcementDifference
1.77% ***1.25% ***−0.53% *
Third announcement≥5 announcementsDifference
1.25% ***0.89% ***−0.36%
Abnormal returns are measured as market-adjusted returns. ONLY ONE is firms that announce one repurchase during the sample period. REPEAT is firms that announce to repurchase the first time and will repeat during the sample period. Initial announcement is the first announcement made by repeat repurchasers. Second announcement is the second announcement made by repeat repurchasers. Third announcement is the third announcement made by repeat repurchasers. *, **, *** denote statistical significance at the 10%, 5% and 1%, respectively.
Table 4. Announcement returns sorted by past announcement returns.
Panel A. Negative Past Announcement Returns
CAR (0, +1)
2nd Announcement>2 AnnouncementsDifference
Mean1.59%0.16%−1.43% ***
Median1.29%−0.16%−1.45% †
Panel B. Positive past announcement returns
CAR (0, +1)
2nd announcement>2 announcementsDifference
Mean1.39%2.12%0.74% **
Median0.90%1.50%0.60% †
*** and ** denote statistical significance at the 1% and 5% levels, respectively. † denotes significance at the 1% level, based on Wilcoxon p-values for the median.
Table 5. Descriptive statistics.
Repeat Repurchasers
Mean ValuesTotalONLY ONEInitial Announcement≥2 Announcements≥3 Announcements
CASHFLOW0.1200.0920.1330.1370.140
B/M0.5610.6710.5190.4920.436
DIVYIELD0.0080.0050.0070.0090.011
LEVERAGE0.1780.1800.1720.1790.183
SIZE ($000)741,760273,773770,3611,654,7122,770,892
ΔSALES0.0220.0180.0350.0190.023
ROA0.0490.0160.0640.0680.079
ROA+10.0480.0090.0680.0690.076
RUNUP−0.063−0.092−0.073−0.035−0.024
STDEV0.0280.0340.0280.0230.020
SIZEPROG7.4207.7026.7807.4967.689
ONLY ONE refers to firms that announce only one repurchase during the sample period. Initial announcement is the first announcement made by repeat repurchasers. Second announcement is the second announcement made by repeat repurchasers. Third announcement is the third announcement made by repeat repurchasers. CASHFLOW is measured as cashflows/total assets. B/M is book-to-market ratio. DIVYIELD is dividend/market value of equity at time t − 1. LEVERAGE is total debt/total assets. SIZE is the natural logarithm of market value of equity in the quarter prior to announcement quarter. ΔSALES is change in sales/total assets. ROA is return on assets. All accounting variables are measured in the quarter prior to the announcement quarter. RUNUP is cumulative market-adjusted return measured from −46 to −6. STDEV is the standard deviation of market-adjusted return measured from day −100 to −46. SIZEPROG is the size of the repurchase program, measured as percentage of shares authorized at announcement.
Table 6. The determinants of repeat repurchases.
Coeff.(p-Values)
RUNUP0.600 ***(0.001)
CASHFLOW3.629 ***(0.000)
SIZE0.287 ***(0.000)
B/M0.226 *(0.061)
ΔSIZEPROG0.038 ***(0.006)
LEVERAGE−0.123(0.670)
STDEV−7.744 **(0.026)
ROA−0.014(0.959)
OPTION0.492(0.614)
INTERCEPT−3.168 **(0.029)
Year effectY
Industry effectY
LR chi2616.11
Pseudo R20.1599
Number of obs.2981
Logit analysis of the determinants of repurchasing made by repeat repurchasers. The dependent variable is one for repurchases made by repeat repurchasers. RUNUP is cumulative market-adjusted return measured from −46 to −6. CASHFLOW is measured as cashflows/total assets. SIZE is the natural logarithm of market value of equity in the quarter prior to announcement quarter. B/M is book-to-market ratio. ΔSIZEPROG is the change in program size. LEVERAGE is total debt/total assets. STDEV is the standard deviation of market-adjusted return measured from day −100 to −46. ROA is return on assets. OPTION is a dummy variable of one if the motivation to conduct a share repurchase program is related to stock options. p-values are in parentheses. ***, **, * denote statistical significance at the 1%, 5%, and 10%, respectively.
Table 7. Regressions of repeat repurchasers’ abnormal returns.
(1)(p-Values)(3)(p-Values)
ENDWHUBRIS−0.008 **(0.037)
TBD (×10,000) 0.0288 *(0.083)
RUNUP−0.031 ***(0.000)−0.01768(0.125)
SIZE−0.002(0.306)−0.00173(0.393)
B/M0.003(0.394)0.002276(0.672)
LEVERAGE−0.018(0.042)−0.00916(0.399)
STDEV0.627 ***(0.000)0.485303 ***(0.003)
ΔSIZEPROG0.001 *(0.055)0.000679 *(0.066)
OPTION−0.026(0.421)−0.08596(0.111)
CASHFLOW0.029(0.280)0.054924 *(0.091)
Pr(Repeat repurchase)−0.026(0.420)0.002167(0.954)
INTERCEPT0.033(0.462)−0.13531 **(0.022)
Year effectY Y
Industry effectY Y
Adj. R20.0679 0.0214
Number of obs.2972 1311
The dependent variable is cumulative abnormal return (0, +1). ENDWHUBRIS is one if a past repurchase announcement return is negative. TBD is the number of days between two announcements. RUNUP is cumulative market-adjusted return measured from −46 to −6. SIZE is the natural logarithm of market value of equity in the quarter prior to announcement quarter. B/M is book-to-market ratio. LEVERAGE is total debt/total assets. STDEV is the standard deviation of market-adjusted return measured from day −100 to −46. ΔSIZEPROG is the change in program size. OPTION is a dummy variable of one if the motivation to conduct a share repurchase program is related to stock options. CASHFLOW is measured as cashflows/total assets. Pr (repeat repurchase) is the estimated probability of a repeat repurchase based on the logit results presented in Table 6. *, **, *** denote statistical significance at 10%, 5%, and 1%, respectively.
Table 8. Regressions of repeat repurchasers’ abnormal returns with time trend.
Coeff.p-ValueCoeff.p-Value
ENDWHUBRIS−0.007 *(0.053)
TBD (×10,000) 0.031 *(0.061)
RUNUP−0.033 ***(0.000)−0.018 *(0.099)
SIZE−0.002(0.080)−0.001(0.504)
B/M0.004(0.281)0.005(0.291)
LEVERAGE−0.016 *(0.065)−0.008(0.429)
STDEV0.700 ***(0.000)0.530 ***(0.000)
ΔSIZEPROG0.001 **(0.045)0.001 **(0.012)
OPTION−0.028(0.384)−0.091 *(0.087)
CASHFLOW0.028(0.133)0.072 ***(0.004)
Pr(Repeat repurchase)−0.020(0.181)−0.012(0.489)
TREND0.000(0.298)0.000(0.445)
INTERCEPT0.020(0.648)−0.155 ***(0.006)
Industry effectY Y
Adj. R20.0681 0.0279
Number of obs.2972 1311
*, **, *** denote statistical significance at 10%, 5%, and 1%, respectively.

