Article

Firm Size Does Matter: New Evidence on the Determinants of Cash Holdings

by
Efstathios Magerakis
1,
Konstantinos Gkillas
2,*,
Athanasios Tsagkanos
2 and
Costas Siriopoulos
3,*
1
Department of Economics, University of Patras, 26504 Patras, Greece
2
Department of Business Administration, University of Patras, 26504 Patras, Greece
3
College of Business, Zayed University, 144534 Abu Dhabi, UAE
*
Authors to whom correspondence should be addressed.
J. Risk Financial Manag. 2020, 13(8), 163; https://doi.org/10.3390/jrfm13080163
Submission received: 15 June 2020 / Revised: 15 July 2020 / Accepted: 18 July 2020 / Published: 27 July 2020
(This article belongs to the Special Issue Innovation and SME Finance)

Abstract

:
We study the financial determinants of cash holdings and discuss the importance of firm size in the post-crisis period. We employ panel data regression analysis on a sample of 6629 non-financial and non-utility listed companies in the United Kingdom from 2010 to 2018. We focus on the comparative analysis of large, medium, and small size firms in terms of cash holdings. Our findings indicate that cash levels are higher for firms with riskier cash flows, more growth opportunities, and higher R&D expenditures. In contrast, the firms’ cash holdings decrease when the substitutes of cash, cash flows, and capital expenditures increase. We show that small-sized firms tend to hold more cash than their larger counterparts due to precautionary motives. Further, we confirm a significant and varying association between managerial ownership and cash holdings. The study is robust to different regression specifications, additional analyses, and endogeneity tests. Overall, we add to the prior literature by identifying the effect of firm-level attributes and governance characteristics on cash policy during the post-crisis period. To the best of the authors’ knowledge, this is the first work that provides insights on the way that firm characteristics impact cash holdings, considering the differences among firm size groupings.

1. Introduction

This study emphasizes the importance of firm size in assessing the cash policy of firms in the United Kingdom (UK) by using large, medium, and small size firms. Most non-financial businesses across the globe hold large cash reserves. The lack of liquidity that has been observed in several markets shockingly coexists with an unprecedented cash concentration by firms in the US and the UK market. Further, during periods of crisis, firms are more likely to hold high cash reserves to fuel their operational and investment needs. In the UK, as Macmillan et al. (2014)’s report indicates, the increasing corporate debt coupled with cost management practices allowed firms to stash record-high cash levels after the global financial crisis back in 2007/8. Additionally, O’Sullivan et al. (2016) report that the amount of corporate cash in the UK has risen by 14% since 2010. Indeed, UK firms maintain high levels of cash on their balance sheets in response to high market uncertainty and significant foreign exchange fluctuations linked to Great Britain’s vote to leave the European Union.
Motivated by the evidence in Dang et al. (2018), we hypothesize that firm size would be an important factor of differentiation for corporate cash holdings. Several studies (e.g., Bougheas et al. 2006; Driver and Muñoz-Bugarin 2019; Lawrenz and Oberndorfer 2018) find significant differences in access to credit between SMEs and large firms. In a similar vein, we investigate the factors that cause cash accumulation for the post-crisis period, with a major focus on the effects of firm size. We follow the assumptions of three capital structure’s theories, namely the trade-off model (e.g., Bates et al. 2009; Opler et al. 1999; Ozkan and Ozkan 2004), the pecking order theory (Bigelli and Sánchez-Vidal 2012; Dittmar et al. 2003; Ferreira and Vilela 2004), and the free cash flow theory (Dittmar and Mahrt-Smith 2007; Harford 1999; Kalcheva and Lins 2007) to investigate corporate cash policy.
Accordingly, we study the determinants based on the relevant theories of the UK listed firms for the period from 2010 to 2018. For this purpose, we draw the relevant accounting and ownership data on UK listed firms from the Amadeus database, provided by the Bureau van Dijk. Following previous literature, we investigate a heterogeneous set of variables as cash holdings’ determinants and apply several regression models to provide empirical consensus on what drives UK firms to hold cash. Further, we use dummy variables and concentrate on different size samples to examine whether the level of corporate cash holdings crisis differs significantly between SMEs and large companies. For the analysis, we classify firms into three size groups, namely small, medium, and large, based on the firm’s size over the entire sample period. Hence, small, and large firms are respectively in the bottom (p25) and top (p75) quartiles of the size, while medium firms represent the middle of the size distribution, between the other groups. Lastly, this study draws on research conducted by Ozkan and Ozkan (2004) to investigate the causal effect of corporate governance proxies on corporate cash holding. For this purpose, we consider several characteristics, such as the board size, CEO and chairman duality, and managerial ownership in the empirical analysis.
Overall, the empirical findings suggest that for our sample of non-financial non-utility companies, cash holdings increase for firms with riskier cash flows, higher growth opportunities, and R&D intensity. In contrast, the existence of substitutes of cash, higher cash flows, and capital expenditures decreases a firm’s cash levels. A key finding of our analysis is that firm size is negatively related to cash holdings; UK small firms tend to accumulate cash due to precautionary motives. Our findings confirm the significant effect of managerial ownership and ultimate controllers on a firm’s cash holdings. Further, we show that the relationship between firm size and cash holdings is stronger for mature, with strong balance sheets, and low industry rivalry firms. We employ various additional tests, including alternative measures of firm size and different periods, which also provide support to our findings.
This study aspires to make several contributions. First, this work contributes to a significant stream of research regarding the determinants of cash holdings (Bates et al. 2009; Ozkan and Ozkan 2004). Second, this study classifies firms based on their total assets; thus, we add to recent studies by shedding light on the way that firm characteristics impact cash holdings by examining the differences among size groupings. Using the seminal work of Dang et al. (2018) as a benchmark, we provide evidence that firm size is a determining factor of cash holdings. Finally, this study enhances the existing knowledge (e.g., Harford et al. 2008; Ozkan and Ozkan 2004) of the effect of corporate governance mechanisms on corporate cash holdings.
This study consists of the following parts. Section 2 summarizes the relevant theoretical and empirical background. Section 3 specifies the variables’ measurements and discusses the study’s methodology. Section 4 reports the sample selection and the summary statistics, while Section 5 illustrates the main results. Section 6 presents additional analyses and robustness tests. Finally, Section 7 concludes the paper.

2. Theoretical and Empirical Background

Corporate cash is a crucial parameter for firms’ sustainability nowadays. Much of the economic instability worldwide stems from the effects of bank liquidity; thus, the availability of cash provides a safety net for firms to achieve their goals and meet their obligations. However, firms hold cash for several reasons and have different motives according to their needs. Nevertheless, cash detention has both hidden costs and benefits. For instance, liquid assets are vital in conducting business, since they can be used at any time to take advantage of any project with positive valuation and can reduce the firm’s transaction costs (Opler et al. 1999). Cash holdings can also reduce a firm’s cash flow uncertainty, which is highly consistent with the results obtained by Ferreira and Vilela (2004); the authors support that cash holdings minimize the probability of financial distress and allow the undertaking of investment projects, regardless of the unexpected financial constraints. Another advantage of holding cash is the cost reduction in raising external funds, either from borrowing cash or forcing to liquidate firms’ assets (Ferreira and Vilela 2004). However, the hidden cost of cash stashing is the opportunity cost of the capital invested in liquid assets (Ferreira and Vilela 2004).
In the existing literature, three major theories of capital structure emerged in the investigation of corporate cash holdings. Financial research discusses the firms’ characteristics that affect cash holdings on the basis of the trade-off theory (Myers 1977), the pecking order theory (Myers and Majluf 1984), and the free cash flow theory (Jensen 1986). Originally, Modigliani and Miller (1958) proposed that the market value of a typical firm is irrelevant to its capital structure: the capital structure does not affect firm value in perfect financial markets. The prementioned proposition implies a market with no taxes, agency costs, or asymmetric information (Modigliani and Miller 1958). Since there are no agency costs, there is no hidden cost of holding cash accordingly. According to Modigliani/Miller’s (MM, hereafter) theory, a firm’s market value is independent of its financial policies on paying dividends to shareholders or retaining profits within the firm.
After the MM theory, Myers (1977) set the basis for the static trade-off theory, highlighting the severe cost of debt and leverage. The trade-off theory (TOT) of capital structure assumes that firms have an optimal level of debt, which maximizes the company’s value. According to Kraus and Litzenberger (1973), companies strive for a better balance of tax benefits and bankruptcy costs. Consequently, firms seek to obtain tax benefits against the problems caused by possible bankruptcy (Bradley et al. 1984). On the contrary, the pecking order theory (POT) of capital structure, delivered by Myers and Majluf (1984), asserts that there is no optimal level of borrowing in order to maximize enterprise value. Hence, managers follow a hierarchical order for their financial options, using firstly, retained profits and secondly, borrowing. As a last resort, managers will choose to raise capital by issuing new shares. The POT is based on the concept of information asymmetry between managers and investors concerning the company’s value and its investment opportunities (Myers and Majluf 1984). The basic premises of the free cash flow theory (FCF) are that free cash flow is the cash flow in excess that is required to fund all projects that have positive net present values when discounted at the relevant cost of capital (Jensen 1986). The agency theory also indicates managers’ preference to accumulate cash for future projects or corporate investment of unknown outcomes instead of paying dividends to shareholders.
Assuming rational behavior, the transaction motive focuses on analyzing the firm’s transaction demand for cash. Following the primary cash flow management models produced by the studies of Baumol (1952) and Tobin (1956), Miller and Orr (1966) presented a formula for determining the optimal level for the cash ratio, which is defined as the lower point of the combination of cash transactions’ costs and the opportunity cost of accumulating cash. Based on the precautionary motive, Bates et al. (2009) argued that firms need to hold cash in order to cover unexpected financial crises. Firms hold more cash when the income’s insecurity is higher than otherwise, combined with costly external borrowing and the need for investment (Riddick and Whited 2009). The speculative motive suggests that firms that anticipate future growth opportunities are more likely to accumulate cash (Opler et al. 1999). Another motive for holding cash is the agency motive. Historically, a company is managed by its founders and their descendants; this applies to most companies, especially smaller ones. However, when companies grow, managers (agents) are hired to govern them on behalf of the owners, thereby raising the agency problem.1 Therefore, while managers should aim to maximize the firm’s value for the benefit of its shareholders, they often follow their agenda to achieve their personal goals and strengthen their influence within the organization.
Past studies, such as the ones of Opler et al. (1999), Ferreira and Vilela (2004), and Ozkan and Ozkan (2004), examined the determinants of cash holdings in different markets.2 Another research work supports that cash holdings are related to the firms’ financial policies, growth and investment decisions, and capital structure (Faulkender 2002). Another study documents that firms retain low cash reserves in environments with high information asymmetry (Chung et al. 2015). However, shareholders may allow excess cash holdings when there is only minor information asymmetry. Nevertheless, they can penalize the managers if the fact that they irrationally hold excess cash holdings is proven (Chung et al. 2015). Opler et al. (1999) also investigate the impact of asymmetric information and the costs of external finance. The asymmetric information affects the cost of raising capital, which increases the assets that are more sensitive to information published, such as shares. Hence, difficult access to capital markets relates to higher firm cash holdings.
There is also a rapidly growing literature on the association between corporate governance and the level of cash holdings.3 Firms waste excess cash resources in economically inviable projects and diminish the company’s value and performance, as a result of weak governance. Hence, the cash holding policy may not matter if the firm is poorly governed (Dittmar et al. 2003). Dittmar et al. (2003) support that firms hold excess cash reserves in countries with more significant agency problems. Moreover, Dittmar and Mahrt-Smith (2007) find that firms that grant sufficient protection to shareholders actually tend to maintain higher cash reserves twice over the amount. Instead, firms with weak governance tend to spend their cash reserves faster, which reduces their effectiveness and performance. The basic premise of this argument is that corporate governance affects the usage of cash stashes, while a firm with poor governance will use excess cash holdings in bad projects or investments. More specifically, their research demonstrated that in the case of poorly governed firms, there is a nearly 50% reduction in the market value of excess cash. In contrast, a well-governed firm has its excess resources better secured (Dittmar and Mahrt-Smith 2007). Furthermore, it relies on management to pay the cash to the shareholders or keep it for expanding and funding the firm’s projects. However, the management of the company may carry out investments with negative present value (PV) in order to control more assets and to drive business to over-investment (Damodaran 2005).
Following the influential work implement by Ozkan and Ozkan (2004), later studies also examine the topic in the UK context. For instance, Al-Najjar (2015) investigates whether corporate governance mechanisms play some role in determining corporate cash holdings. Using a sample of small and medium-sized enterprises (SMEs) throughout 2000–2009, the study provides no supportive evidence of a significant relationship between firm governance index and insider ownership with cash holdings of UK firms. However, Al-Najjar (2015) finds that chief executive officer (CEO) pay, the ratio of research and development expenditures to sales, and operating risk have a statistically significant and positive association with cash ratio, while firm size, leverage, and liquidity display a significant but negative relation to cash. In this direction, Le et al. (2018) also inspect the impact of firm-specific factors on corporate cash holdings of UK firms listed on the London Stock Exchange from 2011 to 2016. The empirical findings from the pooled OLS regression indicate that firm size, leverage, and investment opportunity are significantly related to a firm’s cash policy. In general, the results from prior literature are mixed.
This paper differs from the existing literature in three primary ways. First, while our paper builds on prior evidence, we are interested in the financial determinants of cash holdings in the post-crisis period, where firms are expected to increase their cash reserves after a negative macroeconomic shock. Second, we exploit the level of cash holdings based on firm size, whereas the prior literature uses firm size as a control variable. Drawing on Dang et al. (2018), we discuss the importance of firm size and adopt the estimation model on the comparative analysis of large, medium, and small size firms in terms of cash holdings. Third, we focus on the UK case, which is unique when relative to other developed and emerging markets. For instance, UK listed firms have diffused ownership (Kilincarslan 2019), while governance structure has significantly changed in response to shocks, such as the 9/11 attacks (Ongsakul et al. 2020). Hence, this study offers new insights compared with the former study of Ozkan and Ozkan (2004).

3. Variable Measurement and Research Design

3.1. Variable Measurements

Following Ozkan and Ozkan (2004), we use the ratio of cash plus cash equivalents to total assets as the dependent variable of the study. The main variable of interest is the firm’s size. Consistent with the prior literature, we measure a firm’s size (SIZE) as the natural logarithm of the firm’s total assets (Bates et al. 2009). The prior academic literature reports that firm size is highly related to cash holdings. However, the relationship between firm size and cash ratio is ambiguous, since empirical studies predict both a negative association (e.g., Al-Najjar and Belghitar 2011; Oler and Picconi 2014; Opler et al. 1999) and a positive association (e.g., Harford et al. 2014; Kusnadi 2011; Ozkan and Ozkan 2004). In economic terms, we predict that that smaller (larger) firms hold higher (lower) cash holdings to deal with their daily transactions and operating activities due to the existence of economies of scale and information asymmetries.
In addition, we include a set of variables to examine their effect on a firm’s cash holdings.4 In particular, cash flow to sales (CF) assesses the firm’s ability to generate cash flow due to financing constraints. Opler et al. (1999) find that firms with substantial cash flows hold more cash, while Ozkan and Ozkan (2004) validate a reverse relationship between cash flows and cash holdings. Leverage (LEV) is the ratio of total debt to total assets and measures the firm’s capability to meet its financial obligations or its debt burden on its total assets. Based on the findings from previous empirical evidence (e.g., Bates et al. 2009; Duchin 2010; Ozkan and Ozkan 2004; Tong 2010), we expect a negative relationship between leverage and cash holdings. Net working capital (NWC) indicates the amount of the firm’s liquid assets that may substitute for cash. We construct NWC as the ratio of current assets minus current liabilities and cash scaled by total assets. In line with previous works (e.g., Almeida et al. 2004; Denis and Sibilkov 2010; García-Teruel and Martínez-Solano 2008), we expect a negative relation between NWC and CASH.
Further, we use the debt maturity variable (DEBTMT), which corresponds to long-term debt divided by total liabilities. Firms that use more (less) long-term debt have a less (more) risk of refinancing (Harford et al. 2014); accordingly, we predict a negative association between DEBTMT and cash to total assets. Capital expenditures (CAPX) and R&D intensity (XRD) account for a firm’s growth opportunities (García-Teruel and Martínez-Solano 2008; Subramaniam et al. 2011). More specifically, we calculate CAPX as the change of fixed assets plus depreciation and amortization divided by total assets; XRD is the ratio of R&D expenditures to the firm’s sales. Additionally, we measure market to book ratio (MTB) as the ratio of the book value of total assets minus the book value of equity plus the market value of equity to total assets. We predict a positive association between CASH and MTB; we hypothesize that firms with higher growth opportunities will hold more cash (Acharya et al. 2007; Elyasiani and Zhang 2015; Oler and Picconi 2014). We measure the INDSIGMA variable as the average standard deviation of cash flow/sales—defined as previously—over the previous three years, requiring at least three observations based on two-digit SIC codes. We assume that higher business uncertainty should result in higher cash levels (Bates et al. 2009; Bigelli and Sánchez-Vidal 2012; Opler et al. 1999).
Following Kim et al. (1998), we construct the opportunity cost of holding liquid assets (RSPREAD) as the difference between the return on assets (operating profits to total assets) and the return on Treasury bills. Based on the prior literature (Kim et al. 1998; García-Teruel and Martínez-Solano 2008), we predict a negative relation between RSPREAD and CASH. Moreover, in line with García-Teruel and Martínez-Solano (2008), we use one-year Treasury bills (INT) to measure the short-term interest rate, and the annual growth of the gross domestic product (GDP) to account for the possible effects of the time-series variation of the economic cycle on cash holdings. Anand et al. (2018) suggest a negative association between long-term and short-term bonds on corporate liquidity.
Moreover, following Ozkan and Ozkan (2004), we use managerial ownership (MAN), which is the total percentage of equity ownership by company directors, and CEO duality (CEO_COB), which is an indicator that takes a value of one if the positions of CEO and COB are held by the same individual and zero otherwise. Previous findings from Drobetz and Grüninger (2007), Kusnadi (2011), and Ozkan and Ozkan (2004) validate a negative association between CEO duality and cash levels. We also include the board size (BOARDNB) variable in the analysis measured as the natural logarithm of the number of board members. The relationship with cash holdings is ambiguous; Al-Najjar and Clark (2017) and Neamtiu et al. (2014) argue that board size is negatively related to cash holdings, while Chen and Chuang (2009) and Drobetz and Grüninger (2007) report inverse an relationship. Table 1 summarizes the predicted effect of the main explanatory variables on corporate cash holdings based on the relevant theories.

3.2. Research Design

For this study, we inspect the determinants of corporate cash holdings, as introduced from the prior literature, by employing a simple regression model. Motivated mainly by the transaction and the precautionary motive for holding cash, we use the following model to measure the explanatory variables. We concentrate on the regression model associated with specific characteristics of the companies in order to test their effect on the trend of cash holdings for UK firms. We follow Bates et al. (2009) and Ozkan and Ozkan (2004), who examine the trend firms’ cash holdings in the US and UK, accordingly. Consistent with the prior literature, we are first interested in the determinants of UK firms’ cash holdings during the sample years. We draw on the following equation for linear regression:
C A S H i , t = β 0 + β 1 S I Z E i , t + β 2 C F i , t + β 3 L E V i , t + β 4 N W C i , t + β 5 D E B T M T i , t + β 6 C A P X i , t + β 7 X R D i , t + β 8 I N D S I G M A i , t + β 9 M T B i , t + β 9 R S P R E A D i , t + β k Y E A R + β j I N D U S T R Y ( F I R M ) + ε i , t
where C A S H i , t is the estimated cash ratio of firm i at year t , β 0 is the intercept, β 1 β 10 are the independent variables’ coefficients, and ε i , t is the error term. We also control for time-specific and industry (firm) fixed effects. In addition, i indexes companies i = 1, 2, …, N, and t indexes year t = 1, 2, …, T. To mitigate the concern about outliers, both tails of the distribution of all continuous variables are Winsorized at the 1% level.
In addition, we incorporate a lagged dependent variable in Equation (1) to estimate the dynamic cash model.5 Equation (2) has the following form:
C A S H i , t = α 0 + ( 1 α ) 1 C A S H i , t 1 + γ 2 S I Z E i , t + γ 3 C F i , t + γ 4 L E V i , t + γ 5 N W C i , t + γ 6 D E B T M T i , t + γ 7 C A P X i , t + γ 8 X R D i , t + γ 9 I N D S I G M A i , t + γ 10 M T B i , t + γ 11 R S P R E A D i , t + γ k Y E A R + γ j I N D U S T R Y ( F I R M ) + ε i , t
where α is the intercept, C A S H i , t 1 is the target change in cash reserves from time t 1 to t , γ 2 γ 11 are the independent variable’s coefficients, and ε i , t the error term. We include the same set of independent variables and year, industry (firm) fixed effects to capture unobservable differences across time, industries, and firms.6
Further, we incorporate size dummies to examine the effect of firm characteristics on corporate cash holdings of the small, medium, and large firms during the period from 2010 to 2018. We divide the sample into subgroups based on their size, using as a cut-off point the upper 75th percentile to identify large firms. Additionally, we classify small firms, that is, those under the 25th percentile, while those in between are classified as medium firms. For this purpose, Equation (1) is re-estimated for different size groupings.
C A S H i , t = β 0 + β 1 S I Z E D U M M Y ( S M A L L v s L A R G E   &   M E D I U M v s L A R G E ) i , t + β 2 C F i , t + β 3 L E V i , t + β 4 N W C i , t + β 5 D E B T M T i , t + β 6 C A P X i , t + β 7 X R D i , t + β 8 I N D S I G M A i , t + β 9 M T B i , t + β 9 R S P R E A D i , t + β k Y E A R + β j I N D U S T R Y + ε i , t
where SIZEDUMMY is a binary variable, which takes the value one (zero) for firms where SIZE is above (below) the sample’s median; SMALL vs. LARGE is a binary variable, which takes the value one for large firms (SIZE ≥ p75) and zero for small firms (SIZE ≤ p25); MEDIUM vs. LARGE is also a binary variable, which takes the value one for large firms (SIZE > p75) and zero for medium firms (p25 < SIZE < p75).7 We include the same set of controls with Equation (1), year and industry fixed effects.

4. Data, Sample Selection, and Descriptive Statistics

4.1. Data and Sample Selection

In this paper, we use relevant financial statement data from the Amadeus database for nine years, starting from 2010 and ending in 2018.8 The sample includes UK-based non-financial and non-utility companies listed on the London Stock Exchange (LSE) and listed in £GBP. The final sample comprises 992 distinct firms and a total of 6629 firm-year observations across nine years of empirical analysis. We exclude firms from the financial industry and utility firms (SIC codes 6000, and 4900–4941, respectively). Following the criteria of sample selection used in the literature, we drop observations with zero, negative sales, and total assets. We also delete the firm-year observations with missing values on cash holdings and other research variables. All variables are truncated at the 1% level at both tails to mitigate the potential effect of outliers.9 Table 2 reports the sample distribution by year and industry of publicly traded non-financial firms in the UK market.

4.2. Descriptive Statistics

Table 3 presents the descriptive statistics for the dependent and main independent variables for the sample period of 2010–2018. On average, a UK firm holds 16.8% of its total assets in cash and short-term equivalents. For the UK listed firms, the average leverage is 17.2%, while the average market value is twice that of the book value. Moreover, a typical firm spends a portion of 8.2% and 2.3% of its total assets for investments in capital and R&D, respectively.
Figure 1 presents an upward trend in cash and cash equivalents over the total assets of UK companies from 2011 to 2014, followed by a stabilization period (2015–2018). The median cash ratio shows the same pattern over the sample years. In 2018, the median cash holdings reached the highest value of 10% out of the years of the analysis.
Following García-Teruel and Martínez-Solano (2008), we also plot the cash holdings’ evolution, along with the evolution in the interest rates and the UK economy’s GDP growth over the sample years. Figure 2 highlights that the cash ratio (CASH) remains significantly higher than the interest rates and the GDP growth throughout the sample period. We can observe that in 2017, when the interest rates increased, corporate cash holdings decreased. As a rule of thumb, we expect that when interest rates are lower (higher), cash ratio increases (decreases). On the other hand, the GDP growth has a similar movement—yet, significantly lower in percentage—to the yearly evolution of corporate cash holdings.
Figure 3 demonstrates the distribution of liquidity ratios for different sized firms and their evolution over time. Firms are grouped into three distinct categories according to their size: small, medium, and large. Confirming our expectation, Figure 3 shows that small firms hold more cash than large firms, following the transaction or precautionary motives. In general, empirical evidence considers that large firms face fewer financial constraints due to their easier access to external finance and the existence of economies of scale (Pereira Alves and Morais 2018). The plot suggests that there has been a minor ascending shift of cash to total assets ratios for all size classes from 2010 to 2014. After 2014, we observe that the UK firms’ cash holdings decreased for the next year, and then, stabilized until 2018 (at least for medium and large firms). As it may be observed, an important variation in the average cash ratio exists among the three size classes. The average cash ratio for the full sample is 16.78%, while for small firms, the average cash ratio is 27.33%. In contrast, the cash ratio declines for the next size groups, with medium and large firms at 15.55% and 8.95%, respectively. More specifically, the comparison of cash holdings for large, medium, and small firms designates that the distribution of this ratio is shifted towards considerably higher values for smaller firms.
Table 4 reports the Pearson (lower diagonal) and Spearman (upper diagonal) correlations for the main variables. The correlation between CASH and SIZE is negative and significant at the 1% level, indicating that larger firms are associated with lower cash holdings. Smaller firms (SIZE) tend to have higher CASH, larger cash flows (CF), and lower growth opportunities (MTB). Additionally, as expected, CASH is positively correlated with INDSIGMA and negatively correlated with LEV. Moreover, firms with higher leverage (LEV) are more likely to experience higher uncertainty in the industry’s cash flow (INDSIGMA). In Table 4, the last line summarizes the results from the VIF (variance inflation factor) test, thus, confirming zero evidence of multicollinearity issues regarding our specifications.
Table 5 reports the average values of the main variables used in the analysis based on cash to assets quartiles. We follow prior studies (e.g., Opler et al. 1999; García-Teruel and Martínez-Solano 2008) to check for differences between firms’ characteristics with higher cash holdings (fourth quartile) and those with lower cash holdings (first quartile). The t-statistic (last column) confirms that the mean values between firms in the first and fourth quartiles are significantly different. Our findings agree with Opler et al. (1999), who show that R&D expenditures to total assets, industry cash flow volatility, and market to book ratio increase monotonically across quartiles of cash holdings. Regarding leverage, we observe a reverse movement across quartiles; firms from the first to the fourth quartile lessen their exposure to debt, as their cash holdings increase. However, the results validate that not all variables change progressively when a firm’s cash holdings increase; the mean cash flow ratio is positive and keeps increasing for firms in the first three quartiles, but then declines abruptly.

5. Main Results

5.1. Determinants of Cash Holdings

Table 6 reports the regressions of the explanatory variables on cash holdings. Column (1), following Opler et al. (1999) and Bates et al. (2009), tabulates the results based on the main specification, including year and industry fixed effects. Column (2) presents the estimation results of Equation (1), including an interaction between year fixed effects and industry fixed effects, while Column (3) replaces industry with firm fixed effects to capture firm-level variations on cash policy behavior. Following García-Teruel and Martínez-Solano (2008), in Column (4), we include short-term interest rates (INT) and the growth of the Gross Domestic Product (GDPGR) in the main specification, Equation (1), to assess the macroeconomic impact on cash holdings. Column (5) reports the results of Fama–Macbeth regressions of cash holdings on firms’ characteristics. Finally, Column (6) shows the results after re-estimating Equation (1) with the inclusion of the lagged cash variable by using linear regression analysis. We add the lagged cash ratio as a dependent variable as well to capture the persistence of cash to asset ratios over time and to test for potential biases that may exist. The estimates generally confirm that all the independent variables have the expected sign and significance. More importantly, the estimate of lagged cash is positive, less than unity, and statistically significant at the 1% level.
Overall, we observe similar estimates and t-statistics across models. Specifically, the coefficient on cash flow to sales ratio (CF) is negative, confirming the propensity of cash-flow rich firms to hold less cash (Kim et al. 1998). This finding contradicts Ozkan and Ozkan (2004), who argue that the effect of cash flows on the firm’s cash holdings is positive and significant at 10%. As predicted, we obtain a negative coefficient on net working capital (NWC) and leverage (LEV), thus, confirming the previous literature (e.g., Opler et al. 1999; Bates et al. 2009). Current research seems to validate the view that the higher the firms’ liquid assets, the lesser the cash accumulation, as suggested by the trade-off theory. To return to an earlier point, firms with higher debt financing ratios tend to decrease their cash levels (Bates et al. 2009; Opler et al. 1999; Ozkan and Ozkan 2004). This finding agrees with the theoretical predictions that stem from the pecking order model. In contrast, the insignificant estimate on the debt maturity (DEBTMT) implies that the maturity of a long-term debt does not have a causal effect on cash holdings in our sample firms.
Table 6 also shows that firm size has a negative relation to cash holdings; smaller firms hold more cash due to financing constraints than their larger counterparts, which benefit from existing economies of scale. Furthermore, capital expenditures (CAPX), which reflect the firm’s investment opportunities, are negatively related to cash holdings (CASH). On the other hand, the estimate of research and development ratio (XRD) is positive and significant at the 1% level. The UK firms that prefer higher R&D investments increase their cash levels significantly. In line with the precautionary motive for cash holdings, innovative firms increase their cash levels to shield against a future cash deficit. The estimate of industry cash flow volatility (INDSIGMA) is positive and significant at the 1% level, thus, implying that firms deploy more cash to overcome risen cash flow uncertainty (Bates et al. 2009).
Additionally, the results present a positive relation between the market to book ratio (MTB) to cash holdings. Consistent with the premises of the agency theory, firms with higher levels of growth opportunities are more likely to hoard cash when possible (Ozkan and Ozkan 2004). Regarding RSPREAD, the positive and significant estimate suggests that firms increase their cash holdings in response to investments in the firm’s activities. Overall, the signs and statistical significance of the estimates in the first two columns agree with those found in the prior studies and support the theories of cash holdings. Column (3) shows some differences among the cash holdings and firm characteristics in comparison to Columns (1) and (2). More analytically, the cash flow ratio (CF) shows no significance to cash holdings, while the debt maturity variable (DEBTMT) has a positive causal effect on cash ratio when we replace industry with firm fixed effects. Following Brick and Liao (2017), our regression results show a significantly positive relationship between cash holdings and debt maturity. Thus, a firm’s shorter (longer) maturity results in lower (higher) cash holdings; however, the economic significance of this result is minimal (Harford et al. 2014).
Further, we predict that firms are expected to hold less cash when interest rates increase; instead, firms are expected to prefer investments in assets with higher returns (Anand et al. 2018). Nevertheless, our macroeconomic factors were inconclusive as regards their impact on the cash ratios of UK firms. Column (4) shows that the interest rates (INT) and the growth of gross domestic product (GDPGR) are insignificant determinants for our sample firms. Column (5) presents the estimation results of Equation (1) using a Fama and MacBeth (1973) two-step procedure, validating our main results as presented in Columns (1)–(3), while Column (6) introduces the lagged dependent variable in the model, providing evidence for the existence of a target cash level of UK firms (Ozkan and Ozkan 2004). Based on Equation (2), we note that the estimate of the lagged cash is positive and significant at 1%, thereby supporting the view that firms adjust towards an optimal cash ratio. Under the simple OLS estimate with fixed effects, we find that a typical UK non-financial non-utility firm adjusts its actual cash ratio by 27% on average annually toward its target. Therefore, our results on the adjustment speed of cash holdings suggest a slow speed of adjustment of approximately 3.7 years to correction, compared to previous studies in the context of the US (e.g., Orlova and Rao 2018; Venkiteshwaran 2011).

5.2. Small, Medium, and Large-Sized Firms

Further, we aim to shed light on the association between cash holdings and their potential determinants for different firm size groupings. Both the financial theory and the prior literature show evidence that firm size is highly connected to a firm’s efficiency and sustainability. Firm size has a significant effect on a firm’s growth opportunities (Beck et al. 2005). Following the prior literature, we consider firm size as a proxy for financial constraints. Smaller firms are expected to face difficulties in accessing external finance; hence, they are expected to hold more cash than larger firms that benefit from information asymmetries and the lower costs of external financing (Drobetz and Grüninger 2007). Larger firms are more diversified in their activities (Rajan and Zingales 1995) and are more likely to use external financing than accumulating cash due to a lower bankruptcy risk (Al-Najjar and Belghitar 2011).
Table 7 reports the empirical results for the full sample based on Equation (3). Column (1) shows the evidence for the whole sample, including a dummy variable that equals one when firm size is above the yearly median and zero otherwise. The SIZE dummy has a significant coefficient, indicating that firm size is a significant determinant of cash holdings. This finding confirms the empirical expectations and evidence reported in Table 6. Columns (2) and (3) introduce two binary variables: SMALL vs. LARGE, which takes the value one for large firms (SIZE ≥ p75) and zero for small firms (SIZE ≤ p25), and MEDIUM vs. LARGE, which takes the value one for large firms (SIZE > p75) and zero for medium firms (p25 < SIZE < p75). Column (2) shows that SMALL vs. LARGE has a negative and significant association (β = −0.105, t-stat = −5.87) with CASH, implying that large firms hold less cash than small sized firms. Column (3) reports a negative and significant association between MEDIUM vs. LARGE and CASH (β = −0.018, t-stat = −2.19), implying that larger firms hold less cash than medium sized firms.
Further, we divide the sample into subgroups based on their size, using as a cut-off point the upper 75th percentile to identify large firms. Further, we classify small firms, that is, those under the 25th percentile, while those in between are classified as medium firms. For this purpose, we re-estimate Equation (1) for different size groupings. Column (4) displays the regression results for small firms, Column (5) for medium-sized firms, and Column (6) illustrates the large firms’ results. The adjusted R2 for small, medium, and large firms are 0.322, 0.327, and 0.330, respectively. Additionally, the results show differences in economic and statistical significance between the three models. As shown in Table 7, the results of the regression analysis indicate that cash flow has significance only for the subsample of small-sized firms. The data yielded by this study present convincing evidence that the smaller a firm is, the higher the significance of cash flow to the model, which supports the trade-off theory (Kim et al. 1998). Hence, small-sized firms that generate higher cash flows are more likely to keep lower levels of cash stashed.
Interestingly, debt maturity (DEBTMT) is negatively (positively) related to cash holdings of large (small) firms. With regard to large firms, a more extended debt maturity structure signifies a decrease in cash holdings. In this case, we find support of the pecking order model, since large-sized companies are expected to deal with lower information asymmetries and enjoy more accessible long-term debt, which should hold less cash (García-Teruel and Martínez-Solano 2008). On the other hand, small firms are more likely to rely on short-term debt; thus, they are more vulnerable to a higher risk of financial distress-risk due to constant negotiations of credit terms. As a result, we support the trade-off model regarding the positive association of debt maturity and cash holdings of small firms. Moreover, leverage, capital expenditures, and net working capital are negatively linked to cash holdings, regardless of the firm’s size.
Regarding financial leverage, a negative coefficient is estimated for small and medium subgroups, confirming pecking order and agency theories. Following a recent study, as total debt to total assets, leverage seems to have more considerable significance for the cash holdings of small firms than of large firms (Martínez-Carrascal 2010). Small firms are potentially more exposed to capital market deficiencies. Likewise, as expected, the cash holding decision depends negatively on the substitutes of cash; firms with high net working capital hold less cash than firms with low net working capital. The association, however, between CASH and NWC is not valid for small firms. Capital expenditures show a negative and significant at the 1% level for all size groupings. R&D expenditures, however, are positive and significant at the 1% level only for small and medium-sized firms. Both trade-off and pecking order theory predict this outcome. Growth opportunities, as represented by the market to book ratio, are also positively linked to cash ratio for all size classes. The market to book variable as the cash ratio’s determinant is of greater importance for small and medium-sized firms. As expected, industry cash flow volatility has a positive and significant association with the firm’s cash holdings. UK small firms hold more cash than large firms due to precautionary motives.
Similar to Han and Qiu (2007), we find evidence that cash flow volatility affects cash holdings positively. The positive link between cash ratio and the uncertainty of cash flows is predicted by the trade-off theory and has reliable explanatory power. Several researchers suggest that cash holdings of smaller firms are positively related to cash flow variability (Almeida et al. 2004; Han and Qiu 2007; Martínez-Carrascal 2010). Our findings confirm that industry cash flow volatility is positively related to the liquidity ratio and proves to be statistically not significant for larger firms. Τhis result is significant for small firms. In their study, Faulkender (2002) confirmed that large-sized firms should have easier access to external financing than smaller firms. Consequently, large firms are more likely to face lower financial pressure than small firms.
Apart from the constructed SIZE dummy that measures the difference between below and above yearly median firm size, we also test whether the estimated coefficients of cash holdings’ determinants differ significantly across the three-sized subgroupings of the study. Since Equation (1) is estimated independently for small, medium, and large-sized firms, we apply a Wald test to evaluate which of the firms’ characteristics presents a difference sensitivity. The results indicate a statistically significant difference, in some cases, in the firms’ characteristics between subgroups, as illustrated in Figure 4A–C.

6. Additional Analyses

6.1. Ownership, Board Structure, and Cash Holdings

In this subsection, we continue our investigation of the cash holdings’ determinants by focusing on governance characteristics. Previous studies (e.g., Dittmar and Mahrt-Smith 2007; Harford et al. 2008; Ozkan and Ozkan 2004; Pinkowitz et al. 2007; Tong 2010) indicate that corporate governance constitutes a significant determinant for cash holdings. In their study, Kalcheva and Lins (2007) also suggest that family-controlled firms are more likely to hold more cash. Thus, we re-estimate the baseline Equation (1), including specific corporate governance variables. We use cash to total assets as the dependent variable, and we include the same independent variables, namely cash flow to total assets, leverage, net working capital to total assets, firm size, debt maturity structure, capital expenditures to total assets, R&D to total assets, business volatility, market to book ratio, and the opportunity cost of keeping cash. Additionally, we apply industry and year dummy fixed effects. Following Ozkan and Ozkan (2004), we use a cubic functional form in order to examine the association between cash holdings (CASH) and managerial ownership (MAN). Consequently, we measure MAN2 and MAN3 as the square and cube of the percentage of equity ownership by directors (Ozkan and Ozkan 2004). The model is as follows:
C A S H i , t = β 0 + β 1 S I Z E i , t + β 2 C F i , t + β 3 L E V i , t + β 4 N W C i , t + β 5 D E B T M T i , t + β 6 C A P X i , t + β 7 X R D i , t + β 8 I N D S I G M A i , t + β 9 M T B i , t + β 9 R S P R E A D i , t + β 10 M A N i , t + β 11 M A N 2 i , t + β 12 M A N 3 i , t + β 13 M A N x M T B i , t + β 14 M A N 2 x M T B i , t + β 15 M A N 3 x M T B i , t + β 16 C E O _ C O B i , t + β 17 B O A R D N i , t + Y E A R + I N D U S T R Y + ε i , t
In Column (1) of Table 8, we report the impact of the independent variables of the baseline model and the managerial ownership (MAN) on cash holdings. In Column (2), we inspect whether the board size and CEO duality are valid cash holdings’ determinants. In Column (3), we add the interaction between market to book ratio (MTB) and managerial ownership (MAN) to examine the joint effect of the firm’s growth opportunities and managerial discretion on corporate cash holdings. After the inclusion of the corporate governance characteristics, the estimated coefficients of the independent variable are in line with the predicted signs of the baseline model (Table 6). More importantly, we confirm the findings from Ozkan and Ozkan (2004), who argued that managerial ownership accounts for a non-monotonic determinant for cash holdings in the UK market.
The results in Column (1) show that the estimated coefficient of managerial ownership (MAN) is negative and statistically significant at the 5% level. Thus, firms with low managerial ownership are more likely to hold more cash; it is assumed that the interests of senior management and shareholders are aligned at this level. This finding supports the predictions of both the trade-off and the pecking order theory. The relation, however, between MAN2 and CASH is positive and significant at the 5% level. Here, we support the notion that at the middle levels of managerial ownership, firms tend to hold more cash. It seems that when CEOs’ shares in the firm increase, they move from alignment to entrenchment. On the other hand, when we move to higher ownership levels, our findings propose the view that managers become more aligned with the board (MAN3). CEOs are more aligned at higher levels of ownership and are expected to drop cash. Instead, CEOs at middle levels of ownership hold more cash to pursue their agenda at the expense of the firm’s shareholders. Kusnadi (2011) also demonstrated that firms with weak governance hold high cash levels, confirming the agency conflict between managers and minority shareholders. To sum up, our results corroborate a significant non-linear relationship between managerial ownership and cash holdings, of which findings were also put forward by Ozkan and Ozkan (2004).
Column (2) of Table 8 controls for the impact of the average board number (BOARDN) and CEO duality (CEO_COB), as two additional corporate governance variables, on the firms’ cash holdings. The general consensus indicates that a smaller board’s structure and with higher independence leads to better outcomes (Coles et al. 2008). In the CEO case, the literature suggests that top-performing executives are offered the Chairman’s position (Coles and Li 2012a). Gill and Shah (2012) find a positive link between CEO duality and cash holdings for a sample of Canadian firms. Anagnostopoulou (2013) also confirm the relation between the number of shareholders and cash holdings for public firms empirically. Our results, however, indicate no statistical significance for this variable. Thus, board size is not a valid determinant of the firm’s cash holdings. Further, we predict when the total owner is also a CEO, then the propensity of higher cash holdings is increased (CEO_COB). However, we fail to confirm a positive significant relation of the ultimate controllers’ effect on cash holdings in our sample firms. Based on the work of Ozkan and Ozkan (2004), we also investigate whether the effect of managerial ownership (MAN) on corporate cash holdings (CASH) is dependent on growth opportunities, proxied by the market to book ratio (MTB).
Column (3) tabulates the econometric results, which differ from those in Ozkan and Ozkan’s (2004) study. The authors find no significance in the interaction effects between managerial ownership variables and the growth opportunities proxy. In our case, the results confirm a significant negative estimate for low managerial ownership levels (MAN × MTB), a significant positive estimate on middle levels of ownership (MAN2 × MTB), and a significant negative estimate for higher ownership levels (MAN3 × MTB). To conclude, we use the rationale offered by Ozkan and Ozkan (2004), who stated that firms with higher growth opportunities face a lower entrenchment effect or lower agency issues. However, the estimated coefficients of MAN, MAN2, and MAN3 exert no significance on the cash ratio in this specification, and hence, the effect of managerial ownership is still questionable.
To compare our results with Harford et al. (2008), we re-estimate Equation (4) after including lagged cash to assets. The models with lagged cash in Columns (4)–(6) produce robust results on the determinants of cash holdings. The coefficient on lagged cash (L.CASH) is positive and significant, where the dependent variable is cash to assets (CASH). Overall, the results in Table 8 show that SIZE is negative and significant at the 1% level when we use the cash to assets as the dependent variable, confirming that smaller firms hold more cash than larger firms. In addition, we observe that control variables do not have changes in the sign of their coefficients, with the exception of CF that turns to positive. In terms of significance, NWC and RSPREAD in Columns (4)–(6) become statistically significant and insignificant, respectively, when compared to Columns (1)–(3). However, when it comes to the governance characteristics, we find that the coefficients on CEO_COB, BOARDN, and MAN are insignificant after the insertion of lagged cash.

6.2. Cross-Sectional Tests

In this subsection, we implement subsample analyses to evaluate the sensitivity of cash holdings’ determinants under different economic circumstances. First, we examine whether the significance of a firm’s size differs with the degree of industry competition, where the dependent variable is the cash to assets. Similar to Giroud and Mueller (2011), we use the Herfindahl–Hirschman Index (HHΙ) to identify the level of industry competition.10 We calculate HHI as the sum of squares of market shares of each firm in the two-digit SIC industry, where market share equals a firm’s sales, over the two-digit SIC industry. HHI ranges from 0 to 1, where zero (one) represents a perfect competition (single monopolistic condition). In their study, Giroud and Mueller (2011) validate a negative and robust relationship between firm size and Herfindahl index. Other empirical evidence shows a negative and significant link between the Herfindahl Index and corporate cash holdings, implying that corporate cash decreases in highly competitive markets (Lyandres and Palazzo 2016).
The tabulated results in Columns (1) and (2) of Table 9 show that the coefficient on SIZE is negative and significant at the 1% level across industries but higher in firms with above-median levels of competition. Hence, we split the sample using HHI and find that the significance of firm size is stronger in firms within a low industry rivalry environment (above yearly HHI median). These coefficients are significant at the 1% level. In a more competitive environment, the relationship between cash holdings and firm size remains negative but statistically significant at the 10% level. We conclude that the firm size matters more as firms operate in a more concentrated market and that these firms hold more cash to fuel business growth than firms in more competitive industries.
Second, we employ Altman Z-score as a proxy of financial distress and a firm’s age to account for information asymmetries and ease of access to external finance. We use the Altman Z-score model to measure financial distress (Altman 1968), as provided by the Amadeus database. Higher values indicate lower default risk and lower cash holdings, as suggested by the precautionary motive. Almeida et al. (2004) indicated that cash is more valuable for financially constrained firms, while Denis and Sibilkov (2010) argued that some firms facing financial constraints tend to hold low levels of cash. Columns (3) and (4) of Table 10 report and investigate the results on the potential sensitivity of cash policy to financial distress. Specifically, we examine the relevance of firm characteristics for corporate cash holdings for firms facing low and high possibility of financial risk separately. The results suggest that firm size has a significant effect on cash ratio, including other financial characteristics, either for firms in above-median or below the median of Altman Z-score. Our regression results show a significant negative relation between cash flow to assets, financial leverage, firm size, capital expenditures, and cash holdings for the subsample of the financially constrained firms. Our findings corroborate the prior literature, since firms that face financial constraints use generated cash flows to fuel their operations and cash substitutes as a buffer to liquidity issues. On the other hand, financially constrained firms with higher R&D intensity, growth opportunities, and profitability are more likely to increase their cash position. In agreement with the pecking order theory and the trade-off theory, firms—both financially constrained and unconstrained—with higher cash ratios are most likely to prefer to invest their cash holdings (MTB). Earlier related work by Han and Qiu (2007) documents a positive relationship between cash flow volatility and corporate liquidity of financially constrained firms. In our sample, however, the estimated coefficient for the post-crisis time is positive but insignificant.
Third, Columns (5) and (6) report the estimates from Equation (1) for subsamples of young and mature firms. Initially, we predict that the firm’s age is negatively associated with corporate cash holdings. Here, we divide the sample based on the years since the date of foundation; we define as young firms those founded up to five years before 2018, and mature firms for the rest of them. Comparing the two subsamples, we observe that the coefficient on CF/assets is negative and significant only in the group of mature firms. Farinha et al. (2018) suggest that young firms have better earnings quality and higher cash flow, while higher liquidity is related to lower levels of debt and R&D expenses. Moreover, we find that the coefficient on RSPREAD remains positive and significant but only in the group of mature firms. The positive effect of profitability on cash holdings contradicts the trade-off theory, which suggests that profitable firms have efficient cash flow resources to avoid under-investment problems (Ozkan and Ozkan 2004). Notably, we find that a mature firm holds more cash to exploit future growth opportunities (MTB) or invest in R&D projects. Young firms seem to rely more on cash substitutes (NWC) to fund their operations, which is consistent with the premises of the trade-off theory. Industry cash flow volatility is positively correlated to cash ratio both for young and mature firms, which also supports the trade-off theory. The magnitude of the estimate is higher in the case of mature firms (β = 0.282, t-stat = 2.32). Typically, large firms are capable of funding their activities and use cash through their balance statements in order to avoid bankruptcy. However, small firms would face higher constraints as a result of the fiscal crisis and be more reliant on external financing due to a lack of liquidity (Harrison and Widjaja 2013). Moreover, if we take into account all the constraints and difficulties of such times, including the relatively high information asymmetry, our results bear corroborating evidence to both the trade-off theory and the pecking order theory on cash holdings determinants.

6.3. Two-Step System GMM Estimation

Following previous studies (e.g., Ozkan and Ozkan 2004), we use the dynamic panel generalized method of moments (GMM) estimation to address any endogeneity issues. For this purpose, we use the ‘xtabond2’ module of Roodman (2009) in Stata and implement the two-step GMM approach by Arellano and Bover (1995) and Blundell and Bond (1998). Thus, a two-step system GMM panel regression based on Blundell and Bond’ (1998) study to compute the target level of cash holdings and the deviation from the target for each firm-year is employed. The coefficient of ( 1 a ) C A S H i , t 1 captures the speed of adjustment towards a target cash ratio, ranging between 0 and 1.
Table 10 reports the results of the adjustment model of the actual cash ratio at the optimum level, using a two-step system generalized method of moments (GMM) estimator (Blundell and Bond 1998). Columns (1) and (2) report the estimates for the two-step system GMM, with year/industry and year/firm fixed effects, respectively. As reported in Table 10, most of the firm’s characteristics are significant determinants of cash holdings, with the exceptions of MTB and RSPREAD. Table 10 reports a significant first-order serial correlation [AR(1)]. Column (1) reports an average adjustment coefficient of CASH equal to 0.508 (1 − 0.428), or approximately 1.75 years, to correction for the non-financial non-utility UK firms in our sample. Overall, the non-financial non-utility publicly traded UK firms exhibit a speed of adjustment of 50.8%. Instead, the results from the linear regression with a lagged cash ratio indicate a slower speed of adjustment of 27.0% or 3.7 years to correction. Column (1) also reports that the coefficient on SIZE is negative and significant (β = −0.015, t-stat. = −3.54), where the dependent variable is cash to assets. We include the same set of variables as in the baseline regression, with year and industry fixed effects. Column (2) also reports a negative and significant coefficient on SIZE (β = −0.016, t-stat. = −7.27) including year and firm fixed effects, which suggests that the effect of firm size on corporate cash holdings is robust after using the GMM estimator.

6.4. Analysis in Alternative Periods

In Table 11, we measure the sensitivity of our results by dividing the sample into three subsequent subperiods. The first period includes the years 2010–2012, the second period covers the years from 2013 to 2015, and as the last time period, we define the years from 2016–2018. As expected, the firm’s size (SIZE) is significantly and negatively related to cash holdings (CASH). The magnitude of the estimate is higher for the latter years of the analysis (β = −0.016, t-stat = −6.14). In a post-crisis period, information asymmetry is present, and along with the difficulties of both internal and external financing, it may explain the inverse relationship between cash holdings and firm size. The negative relationship between size variable (SIZE) and cash holdings (CASH) designates that cash increases when firm size declines. This finding supports the trade-off theory and applies to all subperiods of our empirical analysis. Indeed, Faulkender (2002) notes the strong effect of size as a determining factor of cash behavior due to higher levels of information asymmetry complications.
Moreover, the analysis indicates that leverage and capital expenditures are negatively related to cash holdings in all three subperiods. In line with Bates et al. (2009) and Ozkan and Ozkan (2004), we confirm that firms with higher debt to total asset ratio hold low cash. However, while the trade-off theory predicts the negative impact of cash flow on cash holdings, it contradicts with the pecking order theory (Ferreira and Vilela 2004). Financial leverage is negatively related to cash ratio and is of great significance in all periods. Furthermore, highly leveraged firms hold less cash, which is consistent with the pecking order theory. On the other hand, growth opportunities, proxied by the market to book ratio and R&D expenses to total assets, have a positive relationship with cash ratio.
In Column (3), the signs and magnitudes of MTB and RSPREAD confirm this notion, since the higher growth opportunities and profitability induce firms to increase their cash position for 2016–2018. A notable difference from the primary analysis is that the estimate of cash flows to total assets (CF) is negative and significant only for the period 2016–2018. More interestingly, the results do not support a relation between net working capital (NWC), debt maturity structure (DEBTMT), and industry volatility of cash flows (INDSIGMA). Our results corroborate previous findings, and both the theories of trade-off and pecking order models are supported. Most importantly, similarly to Le et al. (2018), we find that the firm size’s estimate is negative and significant in all specifications, thus, confirming its importance in cash policy.

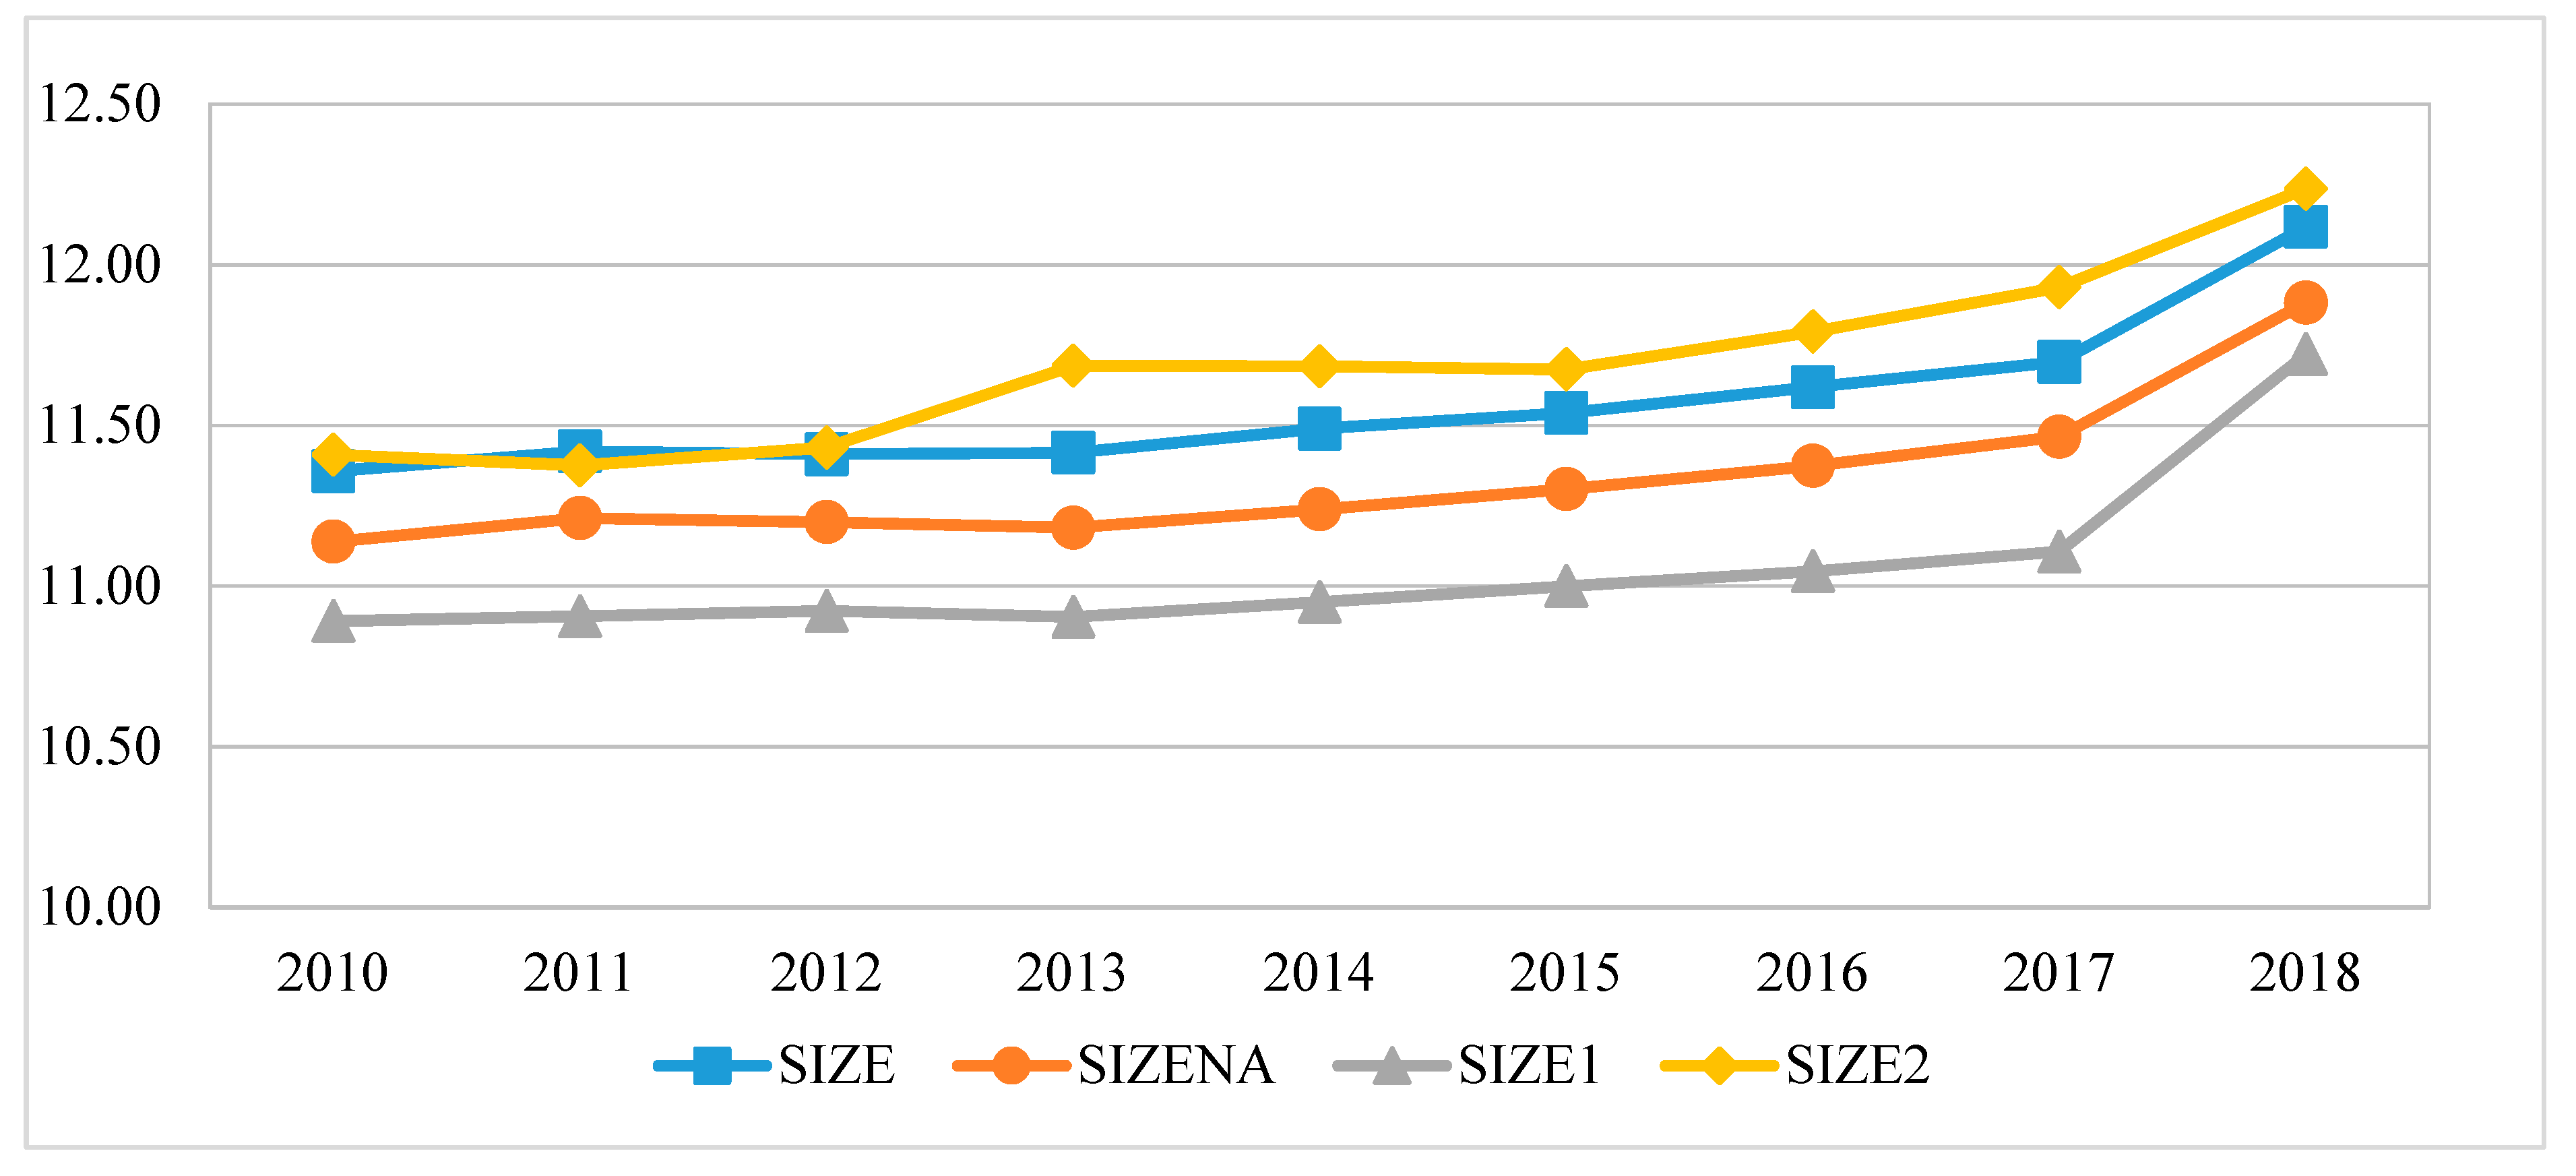
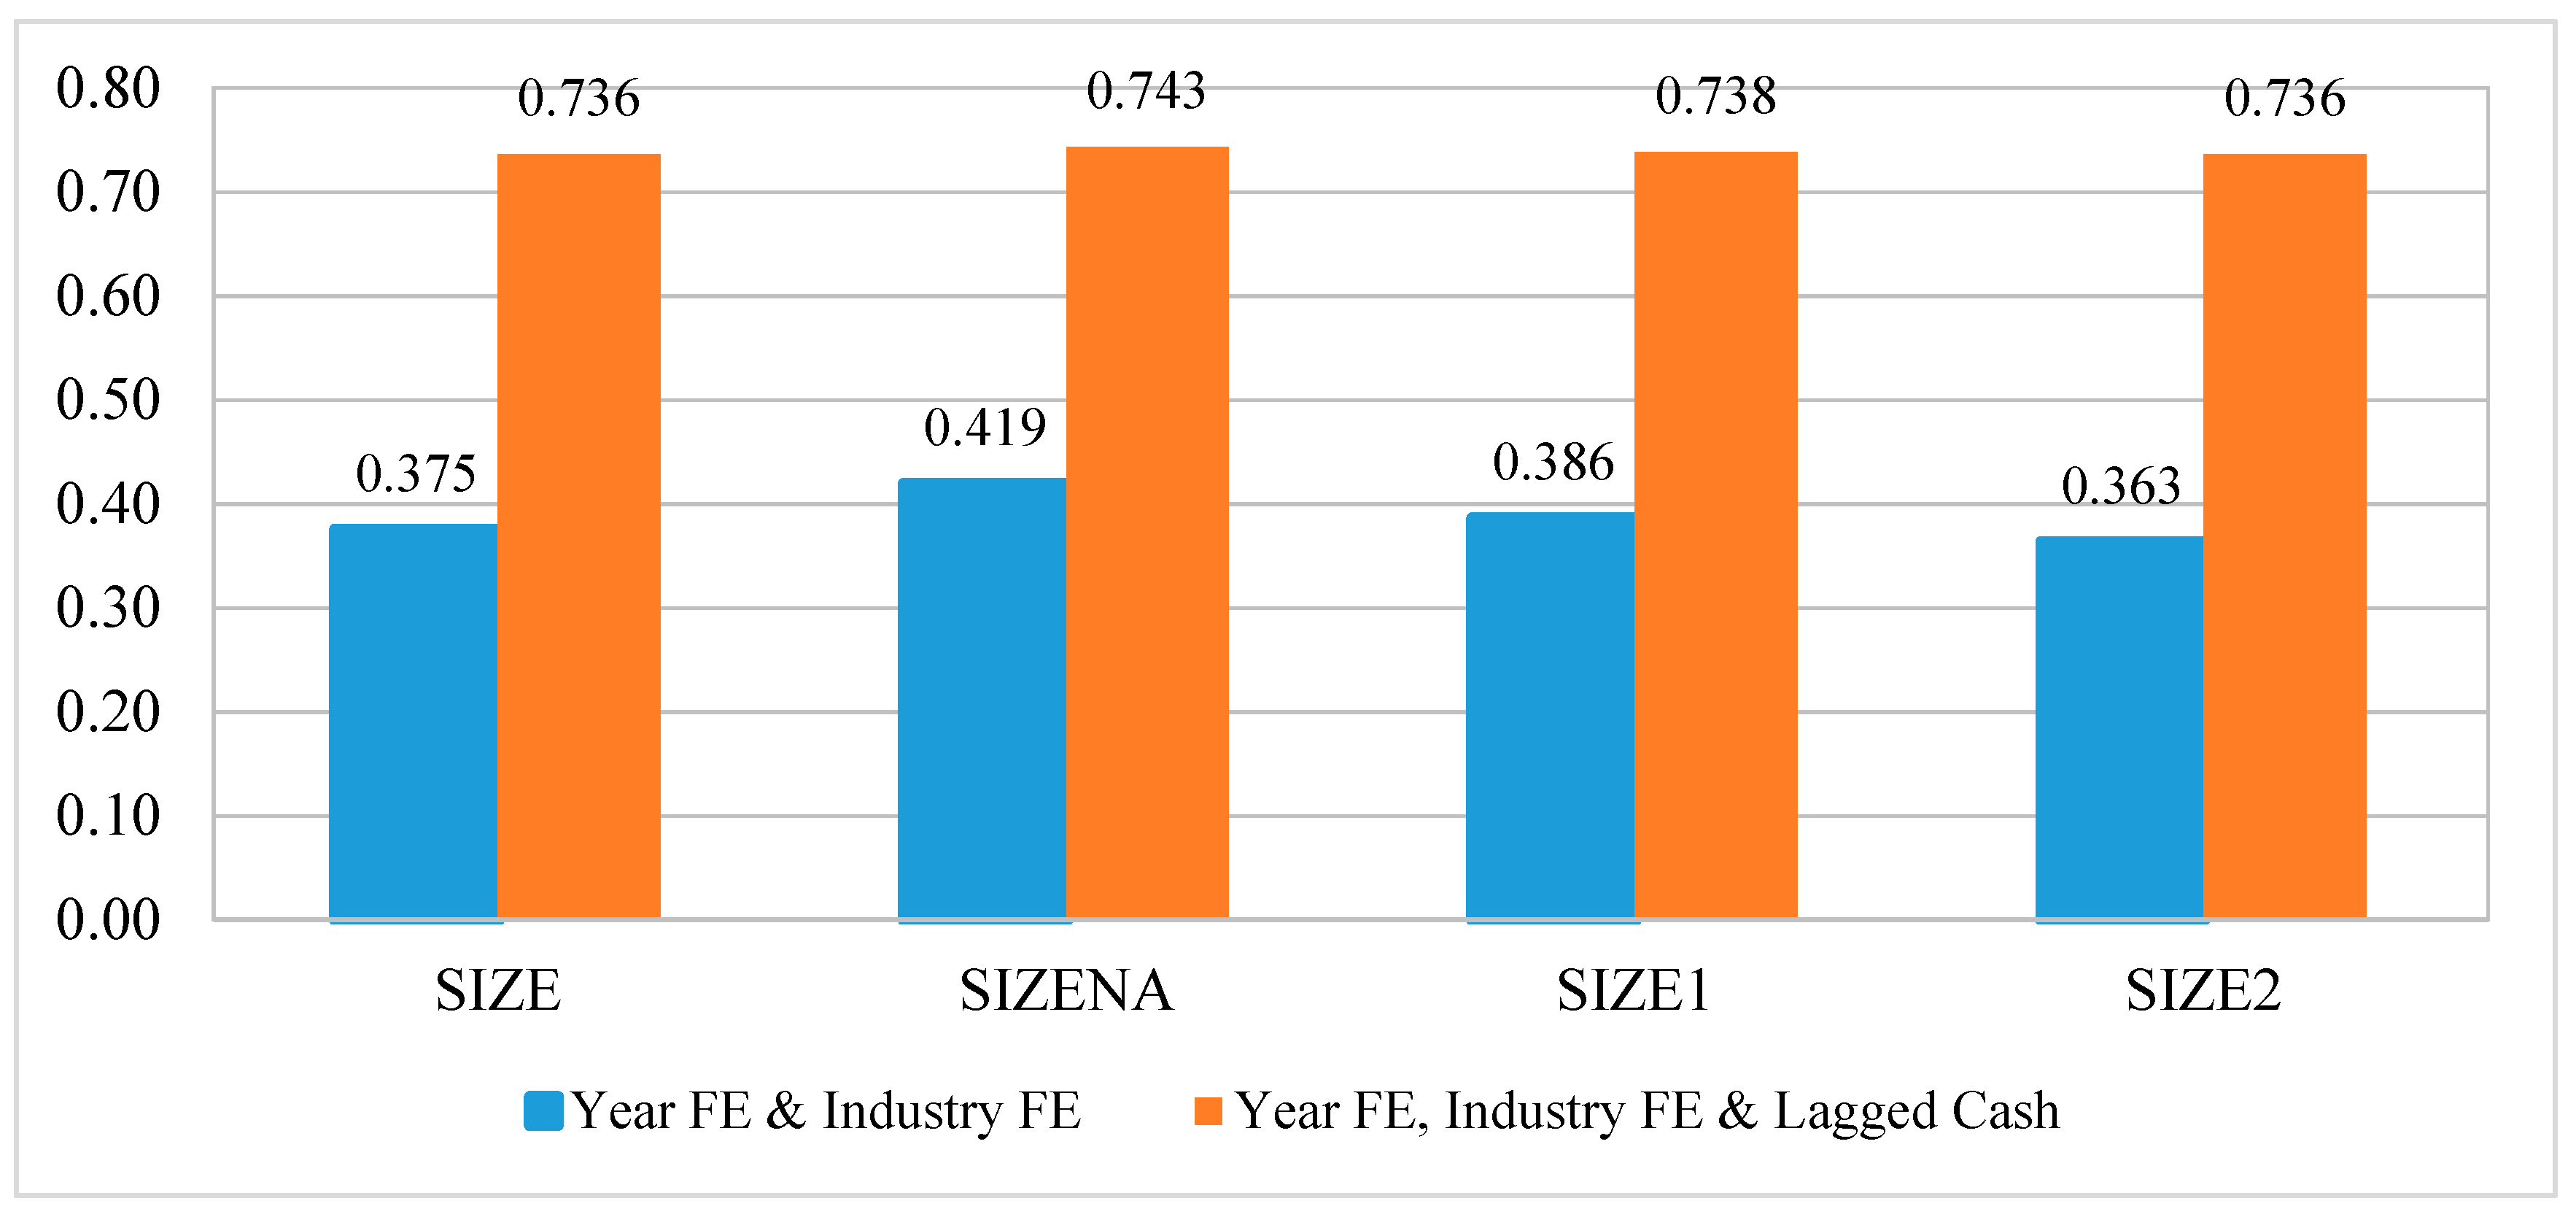
6.5. Different Firm Size Proxies

Motivated by the evidence in Dang et al. (2018), we perform a robustness test to examine the sensitivity of our main findings to alternative measurements of our research variable, firm size. Table 12 shows that across each of the specifications, firm size is significantly and negatively associated with cash holdings. While the coefficient magnitudes are not comparable across regressions due to the different dependent variables, the t-statistics range from −4.10 to −10.49, with significance at the 1% level. From an empirical perspective, the analysis indicates that firm size has a significant impact on a firm’s cash holdings. In general, the control variables are consistent with the main regression results. Thus, we confirm that our first inferences remain unchanged.
Following Dang et al. (2018), we also show the descriptive statistics for different size measures to capture different aspects of a firm’s size over our testing period in Appendix B. Appendix B also shows the time series of the three different firm size measures. Figure A1 is expressed in logarithm form and Figure A2 in the original form (£ millions). We observe that the average value of equity decreased from 2013 to 2015, while all measures increased significantly from 2017 to 2018. Further, Figure A3 shows the goodness of fit in the specifications of cash holding regressions. For each specification, we apply OLS regressions with year and industry fixed effects. The values of adjusted R2 are adopted from Table 6 and Table 12 for SIZE and alternative size measures (SIZENA, SIZE1, SIZE2), respectively. Figure A3 of Appendix B depicts that the explanatory variables, industry fixed effects, and year fixed effects, included in the regression explain more than 36.3% of cash holdings’ variation. Adding one-year lagged cash increases significantly adjusted R2, which now ranges from 73.6% to 74.3%. These results are consistent with the adjusted R2 reported in Harford et al. (2008).

7. Conclusions

We study the financial determinants of cash holdings for listed firms, using data from 2010 to 2018. We conjecture that a smaller firm size leads to higher cash holdings, reflected in lower effective tax rates. More importantly, we offer a different perspective regarding the drivers of corporate cash holdings by emphasizing the significance of firm size in the UK. To address our goal, we evaluate the differences in the relationship between corporate liquidity ratio and its determinants for firms of three different size groups, namely small, medium, and large firms. Our results show a negative relationship between cash holdings and size, which provides support to the trade-off argument but contradicts the pecking order theory. Initially, we argue that effective cash management is a necessity for any firm, regardless of its size. In other words, both large firms with complex liquidity issues and small firms with higher financial limitations need to identify the optimal cash ratio in their balances. However, the study provides empirical evidence that corporate cash policies fluctuate due to different sizes, which is likely to be associated with their ease of access to capital markets. We confirm that the cash holding decision of larger firms depends to a lesser degree on precautionary motives relative to small and medium firms.
For the whole period of the empirical analysis, we observe that cash holdings increase with market to book ratio, R&D expenditures, the opportunity cost of holding cash, and industry cash flow volatility. However, the cash ratio decreases when cash flow to assets, leverage, capital expenditures, net working capital, and firm size increase. Further, we find that the cash ratio of small firms is more reliant on cash flow and growth opportunities than those of medium and large firms. Additionally, the evidence suggests that the investment opportunities of smaller firms could be more challenging than those of larger firms due to their limited access to external funds. Based on the evidence, we assert that both the trade-off and pecking order theories have explanatory power on corporate cash holdings in the UK case. One of our main findings is also a significant cubic relationship between ownership and cash holdings, which highlights the important role of corporate governance on cash decisions. Further analyses suggest that a firm’s higher growth opportunities moderate the effect of managerial ownership on cash ratio. Moreover, we find that the association between firm size and cash holdings is stronger for mature, with strong balance sheets, and low industry rivalry firms. To deal with endogeneity, we employ both LDV models and a two-step system GMM approach and our findings remain robust. We also run various additional tests including alternative measures of firm size, and alternative periods, which support our main findings.
Overall, this study aims to contribute to the literature on corporate cash holdings of non-financial firms. First, we provide strong evidence on precautionary and transaction motives for the UK firms; however, firms also prefer internal funds to external financing, which corroborates the pecking order model. Second, the study justifies the assertion that firm size has a significant effect on cash holding decision. We confirm that the firm’s size differentiates greatly the way that firms formulate their cash policy considering the information asymmetries, economies of scale, and financial constraints. Third, we validate the existence of agency costs and confirm the significant effect of managerial ownership on cash holdings. Overall, we present empirical proof on the implications of cash holdings during the post-crisis period. Firms with higher uncertainty regarding their cash flows often hold more cash as a buffer from shocks; therefore, different policies could be implemented to reduce the amount of corporate cash based on the firm’s size. However, this paper comes with several limitations. One obvious limitation of this work is the exclusion of unlisted companies from the sample. Another potential weakness is the failure to address how other factors and macroeconomic conditions, such as inflation and unemployment, affect cash holdings. Due to data limitations, we do not investigate the role of managerial characteristics, such as reputation or charisma, among others. Several studies (see Coles and Li 2012b; Core and Guay 1999; Coles et al. 2006) suggest that managerial heterogeneity and CEO compensation level have significant power to explain firm policies and outcomes. Accordingly, future research should capture the relative importance of manager-specific traits that determine firms’ cash policies. Hopefully, this study presents useful insights to managers, shareholders, and investors.

Author Contributions

Conceptualization, E.M. and K.G.; methodology, E.M. and K.G..; software, E.M. and K.G.; validation, E.M. and K.G..; formal analysis, E.M. and K.G.; investigation, E.M. and K.G.; resources, E.M. and K.G.; data curation, E.M. and K.G.; writing—original draft preparation, E.M. and K.G.; writing—review and editing, E.M. and K.G.; visualization, E.M. and K.G.; supervision A.T. and C.S. All authors have read and agreed to the published version of the manuscript.

Funding

This research received no external funding.

Acknowledgments

We are grateful to the editor and two anonymous referees for their useful comments and suggestions.

Conflicts of Interest

The authors declare no conflict of interest.

Appendix A

Table A1. Variable Definition.
NameDefinition
CASHCash and cash equivalents to total assets;
SIZENatural logarithm of total assets
CFCash flow (pre-tax profits + depreciation + amortization) scaled by total sales
LEVTotal debt (short-term debt + long-term debt) to total assets
NWCCurrent assets−current liabilities−cash and cash equivalents to total assets
DEBTMTLong-term debt to total liabilities
CAPEXChange of fixed assets plus depreciation and amortization to total assets
XRDRatio of research and development expenses to sales
INDSIGMAMean of Σ(CF/total assets) for firms in the same industry
MTBTotal assets−common shareholders equity-market capitalization fiscal period end scaled by total assets
RSPREADGross operating profit/assets−interest rate 1-Yr T-Bills
INTInterest rate 1-Yr T-Bills
GDPGRGross Domestic Product (GDP) percentage change on previous year
MANTotal percentage of equity ownership by company directors
BOARDNBNumber of the members of the board
CEO_COBDummy variable which takes a value of 1 if the positions of the CEO and the COB are held by the same individual and 0 otherwise
L.CASHLagged cash and cash equivalents to total assets
SIZEDUMMYBinary variable, which takes the value one (zero) for firms where SIZE is above (below) the sample’s median
SMALLvsLARGEBinary variable, which takes the value one for large firms (SIZE ≥ p75) and zero for small firms (SIZE ≤ p25)
MEDIUMvsLARGEBinary variable, which takes the value one for large firms (SIZE ≥ p75) and zero for medium firms (p25 < SIZE < p75)
HHIHerfindahl-Hirschman Index computed using firm sales for each three-digit industry codes for every year in the sample. First, the sales ratio is computed by dividing sales of each firm to the total sales in the 3-digit code industry. Second, HHI is computed as the sum of the squares of the ratio for all firms in the same industry
ALTMANAltman’s Z-Score provided by the Amadeus database
AGEYears since the date of foundation
SIZENANatural logarithm of total assets minus cash and cash equivalents
SIZE1Natural logarithm of total firm sales
SIZE2Natural logarithm of market value of equity
Note: Data items used for the variables in the models are downloaded from the Amadeus database.

Appendix B

Table A2. Firm Size Measures for Firm’s Cash Holdings Regression.
Panel A: Summary Statistics
MeanStd. Dev.MinMaxN
ASSETS (mil. £)2477.45914,505.0459.990332,160.9926629
NET_ASSETS (mil. £)1609.5436056.6850.01145,904.0006629
SALES (mil. £)1257.5014294.1220.01230,758.0006629
MVE (mil. £)1957.8648128.5790.000115,094.4966024
SIZE11.5402.4404.89217.6456629
SIZENA11.3092.5833.49717.5826629
SIZE111.0182.8962.48517.2426629
SIZE211.6812.3996.73217.5666024
Panel B: Correlation
V1V2V3V4V5V6V7V8
V1: ASSETS10.993 ***0.917 ***0.914 ***1.000 ***0.993 ***0.917 ***0.915 ***
V2: NET_ASSETS0.794 ***10.921 ***0.893 ***0.993 ***1.000 ***0.921 ***0.893 ***
V3: SALES0.756 ***0.920 ***10.845 ***0.917 ***0.921 ***1.000 ***0.845 ***
V4: MVE0.833 ***0.866 ***0.818 ***10.914 ***0.893 ***0.845 ***1.000 ***
V5: SIZE0.367 ***0.535 ***0.551 ***0.468 ***10.993 ***0.917 ***0.915 ***
V6: SIZENA0.357 ***0.521 ***0.537 ***0.454 ***0.991 ***10.921 ***0.893 ***
V7: SIZE10.312 ***0.453 ***0.503 ***0.401 ***0.886 ***0.893 ***10.845 ***
V8: SIZE20.361 ***0.518 ***0.538 ***0.479 ***0.919 ***0.895 ***0.809 ***1
Note: This table presents summary statistics and correlation matrix of firm size measures that we use for the regressions of cash holdings. “ASSETS”, “NET_ASSETS”, “SALES”, and “MVE” denote respectively sample firms’ total assets, total assets minus cash and cash equivalents, total sales, and market value of equity. All variables are defined in Appendix A. The data are for the fiscal years 2010–2018.
Figure A1. The trends of firm size measures (in logarithm terms). Note: This figure provides the time series of the average firm size measures in logarithm terms for all the firms in the sample data.
Jrfm 13 00163 g0a1
Figure A2. The trends of firm size measures (in original terms). Note: This figure provides the time series of the average firm size measures in original terms (£ Millions) for all the firms in the sample data.
Jrfm 13 00163 g0a2
Figure A3. Adjusted R Squared values for alternative firm size measures. Note: This figure shows the goodness of fit when we employ different measures of firm size in the cash holdings regressions (adopted from Table 6 and Table 12 for the main research variable SIZE, and alternative measures, respectively).
Jrfm 13 00163 g0a3

Appendix C

To overcome potential issues regarding the validity of our empirical study, we run power calculations to determine the sample size for the linear regression model (Dupont and Plummer 1998). According to Cochran (1977), a large sample suggests a waste of resources, while a small sample compromises the findings’ legitimacy. However, Sathian et al. (2010) indicate that the detection of sample size is a challenging process for any scientific research; sufficient sample size is a crucial factor in drawing valid conclusions (Singh and Masuku 2014). In the sample size calculations, we assume that the sample would have 95% reliability about population and a sampling error of 5%. The calculations show that a sample size of N = 255 is required for the exact approach to attain the target power 0.9, with the significance level α = 0.05. Consequently, we confirm that the actual sample size of the study is adequate to achieve results with the desired power and significance. For the implementation, we use the Stata modules samsi_reg (Mander 2005) and powercal (Newson 2004).

References

  1. Acharya, Viral V., Heitor Almeida, and Murillo Campello. 2007. Is cash negative debt? A hedging perspective on corporate financial policies. Journal of Financial Intermediation 16: 515–54. [Google Scholar] [CrossRef] [Green Version]
  2. Almeida, Heitor, Murillo Campello, and Michael S. Weisbach. 2004. The cash flow sensitivity of cash. Journal of Finance 59: 1777–804. [Google Scholar] [CrossRef]
  3. Al-Najjar, Basil. 2015. The effect of governance mechanisms on small and medium-sized enterprise cash holdings: Evidence from the United Kingdom. Journal of Small Business Management 53: 303–20. [Google Scholar] [CrossRef] [Green Version]
  4. Al-Najjar, Basil, and Yacine Belghitar. 2011. Corporate cash holdings and dividend payments: Evidence from simultaneous analysis. Managerial and Decision Economics 32: 231–41. [Google Scholar] [CrossRef]
  5. Al-Najjar, Basil, and Ephraim Clark. 2017. Corporate governance and cash holdings in MENA: Evidence from internal and external governance practices. Research in International Business and Finance 39: 1–12. [Google Scholar] [CrossRef] [Green Version]
  6. Altman, Edward I. 1968. Financial ratios, discriminant analysis and the prediction of corporate bankruptcy. The Journal of Finance 23: 589–609. [Google Scholar] [CrossRef]
  7. Anagnostopoulou, Seraina C. 2013. Cash holdings: Determining factors and impact on future operating performance for listed versus unlisted firms. Review of Pacific Basin Financial Markets and Policies 16: 1350013. [Google Scholar] [CrossRef]
  8. Anand, Lalita M. Thenmozhi, Nikhil Varaiya, and Saumitra Bhadhuri. 2018. Impact of macroeconomic factors on cash holdings?: A dynamic panel model. Journal of Emerging Market Finance 17: S27–S53. [Google Scholar] [CrossRef]
  9. Arellano, Manuel, and Olympia Bover. 1995. Another look at the instrumental variable estimation of error-components models. Journal of Econometrics 68: 29–51. [Google Scholar] [CrossRef] [Green Version]
  10. Bates, Thomas W., Kathleen M. Kahle, and René M. Stulz. 2009. Why do U.S. firms hold so much than they used to? Journal of Finance 64: 1985–2021. [Google Scholar] [CrossRef] [Green Version]
  11. Baumol, William J. 1952. The transactions demand for cash: An inventory theoretic approach. Quarterly Journal of Economics 66: 545–66. [Google Scholar] [CrossRef]
  12. Beck, Thorsten, Asli DemirgüÇ-Kunt, and Vojislav Maksimovic. 2005. Financial and legal constraints to growth: Does firm size matter? The Journal of Finance 60: 137–77. [Google Scholar] [CrossRef]
  13. Bigelli, Marco, and Javier Sánchez-Vidal. 2012. Cash holdings in private firms. Journal of Banking & Finance 36: 26–35. [Google Scholar] [CrossRef]
  14. Blundell, Richard, and Stephen Bond. 1998. Initial conditions and moment restrictions in dynamic panel data models. Journal of Econometrics 87: 115–43. [Google Scholar] [CrossRef] [Green Version]
  15. Bougheas, Spiros, Paul Mizen, and Cihan Yalcin. 2006. Access to external finance: theory and evidence on the impact of monetary policy and firm-specific characteristics. Journal of Banking and Finance 30: 199–227. [Google Scholar] [CrossRef]
  16. Bradley, Michael, Gregg A. Jarrell, and E. Han Kim. 1984. On the existence of an optimal capital structure: Theory and evidence. Journal of Finance 39: 857. [Google Scholar] [CrossRef]
  17. Brick, Ivan E., and Rose C. Liao. 2017. The joint determinants of cash holdings and debt maturity: the case for financial constraints. Review of Quantitative Finance and Accounting 48: 597–641. [Google Scholar] [CrossRef]
  18. Chamberlain, Gary. 1984. Chapter 22 Panel data. Handbook of Econometrics 2: 1247–318. [Google Scholar] [CrossRef]
  19. Chen, Yenn-Ru, and Wei-Tin Chuang. 2009. Alignment or entrenchment? Corporate governance and cash holdings in growing firms. Journal of Business Research 62: 1200–6. [Google Scholar] [CrossRef]
  20. Chung, Kee H., Jang-Chul Kim, Young Sang Kim, and Hao Zhang. 2015. Information asymmetry and corporate cash holdings. Journal of Business Finance & Accounting 42: 1341–77. [Google Scholar] [CrossRef]
  21. Cochran, William G. 1977. Sampling Techniques, 3rd ed. New York: John Wiley & Sons. [Google Scholar]
  22. Coles, Jeffrey L., and Zhichuan (Frank) Li. 2012a. An empirical assessment of empirical corporate finance. SSRN Electronic Journal. [Google Scholar] [CrossRef] [Green Version]
  23. Coles, Jeffrey L., and Zhichuan (Frank) Li. 2012b. Managerial attributes, incentives, and performance. SSRN Electronic Journal. [Google Scholar] [CrossRef]
  24. Coles, Jeffrey L., Naveen D. Daniel, and Lalitha Naveen. 2006. Managerial incentives and risk taking. Journal of Financial Economics 79: 431–68. [Google Scholar] [CrossRef]
  25. Coles, Jeffrey L., Naveen D. Daniel, and Lalitha Naveen. 2008. Boards: does one size fit all? Journal of Financial Economics 87: 329–56. [Google Scholar] [CrossRef] [Green Version]
  26. Core, John, and Wayne Guay. 1999. The use of equity grants to manage optimal equity incentive levels. Journal of Accounting and Economics 28: 151–84. [Google Scholar] [CrossRef] [Green Version]
  27. Damodaran, Aswath. 2005. Dealing with cash, cross holdings and other non-operating assets: Approaches and implications. Stern School of Business, 1–55. [Google Scholar] [CrossRef] [Green Version]
  28. Dang, Chongyu, Zhichuan (Frank) Li, and Chen Yang. 2018. Measuring firm size in empirical corporate finance. Journal of Banking & Finance 86: 159–76. [Google Scholar] [CrossRef]
  29. Denis, Diane K., and John J. McConnell. 2003. International corporate governance. Journal of Financial and Quantitative Analysis 38: 1–36. [Google Scholar] [CrossRef]
  30. Denis, David J., and Valeriy Sibilkov. 2010. Financial constraints, investment, and the value of cash holdings. Review of Financial Studies 23: 247–69. [Google Scholar] [CrossRef] [Green Version]
  31. Dittmar, Amy, and Jan Mahrt-Smith. 2007. Corporate governance and the value of cash holdings. Journal of Financial Economics 83: 599–634. [Google Scholar] [CrossRef]
  32. Dittmar, Amy, Jan Mahrt-Smith, and Henri Servaes. 2003. International corporate governance and corporate cash holdings. Journal of Financial and Quantitative Analysis 38: 111–33. [Google Scholar] [CrossRef]
  33. Driver, Ciaran, and Jair Muñoz-Bugarin. 2019. Financial constraints on investment: Effects of firm size and the financial crisis. Research in International Business and Finance 47: 441–57. [Google Scholar] [CrossRef]
  34. Drobetz, Wolfgang, and Matthias C. Grüninger. 2007. Corporate cash holdings: Evidence from Switzerland. Financial Markets and Portfolio Management 21: 293–324. [Google Scholar] [CrossRef] [Green Version]
  35. Duchin, Ran. 2010. Cash holdings and corporate diversification. The Journal of Finance 65: 955–92. [Google Scholar] [CrossRef]
  36. Dupont, William D., and Walton D. Plummer. 1998. Power and sample size calculations for studies involving linear regression. Controlled Clinical Trials 19: 589–601. [Google Scholar] [CrossRef]
  37. Elyasiani, Elyas, and Lin Zhang. 2015. CEO entrenchment and corporate liquidity management. Journal of Banking and Finance 54: 115–28. [Google Scholar] [CrossRef]
  38. Fama, Eugene F., and Michael C. Jensen. 1983. Agency problems and residual claims. The Journal of Law and Economics 26: 327. [Google Scholar] [CrossRef]
  39. Fama, Eugene F., and James D. MacBeth. 1973. Risk, return, and equilibrium: Empirical tests. Journal of Political Economy 81: 607–36. [Google Scholar] [CrossRef]
  40. Farinha, Jorge, Cesario Mateus, and Nuno Soares. 2018. Cash holdings and earnings quality: Evidence from the main and alternative UK markets. International Review of Financial Analysis 56: 238–52. [Google Scholar] [CrossRef]
  41. Faulkender, Michael W. 2002. Cash holdings among small businesses. SSRN Electronic Journal. [Google Scholar] [CrossRef] [Green Version]
  42. Ferreira, Miguel A., and Antonio S. Vilela. 2004. Why do firms hold cash? Evidence from EMU countries. European Financial Management 10: 295–319. [Google Scholar] [CrossRef]
  43. García-Teruel, Pedro J., and Pedro Martínez-Solano. 2008. On the determinants of SME cash holdings: Evidence from Spain. Journal of Business Finance and Accounting 35: 127–49. [Google Scholar] [CrossRef]
  44. Gill, Amarjit, and Charul Shah. 2012. Determinants of corporate cash holdings: Evidence from Canada. International Journal of Economics and Finance 4: 70–79. [Google Scholar] [CrossRef]
  45. Giroud, Xavier, and Holger M. Mueller. 2011. Corporate Governance, Product Market Competition, and Equity Prices. The Journal of Finance 66: 563–600. [Google Scholar] [CrossRef] [Green Version]
  46. Han, Seungjin, and Jiaping Qiu. 2007. Corporate precautionary cash holdings. Journal of Corporate Finance 13: 43–57. [Google Scholar] [CrossRef]
  47. Harford, Jarrad. 1999. Corporate cash holdings and acquisitions. The Journal of Finance 54: 1969–97. [Google Scholar] [CrossRef]
  48. Harford, Jarrad, Sattar A. Mansi, and William F. Maxwell. 2008. Corporate governance and firm cash holdings in the US. Journal of Financial Economics 87: 535–55. [Google Scholar] [CrossRef]
  49. Harford, Jarrad, Sandy Klasa, and William F. Maxwell. 2014. Refinancing risk and cash holdings. Journal of Finance 69: 975–1012. [Google Scholar] [CrossRef]
  50. Harrison, Barry, and Theodorus W. Widjaja. 2013. Did the financial crisis impact on the capital structure of firms? Discussion Papers in Economics 5: 1–45. [Google Scholar]
  51. Jensen, Michael C. 1986. Agency costs of free cash flow, corporate finance, and takeovers. American Economic Review 76: 323–29. [Google Scholar] [CrossRef]
  52. Kalcheva, Ivalina, and Karl V. Lins. 2007. International evidence on cash holdings and expected managerial agency problems. Review of Financial Studies 20: 1087–112. [Google Scholar] [CrossRef]
  53. Keele, Luke, and Nathan J. Kelly. 2006. Dynamic models for dynamic theories: The ins and outs of lagged dependent variables. Political Analysis. [Google Scholar] [CrossRef]
  54. Kilincarslan, Erhan. 2019. Smoothed or not smoothed: The impact of the 2008 global financial crisis on dividend stability in the UK. Finance Research Letters, 101423. [Google Scholar] [CrossRef]
  55. Kim, Chang-Soo, David C. Mauer, and Ann E. Sherman. 1998. The determinants of corporate liquidity: Theory and evidence. Journal of Financial and Quantitative Analysis 33: 335–59. [Google Scholar] [CrossRef]
  56. Kraus, Alan, and Robert H. Litzenberger. 1973. A state-preference model of optimal financial leverage. Journal of Finance 28: 911–22. [Google Scholar] [CrossRef]
  57. Kusnadi, Yuanto. 2011. Do corporate governance mechanisms matter for cash holdings and firm value? Pacific-Basin Finance Journal 19: 554–70. [Google Scholar] [CrossRef]
  58. Lawrenz, Jochen, and Julia Oberndorfer. 2018. Firm size effects in trade credit supply and demand. Journal of Banking & Finance 93: 1–20. [Google Scholar] [CrossRef]
  59. Le, Duc H., Phi L. Tran, Thu P. Ta, and Duy M. Vu. 2018. Determinants of corporate cash holding: evidence from UK listed firms. Business and Economic Horizons 14: 561–69. [Google Scholar] [CrossRef]
  60. Lyandres, Evgeny, and Berardino Palazzo. 2016. Cash holdings, competition, and innovation. Journal of Financial and Quantitative Analysis 51: 1823–61. [Google Scholar] [CrossRef] [Green Version]
  61. Macmillan, Iain, Sriram Prakash, and Russell Shoult. 2014. The Cash Paradox: How Record Cash Reserves Are Influencing Corporate Behaviour. Available online: https://www2.deloitte.com/content/dam/Deloitte/uk/Documents/corporate-finance/deloitte-uk-cash-paradox-jan-14.pdf (accessed on 19 August 2019).
  62. Mander, Adrian. 2005. Sampsi_reg: Stata Module to Calculate the Sample Size/Power for Linear Regression. Available online: https://ideas.repec.org/c/boc/bocode/s456418.html (accessed on 16 November 2019).
  63. Martínez-Carrascal, Carmen. 2010. Cash holdings, firm size and access to external finance. Evidence for the euro area. Banco de Espana Working Paper Series 1034: 6–29. [Google Scholar] [CrossRef] [Green Version]
  64. Miller, Merton H., and Daniel Orr. 1966. A model of the demand for money by firms. The Quarterly Journal of Economics 80: 413–35. [Google Scholar] [CrossRef]
  65. Modigliani, Franco, and Merton H. Miller. 1958. The cost of capital, corporation finance and the theory of investment. The American Economic Review XLVII: 261–97. [Google Scholar]
  66. Myers, Stewart C. 1977. Determinants of corporate borrowing. Journal of Financial Economics 5: 147–75. [Google Scholar] [CrossRef] [Green Version]
  67. Myers, Stewart C., and Nicholas S. Majluf. 1984. Corporate financing and investment decisions when firms have information that investors do not have. Journal of Financial Economics 13: 187–221. [Google Scholar] [CrossRef] [Green Version]
  68. Neamtiu, Monica, Nemit Shroff, Hal D. White, and Christopher D. Williams. 2014. The impact of ambiguity on managerial investment and cash holdings. Journal of Business Finance and Accounting. [Google Scholar] [CrossRef]
  69. Newson, Roger. 2004. Generalized power calculations for generalized linear models and more. Stata Journal 4: 379–401. [Google Scholar] [CrossRef] [Green Version]
  70. Nickell, Stephen. 1981. Biases in dynamic panel models with fixed effects. Econometrica 49: 1417–26. [Google Scholar] [CrossRef]
  71. O’Sullivan, Mark, Matt Crane, Jenny Shutt, and Dan Georgescu. 2016. The UK’s Cash Conundrum Business Consulting. Available online: https://www.grantthornton.co.uk/globalassets/1.-member-firms/united-kingdom/pdf/publication/2016/working-capital-report-digital.pdf (accessed on 19 August 2019).
  72. Oler, Derek, and Marc Picconi. 2014. Implications of insufficient and excess cash for future performance. Contemporary Accounting Research 31: 253–83. [Google Scholar] [CrossRef]
  73. Ongsakul, Viput, Sirimon Treepongkaruna, Pornsit Jiraporn, and Ali Uyar. 2020. Do firms adjust corporate governance in response to economic policy uncertainty? Evidence from board size. Finance Research Letters. [Google Scholar] [CrossRef]
  74. Opler, Tim, Lee Pinkowitz, René Stulz, and Rohan Williamson. 1999. The determinants and implications of corporate cash holdings. Journal of Financial Economics 52: 3–46. [Google Scholar] [CrossRef] [Green Version]
  75. Orlova, Svetlana V., and Ramesh P. Rao. 2018. Cash holdings speed of adjustment. International Review of Economics and Finance 54: 1–14. [Google Scholar] [CrossRef]
  76. Ozkan, Aydin, and Neslihan Ozkan. 2004. Corporate cash holdings: An empirical investigation of UK companies. Journal of Banking and Finance 28: 2103–34. [Google Scholar] [CrossRef]
  77. Pereira Alves, Paulo F., and Francisco Morais. 2018. Cash holdings are increasing and financial crisis strengths it. SSRN Electronic Journal. [Google Scholar] [CrossRef]
  78. Pinkowitz, Lee, Rohan Williamson, and René M. Stulz. 2007. Cash holdings, dividend policy, and corporate governance: A cross-country analysis. Journal of Applied Corporate Finance 19: 81–87. [Google Scholar] [CrossRef]
  79. Rajan, Raghuram G., and Luigi Zingales. 1995. What do we know about capital structure? Some evidence from international data. The Journal of Finance 50: 1421–60. [Google Scholar] [CrossRef]
  80. Riddick, Leigh A., and Toni M. Whited. 2009. The corporate propensity to save. The Journal of Finance 64: 1729–66. [Google Scholar] [CrossRef]
  81. Roodman, David. 2009. How to do xtabond2: An introduction to difference and system GMM in stata. Stata Journal 9: 86–136. [Google Scholar] [CrossRef] [Green Version]
  82. Sathian, Brijesh, Jayadevan Sreedharan, Suresh N. Baboo, Krishna Sharan, E. S. Abhilash, and E. Rajesh. 2010. Relevance of sample size determination in medical research. Nepal Journal of Epidemiology 1: 4–10. [Google Scholar] [CrossRef]
  83. Singh, Ajay S., and Micah B. Masuku. 2014. Sampling techniques and determination of sample size in applied statistics research: An overview. International Journal of Economics, Commerce and Management 2: 1–22. [Google Scholar]
  84. Subramaniam, Venkat, Tony T. Tang, Heng Yue, and Xin Zhou. 2011. Firm structure and corporate cash holdings. Journal of Corporate Finance 17: 759–73. [Google Scholar] [CrossRef]
  85. Tobin, James. 1956. The interest-elasticity of transactions demand for cash. Review of Economics and Statistics 38: 241–47. [Google Scholar] [CrossRef]
  86. Tong, Zhenxu. 2010. CEO risk incentives and corporate cash holdings. Journal of Business Finance and Accounting 37: 1248–80. [Google Scholar] [CrossRef] [Green Version]
  87. Venkiteshwaran, Vinod. 2011. Partial adjustment toward optimal cash holding levels. Review of Financial Economics 20: 113–21. [Google Scholar] [CrossRef]
  88. Weidemann, Jan F. 2018. A state-of-the-art review of corporate cash holding research. Journal of Business Economics 88: 765–97. [Google Scholar] [CrossRef]
  89. Wilkins, Arjun S. 2018. To lag or not to lag?:Re-evaluating the use of lagged dependent variables in regression analysis. Political Science Research and Methods 6: 393–411. [Google Scholar] [CrossRef]
1
Regarding the agency costs, we use the definition given by Fama and Jensen (1983): “the costs of structuring, monitoring, and bonding a set of contracts among agents with conflicting interests, plus the residual loss incurred because the cost of full enforcement of contracts exceeds the benefits”.
2
In his work, Weidemann (2018) demonstrates a comprehensive review of the studies of cash holdings’ determinants and their association with the relevant theoretical framework.
3
Following Denis and Mcconnell (2003), we define corporate governance as “the set of mechanisms—both institutional and market-based—that induce the self-interested controllers of a company (those that make decisions regarding how the company will be operated) to make decisions that maximize the value of the company to its owners (the suppliers of capital)”.
4
A relevant variable missing from the analysis is dividends paid in the fiscal year to assets or a dummy variable taking the value of one when a firm distributes dividends in the fiscal year, and zero otherwise (Ozkan and Ozkan 2004); the Amadeus database does not report the relevant financial data for the calculations. However, Ozkan and Ozkan (2004) find that dividend payout has a no significant influence on corporate cash holdings in the UK case.
5
Wilkins (2018) suggests that the exclusion of lagged dependent variables (LDVs) could result in biased estimates. In other words, LDVs should largely be considered as a robustness check by studies. Keele and Kelly (2006) argue that if history matters, which stands for most cases in economics where most processes are dynamic, then the LDV model is the most appropriate technique.
6
Since T is fairly small in our analysis (nine years), the specification should not lead to biased coefficients. As stated by the previous literature (Chamberlain 1984; Nickell 1981), a dynamic model introduces correlation between the lagged dependent variable and time-averaged error term; the estimation problem is highly dependent on the number of years.
7
We thank an anonymous reviewer for this suggestion.
8
Amadeus (Analyse Major Database from European Sources), compiled by Bureau Van Dijk Electronic Publishing (BvDEP), is a dataset that comprises financial information for public and private European companies. See www.bvdinfo.com.
9
We also run power calculations to overcome potential issues regarding the validity of our findings, which confirm that the sample size of the study is adequate to provide results with the desired power and significance. See Appendix C for further discussion.
10
We thank an anonymous reviewer for this suggestion.
Figure 1. Time trend of cash holdings during the period 2010–2018. Note: This figure plots the evolution of the average and median cash to asset ratio over time for the full sample of 6929 UK non-financial non-utility firms during 2010–2018.
Jrfm 13 00163 g001
Figure 2. Firms’ cash holdings, interest rates, and GDP over time. Note: This figure plots the evolution of the average cash to asset ratio, the growth of GDP, the change of Interest Rate 1-Yr T-Bills, and 10-Yr T-Bills over time for the full sample of 6929 UK non-financial non-utility firms during 2010–2018.
Jrfm 13 00163 g002
Figure 3. Firms’ cash holdings over size. Note: This figure plots the evolution of the average cash to asset ratio over time for small, medium, and large-sized UK non-financial non-utility firms during 2010–2018.
Jrfm 13 00163 g003
Figure 4. Differences between cash holdings’ determinants in size subgroupings for UK firms. Note: This figure shows the differences between small, medium, and large-sized non-financial non-utility UK firms via the corresponding Wald tests (see the regression results in Table 7). The null hypothesis of the test is H 0 : β i = γ i . A bar above the green or the red line leads to a rejection of H 0 hypothesis at a 5% level (1.96) or 10% level (1.65), respectively.
Jrfm 13 00163 g004
Table 1. Summary of model predictions.
VariablePredictionTrade-off Theory (TOT)Pecking Order Theory (POT)Free Cash Flow Hypothesis (FCF)
Cash Flow (CF)+n.a.
Leverage (LEV)−/+
Debt maturity (LEV)−/+
Net working capital (NWC)n.a.n.a.
Firm size (SIZE)++
Capital expenditures (CAPX)+n.a.
R&D (XRD)++n.a.
Industry sigma (INDSIGMA)+++n.a.
Market to Book ratio (MTB)+++
Opportunity cost of holding liquid assets (RSPREAD)?+n.a.n.a.
Note: This table shows the study’s prediction and the expected association of firm characteristics with cash ratio based on the capital structure theories, namely the Trade-off Theory (TOT), the Pecking Order Theory (POT), and the Free Cash Flow (FCF) hypothesis. “+”, “−”, “?”, and “n.a.” denotes that the variable has a positive, negative, unambiguous, and not applicable relation to cash holdings, respectively. Refer to Appendix A for definitions of the variables used in this study.
Table 2. Distribution of sample firms.
Panel A: By Year
YearNumber of FirmsPercentage (%)YearNumber of FirmsPercentage (%)
201067710.21201582412.43
201170610.65201685712.93
201272410.92201786913.11
201375911.4520184116.20
201480212.10Total6629100.00
Panel B: By Industry
NoDescription of IndustryNumber of FirmsPercentage (%)
1Consumer Non-durables: Food, Tobacco, Textiles, Apparel, Leather, Toys4677.05
2Consumer Durables: Cars, TV’s, Furniture, Household Appliances1051.58
3Manufacturing: Machinery, Trucks, Planes, Off Furn, Paper, Com Printing4707.09
4Oil, Gas, and Coal Extraction and Products3905.88
5Chemicals and Allied Products1832.76
6Business Equipment: Computers, Software, and Electronic Equipment88713.37
7Telephone and Television Transmission2293.46
8Wholesale, Retail, and Some Services (Laundries, Repair Shops)89013.43
9Healthcare, Medical Equipment, and Drugs2483.74
10Other: Mines, Constr, BldMt, Trans, Hotels, Bus Serv, Entertainment276041.64
Total6629100.00
Note: This table presents the distribution of the sample firms. Panel A presents the distribution of the sample firms by year. Panel B presents the industry distribution of the sample firms based on Fama-French 12 Classification.
Table 3. Summary statistics for key variables.
VariableMeanStd. Dev.Min25%Median75%MaxObs.
CASH0.1680.1870.0010.0430.0960.2220.9276629
CF0.0040.286−1.869−0.0020.0740.1290.3986629
LEV0.1720.2080.0000.0010.1170.2631.4006629
NWC−0.0090.238−1.514−0.101−0.0040.0990.6416629
SIZE11.5402.4404.8929.70911.35213.20917.6456629
CAPX0.0230.190−1.036−0.0170.0100.0740.6036629
XRD0.0820.4410.0000.0000.0000.0044.0186629
INDSIGMA0.0870.0460.0020.0460.0960.1220.2786629
MTB2.0952.2120.3611.0341.4742.29420.3536035
RSPREAD−0.5290.779−23.999−0.623−0.425−0.28337.3216610
Note: This table reports descriptive statistics for variables of interest for the full sample. All variables are defined in Appendix A.
Table 4. Pearson (lower diagonal) and Spearman (upper diagonal) correlations.
V1V2V3V4V5V6V7V8V9V10
V1: CASH1−0.090 ***−0.479 ***−0.007−0.339 ***−0.072 ***0.155 ***0.138 ***0.343 ***−0.110 ***
V2: CF−0.308 ***10.028 *0.097 ***0.374 ***0.149 ***−0.005−0.184 ***0.192 ***0.528 ***
V3: LEV−0.291 ***−0.094 ***1−0.231 ***0.379 ***0.021−0.130 ***−0.120 ***−0.130 ***0.041 **
V4: NWC−0.052 ***0.270 ***−0.342 ***1−0.000−0.027 *0.115 ***−0.129 ***−0.081 ***0.141 ***
V5: SIZE−0.373 ***0.437 ***0.199 ***0.108 ***10.090 **−0.104 ***−0.232 ***−0.117 ***0.352 ***
V6: CAPX−0.106 ***0.219 ***−0.063 ***0.069 ***0.102 ***10.0090.0220.148 ***0.137 ***
V7: XRD0.342 ***−0.268 ***−0.096 ***0.026 *−0.155 ***−0.00610.025 *0.234 ***−0.082 ***
V8: INDSIGMA0.171 ***−0.208 ***−0.063 ***−0.152 ***−0.220 ***−0.0010.117 ***10.060 ***−0.168 ***
V9: MTB0.336 ***−0.359 ***0.049 ***−0.237 ***−0.242 ***−0.0020.230 ***0.096 ***10.055 ***
V10: RSPREAD−0.115 ***0.516 ***−0.055 ***0.212 ***0.243 ***0.173 ***−0.123 ***−0.107 ***−0.165 ***1
VIF 1.911.261.271.421.071.151.101.231.35
Note: This table presents the correlation matrix and VIF values for the variables used in the main analysis. The Pearson correlation coefficients are presented in the lower diagonal, while the Spearman correlation coefficients are presented in the upper diagonal. *, **, *** denote significance at the 10, 5, and 1 percent levels (two-tailed), respectively. All variables are defined in Appendix A.
Table 5. Firms’ Characteristics by Cash to total assets (CASH) Quartiles.
First QuartileSecond QuartileThird QuartileForth Quartilet-Stat. (p-Value)
Range CASH0.0010.0430.0960.222
0.0430.0960.2220.927
CASH0.0210.0670.1500.433−88.17
[0.021][0.068][0.143][0.370](0.00)
CF0.0340.0530.038−0.11012.36
[0.075][0.078][0.083][0.042](0.00)
LEV0.2430.2190.1480.07724.57
[0.218][0.195][0.083][0.000](0.00)
NWC−0.0210.0100.006−0.0321.24
[−0.014][0.001][0.006][−0.007](0.21)
SIZE12.15412.46111.46410.08327.05
[12.107][12.448][11.258][9.941](0.00)
CAPX0.0310.0360.028−0.0055.27
[0.017][0.016][0.013][0.000](0.00)
XRD0.0120.0190.0360.259−12.27
[0.000][0.000][0.000][0.000](0.00)
INDSIGMA0.0820.0850.0860.097−9.87
[0.075][0.087][0.089][0.109](0.00)
MTB1.5021.6811.9983.246−18.65
[1.206][1.337][1.528][2.210](0.00)
RSPREAD−0.495−0.462−0.505−0.6534.83
[−0.408][−0.400][−0.405][−0.520](0.00)
Note: Comparison of mean values of characteristics of 992 unique firms for the period 2010–2018 is based on yearly constructed CASH quartiles. CASH is the ratio of cash plus marketable securities to total assets. Median values are presented in brackets. t-statistic tests the difference of means between the first and fourth quartiles. p-value is presented in parentheses. All variables are defined in Appendix A.
Table 6. Determinants of Cash Holdings.
Dependent Variable: CASH
Variables(1)(2)(3)(4)(5)(6)
L.CASH 0.730 ***
(66.68)
SIZE−0.014 ***−0.014 ***−0.022**−0.014 ***−0.014 ***−0.005 ***
(−6.92)(−6.93)(−3.06)(−6.87)(−17.26)(−6.13)
CF−0.075**−0.078 ***0.061−0.051 **−0.083 ***0.051 ***
(−3.31)(−3.40)(1.84)(−2.41)(−4.18)(6.80)
LEV−0.256 ***−0.251 ***−0.255 ***−0.254 ***−0.276 ***−0.113 ***
(−7.69)(−7.39)(−4.94)(−7.97)(−14.95)(−6.01)
NWC−0.041−0.037−0.181 **−0.035−0.064 ***−0.051 ***
(−1.65)(−1.47)(−2.77)(−1.44)(−5.85)(−4.41)
DEBTMT0.0120.0070.076 *0.0120.0170.038 **
(0.60)(0.36)(2.18)(0.62)(1.51)(3.14)
CAPX−0.090 ***−0.092 ***−0.101 ***−0.084 ***−0.092 ***−0.161 ***
(−8.06)(−7.43)(−5.65)(−7.63)(−7.36)(−12.81)
XRD0.085 ***0.086 ***0.025 ***0.085 ***0.102 ***0.033 ***
(7.45)(7.31)(5.73)(7.66)(14.28)(6.14)
INDSIGMA0.328 **0.3470.296 **0.393 ***0.122 ***0.172 **
(2.89)(1.54)(3.31)(3.78)(6.04)(2.98)
MTB0.017 ***0.016 ***0.007 *0.017 ***0.019 ***0.006 ***
(7.54)(7.47)(2.05)(7.94)(10.13)(4.79)
INT 0.011
(0.52)
GDPGR 0.006
(1.25)
RSPREAD0.018 ***0.018 ***0.005 0.023 **−0.005
(4.68)(4.72)(1.29) (2.72)(−0.64)
Year FEYesNoYesNoNoNo
Industry FEYesNoNoNoNoNo
Industry × Year FENoYesNoNoNoNo
Firm FENoNoYesYesNoYes
N602159355963603460225062
Adj. R20.3750.3470.7460.3700.3630.736
Note: This table presents the regression results of the determinants of cash holdings between 2010 and 2018. The dependent variable in all regressions is the cash to total assets ratio of all firms in the sample. All variables are defined in Appendix A. All the regressions include year and industry fixed effects (based on two-digit SIC codes). Intercepts are included in the regressions but not reported and are available upon request. The t-statistics in parentheses are based on robust standard errors, two way clustered at the firm and year level. *, **, and *** indicates statistical significance at the 10%, 5%, and 1% level, respectively.
Table 7. Regression results of comparison for small, medium, and large firms.
Dependent Variable: CASH
(1)(2)(3)(4)(5)(6)
VariablesFull SampleFull SampleFull SampleSmall Firms OnlyMedium Firms OnlyLarge Firms Only
SIZEDUMMY−0.030 ***
(−3.38)
SMALL vs. LARGE −0.105 ***
(−5.87)
MEDIUM vs. LARGE −0.018 *
(−2.19)
CF−0.113 ***−0.074 ***−0.080 *−0.084 ***−0.074−0.049
(−5.21)(−3.48)(−2.14)(−3.71)(−1.63)(−1.27)
LEV−0.251 ***−0.284 ***−0.170 ***−0.372 ***−0.219 ***0.006
(−7.28)(−6.82)(−4.97)(−6.33)(−4.49)(0.16)
NWC−0.035−0.019−0.073 ***−0.017−0.065 **−0.086 **
(−1.40)(−0.63)(−3.58)(−0.42)(−2.40)(−3.22)
DEBTMT−0.0220.057 *−0.049 **0.112 *−0.062 **−0.090 ***
(−1.10)(2.29)(−2.50)(2.12)(−2.41)(−3.75)
CAPX−0.091 ***−0.092 ***−0.080 ***−0.105 ***−0.084 ***−0.075 **
(−7.72)(−4.82)(−6.39)(−3.64)(−5.41)(−3.04)
XRD0.084 ***0.077 ***0.094 ***0.069 ***0.084 ***0.114
(7.26)(5.98)(4.97)(5.10)(4.21)(1.11)
INDSIGMA0.355 **0.398 **0.210 *1.264 ***0.326 *0.070
(3.35)(3.33)(2.02)(4.31)(1.96)(0.62)
MTB0.017 ***0.016 ***0.023 ***0.016 ***0.023 ***0.022 ***
(7.66)(7.20)(6.74)(7.46)(6.19)(4.74)
RSPREAD0.017 ***0.018 ***−0.0300.019 ***−0.0370.044
(4.96)(6.05)(−1.48)(6.12)(−1.65)(1.23)
Year FEYesYesYesYesYesYes
Industry FEYesYesYesYesYesYes
N602029894635138530311603
Adj. R20.3600.4270.3300.3220.3270.330
Note: This table presents the regression results of the determinants of cash holdings between 2010 and 2018. The dependent variable in all regressions is the cash to total assets ratio of all firms in the sample. All variables are defined in Appendix A. All the regressions include year and industry fixed effects (based on two-digit SIC codes). Intercepts are included in the regressions but are not reported. The t-statistics in parentheses are based on robust standard errors, two way clustered at the firm and year level. *, ** and *** indicate statistical significance at the 10%, 5%, and 1% level, respectively.
Table 8. Regressions of cash holdings on managerial ownership, controlling shareholder, and other firm characteristics.
Dependent Variable: CASH
Variables(1)(2)(3)(4)(5)(6)
L.CASH 0.728 ***0.727 ***0.727 ***
(55.89)(55.63)(56.80)
SIZE−0.013 ***−0.016 ***−0.013 ***−0.005 ***−0.005 ***−0.005 ***
(−6.48)(−5.75)(−6.53)(−6.15)(−4.17)(−5.62)
CF−0.083 ***−0.083 ***−0.083 ***0.064 ***0.064 ***0.064 ***
(−3.63)(−3.62)(−3.62)(5.27)(5.26)(5.15)
LEV−0.264 ***−0.260 ***−0.264 ***−0.117 ***−0.117 ***−0.118 ***
(−7.21)(−7.20)(−7.22)(−7.29)(−7.22)(−7.29)
NWC−0.045−0.045−0.045−0.052 ***−0.052 ***−0.052 ***
(−1.71)(−1.73)(−1.72)(−3.73)(−3.78)(−3.70)
DEBTMT0.0120.0120.0130.037 ***0.037 ***0.037 ***
(0.59)(0.57)(0.64)(3.66)(3.59)(3.73)
CAPX−0.090 ***−0.090 ***−0.090 ***−0.162 ***−0.162 ***−0.162 ***
(−7.70)(−7.68)(−7.73)(−13.22)(−13.25)(−13.13)
XRD0.081 ***0.081 ***0.081 ***0.032 ***0.032 ***0.032 **
(6.72)(6.71)(6.71)(3.64)(3.74)(3.39)
INDSIGMA0.304 **0.302 **0.304 **0.177 **0.176 **0.177 **
(2.56)(2.53)(2.57)(3.21)(3.16)(3.21)
MTB0.017 ***0.016 ***9.687 *0.006 ***0.006 ***1.583
(6.67)(6.33)(2.13)(4.29)(3.90)(0.33)
RSPREAD0.017 ***0.017 ***0.017 ***−0.014−0.014−0.014
(4.15)(4.20)(4.15)(−1.67)(−1.68)(−1.62)
MAN−0.409 **−0.385 **−0.035−0.049−0.0480.009
(−2.72)(−2.62)(−0.15)(−1.45)(−1.32)(0.05)
MAN20.006 **0.005 **0.0000.0010.001−0.000
(2.69)(2.58)(0.10)(1.41)(1.27)(−0.08)
MAN3−0.000 **−0.000 **−0.000−0.000−0.0000.000
(−2.66)(−2.55)(−0.06)(−1.37)(−1.22)(0.09)
MTB × MAN −0.418 * −0.069
(−2.10) (−0.34)
MTB × MAN2 0.006 * 0.001
(2.06) (0.34)
MTB × MAN3 −0.000 * −0.000
(−2.00) (−0.34)
CEO_COB −0.020 0.001
(−0.48) (0.21)
BOARDN 0.009 0.002
(1.20) (0.50)
Year FEYesYesYesYesYesYes
Industry FEYesYesYesYesYesYes
N563556355635474747474747
Adj. R20.3720.3720.3720.7310.7310.731
Note: This table presents the regression results of the determinants of cash holdings between 2010 and 2018. The dependent variable in all regressions is the cash to total assets ratio of all firms in the sample. All variables are defined in Appendix A. All the regressions include year and industry fixed effects (based on two-digit SIC codes). Intercepts are included in the regressions but are not reported. The t-statistics in parentheses are based on robust standard errors, two way clustered at the firm and year level. *, ** and *** indicate statistical significance at the 10%, 5%, and 1% level, respectively.
Table 9. Regression results of firm characteristics on cash to total assets (CASH) based on different levels of competition, financial distress, and firm’s age.
Dependent Variable: CASH
(1)(2)(3)(4)(5)(6)
Herfindahl–Hirschman IndexAltman Z-ScoreFirm Age
VariablesLow industry rivalry
(Above yearly HHI median)
High industry rivalry
(Below yearly HHI median)
Strong balance sheet
(Above yearly Median)
Weak balance sheet
(Below yearly Median)
Young (<5 years from foundation date)Mature (>5 years from foundation date)
SIZE−0.013 ***−0.016 *−0.014 ***−0.009 ***−0.019 **−0.014 ***
(−6.62)(−2.60)(−4.96)(−4.45)(−2.57)(−6.24)
CF−0.075 **−0.0560.131−0.112 ***−0.077−0.057 **
(−3.19)(−1.52)(1.62)(−5.18)(−0.96)(−2.59)
LEV−0.280 ***−0.182 *−0.179 ***−0.168 ***−0.332 **−0.241 ***
(−8.21)(−2.21)(−3.76)(−4.32)(−3.20)(−6.38)
NWC−0.0550.006−0.095 ***0.012−0.174 *−0.033
(−1.89)(0.20)(−3.85)(0.32)(−2.18)(−1.27)
DEBTMT0.0180.001−0.0380.012−0.0050.007
(0.85)(0.04)(−1.39)(0.43)(−0.06)(0.32)
CAPX−0.096 ***−0.046 *−0.124 ***−0.046 **−0.142 ***−0.087 ***
(−7.54)(−2.19)(−5.75)(−2.96)(−4.38)(−5.68)
XRD0.082 ***0.113 ***0.2300.082 ***0.0250.098 ***
(7.10)(14.79)(1.70)(8.15)(0.97)(8.95)
INDSIGMA0.336 **−0.0330.0570.1120.767 *0.282 **
(2.83)(−0.26)(0.47)(0.77)(1.91)(2.32)
MTB0.017 ***0.014 ***0.014 **0.016 ***0.015 *0.016 ***
(8.07)(6.19)(2.32)(4.52)(2.11)(6.59)
RSPREAD0.018 ***0.0030.016 ***0.020 **0.0220.017 ***
(4.76)(0.11)(7.45)(2.86)(0.59)(5.22)
Year FEYesYesYesYesYesYes
Industry FEYesYesYesYesYesYes
N5036976252327486225399
Adj. R20.3760.3600.3460.3530.3760.389
Note: This table presents the regression results of the determinants of cash holdings between 2010 and 2018. Columns (1) and (2) report the results for the subsample of firms above and below the yearly median of the yearly Herfindahl–Hirschman Index (HHI). Firms above (below) the yearly median of the HHI Low industry rivalry face low (high) industry rivalry. Columns (3) and (4) report the results for the subsample of firms above and below the yearly median of the Altman Z-score introduced by Edward Altman (1968). Firms above (below) the yearly median of the Altman Z-score have a strong (weak) balance sheet and are considered to be less (more) financially constrained. Columns (5) and (6) report the results for the subsample of firms classified below five years since their foundation date (young) and above five years since their foundation date (mature). Intercept is included in all regressions. The dependent variable in all regressions is the cash to total assets ratio of all firms in the sample. All variables are defined in Appendix A. All regressions include year and industry fixed effects (based on two-digit SIC codes). Intercepts are included in the regressions but are not reported. The t-statistics in parentheses are based on robust standard errors, two way clustered at the firm and year level. *, ** and *** indicate statistical significance at the 10%, 5%, and 1% level, respectively.
Table 10. Two-step system generalized method of moments (GMM).
Dependent Variable = CASH
(1)(2)
VariablesTwo-Step GMMTwo-Step GMM
L.CASH0.428 ***0.375 ***
(28.96)(40.75)
SIZE−0.015 ***−0.016 ***
(−3.54)(−7.27)
CF−0.0020.083 ***
(−0.18)(12.98)
LEV−0.250 ***−0.170 ***
(−20.04)(−13.02)
NWC−0.174 ***−0.150 ***
(−10.41)(−12.42)
DEBTMT0.129 ***0.074 ***
(13.10)(10.32)
CAPX−0.089 ***−0.122 ***
(−9.40)(−22.92)
XRD0.034 *0.028 ***
(1.91)(9.08)
INDSIGMA0.211 ***0.255 ***
(4.46)(6.55)
MTB0.0020.006 ***
(1.35)(6.40)
RSPREAD0.008−0.008 ***
(1.06)(−2.70)
Year FEYesYes
Industry FEYesNo
Firm FENoYes
No firms878878
N50625062
AR(1) (p-value)0.0000.000
AR(2) (p-value)0.0630.126
Hansen (p-value)0.0000.000
Note: This table the two-step system GMM results for the full sample. Intercept is included, but not reported. Robust t-statistics in brackets, and stars *, *** denote significance at the 10%, and 1% level, respectively. All variables are defined in Appendix A.
Table 11. Determinants of cash holdings in alternative periods.
Dependent Variable: CASH
2010–20122013–20152016–2018
Variables(1)(2)(3)
SIZE−0.011 **−0.014 **−0.016 **
(−4.62)(−5.00)(−6.14)
CF−0.030−0.049−0.129 **
(−0.91)(−2.11)(−5.51)
LEV−0.298 **−0.240 **−0.233 **
(−7.84)(−4.75)(−5.47)
NWC−0.056−0.012−0.061
(−1.83)(−0.33)(−1.85)
DEBTMT0.028−0.0020.004
(1.21)(−0.07)(0.16)
CAPX−0.126 **−0.067 **−0.093 **
(−5.87)(−4.72)(−7.08)
XRD0.101 **0.096 **0.061 **
(7.34)(6.11)(5.04)
INDSIGMA0.4150.3830.174
(2.08)(2.01)(1.52)
MTB0.017 **0.015 **0.018 **
(4.77)(6.20)(5.98)
RSPREAD0.019 *−0.0030.032 **
(3.60)(−0.32)(5.56)
Year FEYesYesYes
Industry FEYesYesYes
N185121552015
Adj. R20.3890.3510.386
Note: This table presents the regression results of the determinants of cash holdings between 2010 and 2018. The dependent variable in all regressions is the cash to total assets ratio of all firms in the sample. All variables are defined in Appendix A. All the regressions include year and industry fixed effects (based on two-digit SIC codes). Intercepts are included in the regressions but are not reported. The t-statistics in parentheses are based on robust standard errors, two way clustered at the firm and year level. *, and ** indicate statistical significance at the 10%, and 5% level, respectively.
Table 12. Alternative measures of firm size.
Dependent Variable: CASH
Variables(1)(2)(3)(4)(5)(6)
L.CASH 0.709 ***0.725 ***0.735 ***
(64.00)(64.88)(67.51)
SIZENA−0.025 *** −0.010 ***
(−10.49) (−7.18)
SIZE1 −0.015 *** −0.006 ***
(−7.94) (−4.42)
SIZE2 −0.008 *** −0.003 ***
(−4.01) (−4.10)
CF−0.033−0.052 *−0.093 ***0.063 ***0.059 ***0.047 ***
(−1.41)(−2.29)(−4.21)(8.74)(8.31)(6.23)
LEV−0.249 ***−0.234 ***−0.263 ***−0.114 ***−0.106 ***−0.115 ***
(−8.02)(−7.07)(−7.61)(−6.14)(−5.59)(−6.03)
NWC−0.046 *−0.041−0.036−0.053 ***−0.051 ***−0.049 ***
(−1.97)(−1.66)(−1.42)(−4.71)(−4.41)(−4.12)
DEBTMT0.055 **−0.005−0.0100.055 ***0.032 **0.033 **
(2.94)(−0.26)(−0.52)(4.46)(2.66)(2.68)
CAPX−0.086 ***−0.100 ***−0.087 ***−0.158 ***−0.164 ***−0.160 ***
(−8.30)(−8.99)(−7.40)(−13.04)(−13.11)(−12.95)
XRD0.080 ***0.074 ***0.085 ***0.033 ***0.030 ***0.033 ***
(7.72)(6.86)(7.42)(6.54)(5.44)(6.05)
INDSIGMA0.273 *0.288 **0.350 **0.155 **0.157 **0.177 **
(2.27)(2.55)(3.12)(2.48)(2.55)(3.14)
MTB0.015 ***0.017 ***0.019 ***0.006 ***0.006 ***0.007 ***
(7.34)(7.86)(8.33)(4.74)(5.26)(4.96)
RSPREAD0.017 ***0.017 ***0.018 ***−0.004−0.006−0.006
(3.86)(4.23)(4.74)(−0.49)(−0.68)(−0.67)
Year FEYesYesYesYesYesYes
Industry FEYesYesYesYesYesYes
N602160216010506250625053
Adj. R20.4190.3860.3630.7430.7380.736
Note: This table presents the regression results of the determinants of cash holdings between 2010 and 2018, where Columns (1)–(3) and Columns (4)–(6) are based on Equations (1) and (2), accordingly. The dependent variable in all regressions is the cash to total assets ratio of all firms in the sample. SIZE is defined as the natural logarithm of total assets, SIZENA is the natural logarithm of total assets minus cash and short-term investments, SIZE1 is the natural logarithm of sales, and SIZE2 is the natural logarithm of the market value of equity. All variables are defined in Appendix A. All the regressions include year and industry fixed effects (based on two-digit SIC codes). Intercepts are included in the regressions, but not reported, and are available upon request. The t-statistics in parentheses are based on robust standard errors, two way clustered at the firm and year level. *, **, and *** indicate statistical significance at the 10%, 5%, and 1% level, respectively.

