Article

Formal Finance Usage and Innovative SMEs: Evidence from ASEAN Countries

1
Department of Financial and Business Systems, Lincoln University, 21 Ellesmere Junction Road, Lincoln, Christchurch 7674, New Zealand
2
Department of Business Administration, Shaheed Benazir Bhutto University, Shaheed, Benazirabad 67450, Pakistan
3
Lahore Business School, The University of Lahore, Lahore 54000, Pakistan
*
Author to whom correspondence should be addressed.
J. Risk Financial Manag. 2020, 13(10), 222; https://doi.org/10.3390/jrfm13100222
Submission received: 31 August 2020 / Revised: 20 September 2020 / Accepted: 21 September 2020 / Published: 23 September 2020
(This article belongs to the Special Issue Innovation and SME Finance)

Abstract

:
This paper provides evidence on the likelihood of formal finance usage among innovative small and medium enterprises (SMEs) operating in ASEAN countries. To this end, the SMEs are classified into four categories, namely non-innovators and product, process, and product-and-process innovator SMEs. Subsequently, a propensity score weighting (PSW) analysis is performed to adjust for diversity existing across innovative SMEs. The resulting propensity scores are further used to perform the causal effect analysis based on the average treatment effect (ATE) approach, which measures the likelihood of formal finance usage among different types of innovative SMEs. Our ATE results reveal that SMEs simultaneously engaged in product and process innovation show a higher likelihood of using formal finance than non-innovators. However, formal finance usage of SMEs perusing only product/service or process innovation is not any different from non-innovators. Furthermore, our pairwise analysis shows that product and process innovators also exhibit a higher likelihood of formal finance usage than product/service or process innovators. Besides, younger and medium-size product and process innovating SMEs are more likely to use formal finance. These results are robust for different subsamples and firm- and country-level controls.

Graphical Abstract

1. Introduction

In most developing economies, bank-led formal finance is the leading vehicle for meeting financing needs due to underdeveloped capital markets and limited options available for raising capital. In addition to being used by many large firms, it is the most prominent outlet of external financing for small and medium enterprises (SMEs) operating in the developing countries (Beck et al. 2008). In the context of developing economies, studies show that formal finance plays a crucial role in SME growth, which is primarily driven by innovative activities (Cornaggia et al. 2015; Wellalage and Fernandez 2019). For example, Vietnam is the most prominent emerging economy in ASEAN region where formal financing by way of financial markets is an emerging mechanism of financing for SMEs (Vuong 2019), which represent about 98 percent of all registered firms (Le et al. 2019). Specifically, bank loans and leasing have been a key driver for SME innovation and growth in the country (Vuong 2019; Le et al. 2019). This implies that there is an essential and positive link between formal finance and SME innovation. There are several reasons why this link exists. For instance, innovation is a process that often takes place over a more extended period, as it involves multiple steps such as planning, designing, development, and testing of innovation projects. Fittingly, the maturity matching principle requires that long-term innovation projects be financed with long-term loans provided by formal finance providers. Another reason is the loans with lower interest rates offered by the formal finance institutions. Cheaper loans reduce the financial burden for innovative firms, and, in turn, promote innovation.
Given the association between formal finance and innovation, an emerging strand of literature has begun to explore various dimensions of this relationship. As we discuss later in Section 2, the following themes emerge from the literature. First, further investigation on the relationship is more important for developing countries, whose economic growth is primarily driven by SMEs for which innovation is the leading driver of growth. Second, formal finance is not uniformly accessible to SMEs across all countries (Wellalage and Fernandez 2019; Wellalage and Reddy 2020; Lee et al. 2015). Hence, even among developing countries, the formal finance avenues available to SMEs may vary considerably. Third, prior works have mostly considered indirect indicators of innovation, such as research and development (R&D) costs and patterns (Mancusi and Vezzulli 2010; Lööf and Nabavi 2016). However, these indicators represent innovation inputs and miss out the output related information provided by other direct and more detailed innovation activities. Notably, SME innovation is a broad concept that can be segregated further based on activities related to the product, process, etc. Given the diverse nature of innovation activities, SMEs will likely have different funding requirements to finance a given type of innovation. Motivated by these divergences in funding, this study investigates how financing choices vary between different types of innovative SMEs in ASEAN countries. Our sample includes ASEAN countries because (a) previous literature has paid little attention to these countries in studying the relationship between formal finance and SME innovation, and (b) SMEs have been in the spotlight in ASEAN due to their overwhelming contribution to economic growth through innovation.
This study uses a representative sample of SMEs operating in ASEAN countries to provide evidence on the likelihood of formal finance use among innovative SMEs. Extracted from the World Bank’s enterprise survey of 2015–2016, the data comprise 4541 SMEs operating in eight ASEAN countries. We classify SMEs into four categories, namely non-innovators and product, process, and product-and-process innovator SMEs. Subsequently, we perform propensity score weighting (PSW) analysis to adjust for inherent differences in the different types of innovative SMEs based on their ownership structure, gender diversity, firm size, leverage, growth, and research and development expenditure. The PSW analysis generates analogous treatment and control groups that satisfy the conditions of sufficient balance and overlap. Using propensity score balanced groups of innovator SMEs, we perform causal effect analysis by employing the average treatment effect (ATE) approach to measure the likelihood of formal finance usage among different types of innovative SMEs compared to non-innovators. Our ATE results reveal that SMEs simultaneously engaged in both product and process innovation show a higher likelihood of using formal finance than non-innovators. However, SMEs perusing only product/service or process innovation do not show any significant differences in formal finance use compared to non-innovators. Additionally, our pairwise analysis shows that product and process innovators also exhibit a higher likelihood of formal finance use than product/service or process innovators. Likewise, younger and medium-size product and process innovating SMEs are more likely to use formal finance. These results are robust for different subsamples and firm- and country-level controls.
Our study contributes to the growing literature, which explores the relationship between SME innovation and external finance usage for developing countries. While previous studies have studied this relationship for Eastern European and Central Asian economies (Wellalage and Fernandez 2019) and Latin America (Fernandez 2017), we consider SMEs operating in ASEAN countries to provide further evidence in this respect. This is important for both investors and policymakers concerned with ASEAN SMEs because SMEs engaging in innovation activities primarily drive economic growth in these countries. We use direct indicators of innovation, namely product and process, instead of indirect proxies, such as research and development (R&D) costs and patterns employed by earlier works (Mancusi and Vezzulli 2010; Lööf and Nabavi 2016). Studies show that although R&D could represent innovation in large firms in technologically advanced nations, it may not be a good proxy for SME innovation in developing countries (Acemoglu et al. 2006), as not all SME innovation would involve R&D expenditures in these countries (Gorodnichenko and Schnitzer 2013). Additionally, the choice of innovation also depends on many firm- and market-level characteristics (see Lee et al. 2015; Wellalage and Fernandez 2019; Archer et al. 2020). This study focuses on core innovation, such as product and process innovation, which hinges on the fact that, for SMEs, external finance has a clear association with core innovation rather than soft innovation (defined as innovation related to marketing and organizational activities1). Another contribution of this study is the use of a robust empirical approach. This approach accounts for the potential loss of information typically associated with direct proxies of innovation. It successfully considers the fact that firms have varying innovation activities that range from just product/service or process innovation to both product and process innovation. The study employs an estimation technique that captures the effect of multi-value treatments, introduced by McCaffrey et al. (2013), to overcome limitations of dummy variable approaches used by prior works (see, e.g., Ayyagari et al. 2011, 2014; Wu et al. 2016). This approach provides the benefit of using multivalued treatment variables without losing valuable information.
This paper is structured as follows. Section 2 provides a brief overview of the literature related to the topic. Section 3 describes the data and methodology. Section 4 presents the empirical findings. Section 5 concludes the study.

2. Literature Review

This section provides a brief overview of the literature related to the topic. The literature is divided into five distinct strands: access to finance and firm characteristics, access to finance and country-level variables, innovation and SMEs, innovative SMEs and finance, and the SME finance–innovation nexus and propensity scores.

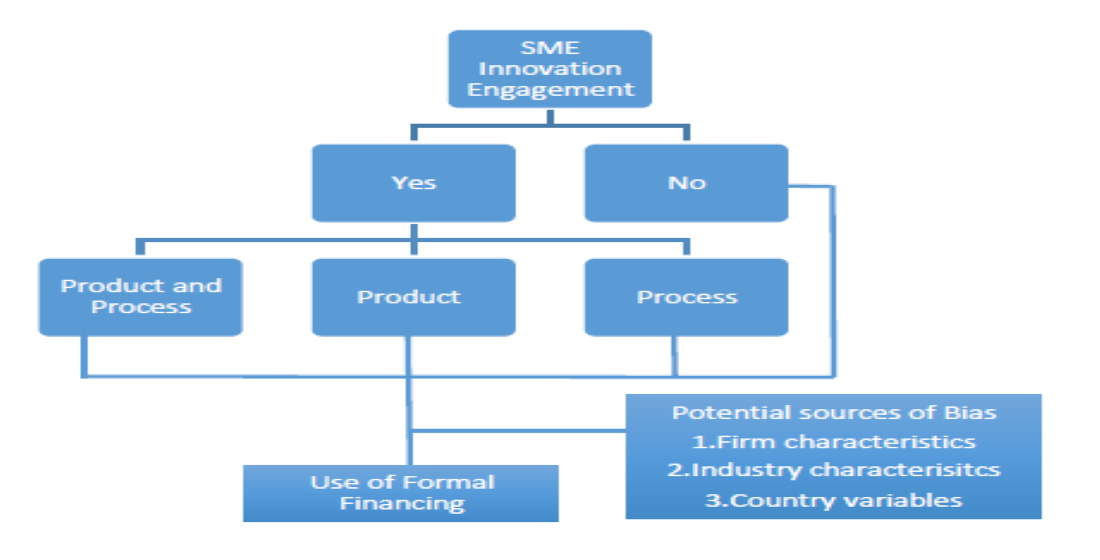
2.1. Innovation and SMEs

In broader terms, innovation is categorized into technological and non-technological innovations. Non-technological innovation can be classified into organizational and marketing innovations, whereas technological innovation is classified into product and process innovation (Beck and Demirguc-Kunt 2006; Wang 2016). Klewitz and Hansen (2014) include marketing, radical2, and management innovation in their studies. The product and process innovations involve apparent changes in the product specification, along with changes in the processes in the form of equipment, technology, techniques, or software. Studies confirm that SMEs are more inclined towards technological innovations with a stake in the product and process innovation (Kim et al. 2012; Shashi et al. 2019; Shi et al. 2018).

2.2. Innovative SMEs and Finance

SMEs play a critical role in promoting the innovation capital of both developed and developing countries. However, SMEs need finance to introduce new products and processes and compete in the market (Wellalage and Fernandez 2019). While access to finance is considered as the lifeblood of SMEs for carrying out innovative activities, financial constraints significantly hinder this process (Beck and Demirguc-Kunt 2006; Wang 2016). Qamruzzaman and Jianguo (2019) indicate that inadequate financing affects SME growth, which, in turn, brings about undesirable consequences to the economy. Moreover, the lack of proper financial documentation subjects SMEs to a higher risk premium charged by the lending institutions. It also lends SMEs to stricter requirements from the banks supplying the finance, thereby constraining them to receive sufficient financial resources (Cornelli et al. 2019). Consequently, financially constrained SMEs in developing countries are less likely to pursue innovative endeavors (Archer et al. 2020). This inhibits the growth of SMEs and the economic backwardness of the developing countries (del Brío and Junquera 2003).
Finance providers are categorized into formal sources such as banks, venture capitalists, and the government (see, e.g., Lee et al. 2015), and informal sources (Armendáriz and Morduch 2010; Wu et al. 2016; Lin and Sun 2006). Studies show that SMEs face difficulty to acquire funds from formal sources than informal counterparts. The informal financial institutions provide easy and low-cost finance than formal finance providers (Armendáriz and Morduch 2010; Wu et al. 2016; Lin and Sun 2006).
Conversely, innovation has attracted financiers and angel investors because innovative firms are better equipped to compete in local and international markets (O’Cass and Weerawardena 2009). Similarly, the recent advances in SME financing, especially the advent of Fintech through non-banking channels that impose manageable conditions for financing SMEs, have eased the financial difficulties of SMEs. The credit approach of these Fintech firms differ from conventional banks; for example, they use big data methods to access the credit risk of any firm, including SMEs. The Fintech based lenders also lend to new firms with innovative business plans, which do not have tangible assets as collateral. However, informal finance providers give credit without tangible collateral (Degryse et al. 2017). Fintech firms give importance to intangible assets such as intellectual property to provide finance to new firms, thus increasing the financial inclusion among the new SMEs (Hau et al. 2018). Thus, the introduction of innovative financial services provides various opportunities for SMEs to meet their financial needs.
In a different vein, studies show that financing and innovation are not always related to developing economies. For example, the results from Archer et al. (2020) and Kim et al. (2019) reveal that the financial constraints do not significantly affect the innovation of SMEs in Vietnam. Further, Sasidharan et al. (2015) find no relationship between the innovation and the access to finance of SMEs in India. Moreover, studies show that excess financing has varying effects on SME productivity. For example, Adegboye and Iweriebor (2018) analyzed the role of access to finance in enhancing productivity and innovation in Nigerian SMEs. The results show that access to finance encourages innovation, but it inhibits productivity. Kijkasiwat and Phuensane (2020) analyzed the relationship between innovation and firm performance in Eastern European and Central Asian countries. The authors’ result shows a positive relationship between innovation and firm performance. Further, it shows that the amount of finance has a moderating and mediating effect on the nexus between innovation and firm performance.
Therefore, we reconcile that formal finance has a significant relationship with SME innovation, and this relationship is more important for developing countries. Additionally, innovation activities related to product and process play an essential role in SME growth, and, therefore, are more likely to drive SMEs for formal financing choice.

2.3. Access to Finance and Firm Characteristics

Previous studies have shown that different firm characteristics determine the likelihood of accessing external finance. For example, using the concept of life cycle paradigm, Carey and Prowse (1993) and Berger and Udell (1998) argue that larger SMEs are more likely to access external finance given their profitability, information opacity, and diversification of business operations. Similarly, the prospects of accessing external finance are also related to firm age as younger firms have an opaque information environment due to both the absence of record maintenance and recent entry into the market that makes it harder for them to access finance (Berger and Udell 1998; Coleman 2004). Moreover, performance factors such as profitability and growth also affect SMEs’ prospects of obtaining external funding. Moritz et al. (2016) and Lawless et al. (2015) argue that the past and current profitability performance of SMEs serves as a tool to stimulate external financing. Likewise, the growth performance of the firm show a positive association with external financing (Pagano and Röell 1998) and ensures better financing conditions (Rajan 1992).
Further, firm-level governance indicators such as foreign ownership, female ownership, years of top management experience, and female managers also play an essential role in determining access to finance. Wagner and Weche Gelübcke (2015) and Abor and Biekpe (2007) report a positive association between foreign ownership and access to finance; additionally, high-tech independent SMEs benefit from foreign ownership related with accessibility to external funding. Moreover, majority ownership and top-management positions held by a female also exhibit a positive association with access to finance (Abor and Biekpe 2007; Botrić and Božić 2017; Pham and Talavera 2018) and preference for using formal financing sources (Bardasi et al. 2011; Yazdanfar and Turner 2012). On the other hand, the manager and owner experience influences the initial financing of SMEs (Abdesamed and Abd Wahab 2012).

2.4. Access to Finance and Country-Level Variable

Furthermore, the country-level factors such as the development of credit markets, gross domestic product, and the strength of legal rights systems also play an essential role in SMEs’ inclination to external finance. Studies show that the development of informal and formal credit markets in a country increases the prevalence of external financing in SMEs (Brown et al. 2013; Li et al. 2019; Palacín-Sánchez et al. 2019). Additionally, a sound and efficient legal system that protects the rights of SMEs and provides speedy justice increases the likelihood of external financing (Fatoki 2014; Haselmann and Wachtel 2010; Palacín-Sánchez et al. 2019). Finally, higher per capita GDP causes SMEs to invest more and acquire funding from external sources (Barbu et al. 2019).

2.5. SME Finance–Innovation Nexus and Propensity Scores

This study uses a robust empirical approach that considers the potential loss of information due to direct proxy usage since most organizations have varying innovation activities that range from product/service or process innovation to both product and process innovation. To this end, we resort to an estimation technique introduced by McCaffrey et al. (2013), which captures the effect of multi-value treatments, and hence overcomes the limitations of the dummy variable approaches used in prior works (see, e.g., Ayyagari et al. 2011, 2014; Wu et al. 2016). The seminal work of Rosenbaum and Rubin (1983) provides the foundation for propensity scores in the literature by addressing the critical role of propensity scores in observational works that capture causal relationships. Recently, Lee (2018) built on the idea of Rosenbaum and Rubin (1983) and argued that once a conditional on observables is subject to a multivalued treatment, a causal comparison between subpopulations is invalid unless two propensity scores are computed at a given treatment level. Accordingly, Lee (2018) improved the causal relationships by introducing efficient propensity scores, thus pioneering the application of propensity scores’ application in management sciences. In this framework, Pellegrini and Sironi (2017) use the case of multivalued treatment as an extension of the binary case in the context of SMEs. Adding to this literature strand, we use the multivalued treatment approach without losing valuable information.

3. Data and Methodology

3.1. Variable Description

The use of formal or informal finance by an SME is the primary dependent variable for this study. Following Wellalage and Fernandez (2019), formal finance refers to the use of the bank, and non-bank institution loans by an SME, whereas informal finance refers to the loans from informal sources such as friends, family, and trade credits. Accordingly, we define access to finance as a dummy variable that takes the value one if a firm borrows money from a bank and non-bank institutions and zero if the firm uses informal financing sources. Moreover, we use firm innovation as primary independent variables that categorize SMEs into four firm types based on their answers to the following survey question(s):
Has this firm introduced new or significantly improved products or services during the last three years?
Has this firm introduced new or significantly improved process during the last three years?
If a firm answers both questions in negation, it is classified as non-innovative SME and takes the value one. On the other hand, if a firm confirms introducing a new product or service during the last three years, we categorize that firm as a product-innovating SME, and it takes the value of two. Similarly, an SME engaged in process innovation takes the value three. Lastly, if a firm answers both questions in affirmation, we classify that SME as product- and process-innovating SME, and it takes the value of four. Hence, our innovation variables include four values that describe SMEs from non-innovative to entirely innovative.
Further, we follow existing studies such as (Wellalage and Fernandez 2019) and (Bongini et al. 2019) in the selection of characteristics that determine the SME choice between formal and informal financing choices. Accordingly, we use various firm- and country-level characteristics defined here:
  • Age: Defined as the number of years since the establishment of the firm. Younger firms have an opaque information environment due to the absence of a record of accomplishments and the newness factor that creates a disadvantage in accessing formal finance (Berger and Udell 1998; Coleman 2004).
  • Size: Total value of assets is employed as a proxy for firm size. According to Carey and Prowse (1993) and Berger and Udell (1998), larger SMEs are more likely to access formal finance given their profitability, less information opacity and diversified business operations.
  • Foreign ownership: Percentage of foreign ownership in an SME. Studies show a positive association between foreign ownership and access to formal finance (Abor and Biekpe 2007; Wagner and Weche Gelübcke 2015).
  • Female ownership (Female top manager): Dummy variables that take the value one if the SME has a female owner (top manager), and zero otherwise. Majority ownership and top-management positions held by a female also exhibit a positive association with access to finance (Abor and Biekpe 2007; Botrić and Božić 2017; Pham and Talavera 2018) and preference for using formal financing sources (Bardasi et al. 2011; Yazdanfar and Turner 2012).
  • Manager experience: Number of years a manager has been a top manager. Abdesamed and Abd Wahab (2012) report a positive association between manager experience and formal financing.
  • Time spent with government officials: Percentage of total senior management’s time spent on the requirements imposed by government regulations in a typical week over the last year.
  • Development of credit markets: Percentage of private credit by deposit money banks and other financial institutions to GDP. According to Palacín-Sánchez et al. (2019), the development of informal and formal credit markets in a country increases the prevalence of formal financing.
  • The efficiency of the legal system: the strength of legal rights index that ranges between a weak (0) and strong (12) legal system. Studies show a sound and efficient legal system that protects the rights of SMEs and provides speedy justice increases the likelihood of formal financing (Fatoki 2014; Haselmann and Wachtel 2010).
  • GDP per capita: GDP per capita in US dollar. According to Barbu et al. (2019), higher per capita GDP causes SMEs to invest more and acquire funding from formal sources.
Access to finance variables describes the use of finance by an SME at the time of the survey. Likewise, firm-level variables such as female and foreign ownership, top manager experience, and top female manager are observed at the time of the survey. Country-level variable such as private credit to GDP, GDP per capita and efficiency of the legal system are also collected during the survey time. Moreover, the variable measuring the choice to engage in innovation activity exhibits changes in innovation activities during the previous three years. As a result, the data collection method minimizes the chances of simultaneity bias in our empirical estimations.

3.2. Data Description

We use the World Bank enterprise survey database to collect the sample data for this study. The enterprise survey database collects and distributes extensive data for more than 164,000 small and medium enterprises (SMEs) from 144 countries. This database provides globally comparable data for different business environment indicators such as regulations and taxes, crime and corruption, as well as enterprise-level indicators such as informality, infrastructure, workforce, use of innovation and technology, finance, and female participation in the SME sector. We use data of 4541 SMEs operating in eight ASEAN countries, namely, Indonesia, Thailand, Malaysia, Cambodia, Vietnam, Laos, Myanmar, and the Philippines. Although there are no uniform criteria is ASEAN countries that classify firms into SMEs, we use the enterprise survey’s employment-based definition to categorize SMEs into small and medium enterprises. Firms with employees range between 5–19 employees are categorized as small, whereas firms with 20–99 employees are classified as medium enterprises. We exclude micro (less than five employees) and large (more than 100 employees) firms from our sample. The latest survey data available for sample countries are those from the 2015–2016 survey database.
Table 1 provides the country-wise sample firms’ innovation and financing choices. SMEs from the Philippines are the most innovative (17.32%) in terms of both product and process innovation, followed by Myanmar (8.98%) and Vietnam (8.94%). On the contrary, Thailand and Indonesian SMEs are the least innovative. Moreover, SMEs from Cambodia, Vietnam, and the Philippines engage in product innovation relatively more than other ASEAN countries, whereas Malaysian, Philippines, and Cambodian SMEs pursue more process innovation. Additionally, Panel B in Table 1 presents the industry level product and process innovation that show SMEs in electronic, chemical and chemical products, and rubber and plastic products industries engage in both product and process innovation. To a varying degree, these industries also show a higher engagement individually in product or process innovation. These figures show that the pattern of product and process innovation varies among ASEAN countries. Additionally, the pattern of innovation activities varies in individual industries, indicating that the innovation activities could have varying impact on organizational financial needs that will influence their likelihood of accessing formal finance.
Panel A in Table 1 presents the use of formal and informal financing choices by SMEs in ASEAN countries. The result shows SMEs from Vietnam, Malaysia, and the Philippines relatively use a higher percentage of formal financing. Conversely, SMEs from Laos, Myanmar and Cambodia use a higher percentage of informal financing. Greater use of formal financing by Malaysian and Vietnamese SMEs correlate with the availability of credit for private sectors in these economies. On the other hand, the higher relative use of informal credit by SMEs from Myanmar and Cambodia correlate with the lower ratio of domestic credit to GDP in these countries. Furthermore, the GDP per capita shows that Malaysia outperforms other countries by a large number.

3.3. Empirical Method

The data description shows a varying level of innovation practices across our sample SMEs that raise concerns about measuring the likelihood of utilizing formal finance based on innovation type that an organization selects. Additionally, the choice of innovation also depends on many firm- and market-level characteristics, as discussed in the literature (see Archer et al. 2020; Lee et al. 2015; Wellalage and Fernandez 2019). To measure the impact of innovation activity on firm performance, access to finance or export performance, existing studies use an indicator variable and divide organizations into innovators and non-innovators (Lee et al. 2015; Polo Otero et al. 2018). This strategy results in potential loss of information since organizations have varying innovation activities that range from just product/service or process innovation to both product and process innovation.
The shortcoming of the dummy variable approach indicates the need to employ estimation techniques that can capture the effect of multivalued treatments. McCaffrey et al. (2013) introduced the multiple treatment effect methodology that provides the benefit of using multivalued treatment variables without losing valuable information. Following McCaffrey et al. (2013), we apply a four-step methodology to capture the causal effects of multiple innovation treatments. In the first step, we estimate propensity score weights using generalized boosted models to create a treatment group that is analogous to the control group on several covariates. For example, we use firm-level variables that may affect the innovation and financing choices of a firm as pre-treatment covariates. The second step assesses the overlap and balance between treated and non-treated group weights to ascertain the conditions of sufficient overlap and balance. Further, in step three, we use the population-standardized bias (PSB) statistic to calculate differences in unweighted and weighted propensity scores to establish the efficiency of the propensity score weighting (PSW) process. Accordingly, we calculate population standardized bias statistic (PSB) to evaluate the balance of the weighted and unweighted propensity scores. The PSB statistic is calculated as follows:
PSB = [ X ¯ ij X ¯ ip ] / σ ip
where X ¯ ij represent the PSW mean of the covariate i; X ¯ ip and σip denotes the unweighted sample mean and standard deviation of the covariate across all innovation treatments. Conventionally, any PSB statistic values larger 0.20 indicates potential imbalance (McCaffrey et al. 2004). The average treatment effect (ATE) is a commonly used technique to measure the causal effects under the multivalued treatment context.
Finally, after assessing the conditions of propensity score weights, we estimate the average treatment effect of innovation choices on the likelihood of accessing formal finance by sample SMEs. We are interested in measuring the treatment effect of an innovation choice on the likelihood of using formal finance by the SMEs that are engaged in that innovation choice compared to the treatment effects of other innovation choices. For example, we use ATE to compare the average likelihood of using formal finance given that all the observed SMEs are engaged in process innovation against the sample where all the observed SMEs are engaged in product innovation. Therefore,
ATE = P (F[3]) − P (F[2]) = β3 − β2
where P symbolizes the likelihood of using formal finance and F represents the use of formal finance. For example, P(F[3]) is the likelihood of using formal finance if the given firm engages in process innovation. Additionally, βk symbolizes the likelihood of all the SMEs engage in formal financing given that they are engaged in k innovation activity. Thus, ATE of process innovation relative to product innovation equals β3 − β2. We estimate six pairwise ATEs as: β2 − β1, β3 − β1, β4 − β1, β3 − β2, β4 − β2, and β4 − β3.
Moreover, in terms of measuring the likelihood of using formal finance by innovating SMEs, our choice of ATE is more appropriate compared to other treatment effect methods such as average treated on the treated (ATT). According to McCaffrey et al. (2013), under the ATT method, each treatment is assessed only in the cases it treats. For example, the ATT method measures the likelihood of using formal finance by process innovation SMEs compared to a contractual control group. However, we are interested in measuring the treatment effect of an innovation choice on the likelihood of using formal finance by the SMEs that are engaged in that innovation choice compared to the treatment effects of other innovation choices. In this context, ATE is the appropriate estimation method.

4. Results and Discussion

4.1. Descriptive Statistics

Table 2 presents the descriptive statistics of the study variables and pairwise mean differences of the variables related to innovation types. The mean values of formal and informal financing show that SMEs in our sample countries use a higher proportion of informal financing (70%) compared to formal financing (30%). Additionally, the leverage variable shows SMEs on average only finance 22.85% of their assets with bank and non-banking financial institution sources. The mean values of female ownership and top management positions show that females own 44.3% of SMEs and hold top management positions in 33.2% of the establishments; however, the higher standard deviation values indicate that this pattern of ownership is highly diverse in our sample countries. On the contrary, we observe very low foreign ownership for the sample firms, indicating that domestic investors own most of the small and medium businesses. Moreover, the average age of firms and years of top management experience show similar values, indicating that owners of the business hold top management positions in the business, which is a normal practice in SME establishments around the world. Further, the mean value (1.95%) of sales growth variables shows lower growth rates of the SMEs in ASEAN countries. Likewise, the firm size also exhibits significant pairwise mean difference among innovator and non-innovators. Significant pairwise mean differences on various firm characteristics indicate that assessing the impact of innovation engagement on the use of formal finance without accounting for these difference would result in bias estimations. Therefore, this study uses propensity score estimation process to generate a control sample that is analogous to the treated sample.

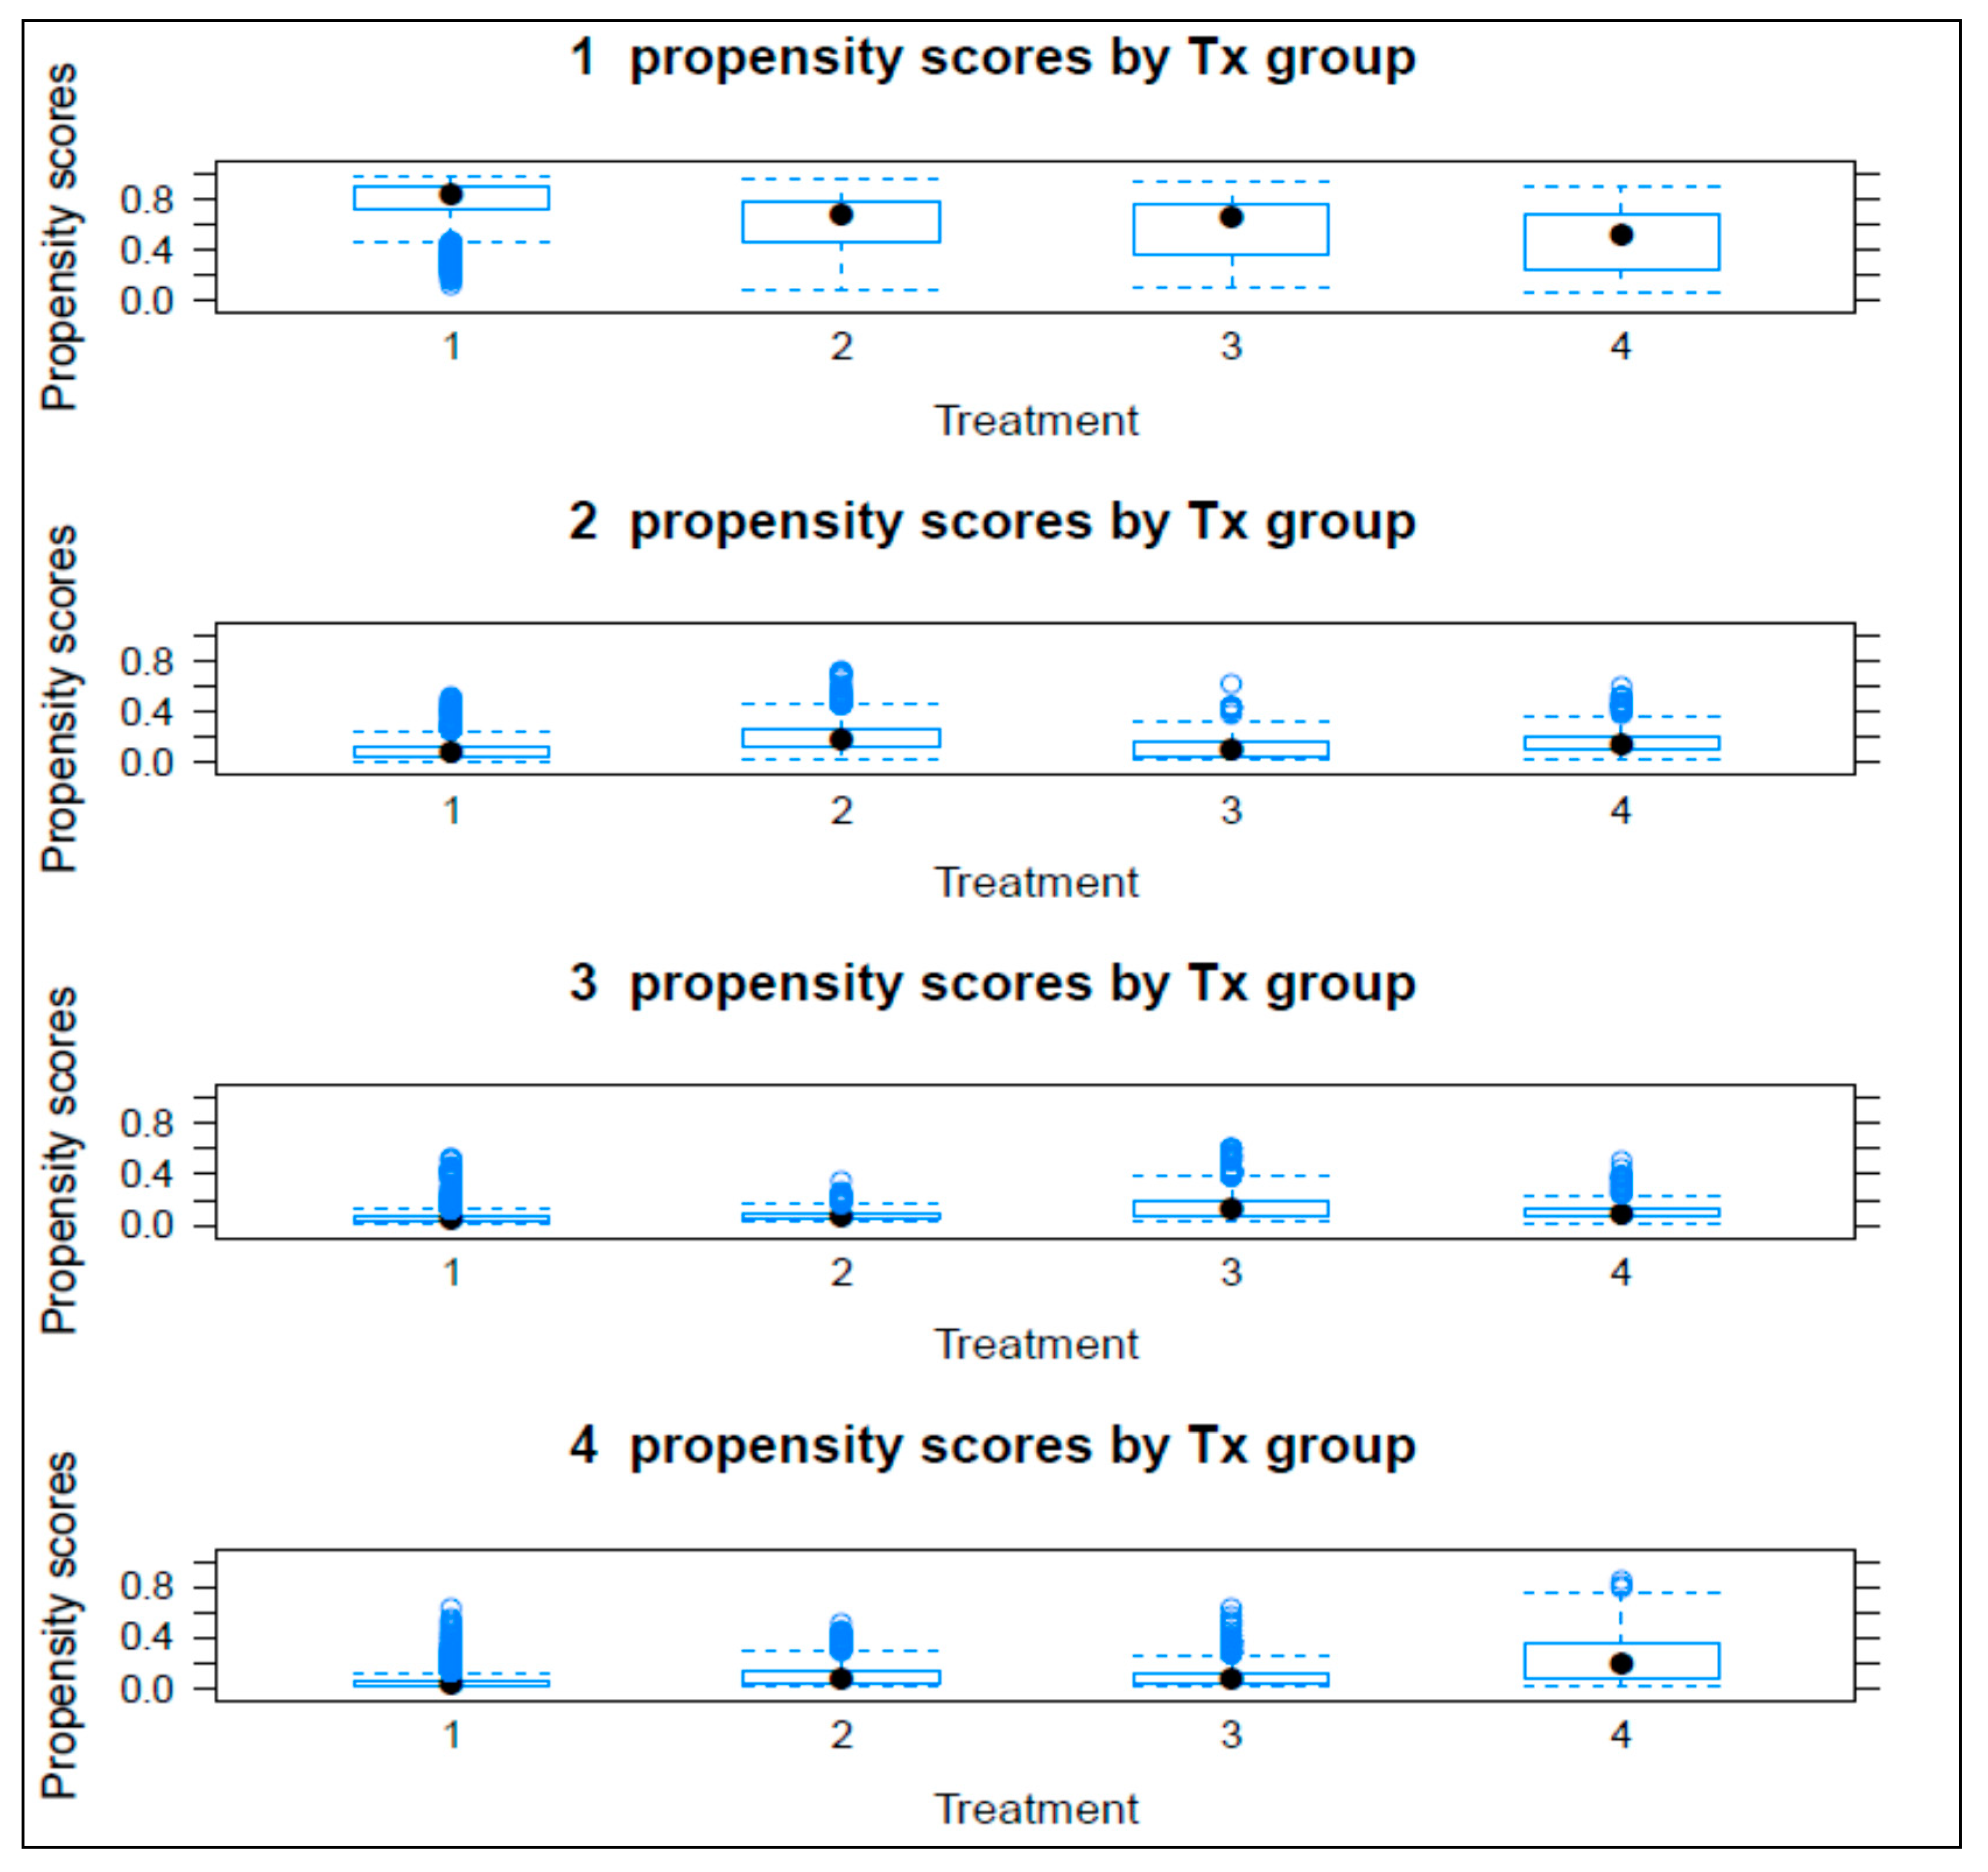
4.2. Balance and Overlap Results

The SMEs in our sample are engaged in various innovation activities. These innovation activities are employed as treatments that an SME received based on its innovation activity. Subsequently, we use the generalized boosted model (GBM) method to estimate propensity scores for SMEs engaged in different types of innovation activities (treatments). However, before estimating the causal effect of innovation treatments on the likelihood of using formal finance, we assess the balance and overlap of treatment groups to ascertain whether these groups are sufficiently similar. According to McCaffrey et al. (2013), balance and sufficient overlap of the treatment groups are preconditions to support the causal estimands. Table 3 presents the unweighted and weighted means of each covariate along with PSB statistics. We observe significant imbalance in unweighted means as shown by the PSB statistic values (greater than 0.2). For example, the unweighted mean (0.043) of research and development expenditure for non-innovators shows a significant difference compared to the overall mean (0.121) expenditures of the sample SMEs. Similarly, innovating firms, regardless of their innovation activity, also show significant differences in unweighted mean for the research and development variable compared to the overall mean of research and development for the sample SMEs.
Moreover, the SMEs that engaged in process (product and process) innovation show significant differences from the overall population for five (three) out of ten covariates, which indicates that these SMEs are very different from our sample SMEs. However, the weighted mean values show that there are no significant differences in weighted mean values for all covariates, as indicated by PSB statistic values. Furthermore, we assess the overlap condition using box plots presented in Figure A1 (see Appendix A). The box plots show weighted propensity scores of each treatment (innovation) activity against other activities. For example, the first box in Figure A1 shows the propensity scores of product and process innovators against the other innovators and non-innovator SMEs. The process continues for other treatments groups, and box plots graphically show their weighted scores against other treatment groups. A thorough look at the box plots shows sufficient overlap between treatment groups, signifying that overlap assumption of the PSW method is satisfied. These observation show that the PSW process has successfully created balanced control and treatment samples that are suitable for causal effect analysis.

4.3. Causal Effects Analysis

We use the average treatment effect (ATE) to evaluate the causal effects of innovation treatments on the likelihood of accessing formal finance. We set the non-innovative SMEs as the base group; as a result, the estimated effect of product and process innovation on the likelihood of using formal finance equals the weighted mean of product and process innovating SMEs minus the weighted mean of non-innovating SMEs. Similarly, the estimated effect of product (process) innovation on the likelihood of using formal finance equals the weighted mean of the product (process) innovating SMEs minus the weighted mean of non-innovating SMEs. Column 1 in Table 4 shows the estimated results of the weighted logistic model on the effect innovation treatments, exhibiting a significant positive impact of product and process innovation engagement on the likelihood of accessing formal financing sources. Specifically, SMEs engaged simultaneously in product and process innovation are 1.91 times more likely to use formal finance compared to non-innovating SMEs. Moreover, there is no significant impact of product/service or process innovation on prospects of using formal finance compared to non-innovators. For comparison purpose, we also present logistics regression results for the unweighted sample in Column 2 in Table 4. These results show a relatively higher likelihood of formal finance use by product- and process-innovating SMEs compared to non-innovators SMEs.
Additionally, SMEs engaged in only one type of (product or process) innovation also show a higher likelihood of using formal finance compared to non-innovators SMEs. The comparative analysis further strengthens our argument that there are inherent differences in innovator SMEs, and any casual analysis without adjusting these differences would result in bias estimations. Further, Table 5 presents the pairwise coefficient differences in the likelihood of using formal finance for weighted logistic regression. The results show that the SMEs engaged in product and process innovation are more likely to use formal financing compared to SMEs that are only involved in one type (product or process) of innovation activity. These findings suggest that highly innovative SMEs such as technology and electronic businesses would need more formal financing primarily due to higher research and development expenditures.

4.4. Additional Analysis

We perform additional subsample analysis separately for younger and older firms. Table 4 (columns 3 and 4) shows similar results as our baseline results. Moreover, we find younger innovative SMEs to have a higher likelihood of using formal finance compared to older innovative SMEs (2.100 vs. 1.715). Our results corroborate with existing literature that shows that younger innovative SMEs choose formal financing due to the inherent risk in innovation activities (Schäfer et al. 2004). Moreover, Nielen (2016) reports a higher demand of trade credits among young and small innovative SMEs. Subsequently, we perform a subsample analysis for small and medium firms separately. The results in Table 4 (columns 5 and 6) correlate with our baseline results and, to some extent, show relatively lower likelihood (1.667 vs. 2.024) for small firms using formal finance compared to medium firms. Hence, our subsample analysis suggests that younger and medium-size product- and process-innovating SMEs are more likely to use formal finance.

4.5. Robustness Test

Cuong (2013) suggests that controlling for imbalanced covariate in the post-propensity score casual estimations can be achieved by adding the imbalanced covariates in the weighted regression model. Although our PSW estimation shows that firm-level covariates are completely balanced in the weighted sample (see Table 4), we perform doubly robust analysis by including firm- as well as country-level variables. Moreover, we also control for country- and industry-fixed effects that may influence the likelihood of using formal finance. The doubly robust results presented in Table 6 confirm our baseline results regarding the higher likelihood of using formal finance among product and process innovators and show no differences in the likelihood of using formal finance for SMEs that pursue only one type of innovation.

5. Conclusions

This study uses a representative sample of ASEAN SMEs to provide evidence on the likelihood of innovative SMEs using formal finance. To this end, we classify ASEAN SMEs into four categories, namely non-innovators, product, process, and product and process innovator SMEs. Next, we perform PSW analysis to adjust for inherent differences in the different type of innovative SMEs based on their ownership structure, gender diversity, firm size, leverage, growth, and research and development expenditure. The PSW analysis generates analogues treatment and control groups that satisfy the conditions of sufficient balance and overlap.
Using propensity score balanced groups of innovator SMEs; we perform causal effect analysis by employing the ATE approach to measure the likelihood of using formal finance among different types of innovative SMEs compared to non-innovators. Our ATE results reveal that SMEs simultaneously engaged in both product and process innovation show higher likelihood of using formal finance compared to non-innovators. However, SMEs perusing only product/service or process innovation do not show any significant differences in using formal finance compared to non-innovators. Additionally, our pairwise analysis shows that product and process innovators also exhibit a higher likelihood of using formal finance than product/service or process innovators. Furthermore, younger and medium-size product and process innovating SMEs are more likely to use formal finance. These results are robust for different subsamples and firm- and country-level controls.
Our findings provide novel insights about the likelihood of using formal finance among innovator SMEs and provide useful implication for creditors and regulators, specifically in the context of ASEAN countries. Our result suggests that SMEs engaged in electronics, chemicals and other technology-based business are more likely to access formal finance. This finding can be used to facilitate and direct strategies that are set in the current SME development plan in order to promote technology adoption, innovation and access to finance among ASEAN SMEs. Moreover, creditors can use these findings to devise their financing strategies to provide financing to innovative SMEs.

Author Contributions

Conceptualization, M.A., M.H. and A.S.J.; methodology, M.A., M.H.; software, M.A.; validation, M.A., M.H.; formal analysis, M.A.; resources, M.A., S.A.; data curation, M.A.; writing—original draft preparation, M.A., M.H. and A.S.J.; writing—review and editing, M.A., M.H., A.S.J., C.G.; visualization, M.A.; supervision, C.G.; project administration, S.A.; funding acquisition, S.A. All authors have read and agreed to the published version of the manuscript.

Funding

This research received no external funding.

Conflicts of Interest

The authors declare no conflict of interest.

Appendix A

Table A1. Variables definitions.
VariableDefinition
Non-innovatorsA firm that did not introduce a new or significantly improved product or process in the last three years.
Product InnovationA firm that introduced new or significantly improved product/service in the last three years.
Process InnovationA firm that introduced a new or significantly improved process in the last three years.
Product and Process InnovationA firm that introduced new or significantly improved product/service and process in the last three years.
Formal FinanceA loan from a bank or non-banking financial institution
Informal FinanceA loan from loans from informal sources such as friends, family and trade credits
Firm AgeNumber of years since the establishment of the firm
Firm SizeLog of the total value of assets.
Foreign ownershipPercentage of foreign ownership
Female ownershipDummy variables that take the value one if SME has a female owner and zero otherwise
Female top managerDummy variables that take the value one if SME has a top female manager and zero otherwise
Manager experienceNumber of years a manager has been a top manager
Time spent with government officialsTime spent by senior management in a week dealing with government officials to meet the requirements imposed by respective governments.
Development of credit markets:Private credit by deposit money banks and other financial institutions to GDP (%)
The efficiency of the legal systemWorld bank strength of legal rights index score
GDP per capitaGDP per capita in US dollar
Figure A1. Overlap plots. Note: Figure A1 presents the overlap of propensity scores of each treatment group with other treatment groups. 1, 2, 3, and 4 represent non-innovators, product innovators, process innovators and product-and-process innovators, respectively.
Jrfm 13 00222 g0a1

References

  1. Abdesamed, Khalid, and Kalsom Abd Wahab. 2012. Do experience, Education and Business plan influence SMEs start-up Bank loan? The Case of Libya. Australian Journal of Basic and Applied Sciences 6: 234–39. [Google Scholar]
  2. Abor, Joshua, and Nicholas Biekpe. 2007. Corporate governance, ownership structure and performance of SMEs in Ghana: Implications for financing opportunities. Corporate Governance: The International Journal of Business in Society 7: 288–300. [Google Scholar] [CrossRef]
  3. Acemoglu, Daron, Philippe Aghion, and Fabrizio Zilibotti. 2006. Distance to frontier, selection, and economic growth. Journal of the European Economic Association 4: 37–74. [Google Scholar] [CrossRef]
  4. Adegboye, Abidemi C., and Samuel Iweriebor. 2018. Does access to finance enhance SME innovation and productivity in Nigeria? Evidence from the World Bank Enterprise Survey. African Development Review 30: 449–61. [Google Scholar] [CrossRef]
  5. Archer, Lan Thanh, Parmendra Sharma, and Jen-Je Su. 2020. Do credit constraints always impede innovation? Empirical evidence from Vietnamese SMEs. Applied Economics 52: 4864–80. [Google Scholar] [CrossRef]
  6. Armendáriz, Beatriz, and Jonathan Morduch. 2010. The Economics of Microfinance. Cambridge: MIT Press. [Google Scholar]
  7. Ayyaga, Meghana, Asli Demirguc-Kunt, and Vojislav Maksimovic. 2011. Firm innovation in emerging markets: The role of finance, governance, and competition. Journal of Financial and Quantitative Analysis 46: 1545–80. [Google Scholar] [CrossRef] [Green Version]
  8. Ayyagari, Meghana, Asli Demirguc-Kunt, and Vojislav Maksimovic. 2014. Bribe payments and innovation in developing countries: Are innovating firms disproportionately affected? Journal of Financial and Quantitative Analysis 49: 51–75. [Google Scholar] [CrossRef] [Green Version]
  9. Barbu, Teodora Cristina, Raluca Crina Bucur, Cosmin Octavian Cepoi, and Adina Ionela Străchinaru. 2019. Is the Increase on SMEs’ Access to Finance in the Capital Markets Union Context Real? An Empirical Investigation. Ekonomicky Casopis 67: 245–63. [Google Scholar]
  10. Bardasi, Elena, Shwetlena Sabarwal, and Katherine Terrell. 2011. How do female entrepreneurs perform? Evidence from three developing regions. Small Business Economics 37: 417. [Google Scholar] [CrossRef]
  11. Beck, Thorsten, and Asli Demirguc-Kunt. 2006. Small and medium-size enterprises: Access to finance as a growth constraint. Journal of Banking & Finance 30: 2931–43. [Google Scholar] [CrossRef]
  12. Beck, Thorsten, Asli Demirgüç-Kunt, and Vojislav Maksimovic. 2008. Financing patterns around the world: Are small firms different? Journal of Financial Economics 89: 467–87. [Google Scholar] [CrossRef] [Green Version]
  13. Berger, Allen N., and Gregory F. Udell. 1998. The economics of small business finance: The roles of private equity and debt markets in the financial growth cycle. Journal of Banking & Finance 22: 613–73. [Google Scholar]
  14. Bongini, Paola, Annalisa Ferrando, Emanuele Rossi, and Monica Rossolini. 2019. SME access to market-based finance across Eurozone countries. Small Business Economics, 1–31. [Google Scholar] [CrossRef]
  15. Botrić, Valerija, and Ljiljana Božić. 2017. Access to Finance: Innovative Firms Perceptions in Post-Transition EU Members. Liberec: Technická univerzita v Liberci. [Google Scholar]
  16. Brown, James R., Gustav Martinsson, and Bruce C. Petersen. 2013. Law, stock markets, and innovation. The Journal of Finance 68: 1517–49. [Google Scholar] [CrossRef] [Green Version]
  17. Carey, Mark S., and Stephen D. Prowse. 1993. John Rea and Gregory F. Udell, “The Economics of Private Placements: A New Look”. Financial Markets, Institutions and Instruments 2: 1–67. [Google Scholar]
  18. Coleman, Susan. 2004. The “Liability of Newness” and Small Firm Access to Debt Capital: Is There a Link? The Journal of Entrepreneurial Finance 9: 37–60. [Google Scholar]
  19. Cornaggia, Jess, Yifei Mao, Xuan Tian, and Brian Wolfe. 2015. Does banking competition affect innovation? Journal of Financial Economics 115: 189–209. [Google Scholar] [CrossRef] [Green Version]
  20. Cornelli, Cornelli, Vukile Davidson, and Jon Frost. 2019. SME Finance in Asia: Recent Innovations in Fintech Credit, Trade Finance, and Beyond. Tokyo: Asian Development Bank Institute. [Google Scholar]
  21. Cuong, Nguyen Viet. 2013. Which covariates should be controlled in propensity score matching? Evidence from a simulation study. Statistica Neerlandica 67: 169–80. [Google Scholar] [CrossRef] [Green Version]
  22. Degryse, Hans, Olivier De Jonghe, Sanja Jakovljević, Klaas Mulier, and Glenn Schepens. 2017. The impact of bank shocks on firm-level outcomes and bank risk-taking. Paper presented at the Twelfth Young Economists’ Seminar, Dubrovnik, Croatia, June 3–6. [Google Scholar]
  23. del Brío, Jesús Ángel, and Beatriz Junquera. 2003. A review of the literature on environmental innovation management in SMEs: Implications for public policies. Technovation 23: 939–48. [Google Scholar] [CrossRef]
  24. Fatoki, Olawale. 2014. External environmental factors impacting on access to debt finance by small and medium enterprises in South Africa. Mediterranean Journal of Social Sciences 5: 1013. [Google Scholar] [CrossRef] [Green Version]
  25. Fernandez, Viviana. 2017. The finance of innovation in Latin America. International Review of Financial Analysis. International Review of Financial Analysis 53: 37–47. [Google Scholar] [CrossRef]
  26. Gorodnichenko, Yuriy, and Monika Schnitzer. 2013. Financial constraints and innovation: Why poor countries don’t catch up. Journal of the European Economic Association 11: 1115–52. [Google Scholar] [CrossRef] [Green Version]
  27. Haselmann, Rainer, and Paul Wachtel. 2010. Institutions and bank behavior: Legal environment, legal perception, and the composition of bank lending. Journal of Money, Credit and Banking 42: 965–84. [Google Scholar] [CrossRef]
  28. Hau, Harald, Yi Huang, Hongzhe Shan, and Zixia Sheng. 2018. Fintech credit, financial inclusion and entrepreneurial growth. Unpublished Working Paper. [Google Scholar]
  29. Kijkasiwat, Ploypailin, and Pongsutti Phuensane. 2020. Innovation and Firm Performance: The Moderating and Mediating Roles of Firm Size and Small and Medium Enterprise Finance. Journal of Risk and Financial Management 13: 97. [Google Scholar] [CrossRef]
  30. Kim, Dong-Young, Vinod Kumar, and Uma Kumar. 2012. Relationship between quality management practices and innovation. Journal of Operations Management 30: 295–315. [Google Scholar] [CrossRef]
  31. Kim, Won Joong, Tran Viet Hoi, La Ngoc Tuan, and Nguyen Ngoc Trung. 2019. R&D, training and accessibility to finance for innovation: A case of Vietnam, the country in transition. Asian Journal of Technology Innovation 27: 172–93. [Google Scholar] [CrossRef]
  32. Klewitz, Johanna, and Erik G. Hansen. 2014. Sustainability-oriented innovation of SMEs: A systematic review. Journal of Cleaner Production 65: 57–75. [Google Scholar] [CrossRef]
  33. Lawless, Martina, Brian O’Connell, and Conor M. O’Toole. 2015. Financial structure and diversification of European firms. Applied Economics 47: 2379–98. [Google Scholar] [CrossRef]
  34. Le, Danh Vinh, Huong T. T. Le, Thanh Pham, and Lai Van Vo. 2019. Access to Financing and Innovation in Small and Medium Enterprises in Vietnam. SSRN Electronic Journal. [Google Scholar] [CrossRef]
  35. Lee, Ying-Ying. 2018. Efficient propensity score regression estimators of multivalued treatment effects for the treated. Journal of Econometrics 204: 207–22. [Google Scholar] [CrossRef] [Green Version]
  36. Lee, Neil, Hiba Sameen, and Marc Cowling. 2015. Access to finance for innovative SMEs since the financial crisis. Research Policy 44: 370–80. [Google Scholar] [CrossRef] [Green Version]
  37. Li, Yan, Md. Main Uddin, and Ye An. 2019. Has financial development benefited the performance of publicly traded cultural and creative firms? Evidence from China. Journal of Cultural Economics 44: 351–95. [Google Scholar] [CrossRef]
  38. Lööf, Hans, and Pardis Nabavi. 2016. Innovation and credit constraints: Evidence from Swedish exporting firms. Economics of Innovation and New Technology 25: 269–82. [Google Scholar] [CrossRef]
  39. Mancusi, Maria Luisa, and Andrea Vezzulli. 2010. R&D, Innovation and Liquidity Constraints in Italy. Boston College Working Papers in Economics. Chestnut Hill: Boston College, vol. 442. [Google Scholar]
  40. McCaffrey, Daniel F., Greg Ridgeway, and Andrew R. Morral. 2004. Propensity score estimation with boosted regression for evaluating causal effects in observational studies. Psychological Methods 9: 403. [Google Scholar] [CrossRef] [PubMed] [Green Version]
  41. McCaffrey, Daniel F., Beth Ann Griffin, Daniel Almirall, Mary Ellen Slaughter, Rajeev Ramchand, and Lane F. Burgette. 2013. A tutorial on propensity score estimation for multiple treatments using generalized boosted models. Statistics in Medicine 32: 3388–414. [Google Scholar] [CrossRef] [Green Version]
  42. Moritz, Alexandra, Joern H. Block, and Andreas Heinz. 2016. Financing patterns of European SMEs–an empirical taxonomy. Venture Capital 18: 115–48. [Google Scholar] [CrossRef]
  43. Nielen, Sebastian. 2016. Product Innovation and Trade Credit Demand and Supply: Evidence from European Countries. In Trade Credit and Temporary Employment. Berlin/Heidelberg: Springer, pp. 23–40. [Google Scholar]
  44. O’Cass, Aron, and Jay Weerawardena. 2009. Examining the role of international entrepreneurship, innovation and international market performance in SME internationalization. European Journal of Marketing 43: 1325–48. [Google Scholar] [CrossRef]
  45. Pagano, Marco, and Ailsa Röell. 1998. The choice of stock ownership structure: Agency costs, monitoring, and the decision to go public. The Quarterly Journal of Economics 113: 187–225. [Google Scholar] [CrossRef]
  46. Palacín-Sánchez, María-José, Francisco-Javier Canto-Cuevas, and Filippo di-Pietro. 2019. Trade credit versus bank credit: A simultaneous analysis in European SMEs. Small Business Economics 53: 1079–96. [Google Scholar] [CrossRef]
  47. Pellegrini, Carlo Bellavite, and Emiliano Sironi. 2017. Does a one-tier board affect firms’ performances? Evidences from Italian unlisted enterprises. Small Business Economics 48: 213–24. [Google Scholar] [CrossRef]
  48. Pham, Tho, and Oleksandr Talavera. 2018. Discrimination, social capital, and financial constraints: The case of Viet Nam. World Development 102: 228–42. [Google Scholar] [CrossRef] [Green Version]
  49. Polo Otero, Jose Luis, Jose Luis Ramos Ruiz, Aquiles Antonio Arrieta Barcasnegras, and Natalia Ramirez Arbelaez. 2018. Impacto de la innovación sobre la conducta exportadora en el sector de alimentos y bebidas de Colombia. Revista de Análisis Económico 33: 89–120. [Google Scholar] [CrossRef]
  50. Qamruzzaman, Md., and Wei Jianguo. 2019. SME financing innovation and SME development in Bangladesh: An application of ARDL. Journal of Small Business & Entrepreneurship 31: 521–45. [Google Scholar] [CrossRef]
  51. Rajan, Raghuram G. 1992. Insiders and outsiders: The choice between informed and arm’s-length debt. The Journal of Finance 47: 1367–400. [Google Scholar] [CrossRef]
  52. Rosenbaum, Paul R., and Donald B. Rubin. 1983. The central role of the propensity score in observational studies for causal effects. Biometrika 70: 41–55. [Google Scholar] [CrossRef]
  53. Sasidharan, Subash, P. J. Jijo Lukose, and Surenderrao Komera. 2015. Financing constraints and investments in R&D: Evidence from Indian manufacturing firms. The Quarterly Review of Economics and Finance 55: 28–39. [Google Scholar] [CrossRef]
  54. Schäfer, Dorothea, Axel Werwatz, and Zimmermann Volker. 2004. The determinants of debt and (private) equity financing: The case of young, innovative SMEs from Germany. Industry and Innovation 11: 225–48. [Google Scholar] [CrossRef]
  55. Shashi, Piera Centobelli, Roberto Cerchione, and Rajwinder Singh. 2019. The impact of leanness and innovativeness on environmental and financial performance: Insights from Indian SMEs. International Journal of Production Economics 212: 111–24. [Google Scholar] [CrossRef]
  56. Shi, Liangxing, Xiangyu Wang, Hongyi Sun, and Zhen He. 2018. The impact of technological innovation on product quality: The moderating role of firm size. Total Quality Management & Business Excellence 29: 746–61. [Google Scholar] [CrossRef]
  57. Vuong, Quan-Hoang. 2019. The financial economy of Viet Nam in an age of reform, 1986–2016. In Routledge Handbook of Banking and Finance in Asia. London: Routledge, pp. 201–22. [Google Scholar]
  58. Wagner, Joachim, and John P. Weche Gelübcke. 2015. Access to finance, foreign ownership and foreign takeovers in Germany. Applied Economics 47: 3092–112. [Google Scholar] [CrossRef] [Green Version]
  59. Wang, Yao. 2016. What are the biggest obstacles to growth of SMEs in developing countries?—An empirical evidence from an enterprise survey. Borsa Istanbul Review 16: 167–76. [Google Scholar] [CrossRef] [Green Version]
  60. Wellalage, Nirosha Hewa, and Viviana Fernandez. 2019. Innovation and SME finance: Evidence from developing countries. International Review of Financial Analysis. [Google Scholar] [CrossRef]
  61. Wellalage, Nirosha Hewa, and Krishna Reddy. 2020. Determinants of profit reinvestment undertaken by SMEs in the small island countries. Global Finance Journal 43: 100394. [Google Scholar] [CrossRef]
  62. Wu, Jie, Steven Si, and Xiaobo Wu. 2016. Entrepreneurial Finance and Innovation: Informal Debt as an Empirical Case. Strategic Entrepreneurship Journal 10: 257–73. [Google Scholar] [CrossRef]
  63. Yazdanfar, Darush, and Sara Turner. 2012. The structure of external financing at start-up stage: The differences between Swedish female-and male-owned firms. International Journal of Business and Globalization 9: 157–70. [Google Scholar] [CrossRef]
  64. Lin, Justin Yifu, and Xifang Sun. 2006. Information, Informal Finance, and SME Financing. Frontiers of Economics in China 1: 69–82. [Google Scholar] [CrossRef]
1
The OECD defines marketing and organizational innovations in the Oslo Manual (2005).
2
Radical innovation has been investigated long before the Klewitz and Hansen (2014) study.
Table 1. Country- and industry-wise description innovation and financing choices.
Panel A—Country-Wise Data Description
CountryFreq.ProductProcessProduct and ProcessFormalInformalPrivate Credit to GDPGDP per CapitaStrength of Legal Rights
Thailand4656.2%4.3%3.2%21.5%78.5%147.1%37693
Myanmar47910.0%7.3%9.0%17.1%82.9%16.0%1192.52
Cambodia25522.7%10.2%5.5%19.2%80.8%56.5%75010
Lao PDR30714.0%2.6%5.9%14.7%85.3% 8186
Vietnam68220.1%6.0%8.9%48.4%51.6%102.8%10787
Indonesia8887.8%1.8%1.8%30.7%69.3%36.0%18546
Philippines76818.1%11.5%17.3%32.7%67.3%39.5%16621
Malaysia6972.6%15.4%4.9%35.9%64.1%119.6%73657
Average 12.7%7.4%7.1%27.5%72.5%73.9%23115
Panel B—Industry-Wise Innovation Engagement
IndustryCountPercentBothProcessProduct
Apparel932.05%1.08%2.15%11.96%
Chemical Products992.18%6.06%19.39%8.25%
Chemicals992.18%3.03%5.10%6.12%
Chemicals and Chemical Products1022.25%17.65%27.72%37.25%
Electrical and Communications701.54%4.29%5.88%7.25%
Electronic Products1182.60%7.63%25.42%9.32%
Electronics952.09%18.95%31.91%35.48%
Fabricated Metal Products2024.45%12.38%25.25%31.68%
Food2635.79%8.75%14.07%24.81%
Food and Beverages861.89%5.36%15.18%9.01%
Food Products1122.47%3.49%10.59%12.79%
Garments2715.97%7.75%13.28%26.30%
Manufacturing46510.24%7.96%14.90%19.91%
Non-Metallic Mineral Products1092.40%1.83%2.75%6.42%
Non-Metallic Mineral Products841.85%11.90%21.43%33.73%
Other Manufacturing4149.12%8.70%17.76%21.52%
Other Services71515.75%6.71%13.28%19.10%
Retail56112.35%7.13%13.46%20.94%
Retail Trade831.83%2.41%19.28%3.61%
Rubber and Plastics Products801.76%15.00%28.75%37.50%
Rubber and Plastics2034.47%2.46%5.47%7.92%
Textiles1082.38%1.85%2.78%14.81%
Wearing Apparel1092.40%3.67%22.22%8.33%
Note: Table 1 presents the country and industry-wise innovation engagement and financing choices of the sample SMEs. Country-level variables, percentage of private credit to GDP, GDP per capita and strength of legal rights index scores are also included. PDR means People’s Democratic Republic.
Table 2. Descriptive statistics and pairwise mean differences.
VariableMeanStd. Dev.2 vs. 13 vs. 14 vs. 13 vs. 24 vs. 24 vs. 3
Informal0.6960.46−0.083−0.126−0.043−0.2−0.117−0.074
(−3.939)(−4.864)(−1.359)(−7.652)−3.688(−2.113)
Formal0.3040.460.0830.1260.0430.20.1170.074
(3.939)(4.864)(1.359)(7.652)(3.688)(2.113)
Leverage22.8530.0−2.257−12.25−9.993−7.249−4.9925.001
(−1.630)(−7.213)(−4.839)(−4.228)(−2.402)(2.175)
Research and development0.1210.320.2060.2830.0770.4520.2460.169
(14.303)(15.945)(3.559)(24.734)(11.179)(6.959)
Foreign ownership3.97014.9−1.0150.9121.9281.1622.1770.249
(−1.461)(1.07)(1.859)(1.349)(2.086)(0.216)
Female ownership0.4430.49−0.0030.0910.0940.170.1730.079
(−0.130)(3.1960)(2.716)(5.938)(4.984)(2.062)
Female top manager0.3320.47−0.016−0.017−0.001−0.0130.0030.004
(−0.747)(−0.637)(−0.024)(−0.492)(0.093)(0.105)
Age17.2611.20.144−0.56−0.7041.7911.6482.352
(−0.276)(−0.878)(−0.906)(2.772)(2.103)(2.717)
Years of experience16.6939.891.62−2.038−3.6581.7210.1023.761
(−3.507)(−3.563)(−5.282)(2.983)(0.146)(4.857)
Total Asset18.1133.530.123(−1.33)(−1.453)(−0.309)(−0.432)(−1.021)
(−0.568)(−4.767)(−4.367)(−1.168)(−1.344)(−2.794)
Sales Growth1.9526.40−0.28−0.1920.088−0.1070.1730.085
(−0.941)(−0.526)(0.198)(−0.290)(0.388)(0.173)
Note: Table 2 presents the mean and standard deviation of the firm and country-level variables. Statistically significant t-statistic values are bold text. See Table A1 for variables description.
Table 3. Mean values for covariates in unweighted and weighted samples.
CovariatesP and P
Innov.
Non-Innov.Process
Innov.
Product
Innov.
P and P
Innov.
Non-Innov.Process
Innov.
Product
Innov.
MeanSD
Foreign ownership3.942.924.855.103.873.153.523.973.9714.99
(0.00)(0.07)(0.06)(0.08)(0.01)(0.06)(0.03)(0.00)
Age17.1617.3016.6018.9517.2216.9116.3115.7317.2711.22
(0.01)(0.00)(0.06)(0.15)(0.01)(0.03)(0.09)(0.14)
Female owner0.420.420.520.590.450.430.450.500.440.50
(0.04)(0.04)(0.14)(0.30) **(0.01)(0.03)(0.02)(0.11)
Years of experience 16.5218.1414.4818.2416.6216.6615.4215.6416.699.89
(0.02)(0.15)(0.22) ***(0.16)(0.01)(0.00)(0.13)(0.11)
Female top manager0.340.320.320.320.330.330.300.310.330.47
(0.01)(0.03)(0.03)(0.02)(0.00)(0.00)(0.06)(0.05)
Research and development0.040.250.330.500.110.130.160.160.120.33
(0.24) **(0.39) **(0.63) *(1.15) *(0.04)(0.02)(0.11)(0.02)
Time spent with govt. official4.014.517.977.684.584.715.406.4614.834.63
(0.040)(0.01)(0.23) *(0.21) *(0.00)(0.01)(0.05)(0.12)
Firm size18.2218.3416.8917.9118.1018.0717.8818.1218.113.54
(0.03)(0.06)(0.35) *(0.06)(0.00)(0.01)(0.07)(0.00)
Firm growth2.011.731.821.901.951.831.762.181.956.41
(0.01)(0.04)(0.02)(0.01)(0.00)(0.02)(0.03)(0.04)
Leverage78.8776.6166.6271.6277.5975.7773.7771.4777.1530.07
(0.06)(0.02)(0.35) *(0.18)(0.02)(0.05)(0.11)(0.19)
Note: Table 3 presents the mean values of weighted and unweighted samples. Population-standardized bias (PSB) statistics are in parenthesis. *, **, *** shows significant PSB statistics values at 10%, 5% and 1%, respectively. Last two columns show the mean and standard deviation of covariates for the pooled full sample. See Table A1 for variables description. P and P means product and process.
Table 4. Logistic regression coefficients.
VariablesWeighted LogisticUnweighted LogisticYounger SMEsOlder SMEsMedium SizeSmall Size
Product and Process Innovation1.918 ***2.400 ***2.100 ***1.715 **2.024 ***1.666 **
(0.309)(−0.279)(0.455)(0.408)(0.453)(0.395)
Process Innovation1.1761.773 ***1.1321.2170.9841.351
(0.163)−0.208(0.224)(0.238)(0.199)(0.256)
Product Innovation1.1201.477 ***1.2371.0011.0631.161
(0.133)−0.144(0.201)(0.173)(0.182)(0.193)
Constant0.418 ***−0.996 ***0.392 ***0.447 ***0.548 ***0.333 ***
(0.0173)(0.039)(0.0225)(0.0267)(0.0341)(0.0186)
Observations454145412374216719942547
Note: Table 4 presents the weighted and unweighted full and subsample logistic regression results. Standard errors in parentheses. ***, **, * represent statistical significance at 1%, 5% and 10%, respectively.
Table 5. Pairwise coefficients’ contrast of innovation treatment coefficients.
Pairwise ComparisonsContrastStd. Err.t-Statisticp-Value
none vs. product and process −0.1500.039−3.8100.000
process vs. product and process−0.1150.048−2.3900.017
product vs. product and process−0.1260.045−2.7800.005
process vs. none0.0350.0301.1400.254
product vs. none0.0240.0260.9400.345
product vs. process−0.0110.038−0.2800.780
Note: Table 5 shows the pairwise coefficient contrast for weighted logistic regression results.
Table 6. Doubly robust logistic regression estimates.
VariablesFull SampleMedium SizeSmall
Size
Younger SMEsOlder
SMEs
(1)(2)(3)(4)(5)
Product and process innovation1.803 ***1.875 **1.701 *1.815 **1.729 *
(0.356)(0.462)(0.520)(0.484)(0.493)
Process innovation1.0770.8731.2641.0691.129
(0.201)(0.238)(0.321)(0.306)(0.273)
Product innovation1.1891.2181.1881.1241.135
(0.180)(0.252)(0.265)(0.224)(0.287)
Foreign ownership0.9991.0020.985 *0.9891.004
(0.00462)(0.00522)(0.00906)(0.00786)(0.00557)
Female ownership1.0131.3610.7090.8201.533 *
(0.165)(0.315)(0.171)(0.186)(0.338)
Age1.0090.9951.028 **1.0280.990
(0.00683)(0.00858)(0.0111)(0.0280)(0.00906)
Years of experience 1.0041.0060.9950.9831.019 *
(0.00821)(0.0111)(0.0120)(0.0134)(0.0107)
Female top manager1.1170.8611.3671.1870.860
(0.195)(0.205)(0.361)(0.297)(0.206)
Research and development1.2641.2281.2861.3401.365
(0.207)(0.288)(0.320)(0.299)(0.345)
Time spent with govt. author1.007 *1.009 *1.0041.0091.004
(0.00402)(0.00532)(0.00571)(0.00584)(0.00554)
Firm size1.001 ***1.001 ***1.001 ***1.001 ***1.001 ***
(0.000)(0.000)(0.000)(0.000)(0.000)
Firm growth1.0091.0231.0101.0191.003
(0.0112)(0.0158)(0.0159)(0.0155)(0.0158)
Leverage0.974 ***0.967 ***0.975 ***0.978 ***0.964 ***
(0.00255)(0.00339)(0.00315)(0.00317)(0.00352)
Private credit to GDP0.990 *0.9930.9870.9930.989
(0.00590)(0.00836)(0.00832)(0.00993)(0.00768)
GDP per capita1.000 *1.0001.000 *1.0001.000 **
(0.000140)(0.000203)(0.000186)(0.000196)(0.000195)
Strength of legal rights 0.900 *0.832 **0.9310.9710.826 **
(0.0516)(0.0700)(0.0765)(0.0821)(0.0627)
Observations33411548179317661575
Note: Table presents the doubly robust weighted logistics regression results of full and subsamples. See Table A1 for variables description. ***, **, * represent statistical significance at 1%, 5% and 10%, respectively.

