Article

Decomposing the Effect of Domestic and Foreign Economic Policy Uncertainty Shocks on Real and Financial Sectors: Evidence from BRIC Countries

Department of Business Administration, Sukkur IBA University, Sukkur 65200, Pakistan
*
Author to whom correspondence should be addressed.
J. Risk Financial Manag. 2020, 13(12), 315; https://doi.org/10.3390/jrfm13120315
Submission received: 8 September 2020 / Revised: 27 October 2020 / Accepted: 5 November 2020 / Published: 9 December 2020
(This article belongs to the Section Applied Economics and Finance)

Abstract

:
This study examines the impact of domestic and foreign shocks on the real and financial sector of BRIC countries. For this purpose, we use a structural vector autoregressive (SVAR) model over the extended period of 1997 to 2016. We conclude that domestic policy shocks have a more substantial impact on Brazilian, Indian, and Russian economy than foreign shocks, while foreign shocks have more contribution in the case of China. Interestingly, results show the negative impact of policy shocks on bank credit provided, implying its role in multiplying the impact of shocks on real variables. Surprisingly EPU of USA has a positive impact on stock markets of India and China, implying capital flight phenomenon, where investor transfer investment from risky to safer places.

1. Introduction

Deep, widely spreading and long-lasting catastrophes, that is, the 2007–2009 financial crises and euro debt crises agitate their originating economies, which resultantly compel the policymakers to respond and make rapid amendments in economic policies to get back on the track of sustainable growth. That financial cataclysm has created more volatility not only in financial but also in the macroeconomic components, that is, consumption, investment, and inflation. As a result, researchers are focusing on updated measures and approaches to understand the impact of these extraordinary events to pacify their impact on economic and financial activities. Those unusual and disastrous events have turned the attention of researchers towards one of the most influencing economic factors, “uncertainty”, which is closely related to risk conceptually. According to Knight (1921), uncertainty is the inability of people to predict the likelihood of the event’s occurring.
Why uncertainty is most relevant to economic fluctuations? Uncertainty has a direct association with investment and consumption (two major components of GDP), which resultantly creates a substantial impact on the overall business cycle. From the consumption perspective, uncertainty in the labor’s income incites risk-averse behavior, which leads to a reduction in current consumption to ensure future consumption (saving). More uncertainty requires more sacrifice of current consumption for future precautionary savings. Caballero (1990), explains and supports the above-discussed facts that there are co-movements between uncertainty and consumption, and both are negatively related. Additionally, the author also discussed that a jump in uncertainty may cause a substantial drop in consumption. Moving to investment, initially proposed by Keynes (1937), uncertainty is a major cause of reduction in investment. The author elaborates that investment is the most volatile component of aggregate demand because, specifically, it is more judgment based depending on unforeseen future events that are usually ill-informed. In the time of high uncertainty, firms usually postpone the investments in current projects (a behavior known as “wait and see”) until the fog clears (Bernanke 1983; Bloom 2009), which precisely corroborates the facts that there are co-movements between uncertainty and investments and both are negatively related. Additionally, unusual uncertainty jumps may substantially cause a reduction in investments. Conclusively, consumption and investment are negatively affected by uncertainty, hampering the sustainability of economic growth, which is why policymakers are paying more attention to uncertainty. Interestingly, another connection arises here that if policy uncertainty has a conspicuous impact on economic activities, then it certainly would create an impact on financial components. Additionally, modern financial experts reveal that the intrinsic value of any stock is the discounted value of its future dividends. So, uncertainty in economic policies may engender investors’ pessimistic consideration of the future dividend and discount rate (cost of equity), which may lead to lower prices. For instance, Sharpe (2002), finds that inflation (engendered by uncertainty) may negatively affect the stock prices through lower real expected earnings and higher cost of equity. It may give a clue about the negative relationship between policy uncertainty and the stock market.
In order to check the impact on originating countries, many researchers have analyzed the impact of uncertainty shocks on the US and other developed economies. Bloom (2009), postulates through the results of a US study that in the time of high uncertainty, firms prefer to hold the investments which cause drops and rebounds in employment and output in the short term. While in the medium term when the smoke clears (uncertainty dissipates) those firms who adopted a wait and see behavior, adjust their input factors towards the optimal level, which leads to rapid recoveries and overshoot from the original trend level of macro-economic variables. This unusual pause in economic variables also creates another prediction that fiscal and monetary policies have little impact on real economic activity throughout the time of high uncertainty. An economic policy uncertainty index was developed by Baker et al. (2016), it proved that policy-related uncertainty shocks cause a drop in output, investment, and employment. Caggiano et al. (2014), applied nonlinear VAR (Vector Autoregression) to analyze the relationship between uncertainty and economic variables and stated that the impact of uncertainty shocks is amplified during the recessionary period. Nodari (2014), studied how the impact of uncertainty related to financial regulation policies affects the US economy and corporate credit spread.
Twistingly, rapidly increasing financial and trade interaction among the world economies has expanded the role of uncertainty. An uncertainty shock in any country (specially developed) can thunder across the world promptly due to pervasive media, advance technology, and ubiquitous communication channels. So, policy uncertainty shocks not only create disturbance for financial and economic structures of the originating economies but are also transmitted to other economies of the world. Besides, the magnitude of impact becomes substantial when it is originating from one of the world’s leading economies (Forbes and Chinn 2004). Moro (2014), discusses that European crises can quickly spread to other interrelated channels through financial and trade channels. In this regard, some researchers, like Mumtaz and Theodoridis (2015), Gourio et al. (2013), Colombo (2013), and Handley and Limao (2015) analyzed the spillover impact of policy uncertainty shocks. C. H. J. Cheng (2017), studied the domestic and foreign policy uncertainty impact on South Korea’s output and found that foreign policy uncertainty is more influential than domestic. Carrière-Swallow and Céspedes (2013), studied the spillover effect of US policy uncertainty shocks on different developed and developing countries, finding heterogeneous responses from different countries. According to their results, exogenous shock causes more significant and long-lasting drops in private consumption and investment in emerging countries compared with the US and other developed countries. They also corroborated that this heterogeneity in results was because of the less developed financial systems in the developing countries, where fiscal and monetary policies proved to be less effective.
Given the previous empirical research on policy, uncertainty is mainly confined to well-developed countries, whereas very little attention is paid to developing countries. In this regard we want to further explore this area by analyzing the impact of policy uncertainty on BRIC countries, keeping in view their rapidly growing contribution towards the global economy. BRIC encompasses 25% coverage of the overall world’s land, representing roughly 40% of the world’s population and holding approximately more than 15 trillion dollars GDP (PPP) Jawadi et al. (2011). It is also predicted that in the coming 40 years, the BRIC combined economies will be larger in size than the G6 group of countries (US, UK, Japan, France, Italy, and Germany) Cheng et al. (2007). Yang and Samaké (2011), propose that after the US and Europe area, the total GDP of BRIC countries’ economies has now attained the third position, and it is also expected that it will overtake the second position of the Europe area. Moreover, from the terms of trade perspective, the exports from BRIC countries to the rest of the world has substantially increased over the past two decades surpassing the US and rapidly attaining the Europe area position. Keeping in consideration the rapidly increasing integration of BRIC economies with the world economy, an educated guess may suggest that shocks originated from developed economies like the US and Euro area may also have a significant impact on economies of BRIC countries. Forbes and Chinn (2004), suggest that financial linkage and trade between countries play a vital role in defining international spillover.
Though some studies have analyzed the impact of policy uncertainty shocks from advanced economies to BRIC countries, Sheng and Liu (2017) developed an index and studied the impact of macroeconomic uncertainty of the US on the BRICs and the US itself. Using the quantile regression approach, Mensi et al. (2014) applied (CBOE Volatility Index) and analyzed the impact of global factors (S&P 500 index, gold prices, and oil prices). Sum (2012), looks at the response of the stock market of BRIC countries toward the EPU of US.
Looking at the above literature, it seems that none of the studies have considered the role of financial variables while analyzing the foreign and domestic impact of EPU on economic (consumption, investment, inflation) and financial (domestic credit growth and stock market) variables of BRIC countries, as Carrière-Swallow and Céspedes (2013) suggest that financial structure is the major cause of amplifying the impact of uncertainty shocks in emerging countries. Additionally, most of the previous researchers have used uncertainty measures extracted through stochastic volatility in error structure of structural VAR models, while we use EPU, a news-based measure of uncertainty developed by Baker et al. (2016). It seems to be a better measure because we consider daily and monthly data not only for the US but also for other European and emerging economies on various types of macroeconomic and financial uncertainties. It is conveniently and freely available for use without requiring strenuous and complicated estimation models to generate it in the first place.
This paper contributes to the existing literature by answering the following questions:
  • To what extent do shocks of EPU create an impact on the real and financial variables of BRIC economies?
  • Which EPU (foreign or domestic) has a more significant impact on these countries’ economies?
  • How may the domestic credit growth affect the response of the real variables of BRIC countries toward the uncertainty shocks?
To answer these questions, we apply an SVAR model with Bayesian methods and use the EPU index developed by Baker et al. (2016).

2. Literature Review

A huge amount of literature has addressed the impact of uncertainty on business cycle fluctuations. The interest of researchers was reignited toward this topic after sufficient evidence was introduced that there is a rapid increase in uncertainty in the time of recession.
One line of the literature proposes that uncertainty affects business fluctuations through consumption and investment components. Caballero (1990), corroborated the negative association between uncertainty and consumption. Bernanke (1983) and Bloom (2009), proposed a negative relationship between uncertainty and investment. Baker et al. (2016), developed an index to measure economic policy uncertainty and study its impact on US output. The author suggests that uncertainty shocks negatively affect employment, investment, and overall output. Moreover, uncertainty in economic policies may affect the financial sector of a country, for example; inflation may lead to lower stock prices. Theoretically, inflation should increase the stock prices by increasing the nominal value of real capital (Campbell and Shiller 1988). However, many empirical studies indicate a negative relationship among inflation and stock prices as higher inflation expectations also lead to an increase in the required rate of return by investors and a decrease in real expected earnings (Bodie 1976; Fama and Schwert 1977; Schwert 1981). Caggiano et al. (2014), applied the non-linear VAR (Vector Autoregression) model and found that uncertainty shocks have a significantly larger impact on unemployment during the recessionary period. Some of the studies analyze the interaction of uncertainty and financial frictions. Alessandri and Mumtaz (2014), estimated a nonlinear VAR and suggested that the impact of uncertainty on real activity is stronger in the time of financial distress. Applying the SVAR model, Caldara et al. (2016) separately identified the financial shocks and uncertainty and found that both of them have a strong contribution in driving the US business cycle.
The other strand of the research pays attention to the spillovers of uncertainty shocks across different economies. Mumtaz and Theodoridis (2015), studied the spillover effect of US volatility on the UK economy and suggest that increase in US uncertainty shocks decreases the UK’s output but increases its prices. Moro (2014), studied the European great crisis and mentioned that the origin of that crisis can be traced back to the global financial crisis of 2007–2009, which spilt over in Europe through Greece and from Greece it spread over some other European countries like Ireland, Italy, Spain, and Portugal. Colombo (2013), looked at the impact of US policy uncertainty shocks on the Europe region and suggested that US policy uncertainty shocks exert a more significant impact on European output fluctuations than domestic policy uncertainty shocks. Gourio et al. (2013), estimated the VAR model to work with the two-country real business model to analyze the impact of increased uncertainty on the rest of the world for investment and domestic consumption for G7 countries. Handley and Limao (2015), also looked at the impact of uncertainty shocks on investment and exports in different countries. C. H. J. Cheng (2017), studied the domestic and foreign policy uncertainty impact on South Korea’s output and found that foreign policy uncertainty is more influential than domestic. Carrière-Swallow and Céspedes (2013), study the spillover effect of US policy uncertainty shocks on different developed and developing countries, finding heterogeneous responses from different countries. According to their results, the exogenous shock causes a more significant and long-lasting drop in private consumption and investment in emerging countries compared to the US and other developed countries. They also corroborated that this heterogeneity in results was because of the less developed financial system in the developing countries, where fiscal and monetary policies proved to be less effective.
After reviewing the above literature, we conclude that though previous studies including Carrière-Swallow and Céspedes (2013), Gilchrist et al. (2014) (Alfaro et al. 2016) have discussed the role of financial structure and financial friction in amplifying the impact of policy uncertainty shocks, none of the studies have included the financial and real sector together to see the impact of policy uncertainty shocks on BRIC economies. We, therefore, apply the SVAR model and include real as well as financial factors in the model to study the impact of domestic and foreign EPU on BRIC countries.

3. Methodology

The endogenous variables are explained by VAR models purely with their own past, aside from deterministic regressors. Whereas, SVAR makes it possible to directly model contemporaneous interconnection among variables on the left-hand side (Pfaff 2008). Therefore, the deficiencies of VAR models try to circumvent such types of models. To determine shocks and map them by using IRF (impulse response functions) and/or FEVD (forecast error variance decomposition) by enforcing constraints, an SVAR model could be used. As this study has imposed short-run constraints on contemporary relationships, the SVAR model works well in this condition (Christiano et al. 2007).
This study primarily examines the impact of domestic economic policy uncertainty (EPU) and foreign economic policy uncertainty shocks on household consumption (CN), investment (INV), real interest rate (RINT), inflation (CPI), domestic credit (DC), and export (EX) of BRIC countries, that is, Brazil, Russia, India, and China. Foreign economic policy uncertainty includes EPU of the US, UK, and EU as these countries are dominant in the world so that the impact of their policy uncertainties may be transferred to other countries. However, we use structural VAR (SVAR) to estimate the effect of domestic and foreign economic policy uncertainty changes on BRIC economies as this SVAR framework has been used in previous similar studies (Carrière-Swallow and Céspedes 2013; C. H. J. Cheng 2017). Moreover, we considered the following model:
A 0 X t = A 1 X t 1 + + A p X t p + ε t
where X t shows an (n × 1) vector of relevant variables as follows: X t = [ l e p u d o m e s t i c , t , l e p u f o r e i g n , t , l i n v t ,   l c n t ,   r i n t t ,   l c p i t ,   l c d t , l e x t ] , A i represents 6 × 6 matrices of coefficients for i = 0 , 1 P , and ε t is the vector of structural disturbances denoted by [ ε t l e p u ,   ε t l i n v ,   ε t l c n ,   ε t l r i n t ,   ε t l c p i ,   ε t l c d ,   ε t l e x ] and these are considered to be independent and identically distributed (i.i.d.). ε t is an n-vector of serially uncorrelated, ( E ( ε t ) = 0 ) zero mean with an identity covariance matrix ε   =   E [ ε t ε t ]   =   Ι .
The reduced form of the SVAR model can be represented as below:
A 0 X t = A 1 X t 1 + + A p X t p + ε t
X t = A 0 1 A 1 X t 1 + + A 0 1 A p X t p + A 0 1 ε t
X t = B ( L ) X t + μ t
where with A 0 μ t = ε t . The residual μ t is the reduced form VAR and understood to be i.i.d. A 1 ( L ) is a matrix of polynomial in the lag operator (see, Enders 2004; Park et al. 2011).

4. Results

To analyze the impact of domestic and foreign EPU shocks on different real and financial variables, impulse response analysis is conducted. The results are plotted in Figure 1, Figure 2, Figure 3 and Figure 4.

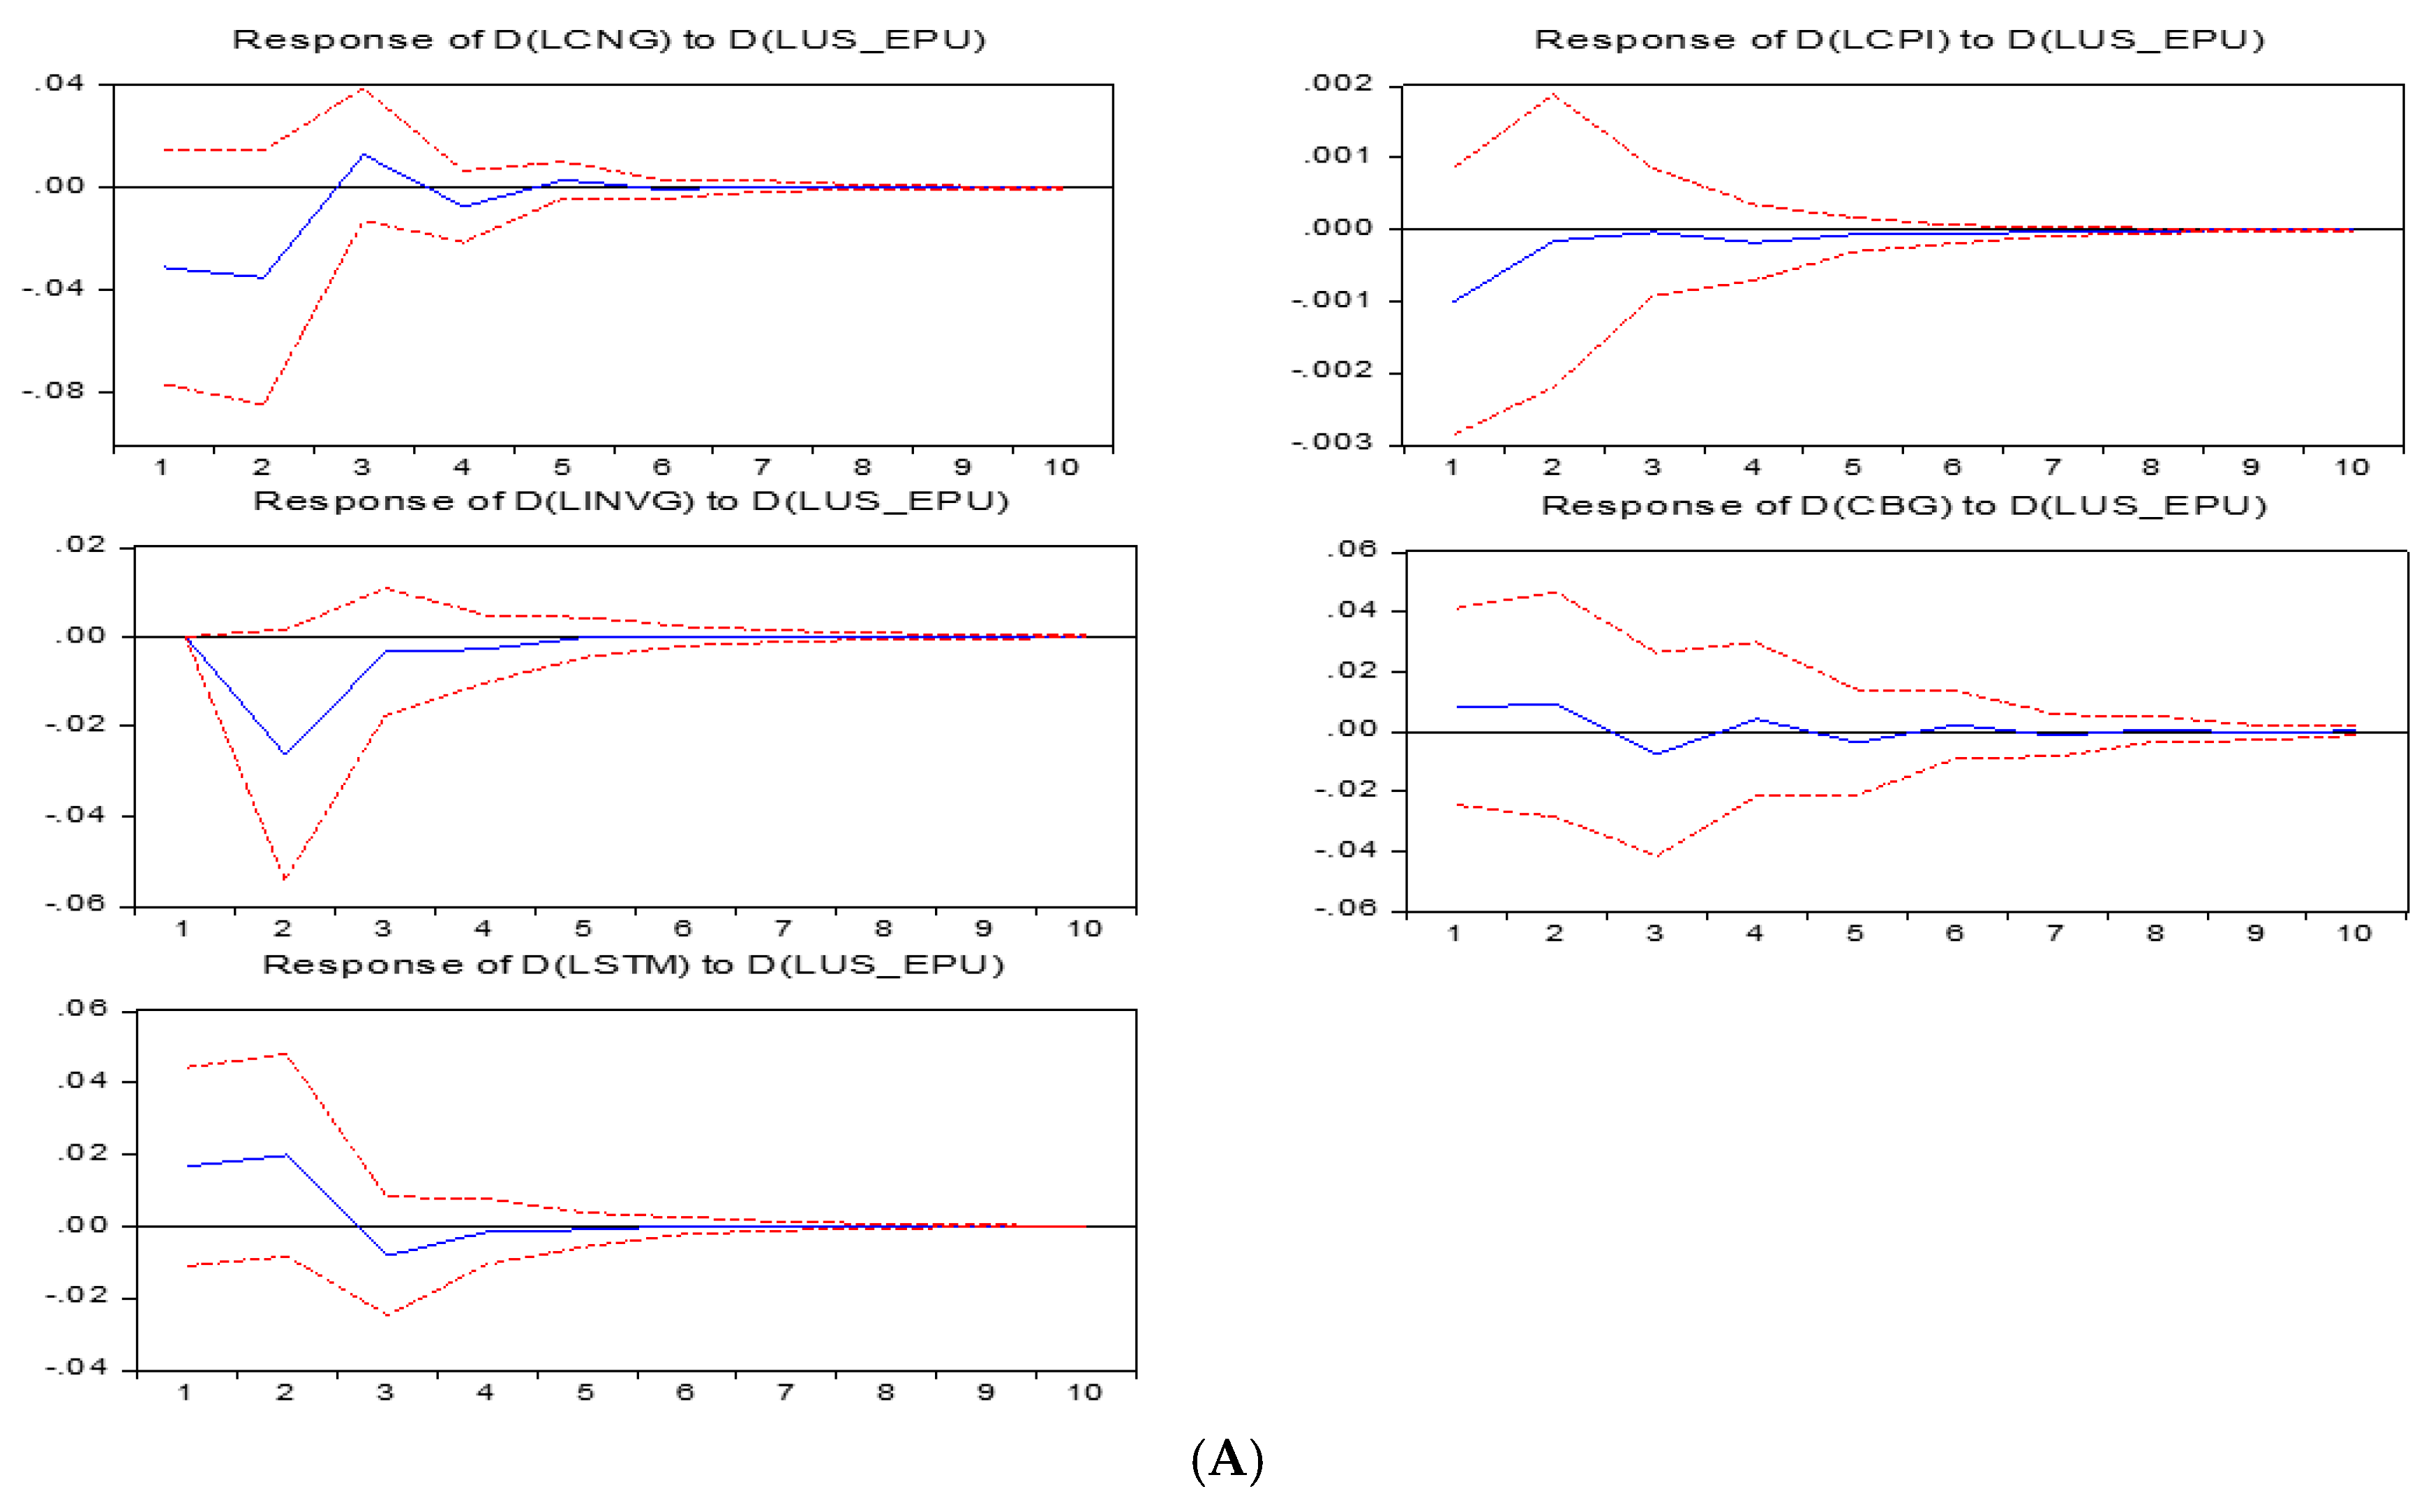
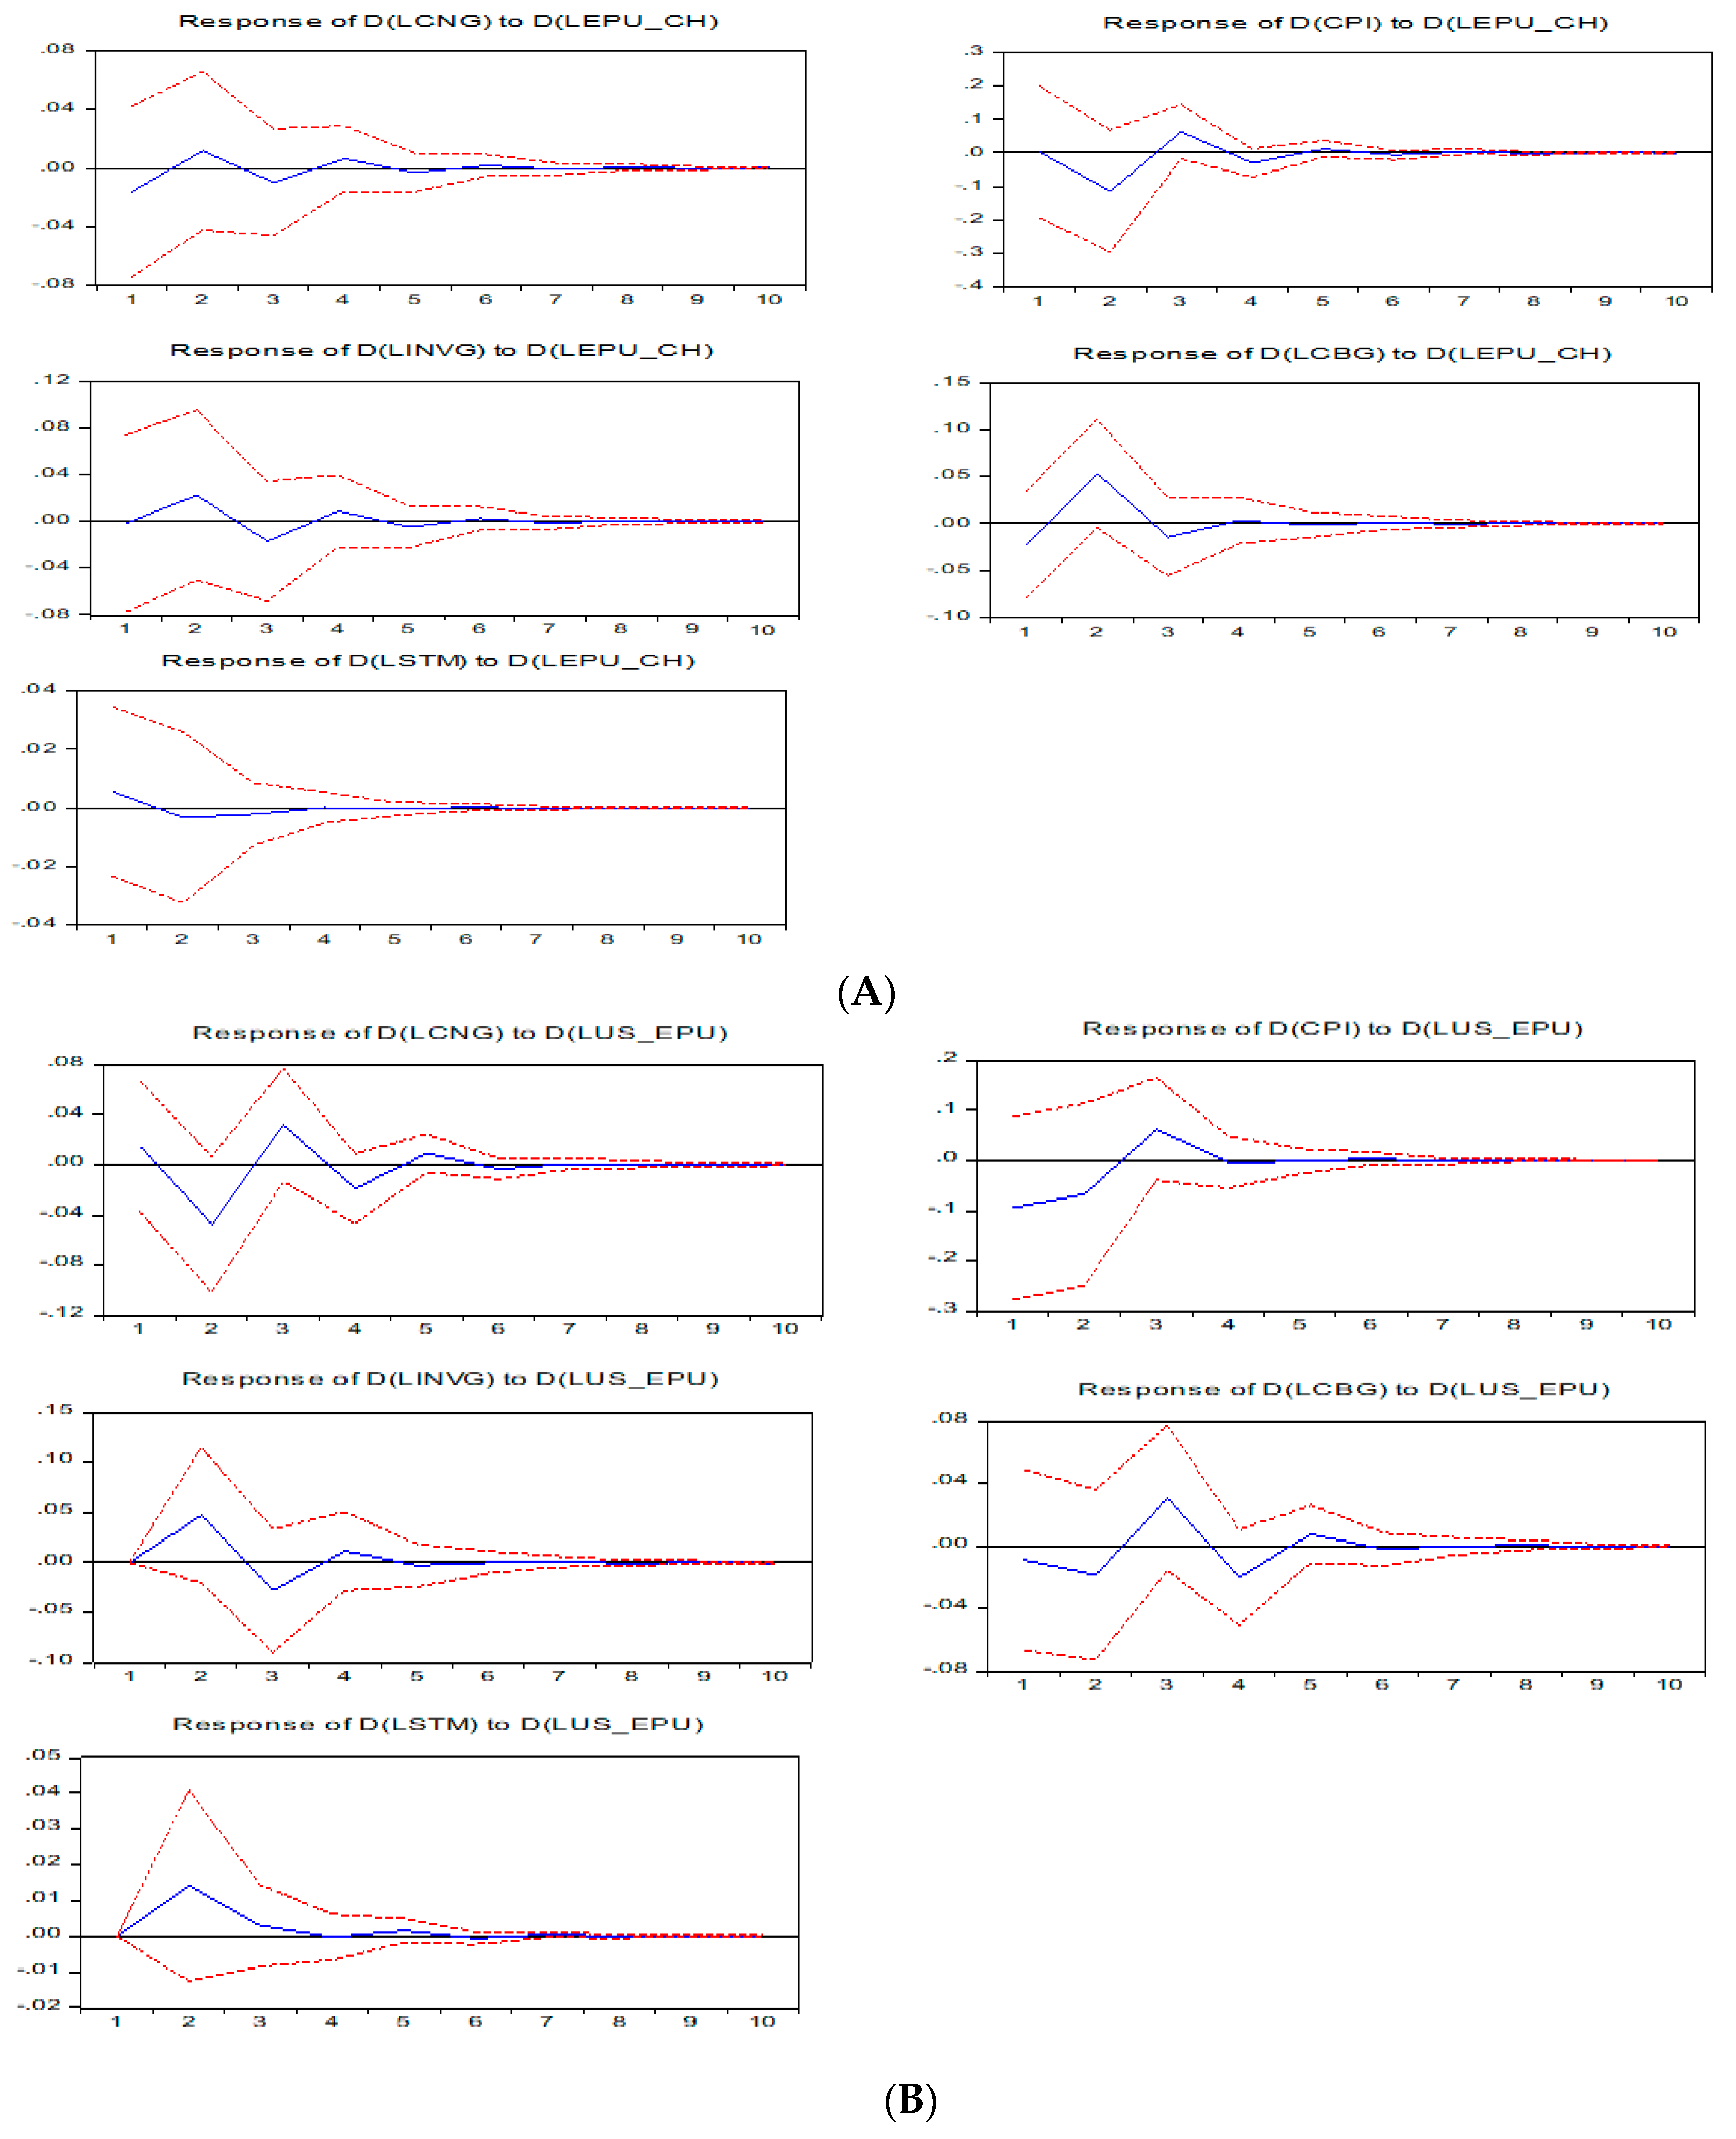
4.1. Impact of Domestic and Foreign EPU on Brazil

The model predicts that unexpected domestic and foreign shocks of economic policy uncertainty negatively affect investment, then it recovers but it does not overshoot, supporting the Carrière-Swallow and Céspedes (2013) findings (there is no overshoot response from the emerging economies after the shock). Interestingly, the model also depicts that domestic and foreign policy shocks hurt the credit growth provided by the bank because there is a positive relationship between investment and private credit growth as it is consistent with the results of Carrière-Swallow and Céspedes (2013). Bordo et al. (2016), also found the negative impact of bank credit growth on investment, implying the vital role of bank credit growth in the real economy. One possible justification for these results can be: credit constraints may affect the firm’s profitability by hampering its ability to maintain the operations, compelling it to postpone many profitable projects. Moreover, domestic shocks seem to have a more substantial impact than foreign shocks do. Figure 1 also shows the adverse impact of domestic and foreign policy uncertainty on consumption, corroborating the precautionary saving motive opinion discussed by Caballero (1990), where domestic policy shocks create more impact on private consumption than foreign (i.e., the USA, UK, and Europe) shocks do. Results display that one standard deviation shock to the domestic policy uncertainty of Brazil causes its private consumption to drop by 4% at impact, interestingly the EPU of the USA exerts the same impact in terms of magnitude (4%) and direction (negative). After the negative impact of policy shock, the recovery period of consumption starts after the second quarter, while it becomes insignificant after the fifth quarter.
Moreover, results show that domestic policy shocks are triggering the inflation of Brazil upward. The decline in consumption and investment combined with the shoot up in inflation shows the negative supply shock engendered by domestic policy uncertainty shocks. These results are consistent with C. H. J. Cheng (2017). One possible justification for these results can be: domestic policy uncertainty may engender the capital outflow, causing the exchange rate to depreciate. Depreciation in exchange rate causes a rise in the cost of imported inputs and the price of exports. Shock in the policy of the UK also exerts the same negative supply shock in Brazil, while EPU shocks of the USA and Europe harm the inflation of Brazil. Policy shocks of the USA and Europe exert negative demand shock, causing investment, consumption, and inflation to drop. These findings are consistent with the results of Colombo (2013), Caggiano et al. (2014), and Leduc and Liu (2013).
Remarkably, domestic policy shocks hurt the stock market in the beginning, while it turns to positive only for one quarter than it again changes to negative and remains the same till the fifth quarter. Results depict that most of the time policy shocks have created a negative impact on the stock market because the stock price is the sum of the discounted value of future dividends. So, uncertainty about the economy raises the pessimistic consideration of the stock market participants toward the future dividend or discount rate which triggers the stock prices downward. These results of having a negative relationship between EPU and the stock market are consistent with Bhagat et al. (2013) and Sum (2012). The EPU of the USA has the time-varying impact of the stock market of Brazil, it is positive for the first two quarters then it turns to negative, while it becomes insignificant in the fourth quarter. The EPU of Europe also has a time-varying impact on the stock market.

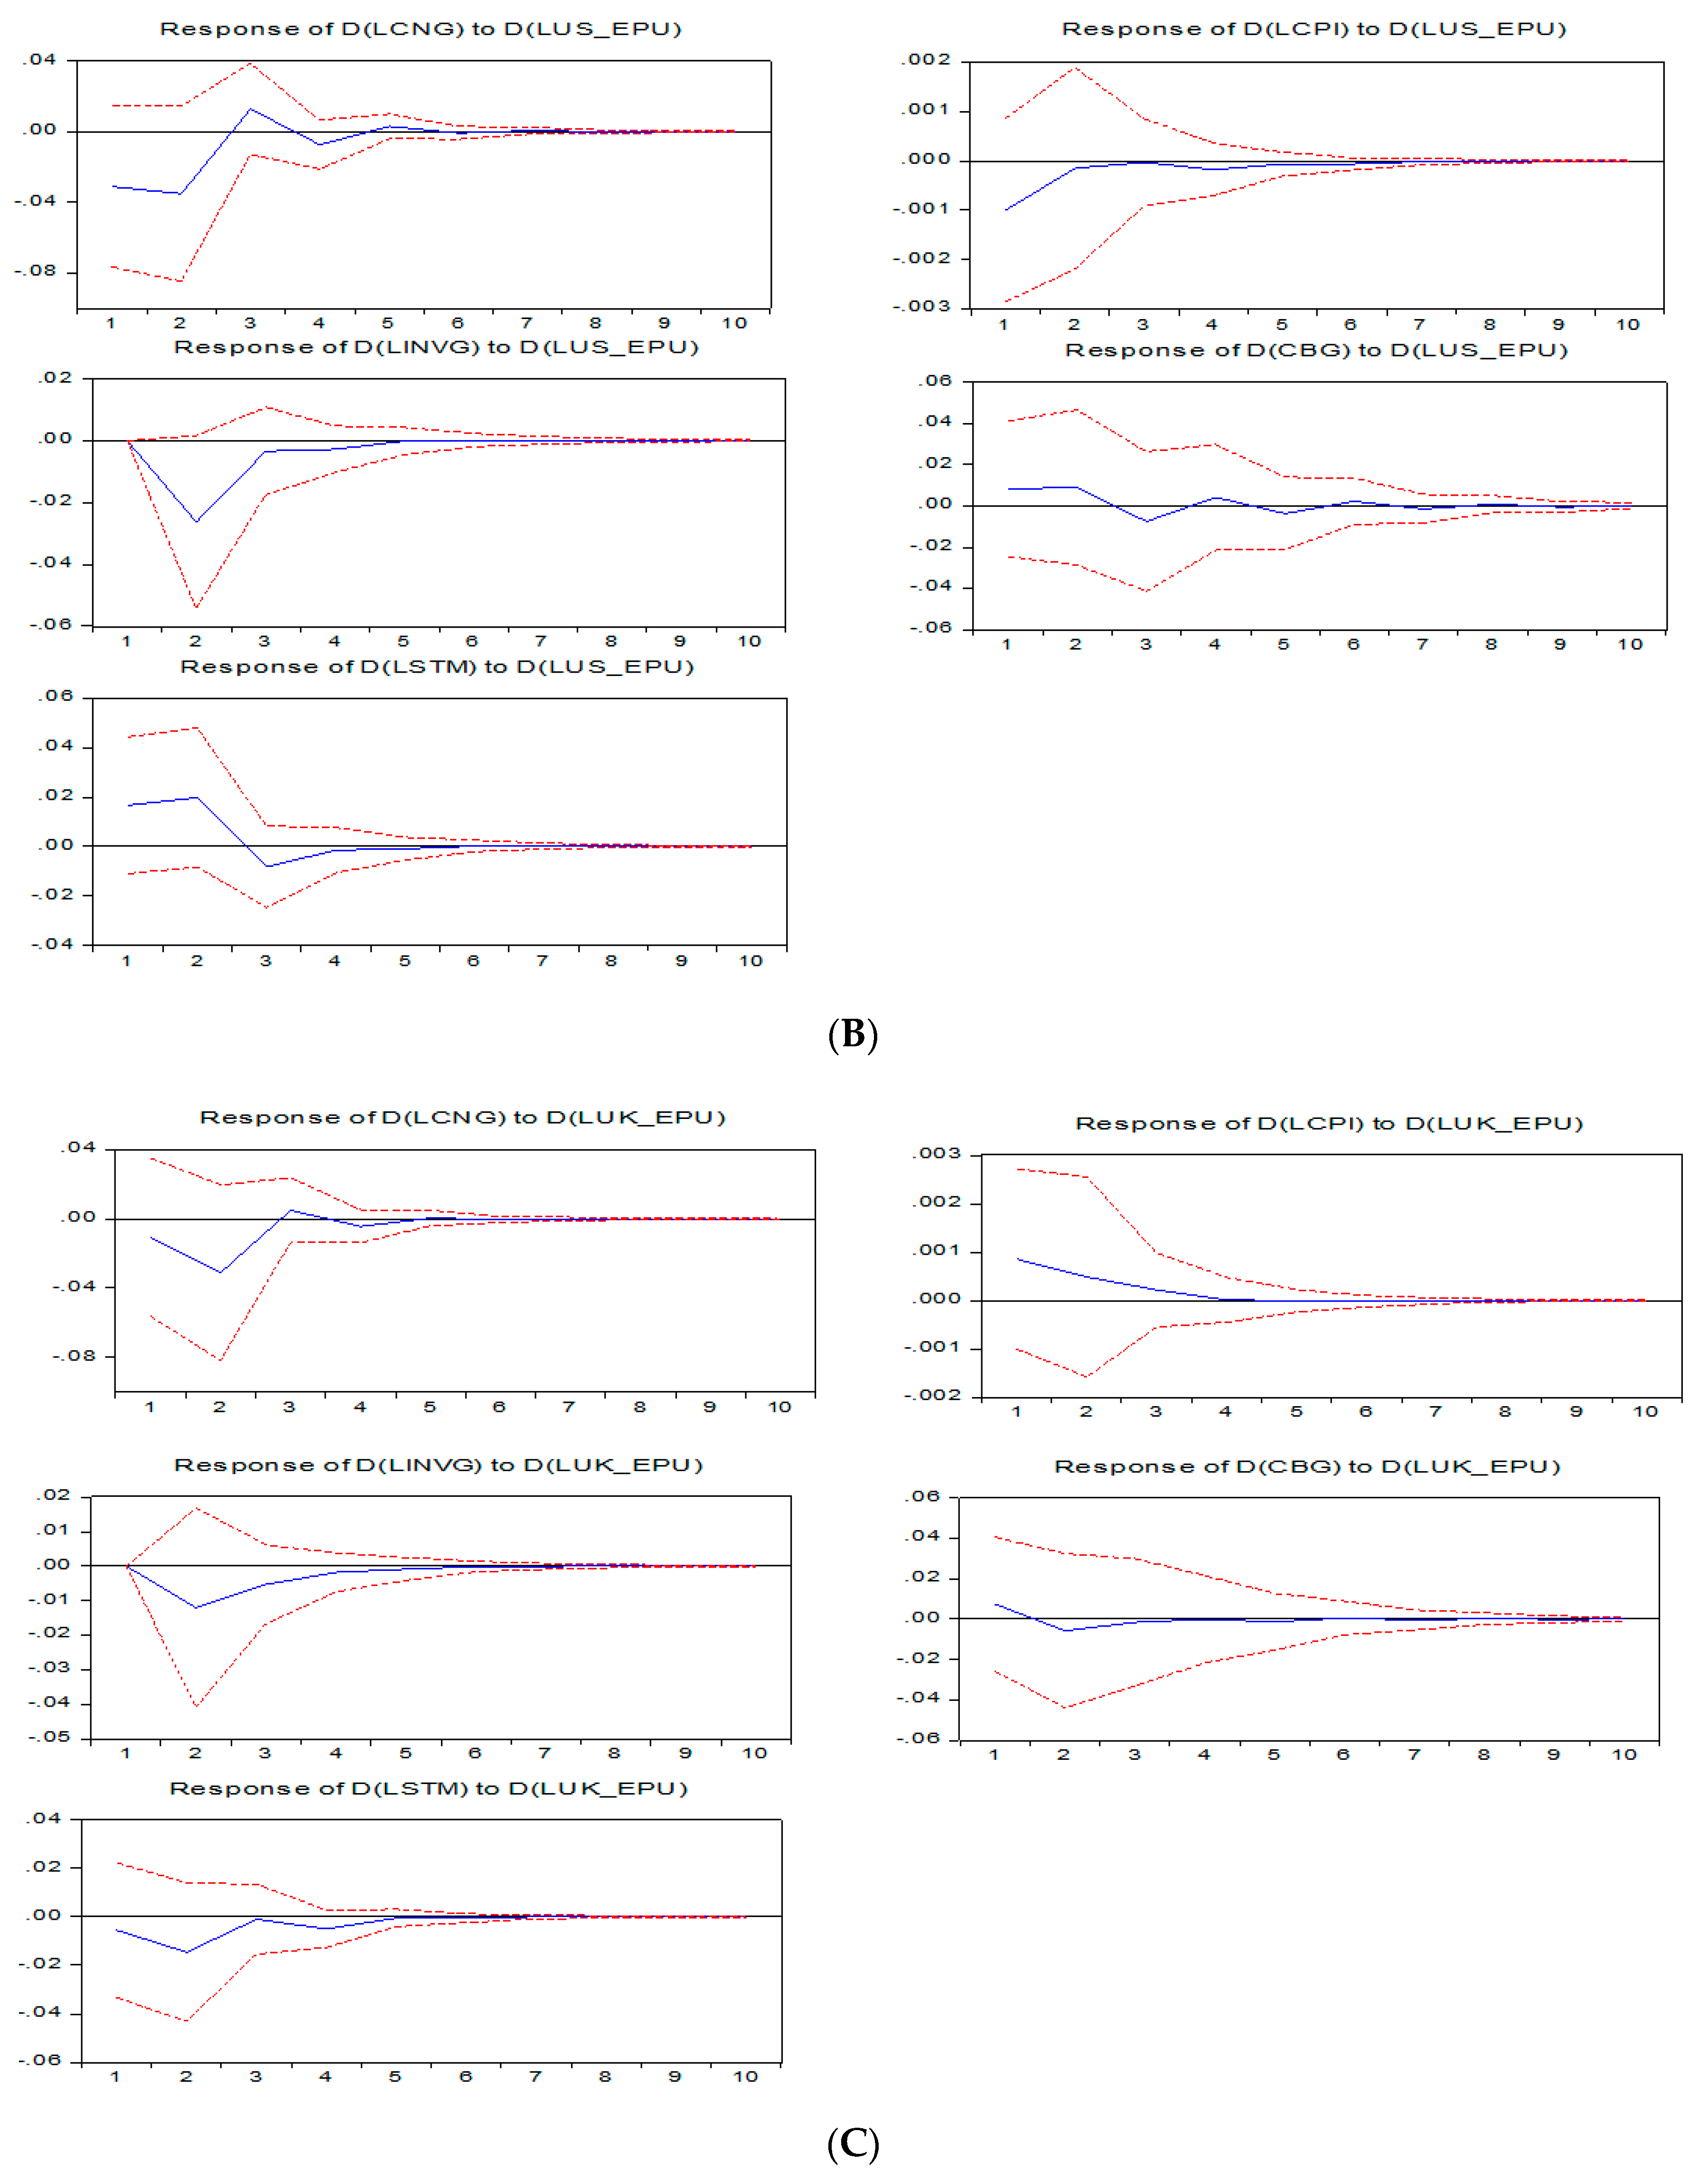
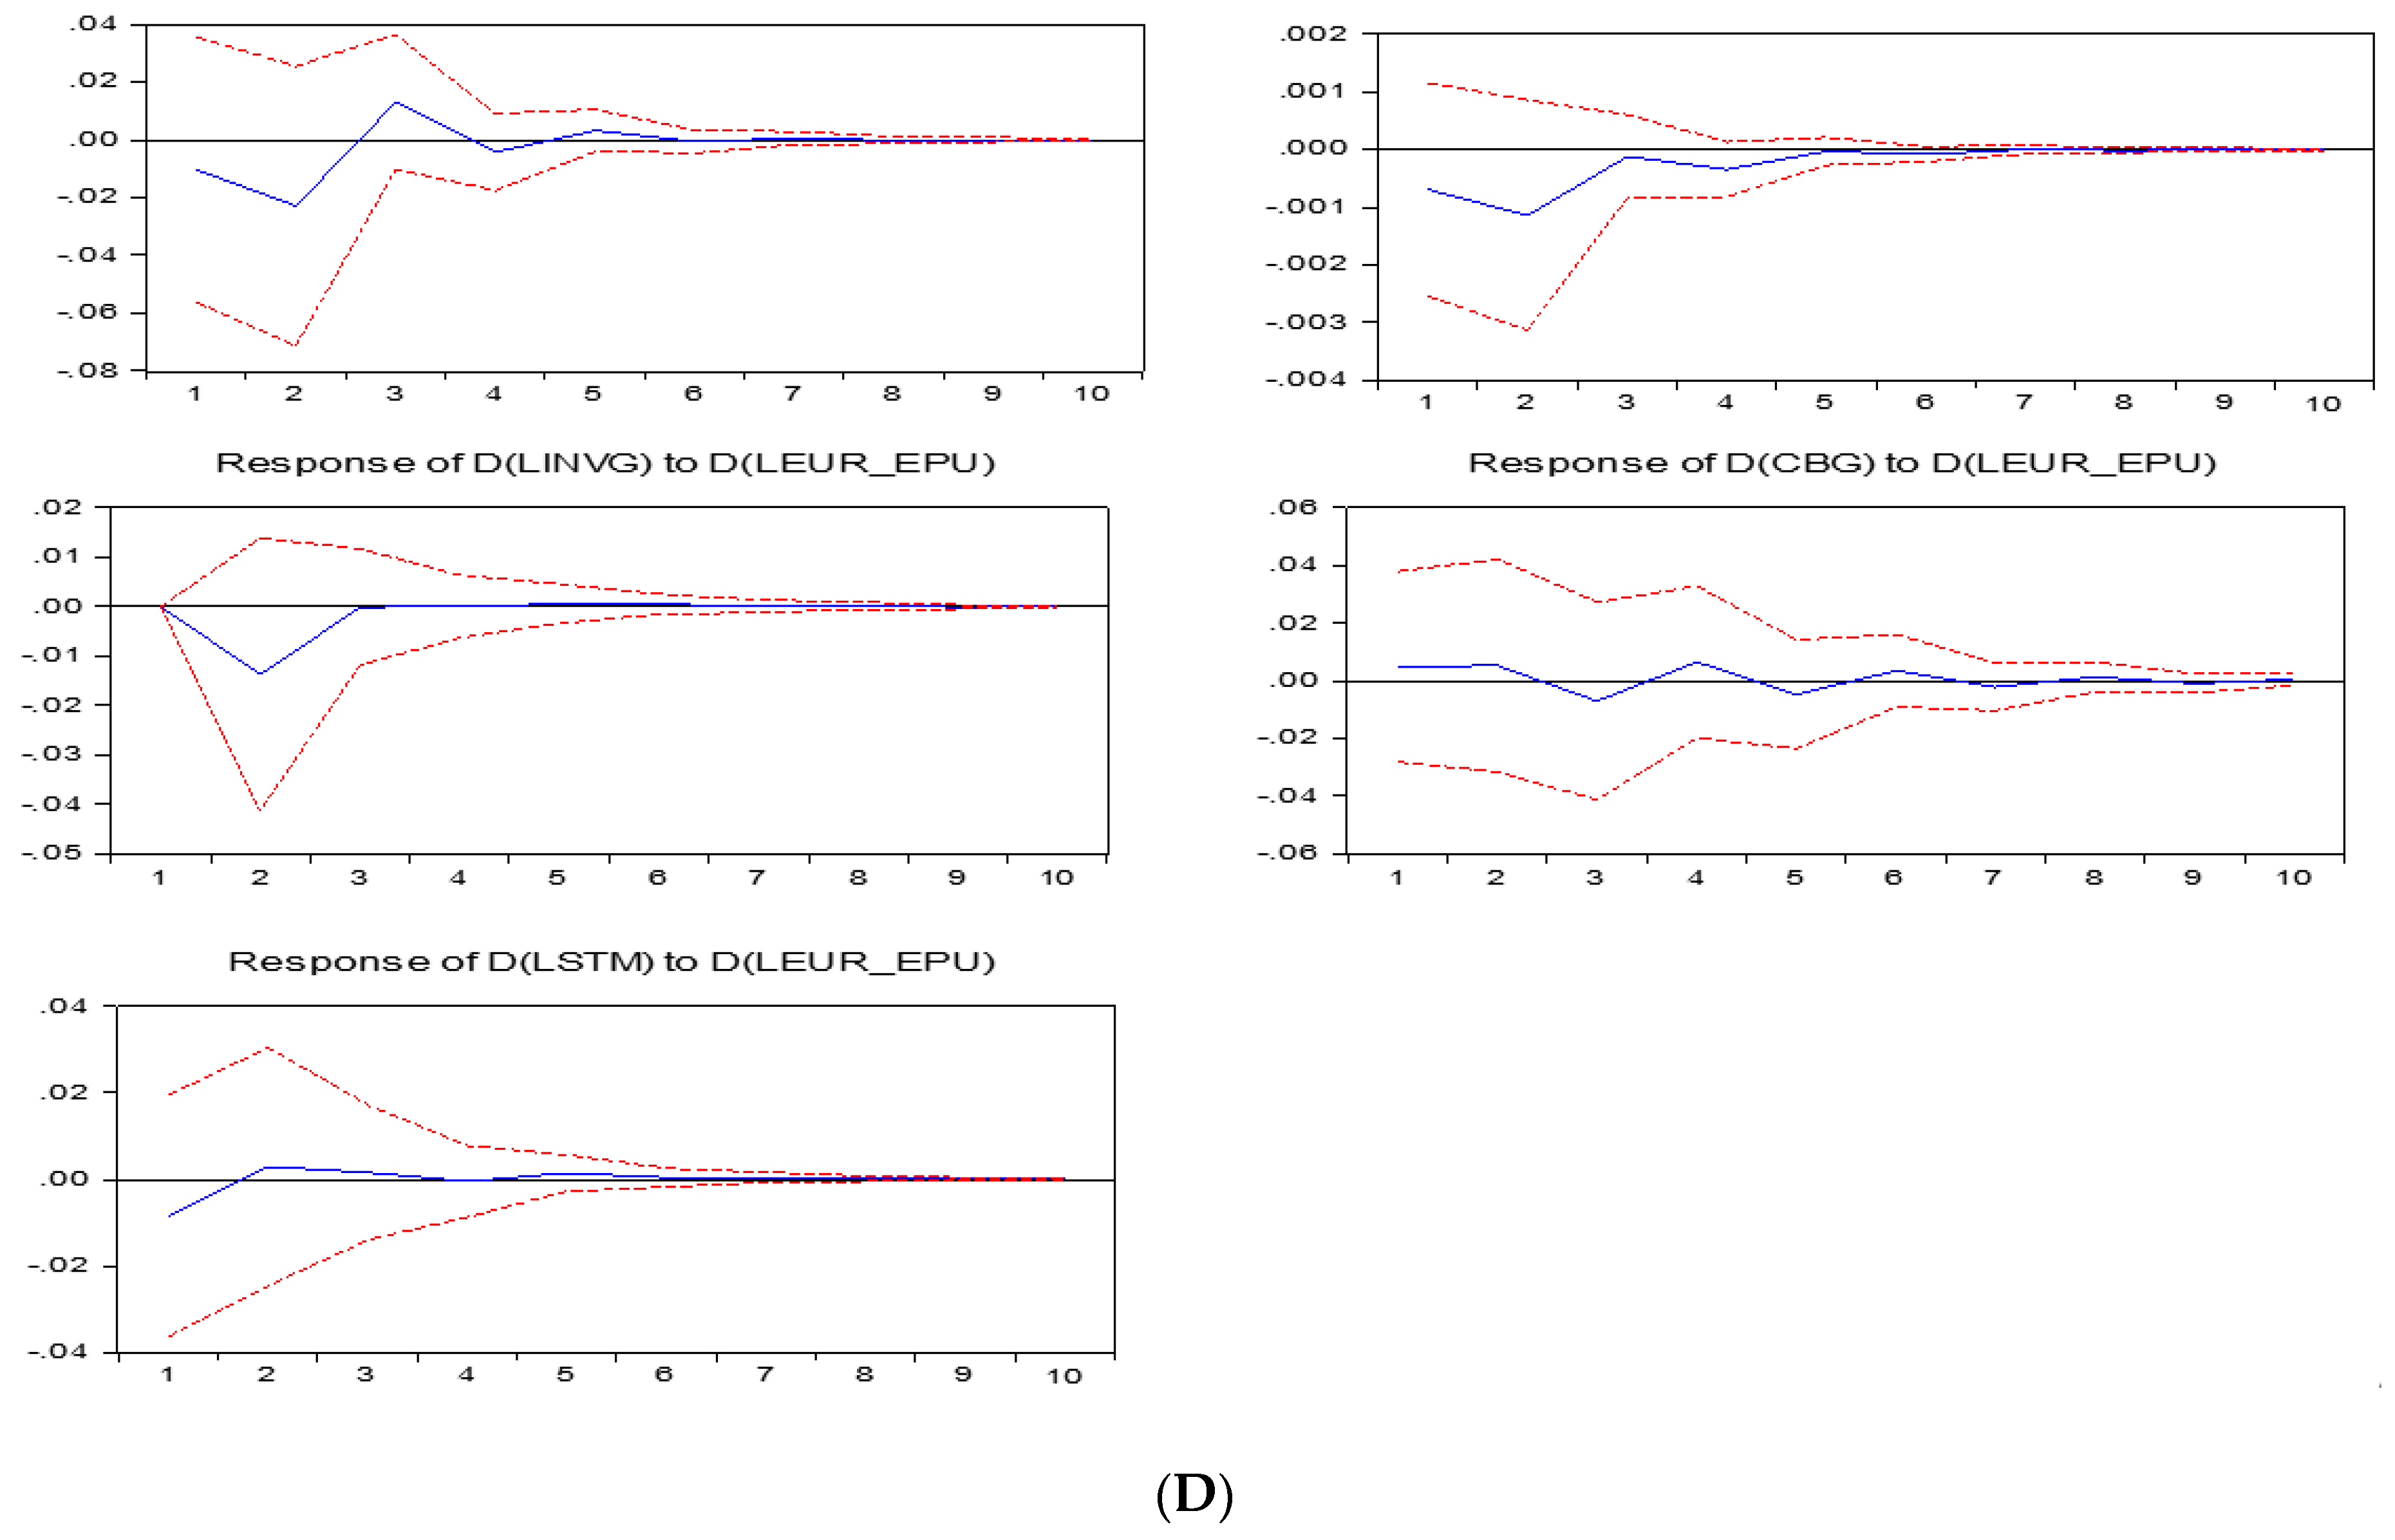
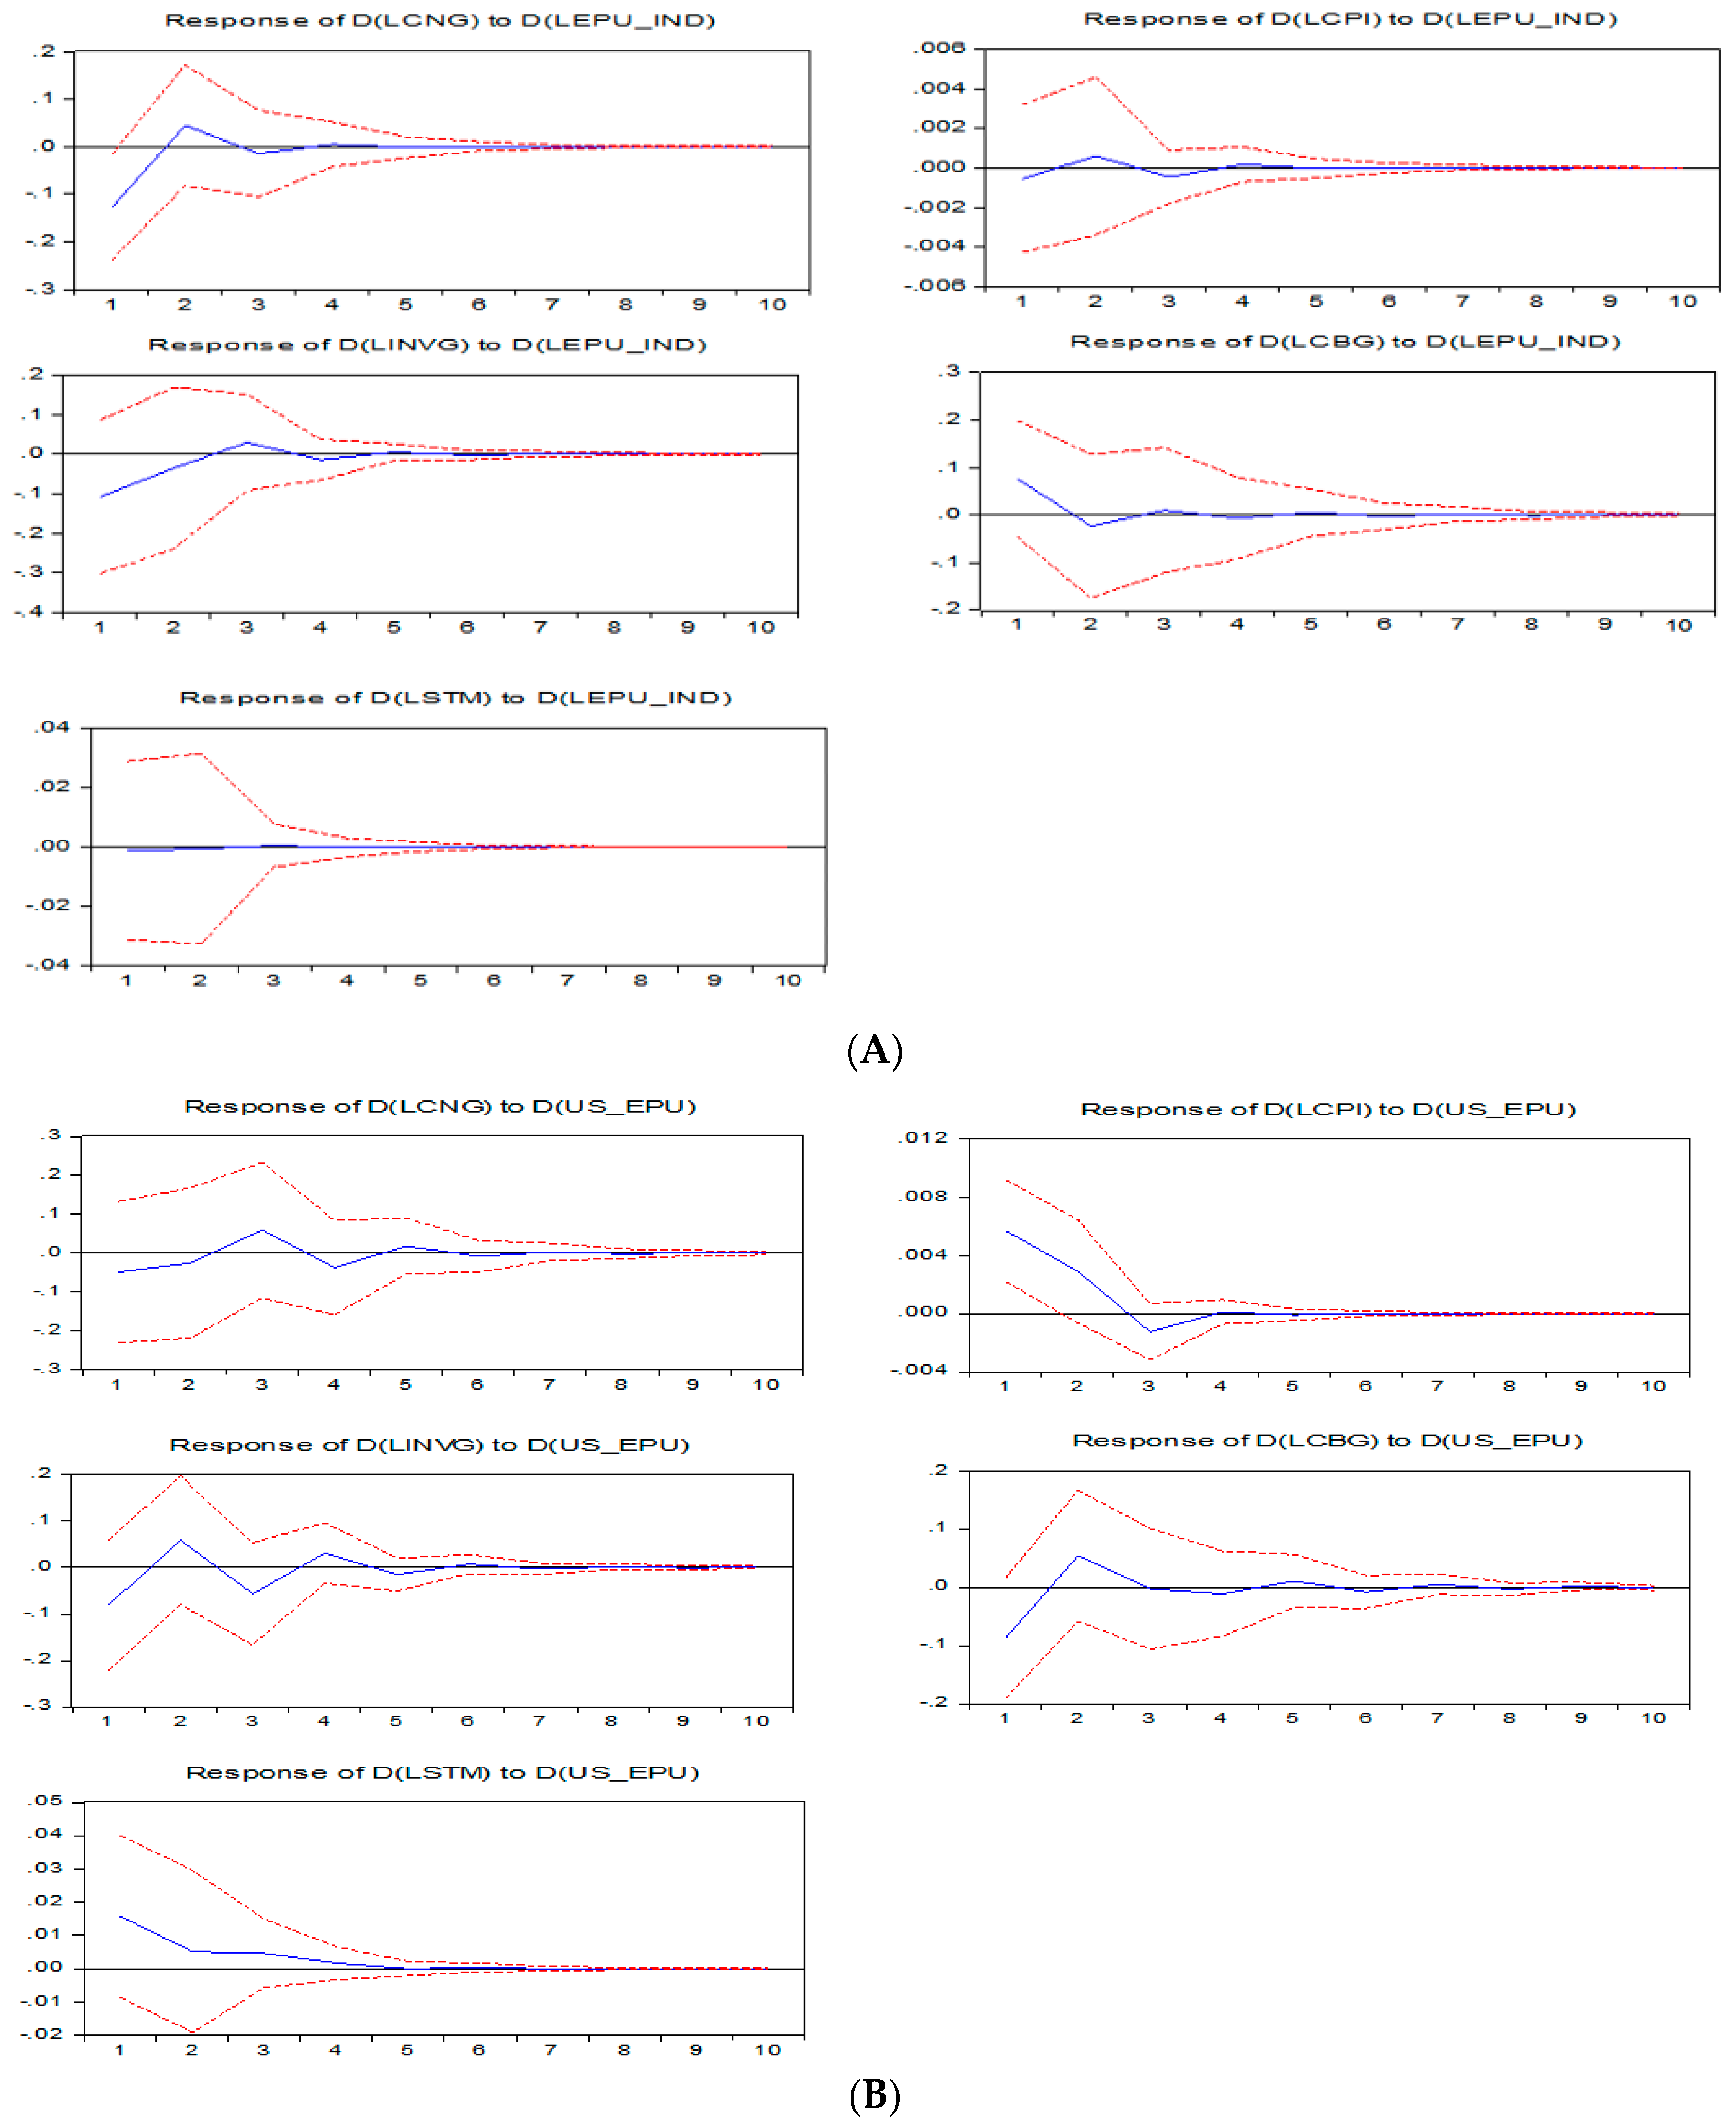
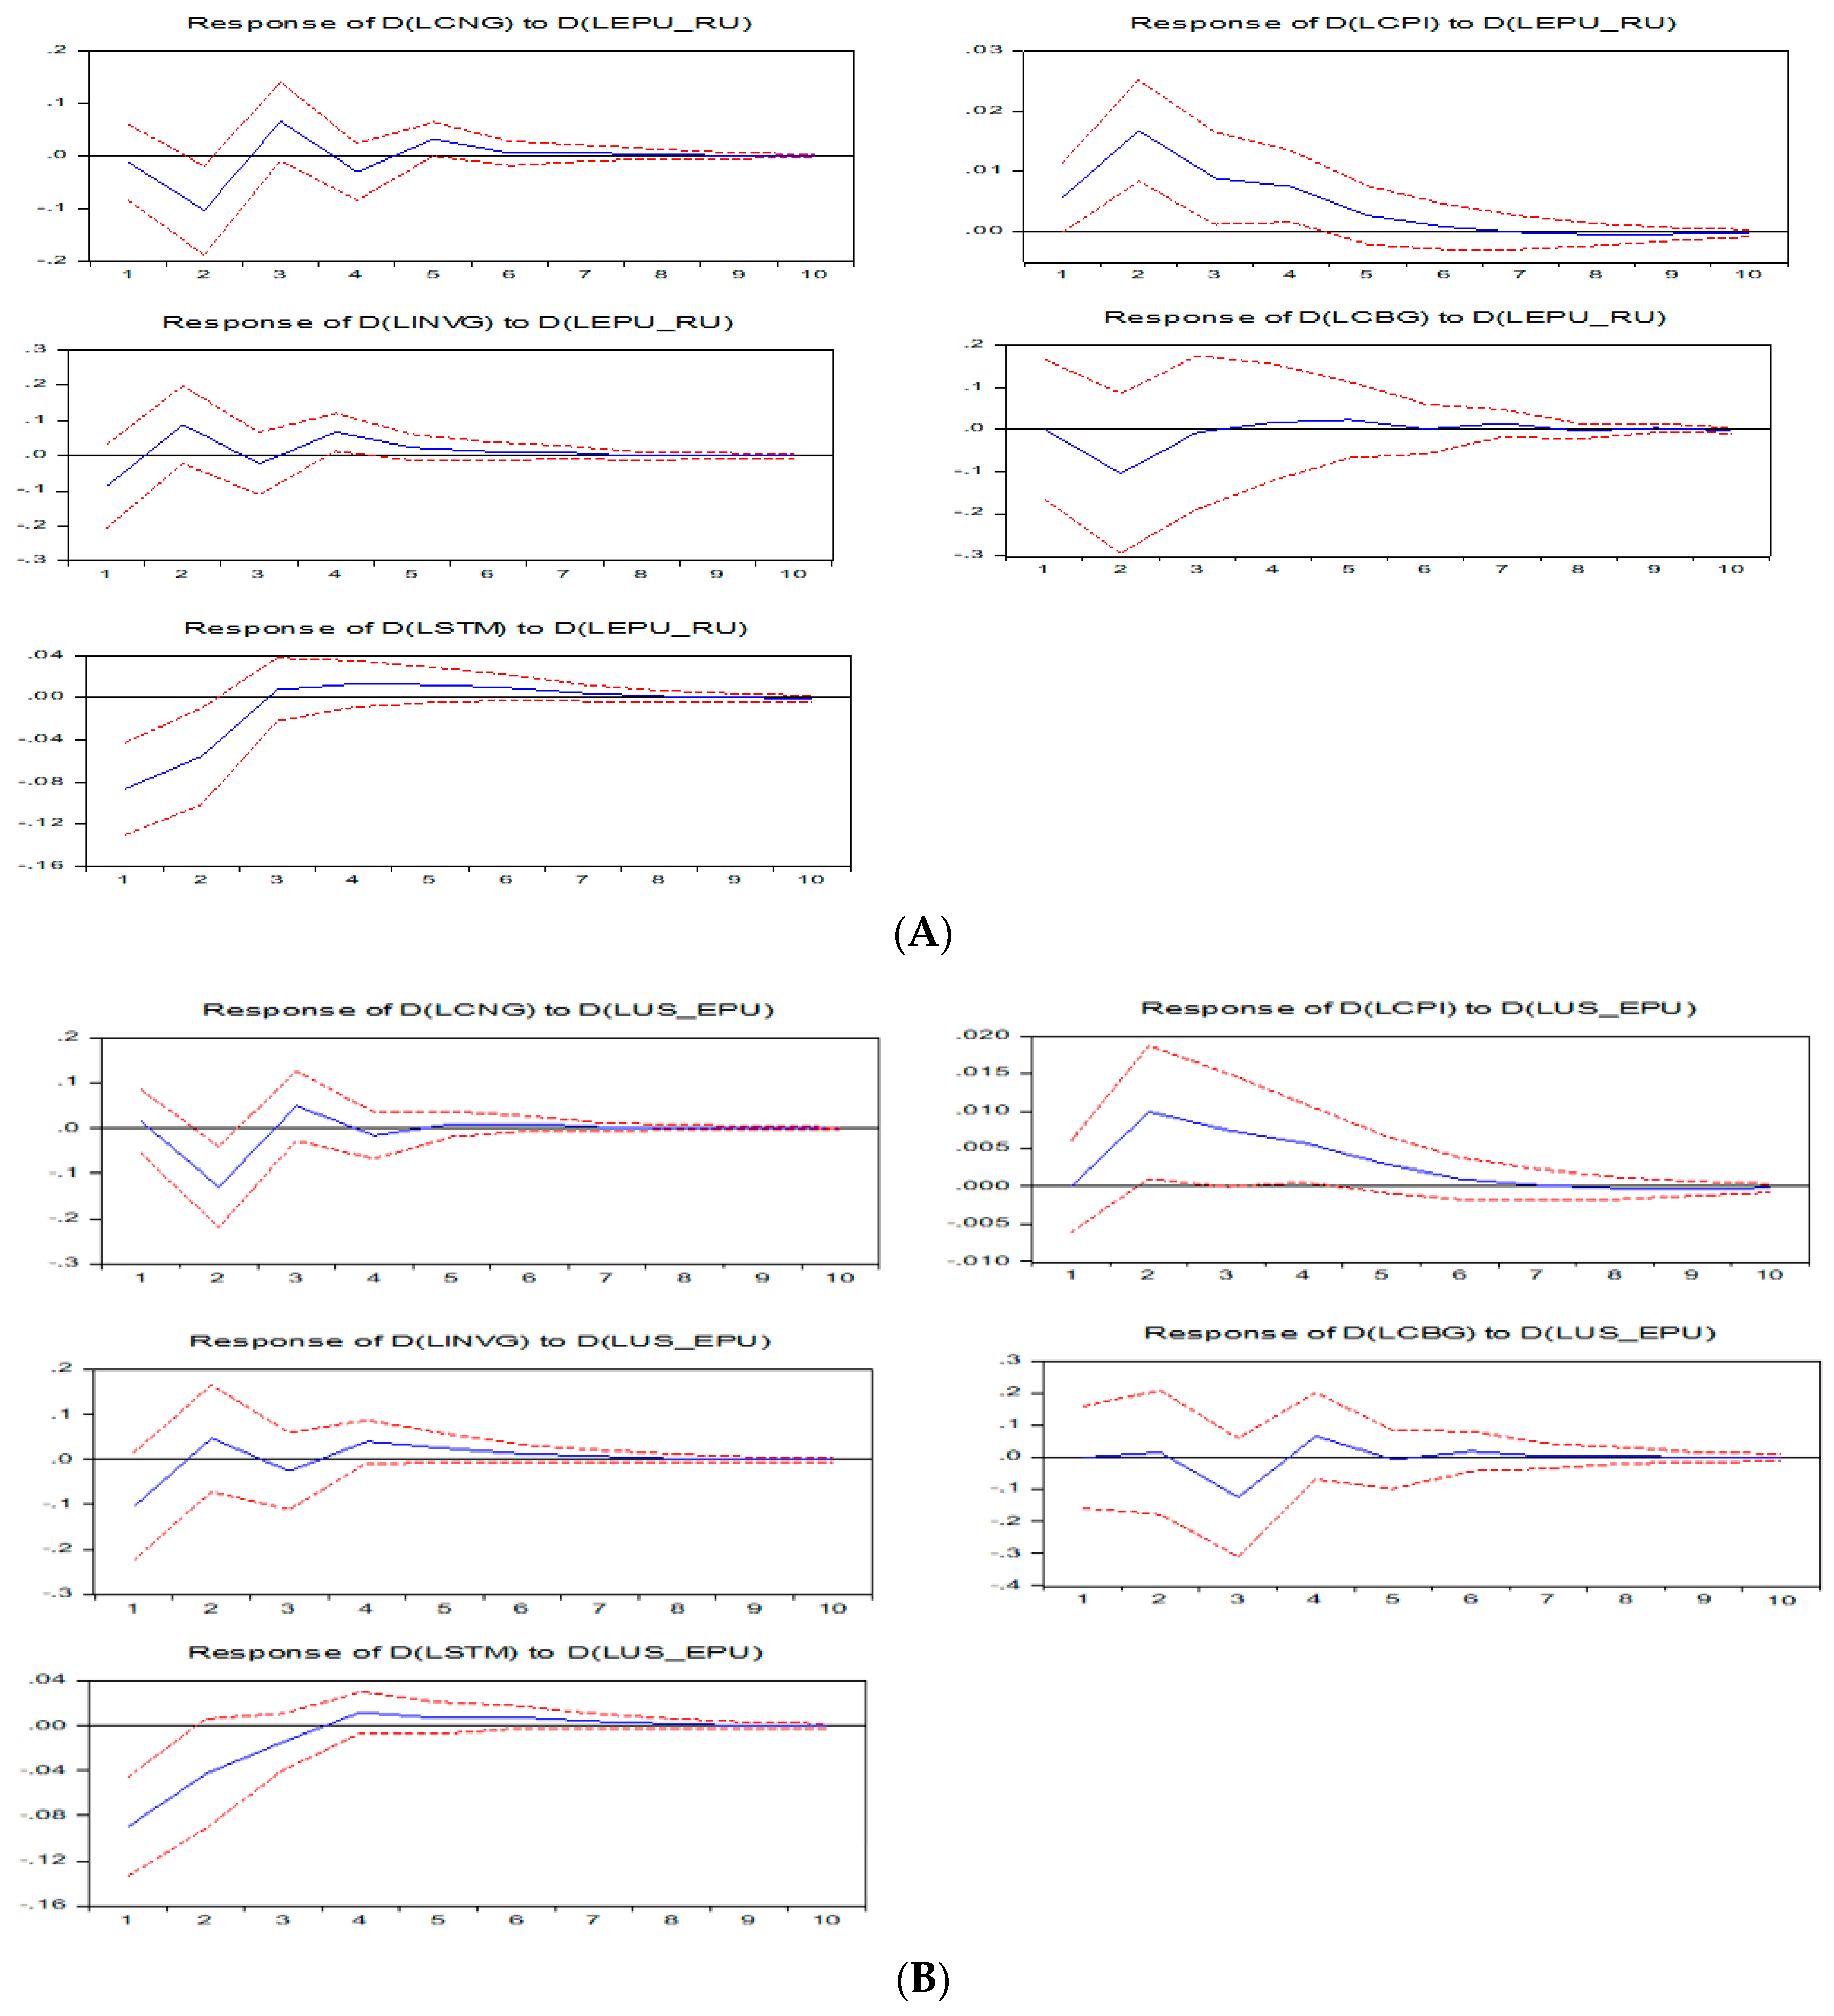
4.2. Impact of Domestic and Foreign EPU on India

The model predicts that domestic policy uncertainty shocks have an inverse impact on domestic private consumption and investment. These findings are corroborated by Bernanke (1983); Bloom (2009); Caballero (1990). Additionally, unlike Brazil, India has a positive impact on bank credit growth in the first quarter which becomes negative but nominal in next quarter, implying the negligible role of bank credit in multiplying the impact of the shock on the real economy. There is a negligible impact of domestic EPU on inflation, while it has created an insignificant impact on the stock market from very first quarter. The EPU of the USA has created a negative supply shock in the Indian economy, creating a negative impact on consumption, investment and domestic credit while boosting up the inflation. These results support the findings of C. H. J. Cheng (2017). Domestic EPU of Europe has not had any significant impact stock market of India while the UK has a negative but very minimal impact on the stock market. Interestingly EPU of the USA has a positive impact on the stock market of India. One possible justification for these results can be related to the phenomenon of capital flight, where investors transfer the investment from an uncertain environment (where EPU is high) to a certain one. Consumption and bank credit growth were also nominally impacted by the EPU shocks of UK, becoming insignificant nearly after the third quarter. They have a negative impact on investment which turns to positive in the second quarter and again becomes negative in the next quarter.
The EPU of Europe engenders the negative supply shock in the Indian economy, negatively affecting consumption and investment while triggering the inflation upward. Domestic credit is negatively affected by the EPU of Europe, confirming a positive relationship between investment and domestic credit. Policy uncertainty shocks have an insignificant impact on the stock market of India.

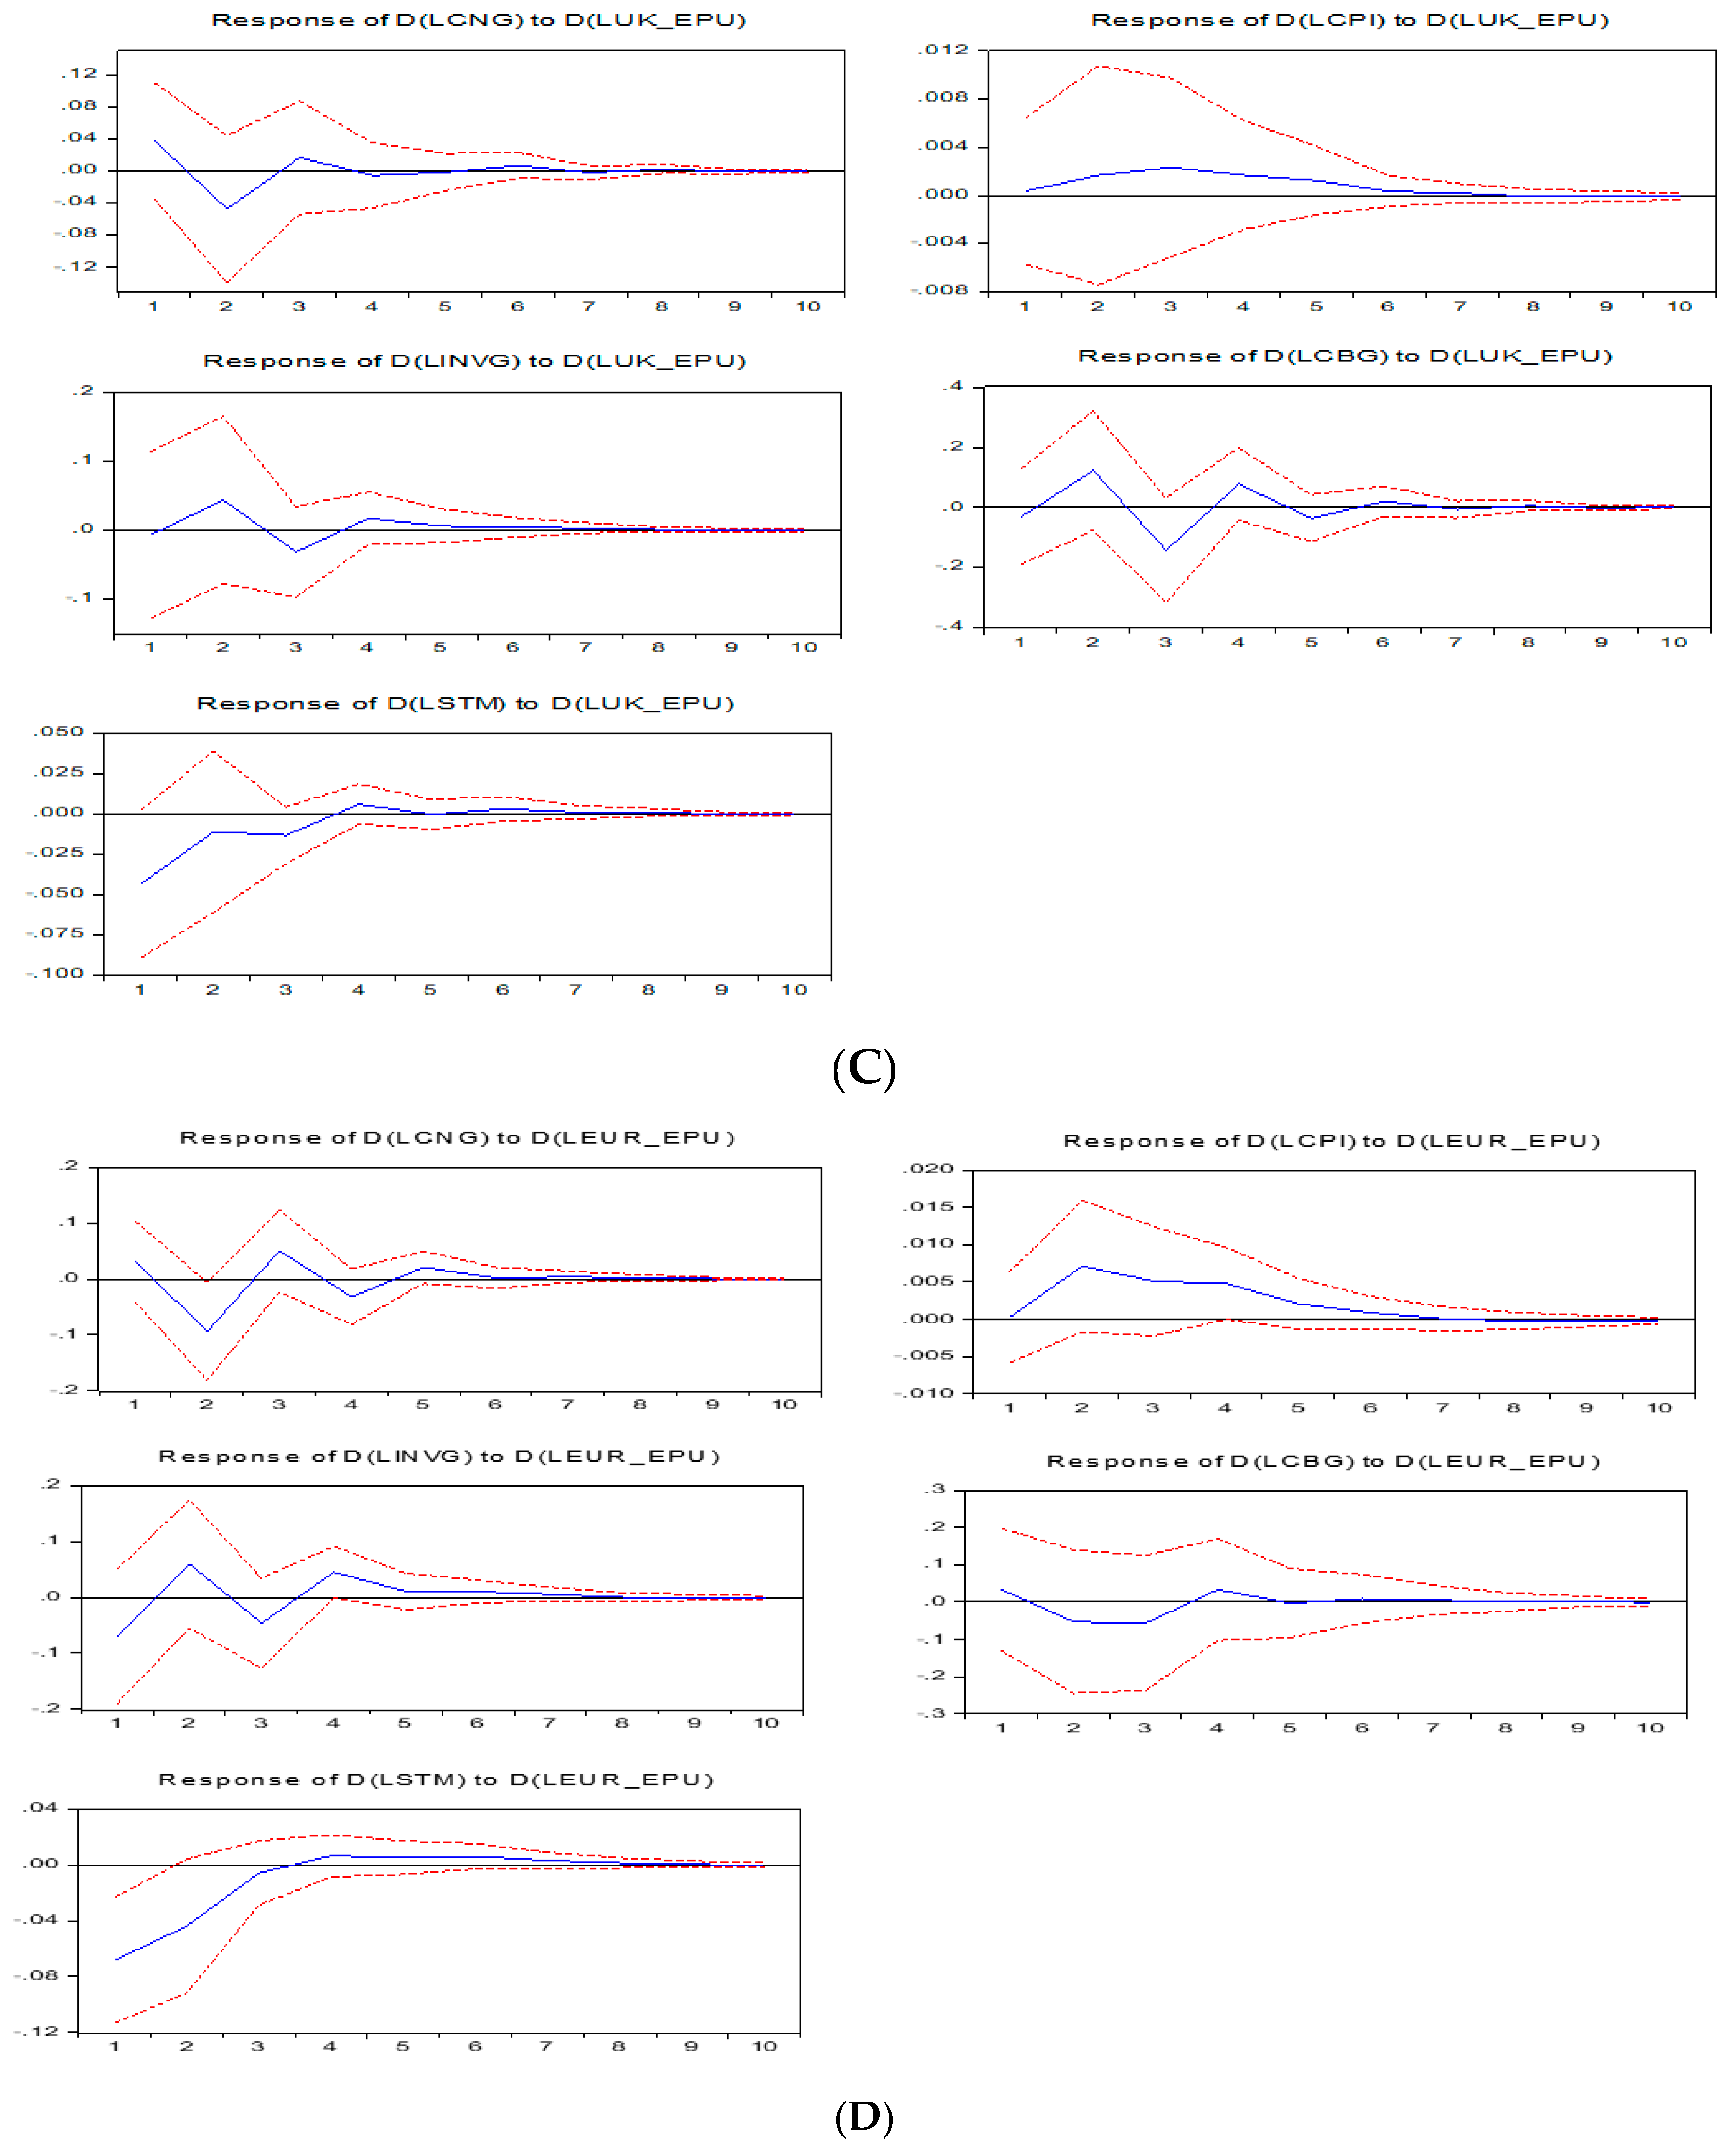
4.3. Impact of Domestic and Foreign EPU on China

Domestic and foreign policy shocks are negatively affecting the private consumption of China, supporting the Caballero (1990) view that uncertainty may negatively affect current consumption. While it triggers a significant drop in inflation, displaying negative demand shock. Fascinatingly, neither the domestic nor the foreign EPU creates an adverse impact on the investments of China in the beginning, while after two quarters it turns to a negative direction.
There is a very minimal contemporaneous impact of domestic policy shocks on the stock market, but it has a negative impact after the second quarter which lasts for the next two quarters.
The EPU of the USA and Europe creates a positive impact on the stock market of China. One possible justification for these results can be related to the phenomenon of capital flight, where investors transfer the investment from a riskier place to a safer one. The EPU of the UK has a nearly insignificant impact on the stock market of China.

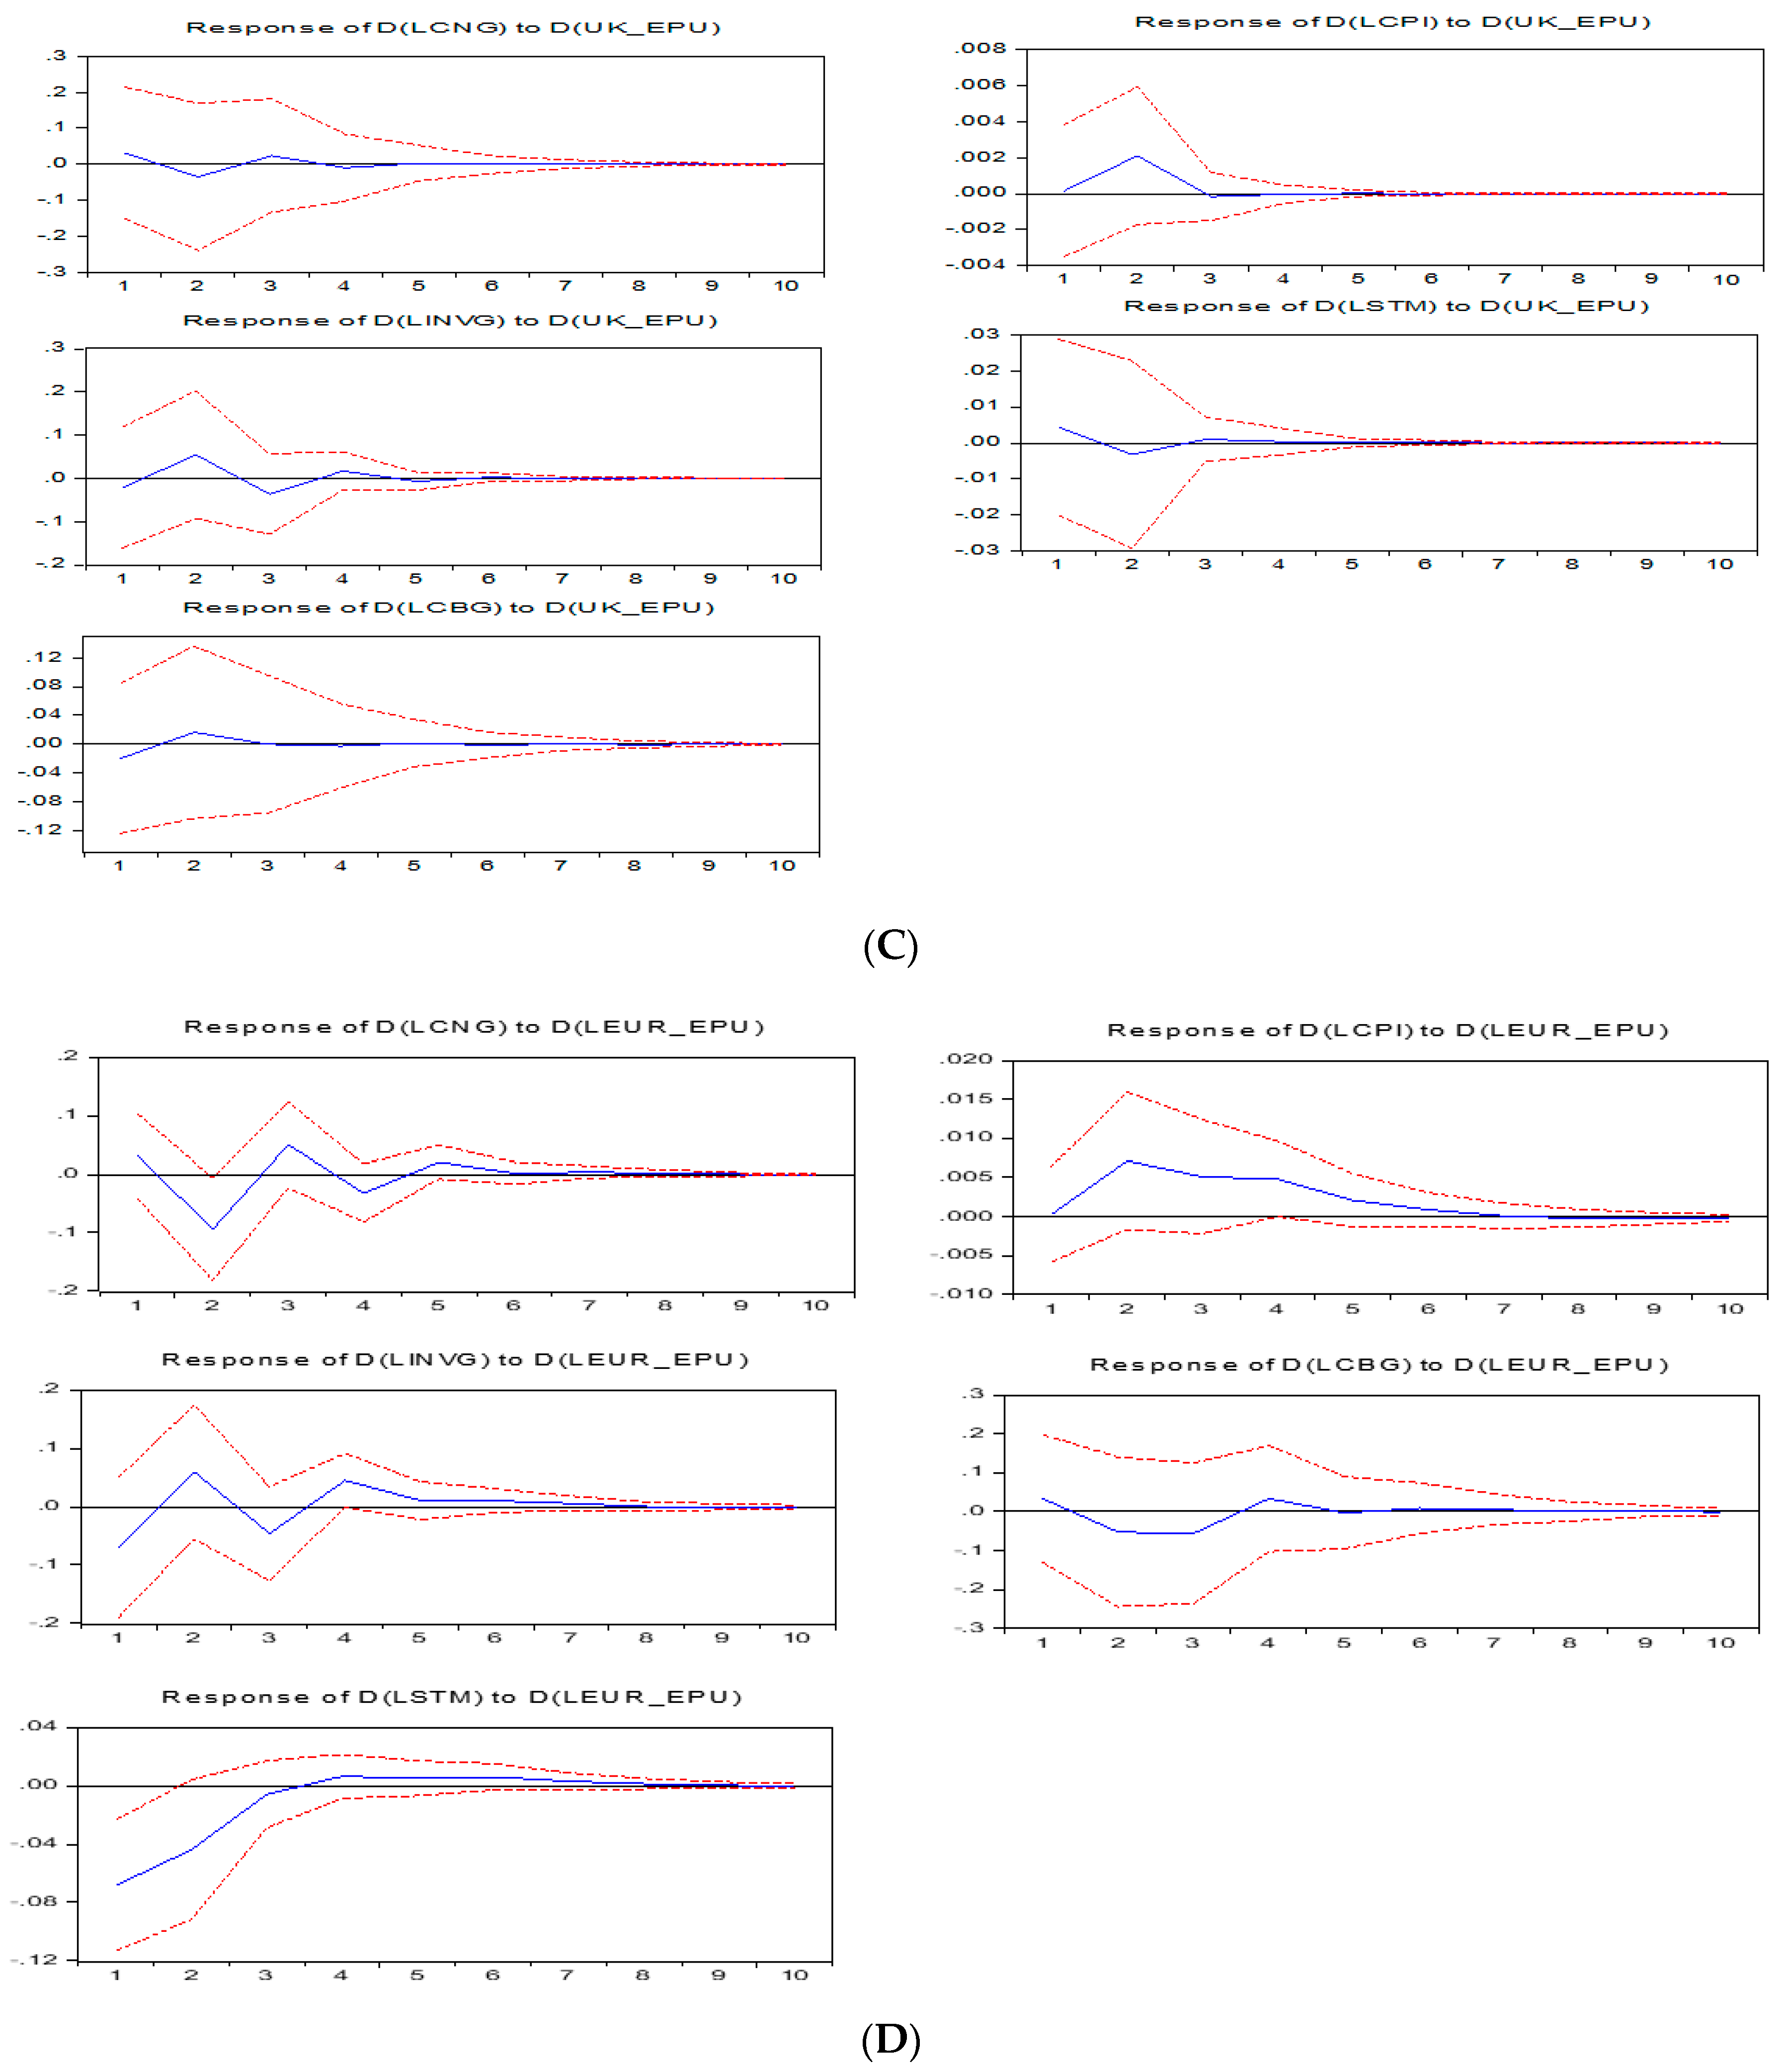
4.4. Impact of Domestic and Foreign EPU on Russia

Results reveal that domestic, as well as foreign EPU, exerts a negative impact on investment, though it recovers after a few quarters it does not shoot up. These results are corroborated by Carrière-Swallow and Céspedes (2013). Additionally, both foreign as well as domestic EPU negatively affects domestic credit by the bank, this is also supported by literature, that is, Carrière-Swallow and Céspedes (2013) with the argument: financial friction may aggravate the impact of uncertainty on investment. In line with our expectations, results postulate that domestic as well as foreign EPU hurts consumption, supporting the precautionary saving motive opinion discussed by Caballero (1990).
Furthermore, results show that EPU engenders negative supply shock, decreasing output and consumption while increasing the inflation in the economy. Moreover, results also reveal that both domestic and foreign EPU negatively affect the stock market of Russia. This is in line with the theoretical underpinnings that uncertainty increases the cost of equity thus negatively affects stock prices.

5. Variance Decomposition

The variance decomposition result of investment, private consumption, inflation, domestic credit by banks, and stock market over 10 quarters is shown in the tables below (Table 1, Table 2, Table 3 and Table 4).
Table 1 posits the results of Brazil. Results show that domestic EPU very poorly explains the variations in investment, inflation, and domestic credit, while it significantly explains the variations of consumption and the stock market, nearly from 5% to 7%. These results suggest that precautionary saving by consumers is more prevalent than differing investment by firms in an uncertain environment. Surprisingly, the EPU of the USA has very weak power in explaining the variations of the real and financial sectors of Brazil, it accounts for 4.5%, 3.6%, and 3.8% of consumption, investment, and stock market respectively. Policy uncertainty shocks of the UK and Europe have no significant power in explaining the variations in the financial or real sector of Brazil.
Table 2 displays the variations of investment, private consumption, inflation, domestic credit, and stock market of India. Like Brazil, domestic EPU of India significantly explains the 9% variation in private consumption, while it poorly explains the variations in the rest of the indicators, which implies that precautionary saving is the major factor which negatively affects the demand of goods and services and lower demand may subsequently inhibit investment, aggravating the economic growth. So, the negative impact of domestic EPU can be pacified by proper policy implication through the consumption channel.
The EPU of the USA has strong significant power to account for the 15% variation in the inflation of the Indian economy, while it has very weak power to explain the variations of the other variables. This implies that Indian policymakers should consider the impact of the USA’s EPU while devising policies to control or fine-tune the inflation in India. Investment and domestic credit growth account for 3.3% and 3.6%, respectively. Policy uncertainty shock of the UK is not significant, while the impact of Europe’s EPU on inflation, consumption, and domestic credit become significant, nearly after the fourth quarter which ranges from 5% to 7%.
Table 3 displays the variance decomposition of variables for the domestic and foreign EPU of China. The domestic policy uncertainty shocks poorly explain the variations in the real as well as financial sector except for the domestic growth, which accounts for 5% of the variations.
Additionally, the economic policy uncertainty shocks of the USA significantly explain the substantial variations in investment. These results are supported by (Forbes and Chinn (2004) as they argue that foreign policy uncertainty especially born by developed countries may substantially affect other economies. The EPU of the USA accounts for 12% of the variations in investment in the first quarter which decrease to 10% thereafter. It also explains nearly 5% of the variations in consumption after the fifth quarter, while it has no significant power to explain the rest of the variables. The EPU of the UK also significantly accounts for 8%, 5%, and 4.5% variations in investment, inflation, and consumption respectively after the third quarter, while it poorly explains the variations in the rest of the variables. Moreover, uncertainty shocks of Europe substantially explain the variations in investment and consumption, it accounts for nearly 5% of the variations after the second quarter, while it has an indiscernible impact on inflation credit growth and the stock market. The results suggest that foreign EPU creates a more negative impact on Indian economic growth than domestic EPU through investment and consumption channels. While domestic EPU has more effect on the economy through bank credit growth.
Table 4 is about the variance decomposition of economic and financial variables for the domestic and foreign EPU of Russia. The results show that domestic shocks of Russia explain 6%, 9%, 20%, and 20% of the variations in investment, consumption, inflation, and stock market, respectively. Moreover, the EPU of the USA accounts for 5%, 11%, 8.5%, and 20% for investment, consumption, inflation, and stock market, respectively, after the third quarter. Additionally, the EPU of the UK explains 8%, 4%, 5.5%, and 4% of the variations in investment, consumption, inflation, and domestic credit provided by the bank. Results show that the EPU of Europe has considerable power (nearly 5%) to explain the variations of domestic credit and the stock market, while it seems weak in explaining the variations of the real sector. Overall, results imply that foreign EPU generates more impact on the Russian economy through investment, consumption, and bank credit growth than the domestic EPU, while domestic EPU creates more impact on the stock market of Russia.

6. Conclusions

Financial crises have created bewildering situations for economists and policymakers, especially in emerging economies like the BRIC countries, so they are in the dilemma of whether only the traditional measures to check the impact of these abnormal shocks on financial and economic measures are sufficient. In this regard, this study investigates the impact of the domestic and foreign shocks on financial and macroeconomic variables, that is, consumption, investment, inflation, export, and growth of domestic credit of four BIRC countries (Brazil, Russia, India, and China) applying the Structural Vector Autoregressive (SVAR) model throughout 1997–2016.
Domestic EPU has more impact on the economy of Brazil, than any of the foreign EPUs. It has a significant role in explaining the consumption and stock market, while poorly explaining the rest of the variables. Additionally, the domestic EPU of Brazil engenders negative supply shock, negatively affecting investment and consumption while boosting inflation up, this is may be because of capital outflow from the country, which depreciates the Brazilian currency and subsequently increases the prices of imported goods. Credit growth of the banking sector has an insignificant role in multiplying the impact of shocks on real variables. Though explaining weakly, the EPU of the USA and Europe stimulate negative demand shock in Brazil. Domestic EPU harms investment and consumption, where it has more significant power to explain the variations in consumption compared to the rest of the variables. Interestingly, domestic shocks have no significant impact on the stock market of India.
The EPU of the USA creates a negative supply on the Indian economy, where it has more significant power to explain the inflation compared to the other financial and real variables. Though policy shocks of the USA poorly explain the variations in the stock market of India, they have a positive shock on it. Capital flight phenomenon can be one possible reason for the positive impact of the EPU of the USA on the Indian stock market. Policy uncertainty shocks of the UK are not significant, while the impact of Europe’s EPU on inflation, consumption, and domestic credit is significant.
Domestic as well as foreign EPU has a negative impact on the private consumption of China, where foreign EPU has more significant power in explaining consumption. Surprisingly, domestic and foreign EPUs have a time-variant impact on the gross investment of China, where the EPU of the USA has stronger significant power in explaining the variations in investment compared to domestic and other foreign countries. It may be due to the strong trade between the two countries. Domestic and Europe’s EPU has a weak but time-variant impact on the stock market of China, while the EPU of the UK hurts the stock market of China but poorly explains its variations. The EPU of the USA also has very weak explaining power in explaining the Chinese stock market, interestingly it has a positive impact on it, consistent with capital flight phenomenon (investors transfer investments from a riskier place to a safer place).
Domestic and foreign policy shocks negatively affect the real and financial variables of Russia, where the impact of domestic EPU is more significant than of foreign EPU. Though domestic credit provided by banks poorly explains the variations in Russia, it may multiply the impact of shocks on real variables. Domestic as well as foreign policy shocks engender negative supply shocks in Russia.
The findings of the study can be used by policymakers as well by investors, that is, they may consider the prominent role of domestic and foreign EPU on the real and financial sector of BRIC countries. They may also recognize that which EPU matters more for a particular economy, for instance, domestic EPU creates more impact on private consumption and stock market of the Brazilian economy while the USA EPU engenders more impact on the Indian and Chinese economy through inflation and consumption channels. Furthermore, domestic as well as foreign EPU generates substantial risk for the Russian economy through the financial sector, that is, the stock market and financial friction channels (bank credit growth).

Author Contributions

Formal analysis and Writing, A.K.; Conceptualization and Methodology, M.R.K.; Writing and Resources, R.K.; Supervision and Validation, N.H.G.; Review and Editing, S.A.D.; Resources, V.K. All authors have read and agreed to the published version of the manuscript.

Funding

This research did not receive any external funding.

Conflicts of Interest

The authors declare no conflict of interest.

References

  1. Alessandri, Piergiorgio, and Haroon Mumtaz. 2014. Financial Regimes and Uncertainty Shocks. Available online: https://eprints.bbk.ac.uk/id/eprint/26589/ (accessed on 30 September 2019).
  2. Alfaro, Ivan, Nicholas Bloom, and Xiaoji Lin. 2016. The Finance-Uncertainty Multiplier. Stanford: Economics Department, Stanford University. [Google Scholar]
  3. Baker, Scott R., Nicholas Bloom, and Steven J. Davis. 2016. Measuring economic policy uncertainty. The Quarterly Journal of Economics 131: 1593–636. [Google Scholar] [CrossRef]
  4. Bernanke, Ben S. 1983. Irreversibility, uncertainty, and cyclical investment. The Quarterly Journal of Economics 98: 85–106. [Google Scholar] [CrossRef]
  5. Bhagat, Pulak Ghosh, and Srinivasan P. Rangan. 2013. Economic Policy Uncertainty and Economic Growth in India. IIM Bangalore Research Paper No. 407. Bengaluru: Indian Institute of Management Bangalore. [Google Scholar]
  6. Bloom, Nicholas. 2009. The impact of uncertainty shocks. Econometrica 77: 623–85. [Google Scholar]
  7. Bodie, Zvi. 1976. Common stocks as a hedge against inflation. The Journal of Finance 31: 459–70. [Google Scholar] [CrossRef]
  8. Bordo, Michael D., John V. Duca, and Christoffer Koch. 2016. Economic policy uncertainty and the credit channel: Aggregate and bank level US evidence over several decades. Journal of Financial Stability 26: 90–106. [Google Scholar] [CrossRef] [Green Version]
  9. Caballero, Ricardo J. 1990. Consumption puzzles and precautionary savings. Journal of Monetary Economics 25: 113–36. [Google Scholar] [CrossRef]
  10. Caggiano, Giovanni, Efrem Castelnuovo, and Nicolas Groshenny. 2014. Uncertainty shocks and unemployment dynamics in US recessions. Journal of Monetary Economics 67: 78–92. [Google Scholar] [CrossRef] [Green Version]
  11. Caldara, Dario, Cristina Fuentes-Albero, Simon Gilchrist, and Egon Zakrajšek. 2016. The macroeconomic impact of financial and uncertainty shocks. European Economic Review 88: 185–207. [Google Scholar] [CrossRef] [Green Version]
  12. Campbell, John Y., and Robert J. Shiller. 1988. Stock prices, earnings, and expected dividends. The Journal of Finance 43: 661–76. [Google Scholar] [CrossRef]
  13. Carrière-Swallow, Yan, and Luis Felipe Céspedes. 2013. The impact of uncertainty shocks in emerging economies. Journal of International Economics 90: 316–25. [Google Scholar] [CrossRef] [Green Version]
  14. Cheng, Chak Hung Jack. 2017. Effects of foreign and domestic economic policy uncertainty shocks on South Korea. Journal of Asian Economics 51: 1–11. [Google Scholar] [CrossRef]
  15. Cheng, Hui Fang, Margarida Gutierrez, Arvind Mahajan, Yochanan Shachmurove, and Manuchehr Shahrokhi. 2007. A future global economy to be built by BRICs. Global Finance Journal 18: 143–56. [Google Scholar] [CrossRef]
  16. Christiano, Lawrence, Roberto Motto, and Massimo Rostagno. 2007. Financial Factors in Business Cycles. Available online: http://citeseerx.ist.psu.edu/viewdoc/summary?doi=10.1.1.192.5766 (accessed on 5 October 2019).
  17. Colombo, Valentina. 2013. Economic policy uncertainty in the US: Does it matter for the Euro area? Economics Letters 121: 39–42. [Google Scholar] [CrossRef] [Green Version]
  18. Enders, Walter. 2004. Applied econometric time series, by walter. Technometrics 46: 264. [Google Scholar]
  19. Fama, Eugene F., and G. William Schwert. 1977. Asset returns and inflation. Journal of Financial Economics 5: 115–46. [Google Scholar] [CrossRef]
  20. Forbes, Kristin J., and Menzie D. Chinn. 2004. A decomposition of global linkages in financial markets over time. The Review of Economics and Statistics 86: 705–22. [Google Scholar] [CrossRef] [Green Version]
  21. Gilchrist, Simon, Jae W. Sim, and Egon Zakrajšek. 2014. Uncertainty, financial frictions, and investment dynamics. National Bureau of Economic Research. [Google Scholar] [CrossRef]
  22. Gourio, Francois, Michael Siemer, and Adrien Verdelhan. 2013. International risk cycles. Journal of International Economics 89: 471–84. [Google Scholar] [CrossRef] [Green Version]
  23. Handley, Kyle, and Nuno Limao. 2015. Trade and investment under policy uncertainty: Theory and firm evidence. American Economic Journal: Economic Policy 7: 189–222. [Google Scholar] [CrossRef] [Green Version]
  24. Jawadi, Fredj, Sushanta K. Mallick, and Ricardo M. Sousa. 2011. Monetary policy rules in the BRICS: How important is nonlinearity? NIPE Working Paper 18: 1–33. [Google Scholar]
  25. Keynes, John Maynard. 1937. The general theory of employment. The Quarterly Journal of Economics 51: 209–23. [Google Scholar] [CrossRef]
  26. Knight, Frank H. 1921. Risk, Uncertainty and Profit. New York: Hart, Schaffner and Marx. [Google Scholar]
  27. Leduc, Sylvain, and Zheng Liu. 2013. Uncertainty and the slow labor market recovery. FRBSF Economic Letter 21: 22. [Google Scholar]
  28. Mensi, Walid, Shawkat Hammoudeh, Juan Carlos Reboredo, and Duc Khuong Nguyen. 2014. Do global factors impact BRICS stock markets? A quantile regression approach. Emerging Markets Review 19: 1–17. [Google Scholar] [CrossRef]
  29. Moro, Beniamino. 2014. Lessons from the European economic and financial great crisis: A survey. European Journal of Political Economy 34: S9–S24. [Google Scholar] [CrossRef]
  30. Mumtaz, Haroon, and Konstantinos Theodoridis. 2015. The international transmission of volatility shocks: An empirical analysis. Journal of the European Economic Association 13: 512–33. [Google Scholar] [CrossRef]
  31. Nodari, Gabriela. 2014. Financial regulation policy uncertainty and credit spreads in the US. Journal of Macroeconomics 41: 122–32. [Google Scholar] [CrossRef] [Green Version]
  32. Park, Chuhwan, Mo Chung, and Sukgyu Lee. 2011. The effects of oil price on regional economies with different production structures: A case study from Korea using a structural VAR model. Energy Policy 39: 8185–95. [Google Scholar] [CrossRef]
  33. Pfaff, Bernhard. 2008. VAR, SVAR and SVEC models: Implementation within R package vars. Journal of Statistical Software 27: 1–32. [Google Scholar] [CrossRef] [Green Version]
  34. Sharpe, Steven A. 2002. Reexamining stock valuation and inflation: The implications of analysts’ earnings forecasts. Review of Economics and Statistics 84: 632–48. [Google Scholar] [CrossRef]
  35. Sheng, Xuguang Simon, and Yang Liu. 2017. The Measurement and Transmission of Macroeconomic Uncertainty: Evidence from the US and BRIC Countries. International Journal of Forecasting 35: 967–79. [Google Scholar]
  36. Schwert, G. William. 1981. The adjustment of stock prices to information about inflation. The Journal of Finance 36: 15–29. [Google Scholar] [CrossRef]
  37. Sum, Vichet. 2012. The Reaction of Stock Markets in the BRIC Countries to Economic Policy Uncertainty in the United States. Available online: https://papers.ssrn.com/sol3/papers.cfm?abstract_id=2094697 (accessed on 20 September 2019).
  38. Yang, Yongzheng, and Issouf Samaké. 2011. Low-Income Countries’ BRIC Linkage: Are There Growth Spillovers? Available online: https://papers.ssrn.com/sol3/papers.cfm?abstract_id=1974835 (accessed on 25 September 2019).
Figure 1. Shows the impulse response function of consumption, inflation, investment, credit growth and stock market to domestic EPU and foreign EPUs of USA, UK and Europe in context of Brazil. (A) Impact of Domestic EPU on Brazil. Note: It shows the impulse response function of consumption, inflation, investment, credit growth and stock market to a Cholesky one standard deviation domestic EPU in context of Brazil. Whereas, the two outer lines are Monte Carlo constructed 95% confidence interval; (B) Impact of US EPU on Brazil. Note: It shows the impulse response function of consumption, inflation, investment, credit growth and stock market to a Cholesky one standard deviation foreign EPU i.e., USA in context of Brazil. Whereas, the two outer lines are Monte Carlo constructed 95% confidence interval; (C) Impact of UK EPU on Brazil. Note: It shows the impulse response function of consumption, inflation, investment, credit growth and stock market to a Cholesky one standard deviation foreign EPU i.e., UK in context of Brazil. Whereas, the two outer lines are Monte Carlo constructed 95% confidence interval; (D) Impact of Europe EPU on Brazil. Note: It shows the impulse response function of consumption, inflation, investment, credit growth and stock market to a Cholesky one standard deviation foreign EPU i.e., Europe in context of Brazil. Whereas, the two outer lines are Monte Carlo constructed 95% confidence interval.
Jrfm 13 00315 g001aJrfm 13 00315 g001bJrfm 13 00315 g001c
Figure 2. Shows the impulse response function of consumption, inflation, investment, credit growth and stock market to domestic EPU and foreign EPUs of USA, UK and Europe in context of Brazil. (A) Impact of Domestic EPU on India. Note: It shows the impulse response function of consumption, inflation, investment, credit growth and stock market to a Cholesky one standard deviation Domestic EPU context of India. Whereas, the two outer lines are Monte Carlo constructed 95% confidence interval. (B) Impact of US EPU on India. Note: It shows the impulse response function of consumption, inflation, investment, credit growth and stock market to a Cholesky one standard deviation Foreign EPU i.e., USA in context of India. Whereas, the two outer lines are Monte Carlo constructed 95% confidence interval. (C) Impact of UK EPU on India. Note: It shows the impulse response function of consumption, inflation, investment, credit growth and stock market to a Cholesky one standard deviation foreign EPU i.e., UK in context of India. Whereas, the two outer lines are Monte Carlo constructed 95% confidence interval. (D) Impact of Europe EPU on India. Note: It shows the impulse response function of consumption, inflation, investment, credit growth and stock market to a Cholesky one standard deviation foreign EPU i.e., Europe in context of India. Whereas, the two outer lines are Monte Carlo constructed 95% confidence interval.
Jrfm 13 00315 g002aJrfm 13 00315 g002b
Figure 3. (A) Impact of Domestic EPU on China. Note: It shows the impulse response function of consumption, inflation, investment, credit growth and stock market to a Cholesky one standard deviation Domestic EPU context of China. Whereas, the two outer lines are Monte Carlo constructed 95% confidence interval. (B) Impact of US EPU on China. Note: It shows the impulse response function of consumption, inflation, investment, credit growth and stock market to a Cholesky one standard deviation foreign EPU i.e., USA in context of China. Whereas, the two outer lines are Monte Carlo constructed 95% confidence interval. (C) Impact of UK EPU on China. Note: It shows the impulse response function of consumption, inflation, investment, credit growth and stock market to a Cholesky one standard deviation foreign EPU i.e., UK in context of China. Whereas, the two outer lines are Monte Carlo constructed 95% confidence interval. (D) Impact of Europe EPU on China. Note: It shows the impulse response function of consumption, inflation, investment, credit growth and stock market to a Cholesky one standard deviation foreign EPU i.e., Europe in context of China. Whereas, the two outer lines are Monte Carlo constructed 95% confidence interval.
Jrfm 13 00315 g003aJrfm 13 00315 g003b
Figure 4. Shows the (A) Impact of Domestic EPU on Russia. Note: It shows the impulse response function of consumption, inflation, investment, credit growth and stock market to a Cholesky one standard deviation Domestic EPU context of Russia. Whereas, the two outer lines are Monte Carlo constructed 95% confidence interval. (B) Impact of US EPU on Russia. Note: It shows the impulse response function of consumption, inflation, investment, credit growth and stock market to a Cholesky one standard deviation foreign EPU i.e., USA in context of Russia. Whereas, the two outer lines are Monte Carlo constructed 95% confidence interval. (C) Impact of UK EPU on Russia. Note: It shows the impulse response function of consumption, inflation, investment, credit growth and stock market to a Cholesky one standard deviation foreign EPU i.e., UK in context of Russia. Whereas, the two outer lines are Monte Carlo constructed 95% confidence interval. (D) Impact of Europe EPU on Russia. Note: It shows the impulse response function of consumption, inflation, investment, credit growth and stock market to a Cholesky one standard deviation foreign EPU i.e., Europe in context of Russia. Whereas, the two outer lines are Monte Carlo constructed 95% confidence interval.
Jrfm 13 00315 g004aJrfm 13 00315 g004b
Table 1. Brazil. (a) Variance Decomposition of Domestic EPU. (b) Variance Decomposition of USA EPU. (c) Variance Decomposition of UK EPU. (d) Variance Decomposition of Europe EPU.
(a)
Period l n I G t l n C G t l n I n f t l n C B G t l n S P t
10.2084.6950.0480.5931.357
23.3077.5501.0910.5305.944
33.4217.6981.1600.5376.727
43.5027.8551.1560.6206.663
53.5027.8641.1540.6266.691
63.5037.8661.1540.6346.686
73.5037.8671.1550.6366.685
83.5037.8661.1550.6366.685
93.5037.8661.1550.6376.685
103.5037.8661.1550.6376.685
(b)
Period l n I G t l n C G t l n I n f t l n C B G t l n S P t
10.0001.9321.4970.3221.895
23.7314.1881.1740.5143.780
33.6754.4401.1150.6543.935
43.6804.5231.1360.6913.894
53.6734.5371.1380.7263.883
63.6714.5371.1420.7403.880
73.6714.5381.1420.7453.880
83.6714.5371.1420.7483.880
93.6714.5371.1420.7483.880
103.6714.5371.1420.7493.880
(c)
Period l n I G t l n C G t l n I n f t l n C B G t l n S P t
10.0000.2181.0930.2530.198
20.7662.0231.1060.3031.350
30.8882.0541.0990.2881.278
40.8992.0831.0860.2811.387
50.9012.0831.0840.2831.384
60.9012.0831.0840.2831.385
70.9012.0831.0840.2831.385
80.9012.0831.0840.2841.384
90.9012.0831.0840.2841.384
100.9012.0831.0840.2841.384
(d)
Period l n I G t l n C G t l n I n f t l n C B G t l n S P t
10.0000.2090.7380.1120.479
20.9991.1962.0490.1830.449
30.9731.5091.9670.3230.438
40.9671.5382.0700.4480.433
50.9671.5572.0660.5090.443
60.9691.5572.0720.5460.443
70.9691.5582.0720.5590.445
80.9691.5582.0720.5650.445
90.9691.5582.0720.5670.445
100.9691.5582.0720.5680.445
Table 2. India. (a) Variance Decomposition of Domestic EPU. (b) Variance Decomposition of USA EPU. (c) Variance Decomposition of UK EPU. (d) Variance Decomposition of Europe EPU.
(a)
Period l n I G t l n C G t l n I n f t l n C B G t l n S P t
12.2569.2590.1582.8420.010
22.2378.2720.3032.0580.012
32.3758.1450.3911.9040.013
42.4028.1110.4031.8700.013
52.4048.1050.4031.8630.013
62.4048.1040.4031.8610.013
72.4048.1030.4031.8610.013
82.4048.1030.4031.8610.013
92.4048.1030.4031.8610.013
102.4048.1030.4031.8610.013
(b)
Period l n I G t l n C G t l n I n f t l n C B G t l n S P t
11.7220.37613.1083.6342.158
22.3410.37414.6023.8352.099
33.0570.77014.9643.6252.220
43.2660.92014.9563.6122.236
53.3180.95714.9553.6342.235
63.3290.96414.9543.6502.236
73.3320.96614.9543.6572.236
83.3320.96614.9543.6602.236
93.3320.96614.9543.6612.236
103.3320.96614.9543.6612.236
(c)
Period l n I G t l n C G t l n I n f t l n C B G t l n S P t
10.1240.1590.0100.1830.165
20.8220.2771.5860.2390.225
31.1260.3321.5840.2260.229
41.1870.3401.5840.2240.229
51.1980.3401.5840.2250.229
61.2000.3401.5840.2250.229
71.2000.3401.5840.2250.229
81.2000.3401.5840.2250.229
91.2000.3401.5840.2250.229
101.2000.3401.5840.2250.229
(d)
Period l n I G t l n C G t l n I n f t l n C B G t l n S P t
11.1491.1274.9140.3080.345
21.0282.5356.6711.2410.310
31.0174.8517.0243.1510.309
41.0165.7327.0364.4460.345
51.0165.9097.0335.0070.353
61.0155.9247.0335.1910.357
71.0165.9237.0345.2400.358
81.0165.9247.0345.2510.358
91.0165.9247.0345.2540.358
101.0165.9247.0345.2540.358
Table 3. China. (a) Variance Decomposition of Domestic EPU. (b) Variance Decomposition of USA EPU. (c) Variance Decomposition of UK EPU. (d) Variance Decomposition of Europe EPU.
(a)
Period l n I G t l n C G t l n I n f t l n C B G t l n S P t
10.0000.3680.0120.8710.000
20.3430.5461.8534.3620.156
30.5520.6702.2854.4970.194
40.6090.7262.3994.4970.194
50.6260.7402.4154.4980.195
60.6310.7442.4204.4990.196
70.6330.7452.4214.4990.196
80.6330.7452.4214.4990.196
90.6330.7452.4214.4990.196
100.6330.7452.4214.4990.196
(b)
Period l n I G t l n C G t l n I n f t l n C B G t l n S P t
112.1461.2151.5650.9272.134
210.3463.0361.4670.9962.998
310.3684.0422.1081.1523.042
410.3904.4292.1161.4023.033
510.3874.5202.1161.4563.044
610.3854.5352.1171.4603.045
710.3854.5362.1171.4603.046
810.3864.5362.1171.4603.046
910.3864.5362.1171.4603.046
1010.3864.5362.1171.4603.046
(c)
Period l n I G t l n C G t l n I n f t l n C B G t l n S P t
10.0004.3520.4133.2170.000
25.4984.0874.7693.0110.003
37.5774.0705.4153.5280.092
48.1234.0675.4913.9530.095
58.2564.0655.4944.0880.099
68.2844.0665.4944.1210.099
78.2904.0665.4944.1280.099
88.2914.0665.4944.1290.099
98.2914.0665.4944.1290.099
108.2914.0665.4944.1290.099
(d)
Period l n I G t l n C G t l n I n f t l n C B G t l n S P t
15.3993.5890.1361.7850.374
24.7474.5171.8791.5300.406
35.0104.9272.2631.8500.513
45.1485.0472.3122.1430.544
55.1955.0742.3172.2540.555
65.2095.0802.3172.2860.558
75.2135.0812.3172.2940.559
85.2145.0812.3172.2960.559
95.2145.0822.3172.2970.559
105.2145.0822.3172.2970.559
Table 4. Russia. (a) Variance Decomposition of Domestic EPU. (b) Variance Decomposition of USA EPU. (c) Variance Decomposition of UK EPU. (d) Variance Decomposition of Europe EPU.
(a)
Period l n I G t l n C G t l n I n f t l n C B G t l n S P t
12.8080.1324.9010.00018.540
25.1016.57119.1601.33420.828
35.0838.72319.2751.24420.370
46.3209.11720.2151.25320.362
56.3989.54220.2281.29720.346
66.4299.53020.2101.29620.417
76.4519.53220.2021.32120.415
86.4519.53720.2041.32220.416
96.4519.53720.2051.32320.415
106.4529.53620.2061.32420.415
(b)
Period l n I G t l n C G t l n I n f t l n C B G t l n S P t
13.9350.2510.0000.00019.595
24.35310.0916.0500.03119.453
34.39611.0507.5851.85319.318
44.79111.1158.4562.28019.302
54.91411.0938.7222.23119.092
64.95111.1328.7452.26219.116
74.96211.1268.7422.25519.106
84.96311.1298.7422.25819.109
94.96311.1298.7432.25819.108
104.96311.1298.7442.25719.107
(c)
Period l n I G t l n C G t l n I n f t l n C B G t l n S P t
10.0004.3520.4133.2170.000
25.4984.0874.7693.0110.003
37.5774.0705.4153.5280.092
48.1234.0675.4913.9530.095
58.2564.0655.4944.0880.099
68.2844.0665.4944.1210.099
78.2904.0665.4944.1280.099
88.2914.0665.4944.1290.099
98.2914.0665.4944.1290.099
108.2914.0665.4944.1290.099
(d)
Period l n I G t l n C G t l n I n f t l n C B G t l n S P t
10.0181.4330.0190.2124.598
20.6492.1810.1802.0663.977
30.9502.2680.4084.2034.200
41.0222.2710.5014.7944.208
51.0242.2470.5604.8754.141
61.0252.2730.5634.9164.138
71.0272.2720.5644.9154.132
81.0272.2760.5644.9184.132
91.0272.2760.5644.9184.132
101.0272.2760.5654.9184.132
Publisher’s Note: MDPI stays neutral with regard to jurisdictional claims in published maps and institutional affiliations.

