Article

Liquidity-Saving through Obligation-Clearing and Mutual Credit: An Effective Monetary Innovation for SMEs in Times of Crisis

1
Be Solutions d.o.o., Bleiweisova cesta 30, 1000 Ljubljana, Slovenia
2
Department of Media and Communications, London School of Economics and Political Science, London WC2A 2AE, UK
3
Sardex S.p.A., Viale Sant’Ignazio 16, 09038 Serramanna, Italy
*
Author to whom correspondence should be addressed.
J. Risk Financial Manag. 2020, 13(12), 295; https://doi.org/10.3390/jrfm13120295
Submission received: 2 November 2020 / Revised: 24 November 2020 / Accepted: 26 November 2020 / Published: 27 November 2020
(This article belongs to the Special Issue Monetary Plurality and Crisis)

Abstract

:
During financial crises, liquidity tends to become scarce, a problem that disproportionately affects small companies. This paper shows that obligation-clearing is a very effective liquidity-saving method for providing relief in the trade credit market and, therefore, on the supply-side or productive part of the economy. The paper also demonstrates that when used in conjunction with a complementary currency system such as mutual credit as a liquidity source the effectiveness of obligation-clearing can be doubled. Real data from the Sardex mutual credit system show a reduction of net internal debt of the obligation network of approximately 25% when obligation-clearing is used by itself and of 50% when it is used together with mutual credit. These instruments are also relevant from the point of view of risk mitigation for lenders, based in part on the information on individual companies that the mutual credit circuit manager can provide to banks (upon the circuit member’s request) and in part on the relief that liquidity-saving provides especially to NPL companies. The paper concludes by outlining recommendations for how even greater savings could be achieved by including the tax authority as another node in the obligation network.

Graphical Abstract

1. Introduction

The economic impact of the Covid-19 health emergency highlights the need for extraordinary tools for government intervention in fiscal and monetary policy. Standard monetary policy levers such as base rate control and the more recent Quantitative Easing (QE) interventions are slow in delivering liquidity to the real economy and ineffective at reaching the economic actors who need help the most, i.e., small and medium-sized enterprises (SMEs). As argued by Simmons et al. (2020), even more targeted cash outlays than helicopter drops are needed, even while many countries have sent cash to employers as long as they did not fire their employees, to the self-employed, or even to every citizen as in the case of the US. These are helpful short-term measures, but cannot be sustained for more than a few months due to the huge impact on the deficit and public debt. Crucially, they tend to help the demand side of the economy more than the supply side. This paper argues that liquidity-saving through obligation-clearing1 provides a remarkably effective and instantaneous relief mechanism that is felt particularly strongly by the supply side, especially if tax obligations are also included. Furthermore, the paper also shows that including mutual credit as an additional liquidity source increases the number of obligations cleared remarkably, with clear benefits for the SME sector.
Whereas obligation-clearing works at the national level and with companies of any size, mutual credit is most relevant to SMEs and tends to work more effectively at the local level due to its reliance on—and reinforcement of—social values and social relations (Dini and Kioupkiolis 2019; Littera et al. 2017; Motta et al. 2017; Sartori and Dini 2016). Since both methods imply tax transparency and require high levels of trust, their complementarity in terms of the scale of impact facilitates the establishment of a context for collaboration between top-down policy intervention by the government and bottom-up resilience and self-determination by the smallest players. Very simply put, when liquidity is scarce, liquidity-saving becomes a common good that every stakeholder benefits from and, therefore, that can foster improved relations between them.

1.1. Literature Review

Liquidity-saving mechanisms (LSMs) such as clearing houses, complementary currencies, debt recovery services, etc. are a well-studied part of interbank payment systems, and their importance is recognized in payment and settlement systems. Tompkins and Olivares (2016) observe that LSMs are used in all 27 jurisdictions of the EU. Most payment systems are becoming more open to a greater number of direct participants, and are leveraging centralized architectures to implement advanced liquidity-management tools. This evolution is necessary for the payment systems to be able to keep up with the development of the economy. Galbiati and Soramäki (2010) point out that banks have a tendency to under-provide liquidity and, therefore, incur higher delays and overall costs than is socially optimal. A “central planner” using an LSM would provide the economy with more liquidity than banks do. So it is important to introduce an LSM in markets that are interconnected with payment systems to reduce the risk of spillovers (e.g., a domino effect of payment defaults) and to provide enough liquidity for the smooth running of the economy.
The opportunity to save liquidity is a consequence of the presence of queues in payment systems. It often turns out that the payments cannot be processed in the order they are queued. In such cases, it makes sense to look at payment orders as a network of obligations. Such a network contains cycles that are the cause of liquidity shortage (gridlock) in sequential payment processing. In general, cyclical structures create situations in which several payments cannot be settled individually but can be settled simultaneously. These structures and the methods to resolve liquidity shortages are described in a 2005 Bank of Finland report (Leinonen 2005), a collection of seven separate studies on payment and clearing systems using simulation techniques. We will use similar simulations to demonstrate the effects of obligation-clearing and complementary currency LSMs in different scenarios.
The effects of cyclical structures on the stability of the financial system are described by Bardoscia et al. (2017), who show how easily they spread instability within the financial system. Unresolved gridlocks and payment defaults due to insolvency are typical examples of such instabilities. They undermine system stability no matter how the institutions involved interact. It takes as little as 3% of payment orders forming cyclical structures to start the instability. If left unchecked, instability spreads through the financial system and spills over to other interconnected subsystems—a worsening problem since their degree of interconnection keeps increasing. This effect is best described in a Bank of International Settlements report (BIS 2008), which points out that the interdependences are particularly strong in the same currency area. The importance of managing the instabilities caused by cyclical structures by implementing LSMs is emphasized by Foote (2014), who shows that an LSM in one system reduces the probability of liquidity stress in another system. In other words, the introduction of an LSM generates positive externalities. Consistently with this recommendation, the present paper argues that complementary currencies (CCs) provide a very significant benefit when used in conjunction with an obligation-clearing LSM in trade credit systems.
In the ever-more interconnected financial system, trade credit tends to be neglected in spite of the fact that it is the second-most important source of finance for firms, and often the sole source of finance for SMEs. Trade credit is used to manage liquidity needs and serves as a liquidity buffer in cases of temporary liquidity shocks (Cunat and García-Appendini 2012). For example, trade credit allows suppliers to act as financial intermediaries when they have better access to financial markets than their customers, which creates a strong connection between the trade credit market and payment systems. Thus, the integration of a mutual credit CC with trade credit obligation-clearing within the same LSM is a step towards better management of liquidity overall.
As discussed by Graeber (2011) and many others, the earliest historical record of what today we call mutual credit goes back to the Babylonians approximately 5000 years ago, whereas coins were invented much later, about 2700 years ago in Lydia (in modern-day Turkey). In the modern era, aside from unsuccessful early experiments by Pierre-Joseph Proudhon and Robert Owen, the earliest example of a mutual credit system is the Swiss WIR,2 short for ‘Wirtschaftsring’ or ‘economic circle’ but also the ‘we’ personal pronoun in German, which was set up in 1934 in response to the Great Depression (Studer 1998) as a business-to-business (B2B) system between small Swiss companies. More recently, in the early 1980s, Michael Linton created the LETS system3, focused on the individual as the main economic actor, of which there are now thousands of examples around the world.
As discussed more fully in Dini and Kioupkiolis (2019), complementary currencies, by design, do not aim to supplant legal tender but, rather, cater to some of the parts of the economy that legal tender for one reason or another is not able to support. In fact, they tend to emerge during financial crises, when the failure of the dominant economic system to serve the weakest parts of the economy stimulates the latter into action, often through a creative mixture of social, entrepreneurial, and monetary innovation. The main problem of community or complementary currencies is that they remain a relatively small part of the participating companies’ turnover or of a region’s economy. However, as we show in this paper, when combined with obligation-clearing, they can have a large impact on liquidity-saving in the overall fiat trade credit market.
Such a monetary and payment system innovation perspective is especially important in the context of the current Covid-19 pandemic. The pandemic has exposed a catastrophic lack of resilience in the economy, which needs to be urgently addressed not only for the economy to survive the next couple of years, but because, unfortunately, this will not be the last crisis. Flögel and Gärtner (2020) argue that we require a more balanced spatial development. For example, access to finance should be provided by a mix of private, public and cooperative financial institutions. van Dalen and Henkens (2020) point out the need to address the lack of financial or in-kind buffers as an essential part of dealing with the crisis. This is especially important for SMEs that tend to be most vulnerable during this kind of shock. Juergensen et al. (2020) call for different kinds of financial support to prevent liquidity crunches. This is consistent with our paper since saving fiat liquidity is an obvious form of financial support. Byck and Heijmans (2020) demonstrate that a combination of LSMs shows a more substantial reduction in liquidity requirements than any single method working alone. Our research has reached a similar conclusion for liquidity-saving, in the form of obligation-clearing and mutual credit working together as a strong factor toward a more resilient economy. Although these are all important points and initiatives, the main research gap in the current literature appears to be a lack of scrutiny of the use of LSMs in the trade credit market. Building on the Slovenian experience for the past 30 years, in this paper we show that there is a huge potential for beneficial economic and financial impact in this area. The main novel research contribution is the finding that the integration of mutual credit with obligation-clearing doubles the liquidity-saving impact of the latter.
In the next section, we provide a historical description of obligation-clearing in Slovenia, and then conclude the Introduction with a brief statement of the research hypothesis. In Section 2 we show the effects of the model described in Fleischman and Dini (2020), which can be efficiently applied to large data sets of millions of invoices between hundreds of thousands of companies, and provide the results for three different scenarios: invoice-netting alone, mutual credit alone, and invoice-netting with mutual credit. The analysis is based on real anonymized data from the Sardex circuit. In each case, we perform a simple statistical analysis to provide quantitative estimates of the liquidity saved as a fraction of the total volume of trade. Section 3 presents a critical comparison of obligation-clearing as a form of money with mutual credit and legal tender. Section 4 includes a simplified technical description of both liquidity-saving methods. The final section offers some conclusions and recommendations about the bigger picture opened up by these collaborative and transparency-based approaches for the sustainability of the SME sector and for the constructive interaction with the tax authority and with other financial instruments such as microcredit.

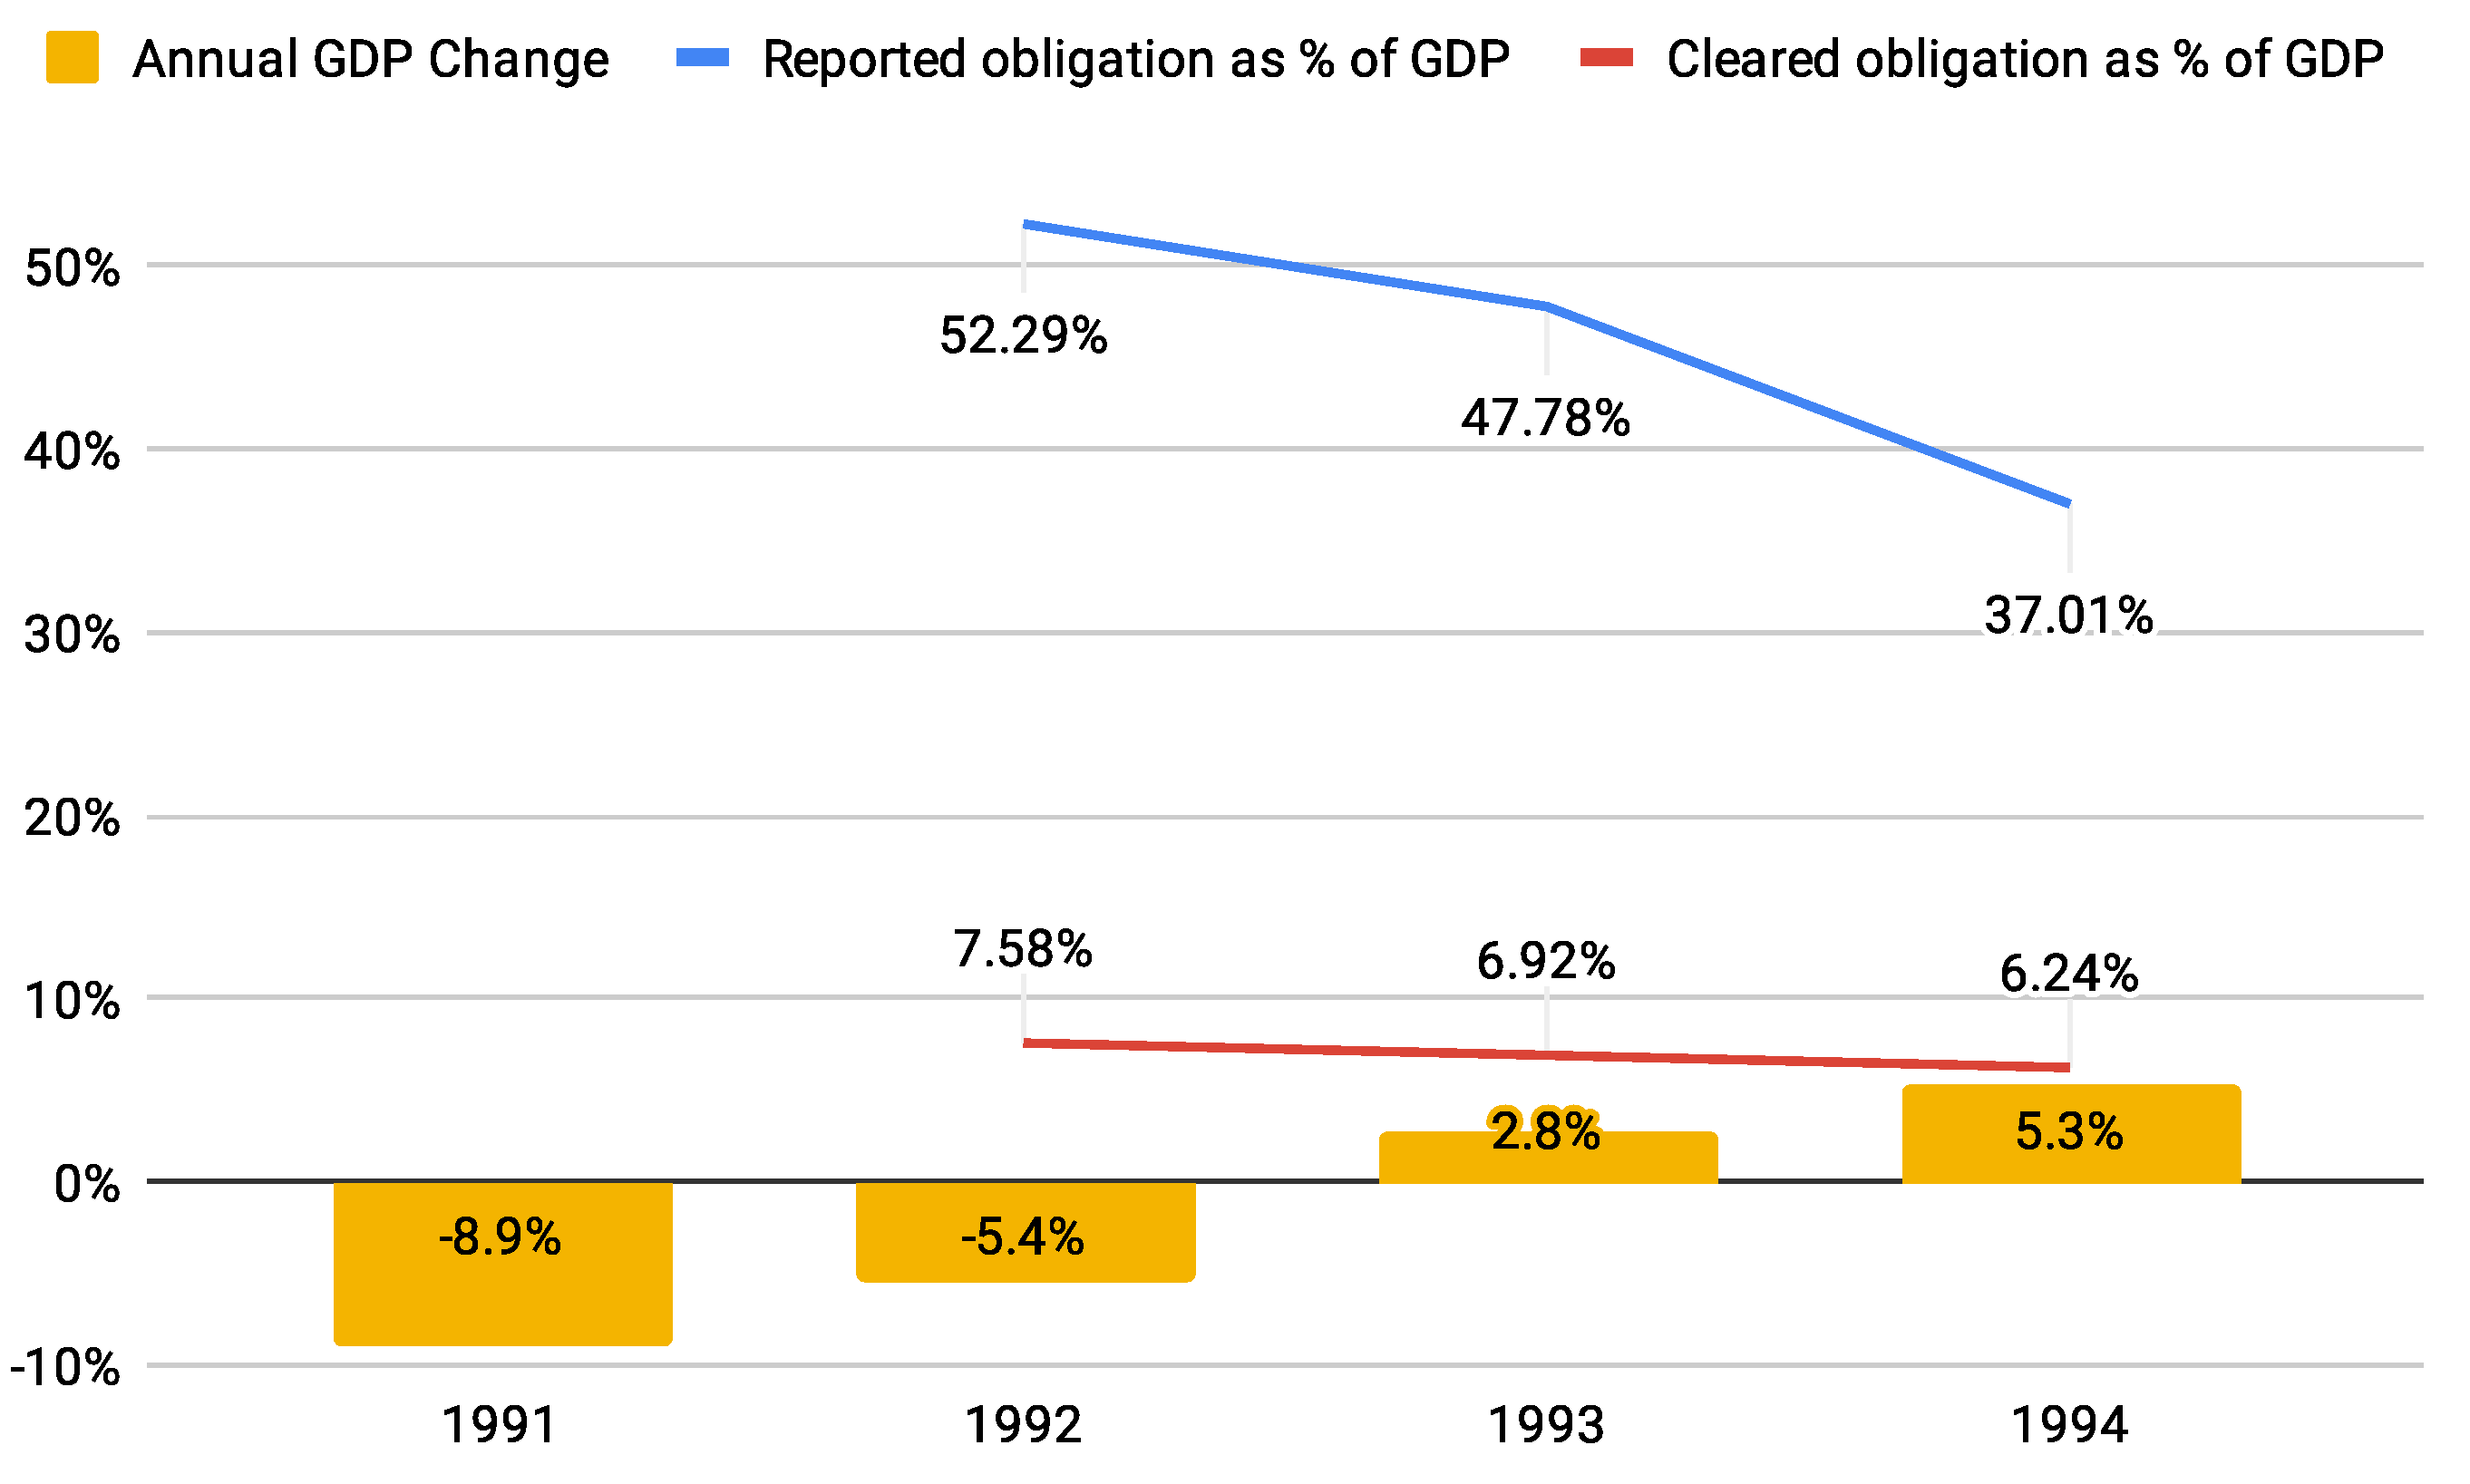
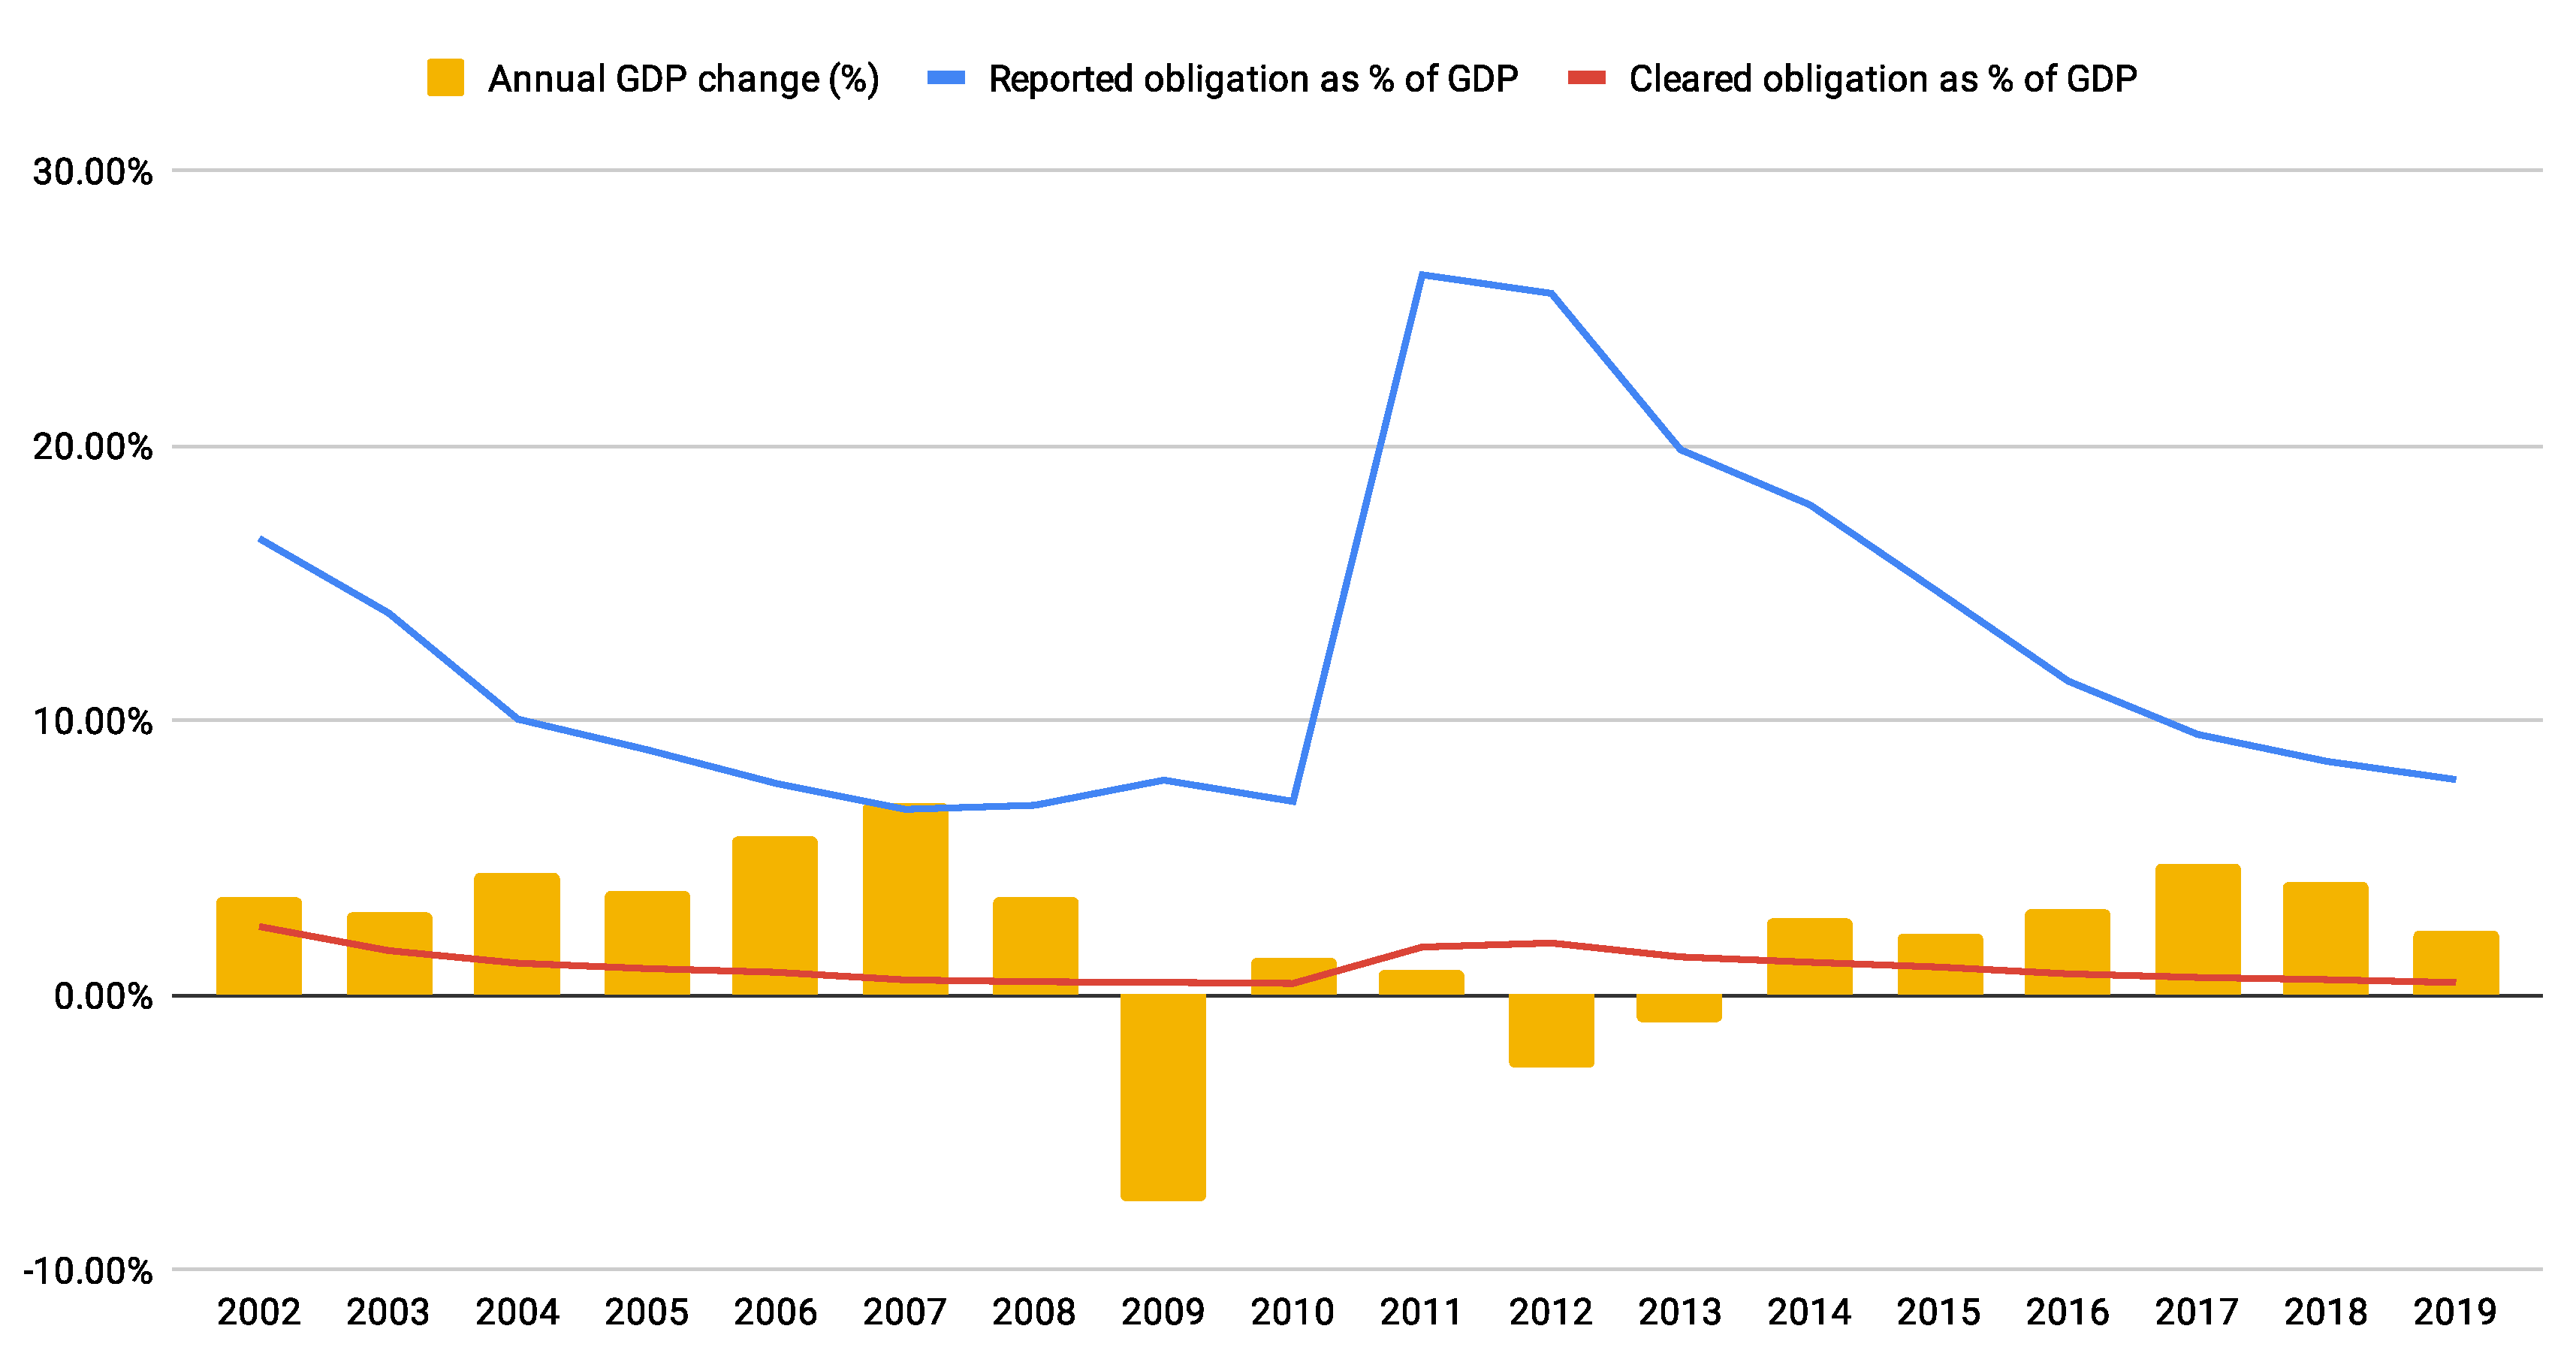
1.2. History and Context

On 25 June 1991 Slovenia declared independence by adopting the Basic Constitutional Charter on the Sovereignty and Independence of the Republic of Slovenia. Two days later, on 27 June 1991, the ten-day independence war started. The economy went on a total hold for a month and only slowly started to recover in the following months. The Slovenian economy was faced with the loss of the Yugoslav market and the introduction of the market economy at the same time. In the first years of independence, Slovenia was battling high inflation: in 1991 it was almost 250% and did not fall below 10% until 1995. As shown in Figure 1, gross domestic product (GDP) dropped by 8.9% in 1991 and again by 5.4% in 1992. In 2009, the last financial crisis reached Europe, but it, too, was successfully overcome. One of the unique approaches to mitigate these economic and financial crises was the reliance on liquidity-saving methods in the trade credit market.
Slovenia was fortunate in having preserved a centralized system of collection of taxes and social contributions because this made it easier to set up a unique organization of the payment system. This was the responsibility of the Payments Agency (Služba Družbenega Knjigovodstva, or SDK). The agency maintained a very tight grip on all payments by firms and thus also tight control over social security contributions; this, in turn, prevented erosion of compliance (Mrak 2004). The tight grip was reinforced by the introduction of multilateral set-off of obligations between companies with a software application now known as TETRIS Core Technologies (TCT), developed by Be Solutions. This is an implementation of the LSM normally used in payment systems. An overview of LSM implementations in payment systems is provided by Tompkins and Olivares (2016).
As shown in Figure 1, the liquidity saved was significant. The red line in the figure represents cleared obligations, the blue line represents the volume of obligations that were entered into the TCT system, and the yellow bars represent the annual GDP change (SURS 2020). In 1992, the first full year of system operation, 7.58% of GDP was saved, which enabled the economy to avoid an excessive rate of market exits or bankruptcies due to insolvency (DZRS 1993, 1994, 1995). The Slovenian fiscal institutions proved especially strong, capable of preserving the rather large revenue stream from taxes. Slovenia chose to reform the tax system only very gradually and the same gradualism was applied to the payment system, an approach that indeed played a crucial role in keeping tax revenues coming in. Because public revenue did not collapse, public services did not collapse either. As a consequence, in both cases (1991–1995 and 2009–2012) Slovenia went through short transitional recessions and until the current Covid 19-induced crisis hit enjoyed sustained growth, as shown in Figure 2 for the period 2002–2019 (AJPES 2002–2019).
In 2012, in Slovenia TCT cleared 683 million Euro, which represents 1.89% of GDP, with 14,000 companies participating or 8.3% of the total number of registered firms. There was a spike in 2012 as a response to the liquidity crisis following the economic crisis and the huge drop of GDP in 2009. In 2019 TCT cleared 209 million Euro, which represents 0.5% of GDP, with 2700 companies participating or 1.2% of the total (AJPES 2002–2019; SURS 2020). It is clear that the demand for the liquidity-saving capability of TCT increases in times of crisis and diminishes with higher GDP growth rates. Such counter-cyclical behaviour acts as a relief for enterprises in times of crisis and stabilizes the financial system.

1.3. Research Hypothesis

The paper is neither fully empirical nor fully theoretical, it is a bit of both. The bridge between the two is provided by numerical simulations, while the mathematical theorems underpinning the theory can be found in Fleischman and Dini (2020). Even though methodologically the research is therefore hybrid, it is still relevant to state a research hypothesis:
The research hypothesis is that obligation-clearing can potentially have a major impact in terms of liquidity-saving when measured as a fraction of national GDP, where ‘major’ means >10% and ‘potentially’ refers not to the efficacy of the algorithm but to the level of participation by firms.
We now turn to the results of our analysis and simulations.

2. Results

2.1. Quantitative Analysis with Real Invoice Data

For the quantitative analysis, we used real invoice data from the Sardex mutual credit CC circuit. The anonymous invoice data was provided for B2B transactions in 2019 and includes:
  • 3199 firms
  • 138,378 transactions and
  • 31,025,977.97 EUR total value of transactions.4
The invoice data refers strictly to Sardex credits amounts. As a rough approximation, the Sardex volume is approximately 10% of the overall volume of trade for the participating companies, but circuit members do not share their Euro turnover or invoice data. Therefore, in this analysis, we treated the Sardex credits as if they were Euros, and then—as discussed in more detail below—we introduced a liquidity source analogous to the role of the credits in the Euro economy (i.e., a credit line for each firm that is 2% of its turnover, on average) to demonstrate the different ways in which obligation-clearing and mutual credit can be used for liquidity-saving.
The transaction data was analysed using the Balanced Payment System model described in Fleischman and Dini (2020). According to this model, a payment system has two parts: an obligation network and a liquidity source. The obligation network is constructed from the transaction data so that every firm represents one node, every transaction represents one edge connecting two nodes, and every edge has a value equal to the value of the transaction or obligation. The resulting obligation network is a strongly connected directed graph, a visualization of which is shown in Figure 3.5

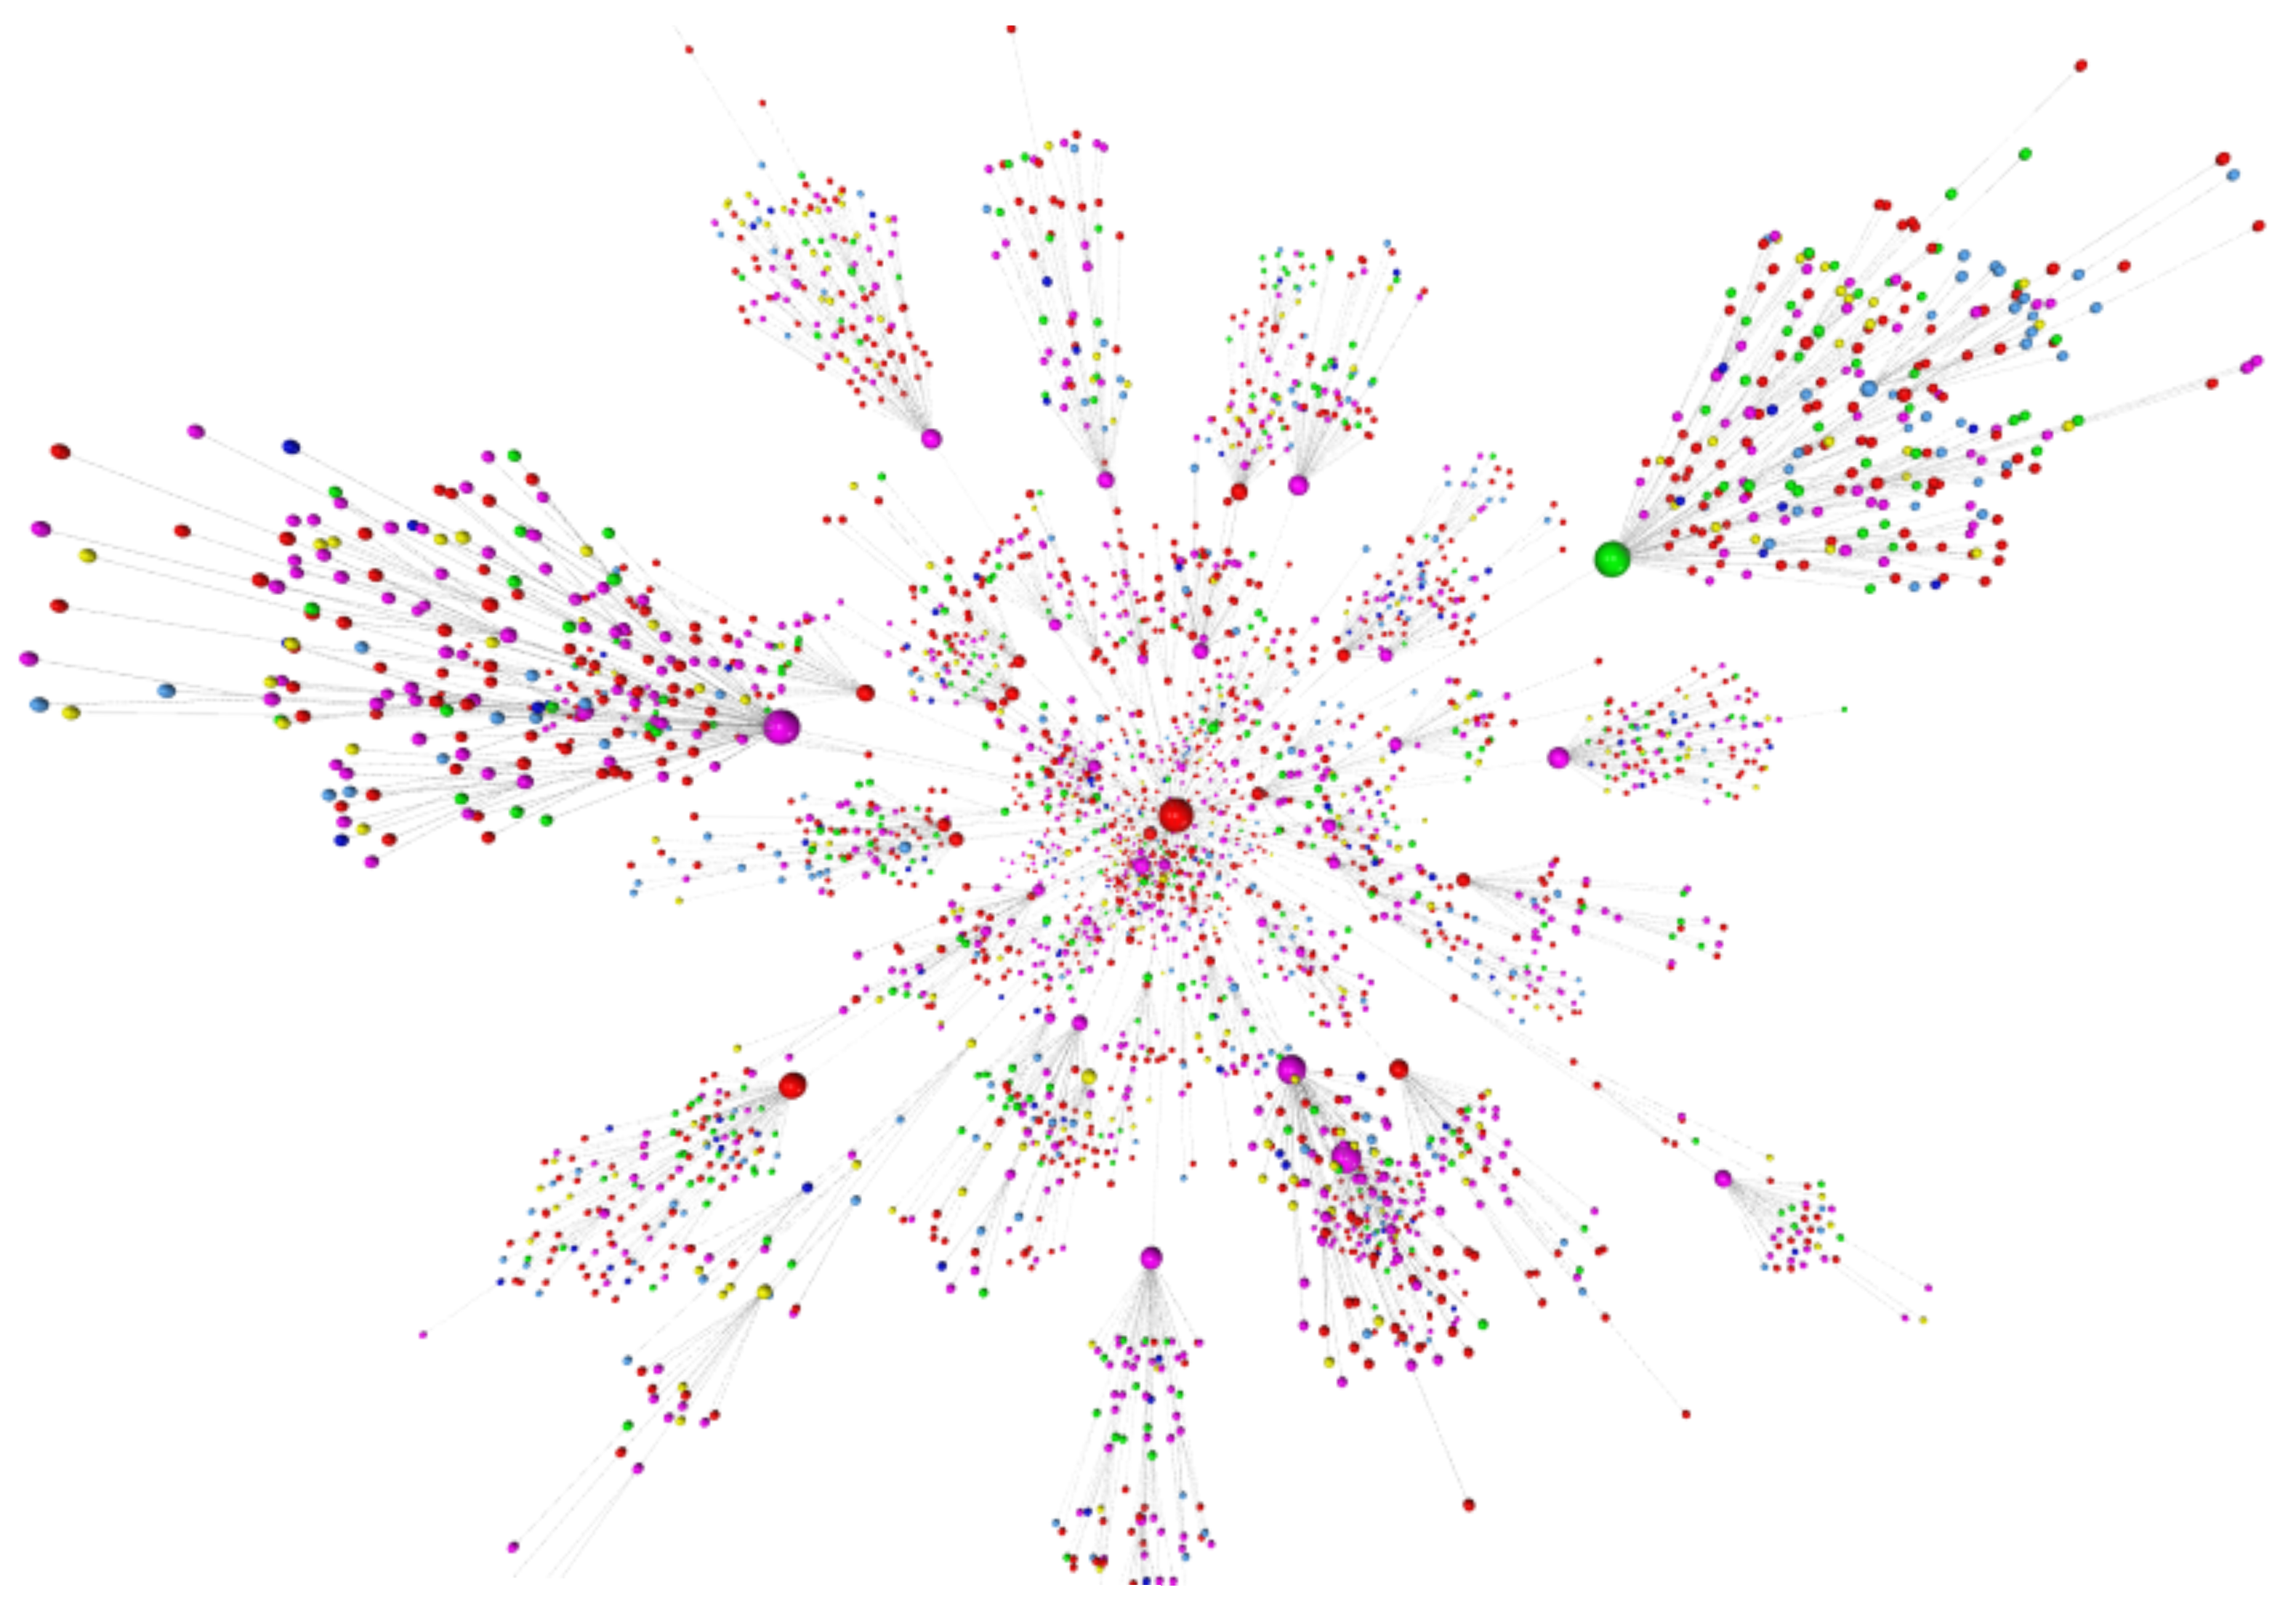
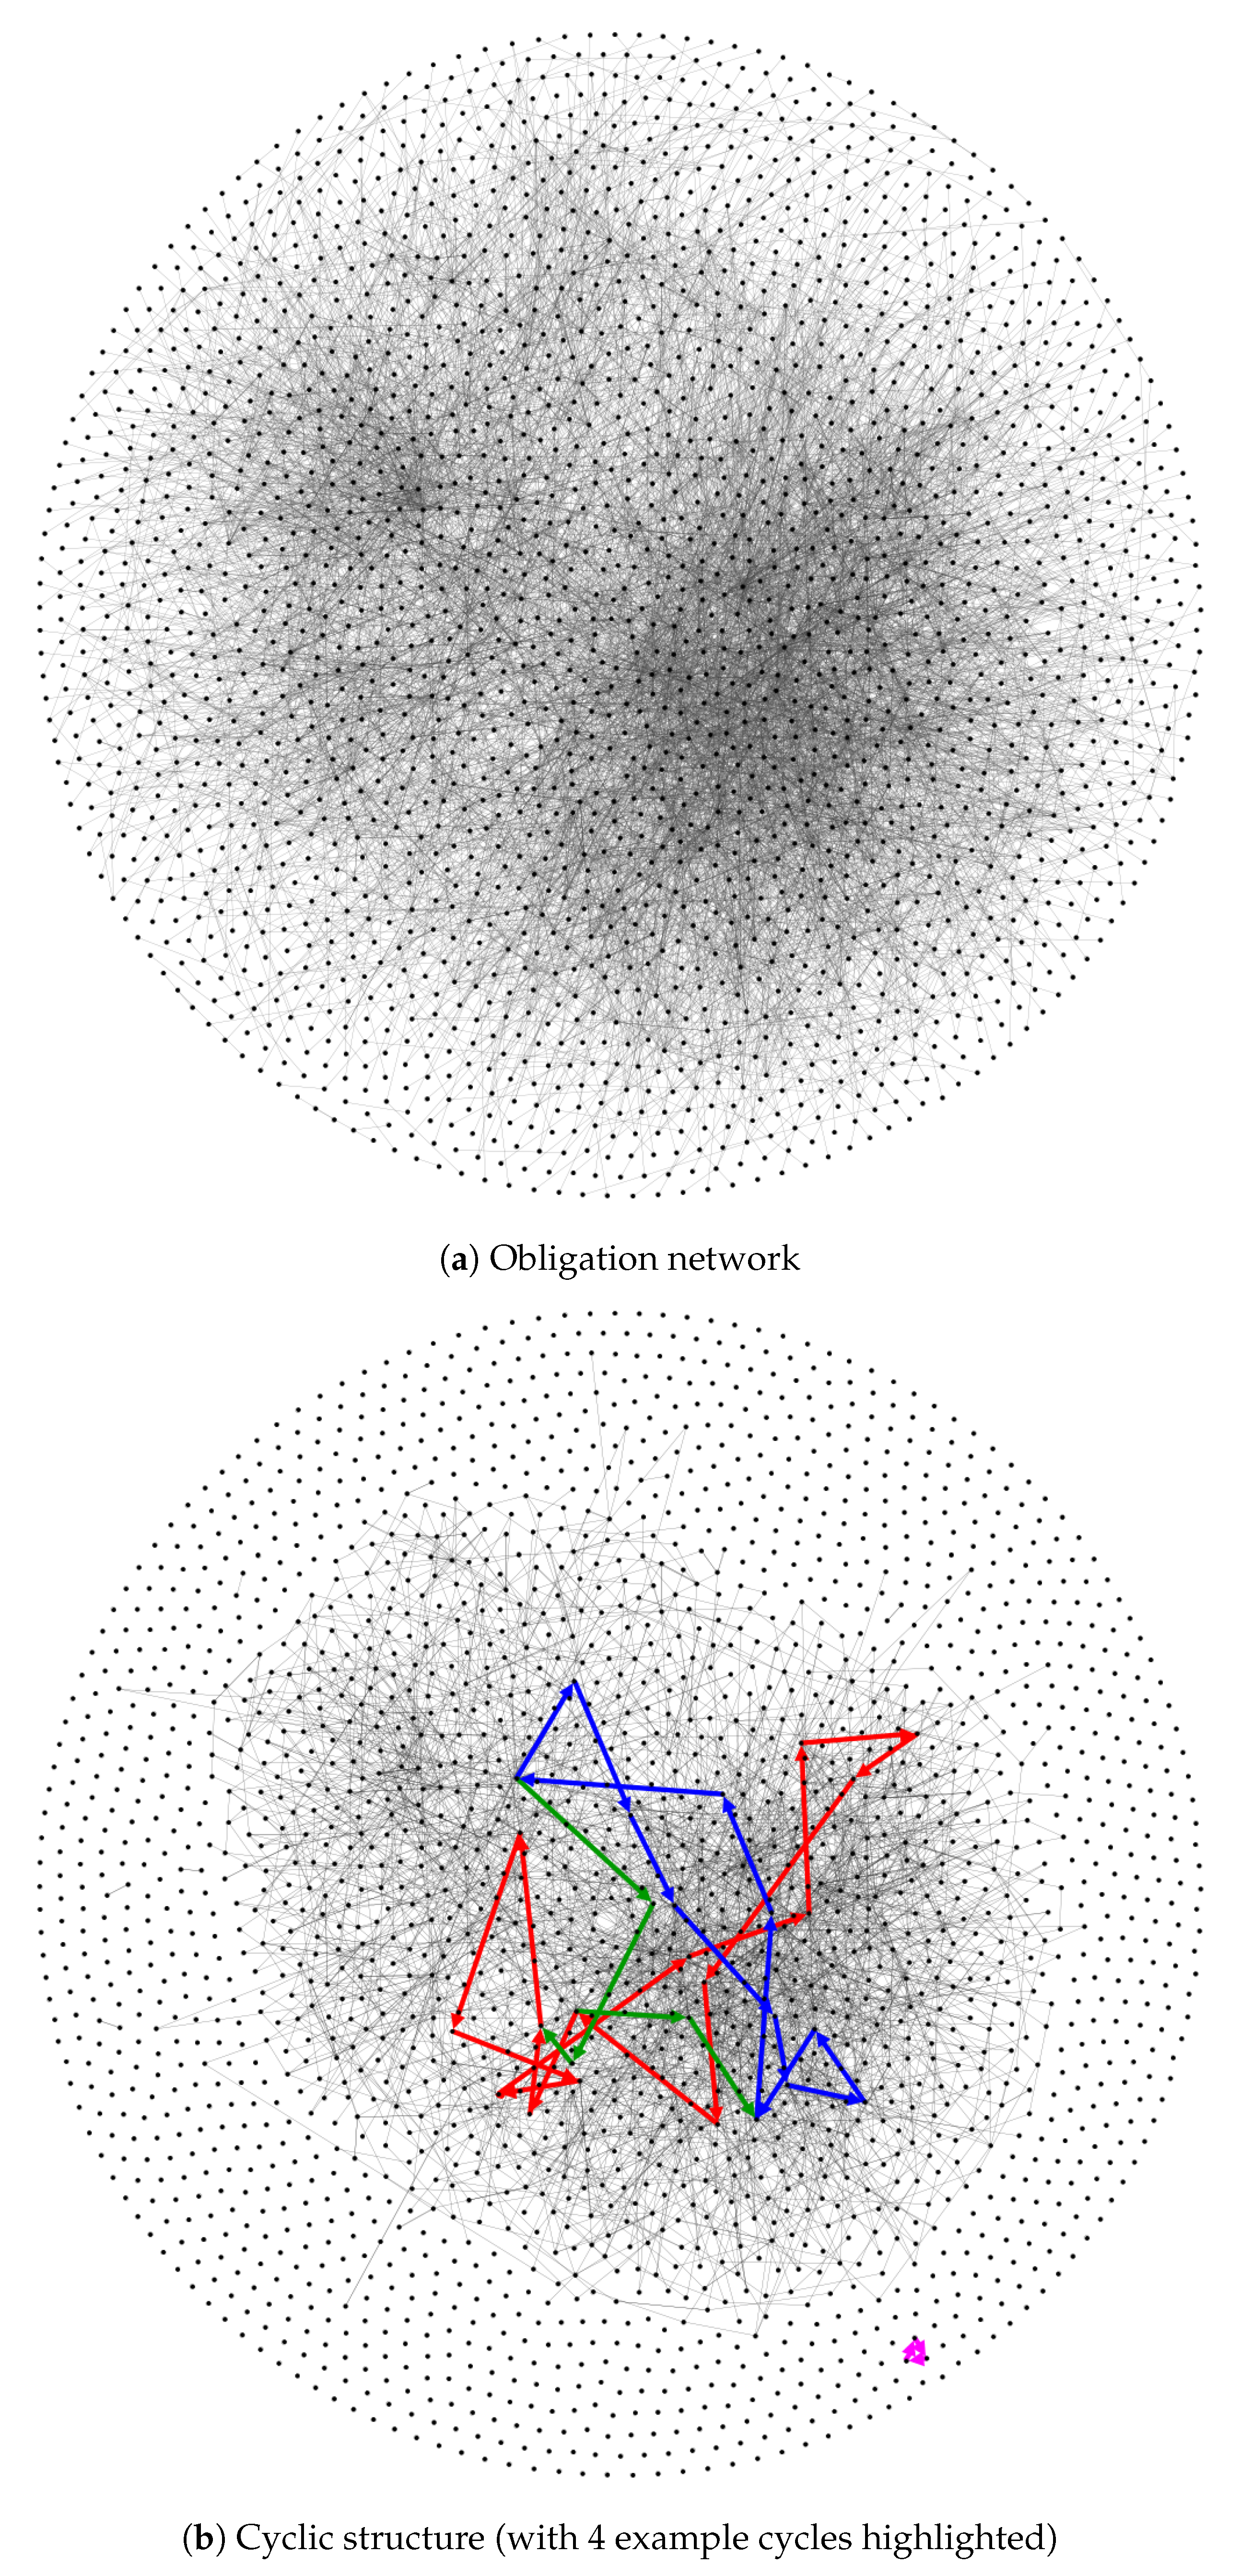
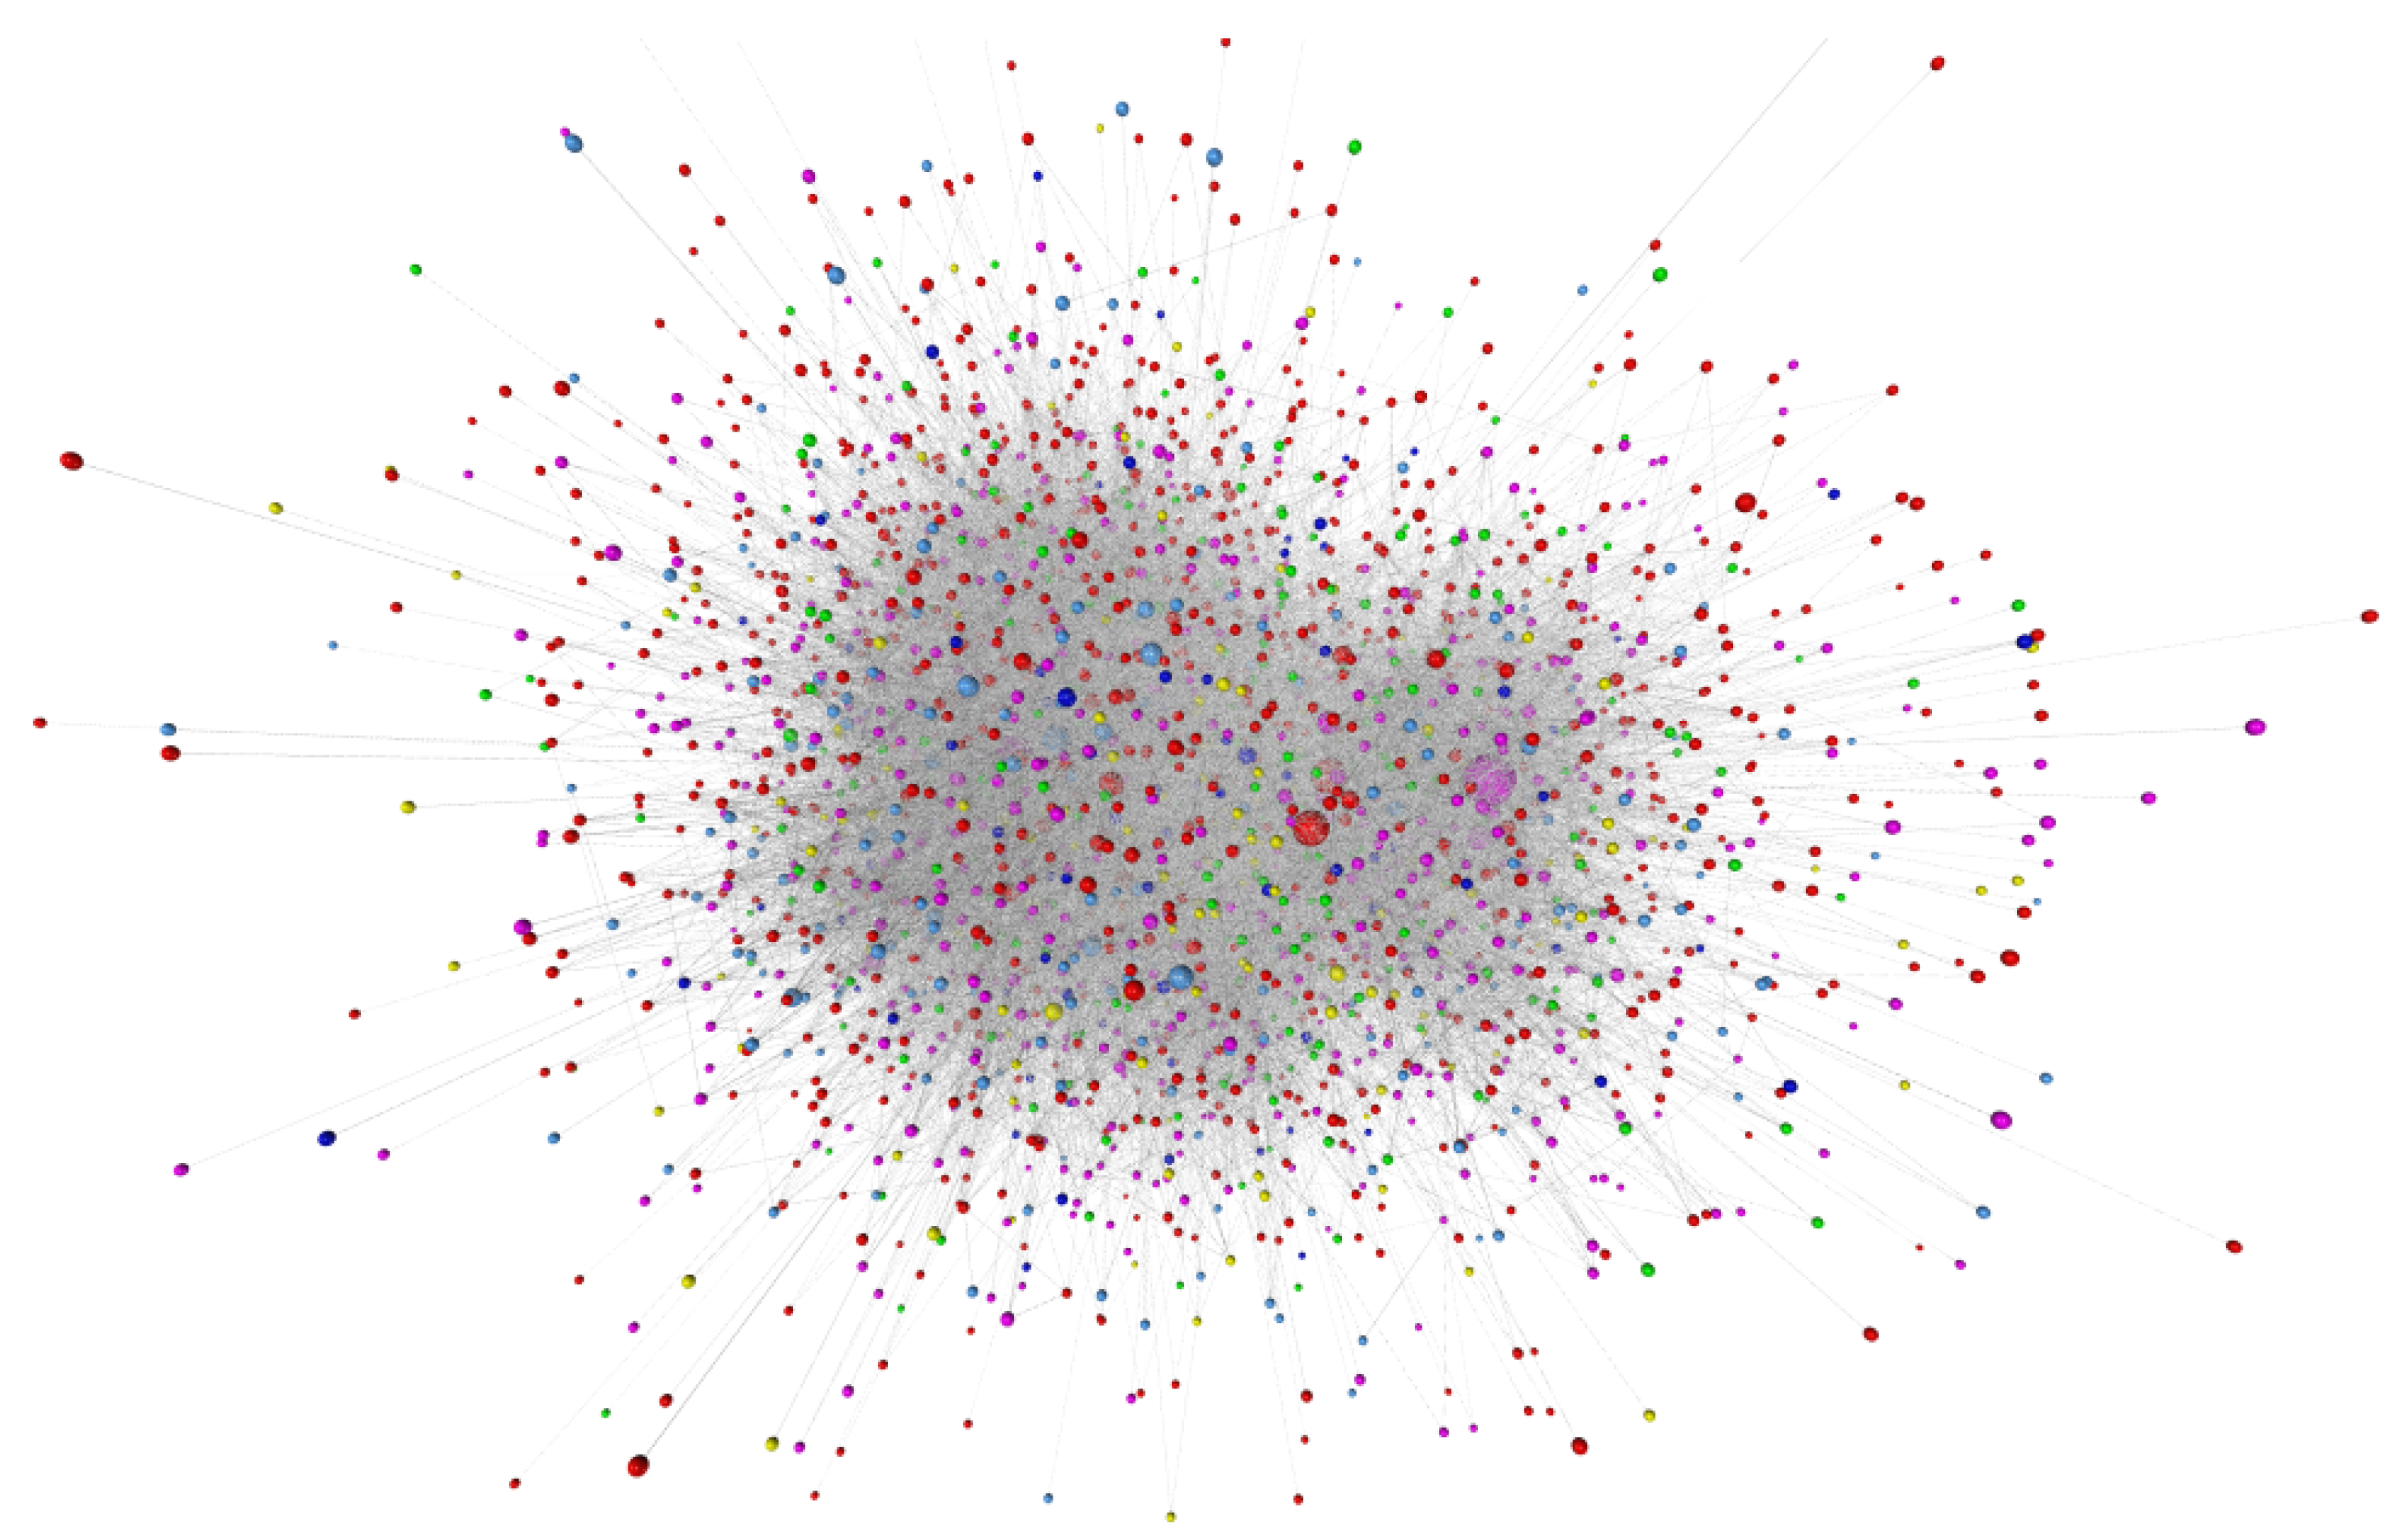
2.1.1. Network Visualization

The network visualization tool we utilized6 displays each firm as a dot, where the dot size is proportional to the number of invoices issued and the lines between the dots are the invoices. The colour-coding corresponds to the high-level business sector classification used by Sardex for its circuit members: Retail (pink), Services (red), Hospitality (light green), Manufacturing (yellow), Wholesale (blue), and Construction (light blue). For visual clarity, we have omitted the direction, number, and value of invoices. The resulting cloud is a good representation of complexity in B2B networks. Contrary to intuition there are no easily discernible supply chains but a more or less tight Gordian knot of mutual indebtedness. We have used the Leiden algorithm that guarantees to find the ‘communities’ of connected nodes (Traag et al. 2019). The algorithm finds only three communities of 2, 2, and 3195 firms, respectively, such that for all practical purposes this is a strongly connected network. The consequence of strong connectivity is that all supply chains are embedded in cycles.
Figure 4 shows the same network in “compressed” form. The graph was constructed by joining two adjacent nodes if they belonged to the same sector, and increasing the resulting node size proportionally. In this manner, not all firms of the same sector get lumped together since they are not all topologically adjacent, but some interesting trends are visible nonetheless. For example, although the classification is not very granular, it is interesting to see that the two largest sectors are Retail and Services. Another point is that only five large nodes are visible, the one missing being Wholesale. This is what we would expect since wholesalers usually do not trade with each other, they are at the top of supply chains.
The structure of the obligation network created by the Sardex 2019 B2B transactions is easier to understand when presented as a spanning tree, see Figure 5. In a spanning-tree, the number of edges between nodes is reduced so that each node has only one edge towards the root. Even with this reduction the Sardex network does not fall apart. Disregarding the direction of the edges, this demonstrates that there is a path from any node to any other node. In the spanning tree representation we can see more clearly the role of firms that issue more invoices and are more strongly connected to the obligation network. Bigger dots clearly act as concentration nodes. These are the nodes through which multiple cycles pass and play a proportionally more important role in the liquidity-saving algorithm and in the amount of liquidity saved overall. The business sectors are clearly visible, as are several “anchor” firms at the top of what appear to be supply chains. This and the previous two figures are examples of a more in-depth supply chain analysis that the Sardex transactional data set motivates and that will be pursued in future work.

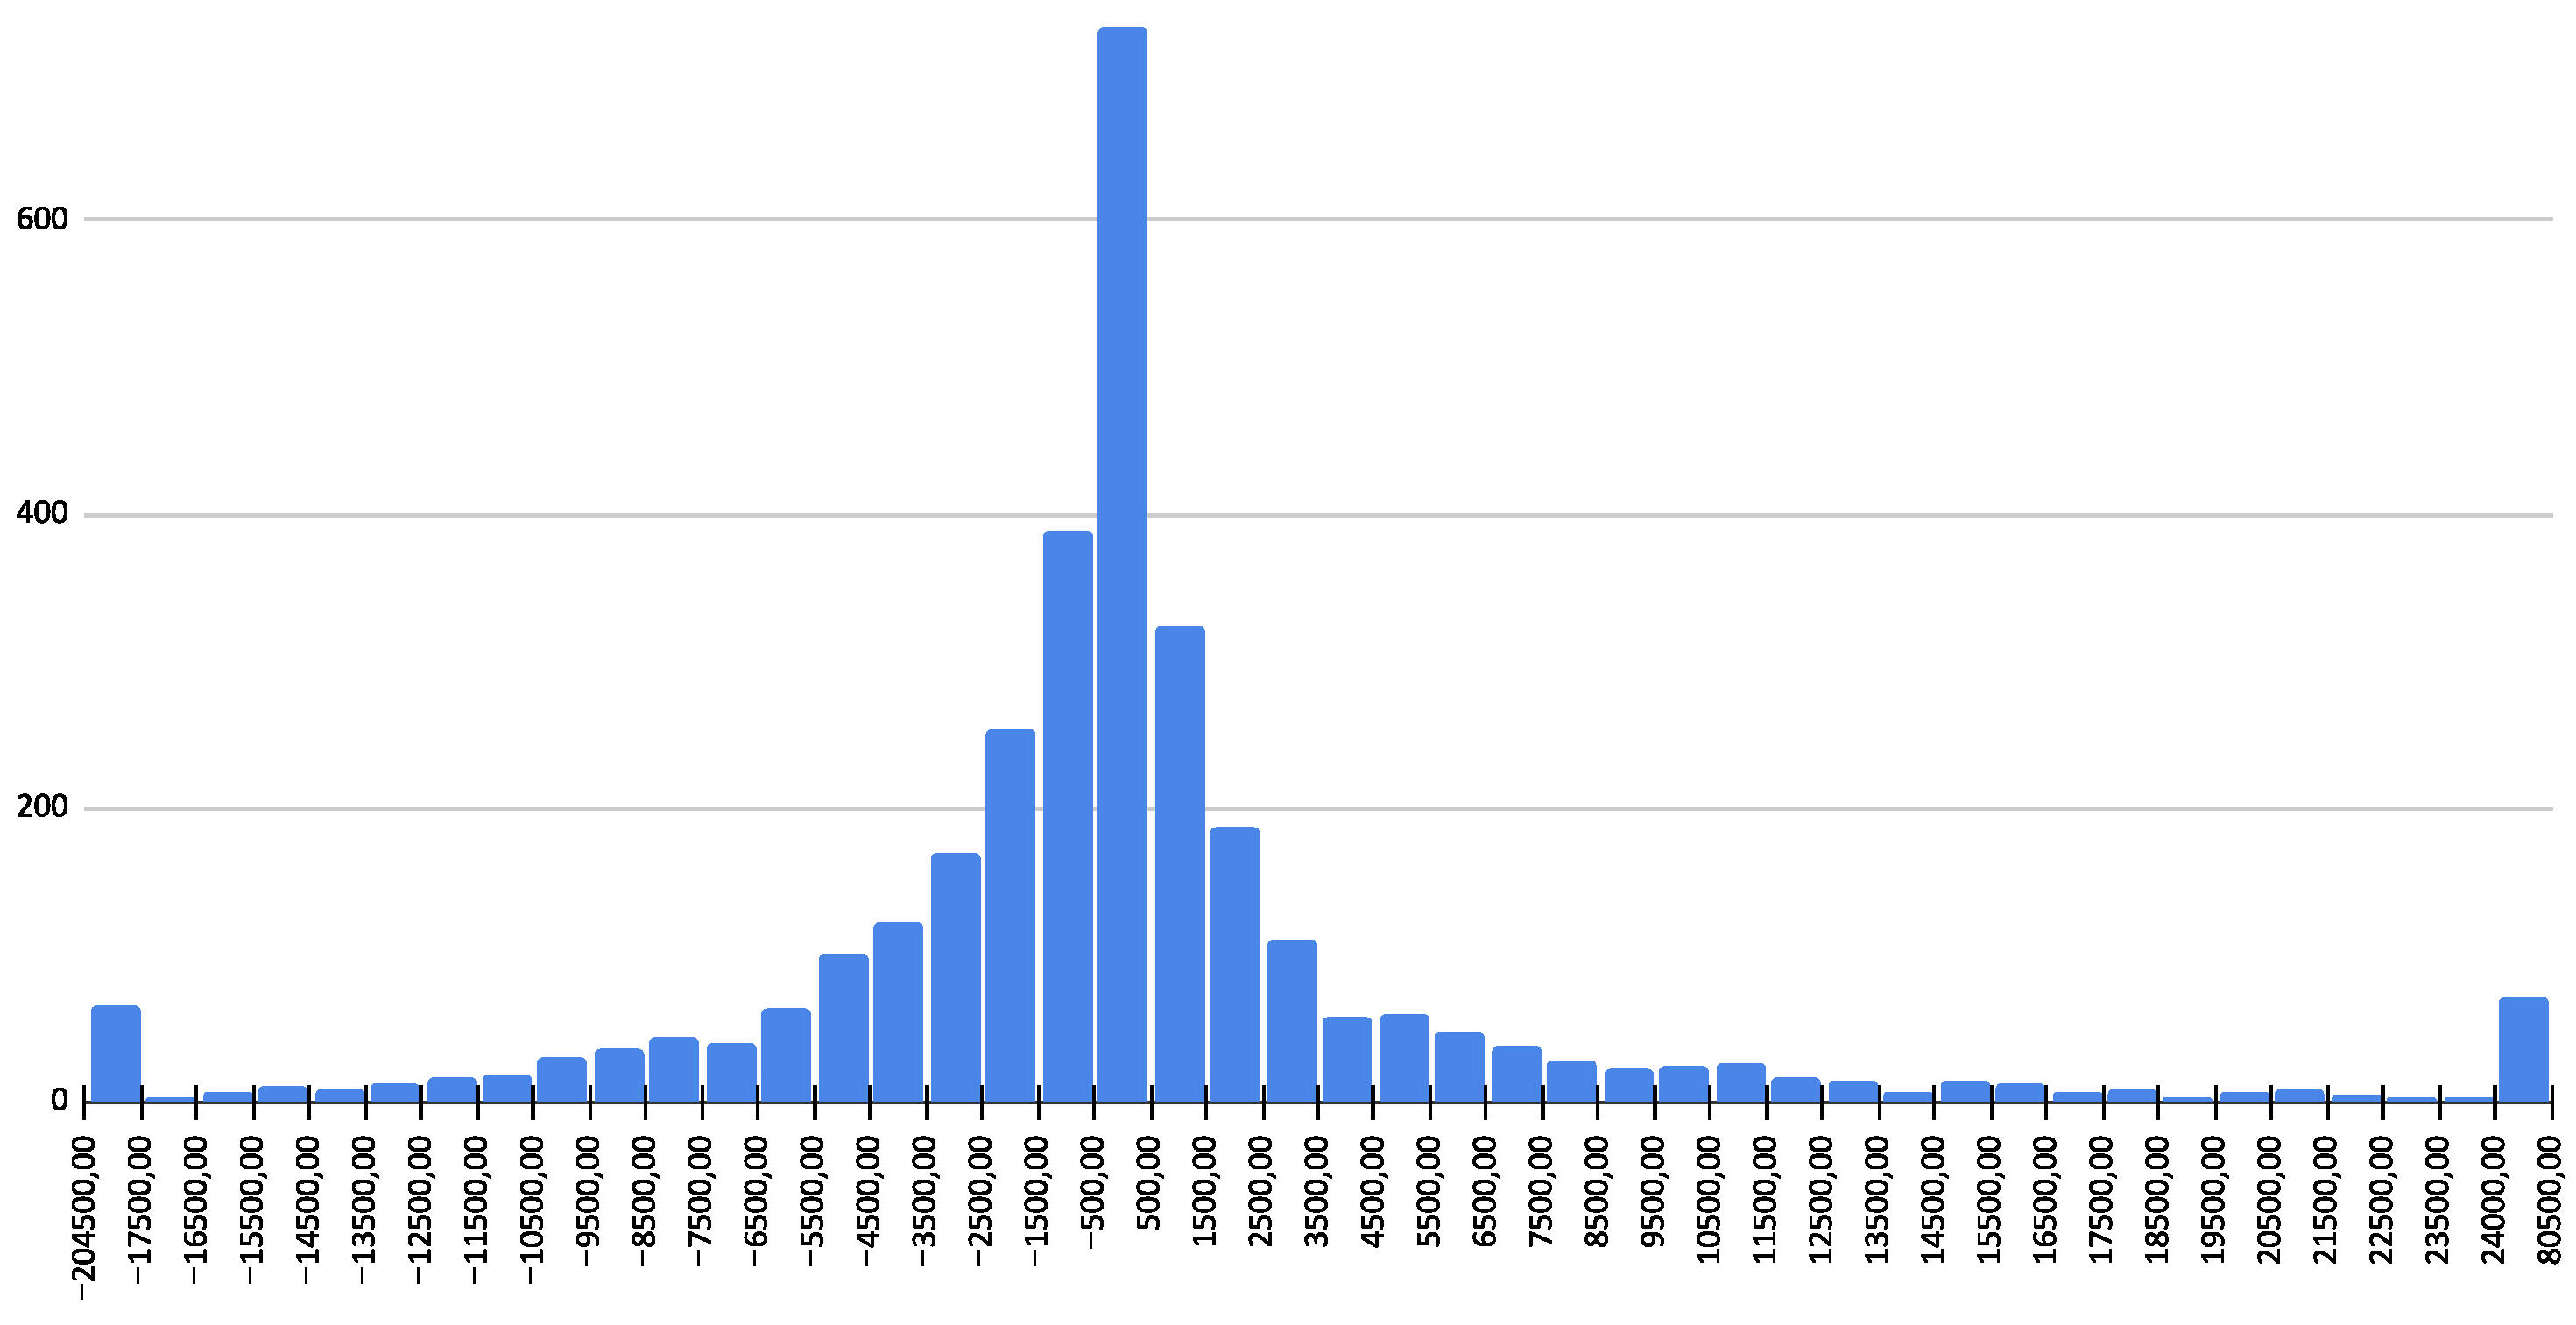
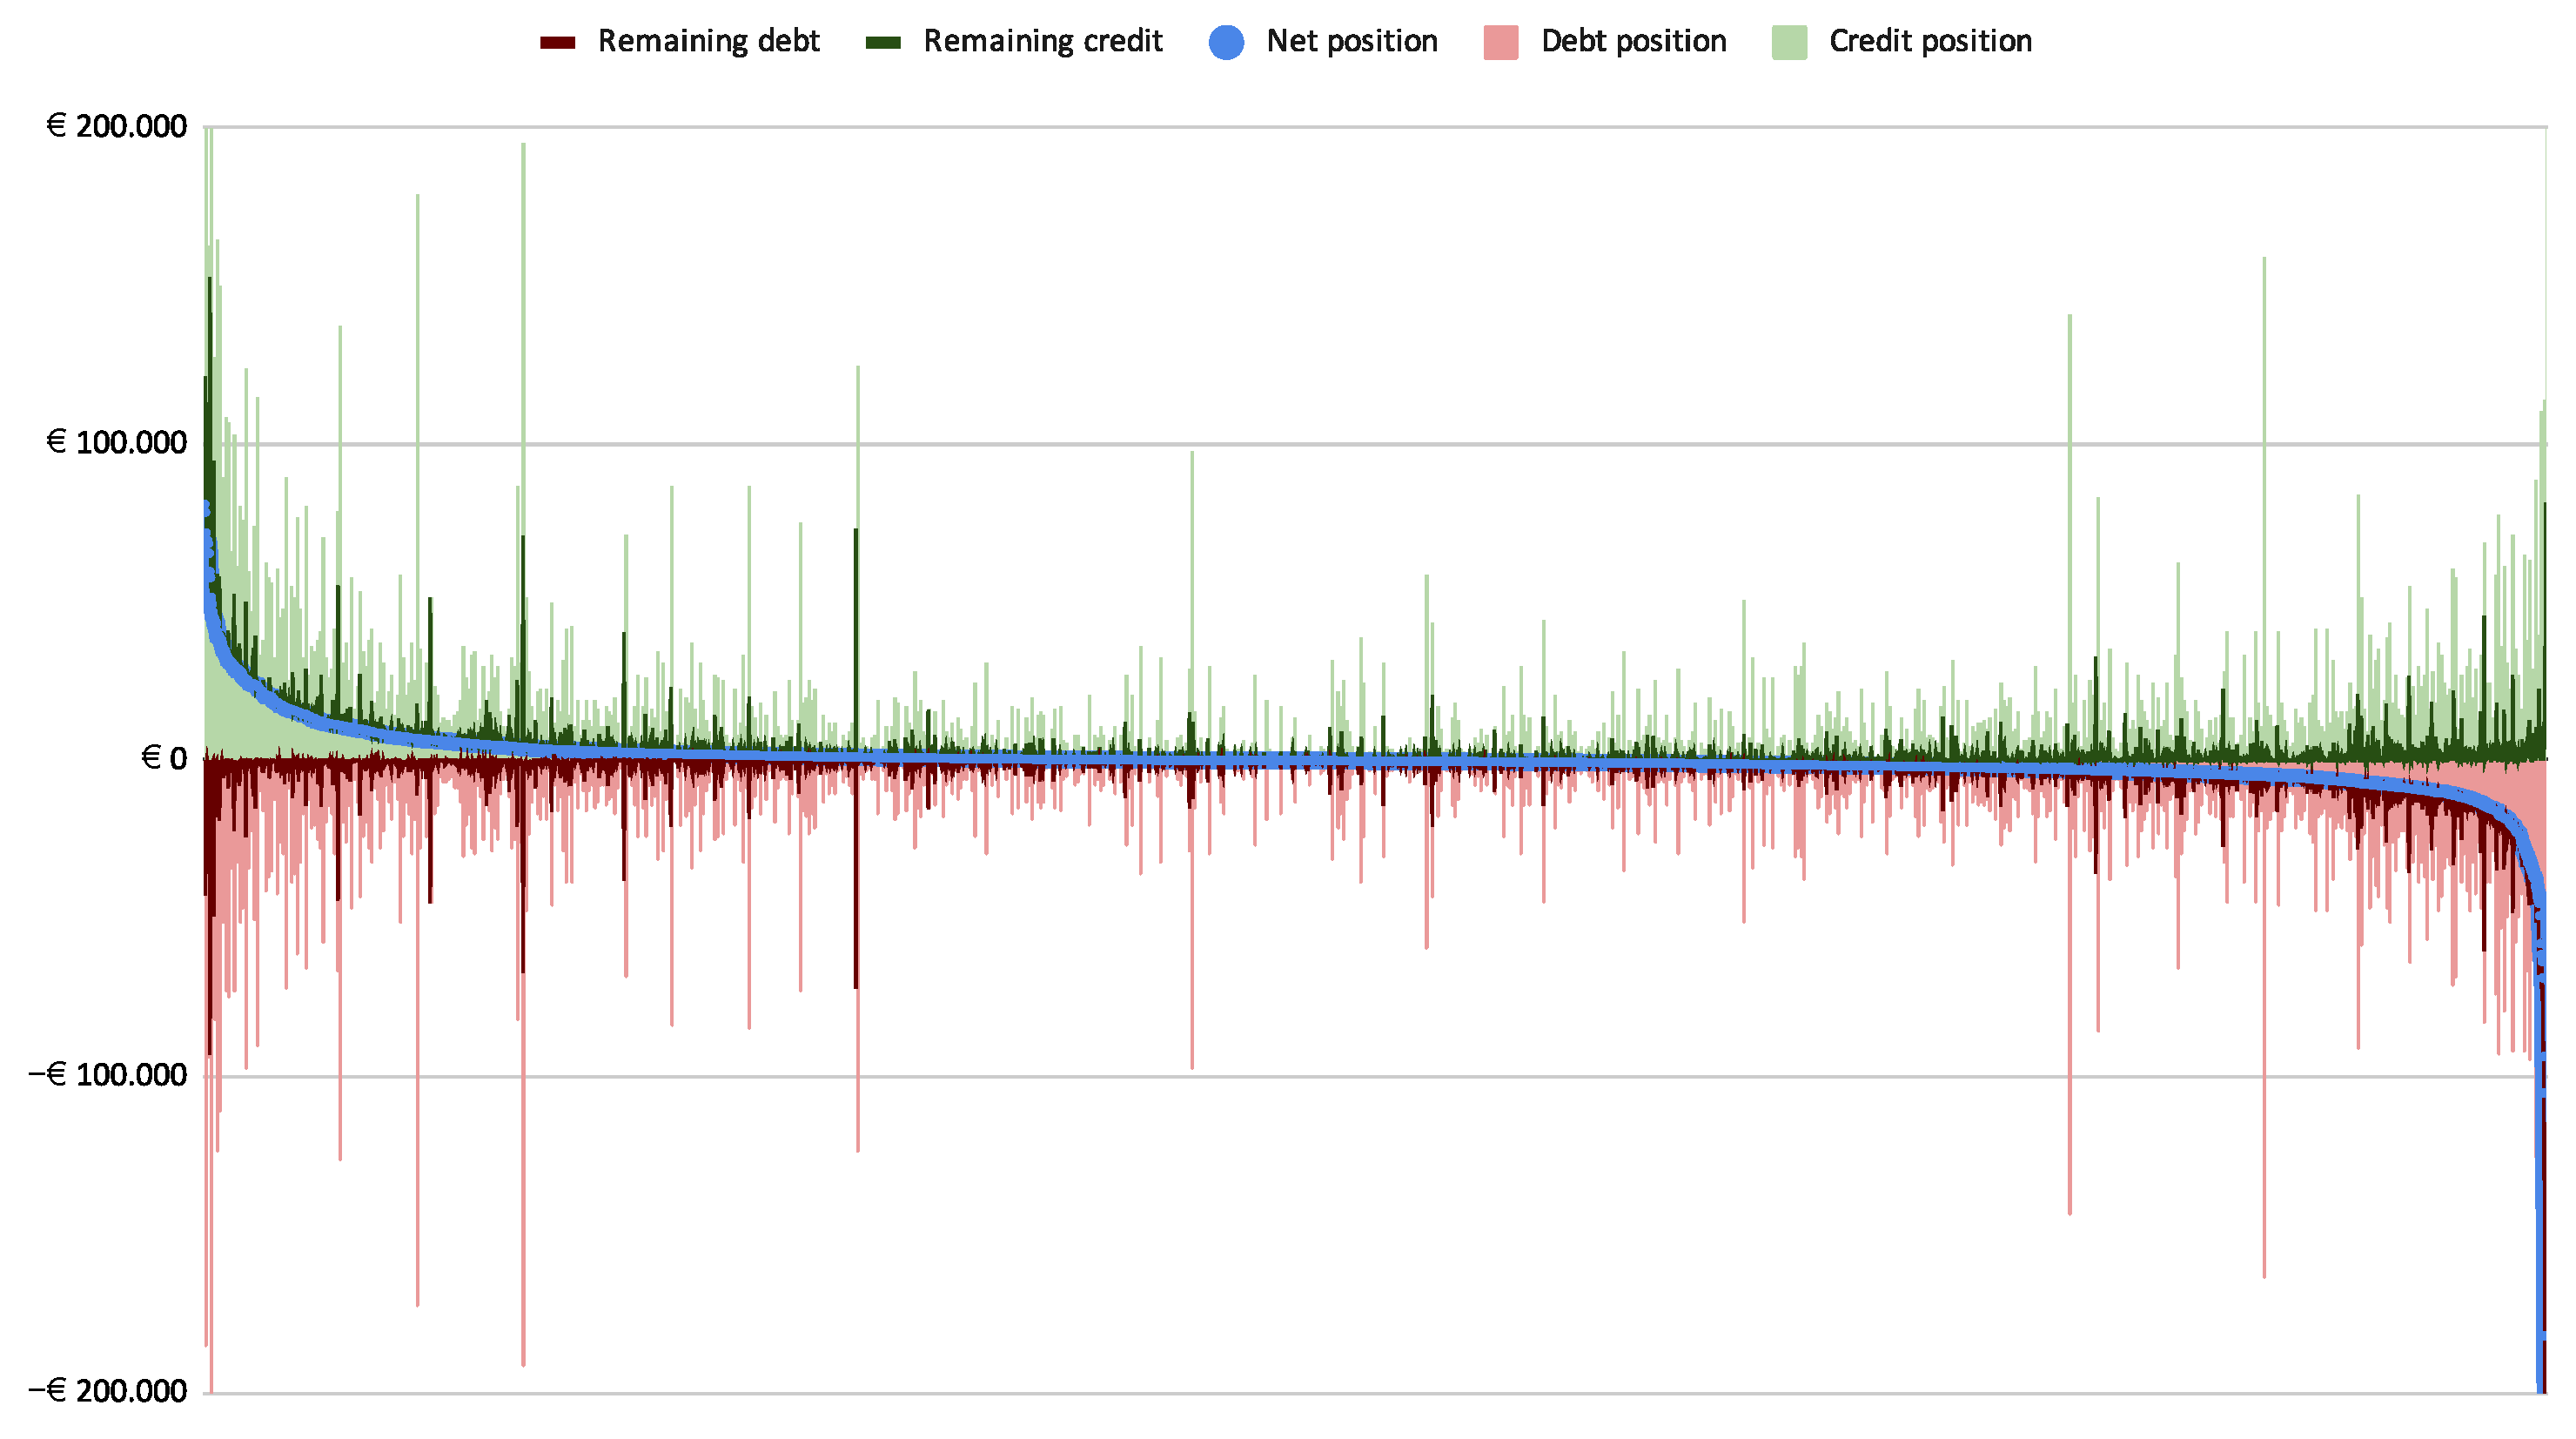
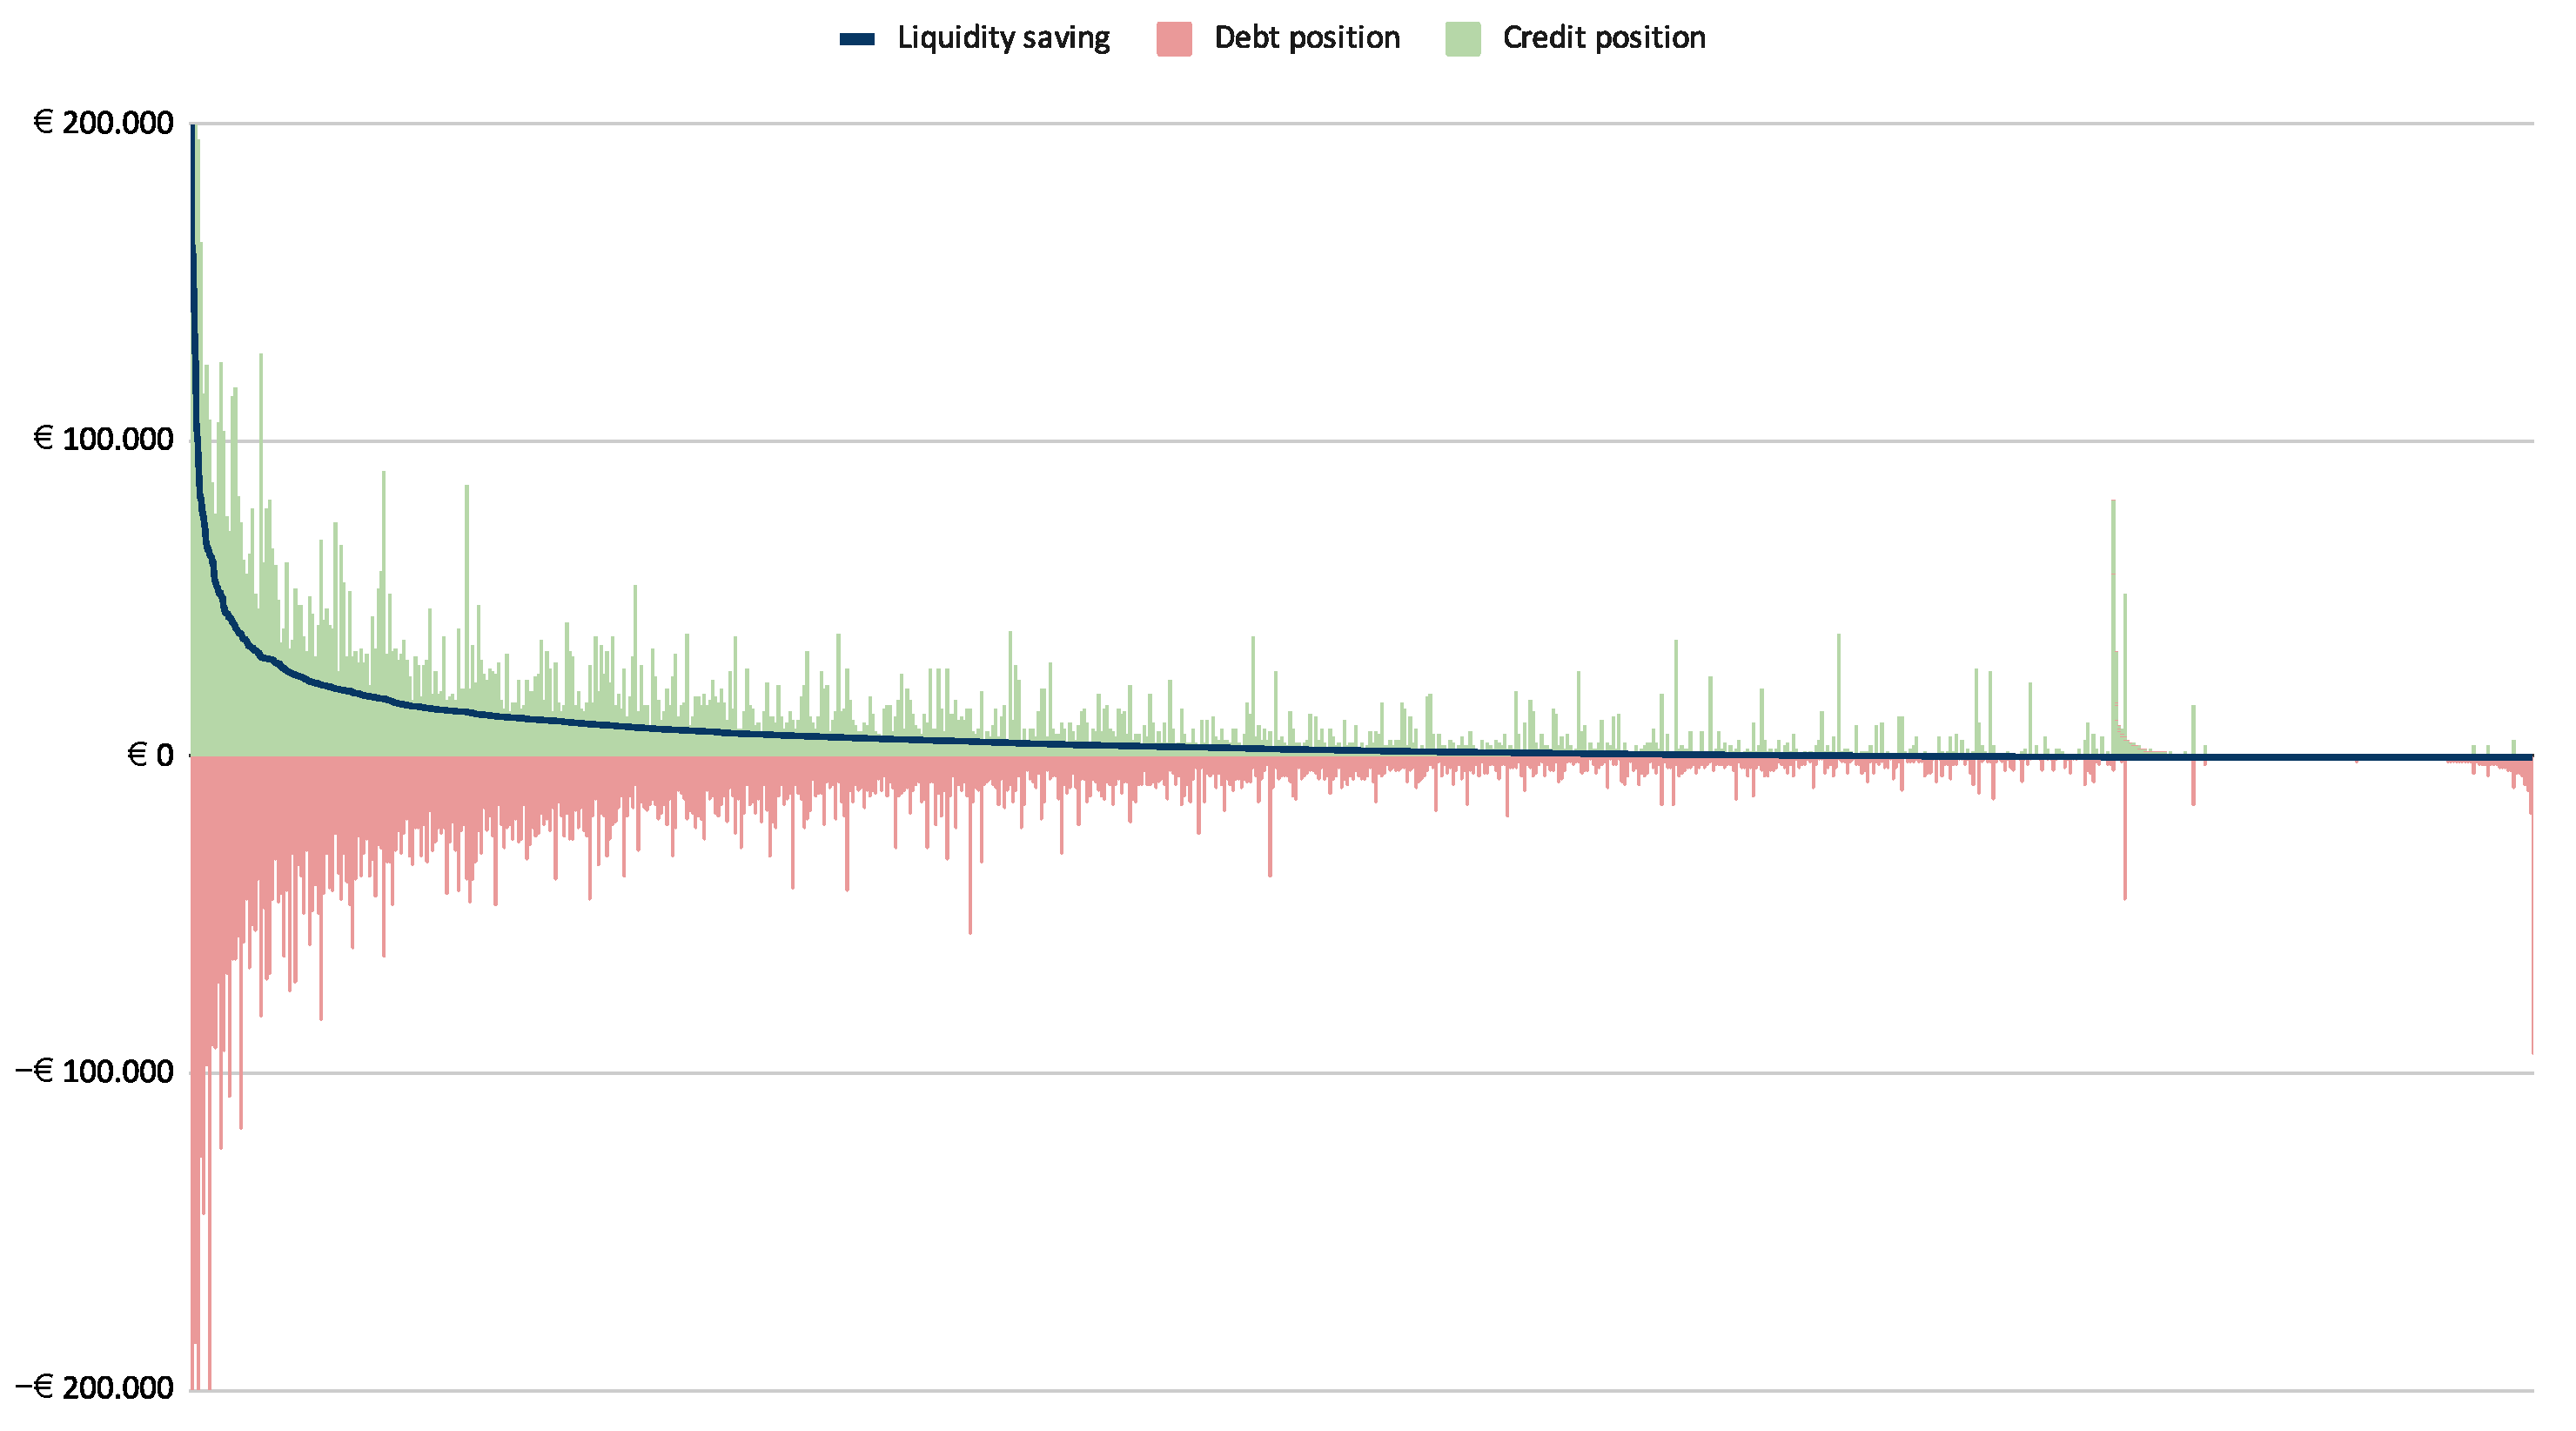
2.1.2. Stocks and Flows Visualization

Each firm in an obligation network issues and/or receives invoices. The sum of all invoices issued by an individual firm is called that firm’s credit position. The sum of all invoices received by an individual firm is called that firm’s debt position. With these two numbers, we can calculate the net positions of individual firms in the Sardex community, as shown in Figure 6. The green columns represent the individual firms’ credit positions while the red columns represent their debt positions. The light blue line represents the net positions. Thus, firms are points on the horizontal axis sorted by the net position in descending order. The shape of the net position is typical for any obligation network. We can see that most firms have a net position close to zero. That does not mean they do not have much traffic. The spikes in credit and debit columns clearly show that many firms with near-zero net position trade in tens or hundreds of thousand credits (or “Euros” in our simulation) with other community members.
The concentration of net positions around zero is shown as a histogram in Figure 7. By far, the tallest column represents the number of firms with a net position between −500 and +500 Euro. This interesting distribution of near-zero net positions and the complexity of this obligation network offer an opportunity for large multilateral set-off of mutual obligations. This set-off represents a liquidity-saving for the firms involved. All multilateral set-off cycles are part of a complex cyclic structure inside the obligation network, where by complex we mean that many cycles intersect and overlap on one or more nodes, they are not disjoint.
There are many ways to find a cycle in an obligation network. Since the cycles are intertwined, as Figure 3 suggests, they cannot be removed separately. One has to be careful when choosing the algorithm since it needs to find the largest possible cyclic structure that represents the largest possible multilateral set-off.7 Going by intuition and removing cycles in the order in which they are found does not work well since in most cases removing a cycle will most likely break at least one other cycle, thereby reducing the chance of finding the largest possible cyclic structure. Finding this structure is a key task of the TCT software application, whose mathematical underpinnings are described in Fleischman and Dini (2020). The characteristics of the obligation network remaining after removing the cyclic structure (i.e., performing the multilateral set-off) are very similar to the original obligation network. The remaining network is still a very complex strongly connected graph, but there are two key differences: (1) the remaining obligation network is acyclical, meaning that there are no more opportunities for a set-off, and (2) the value of the remaining obligations is decreased by the value of the obligations in the cyclic structure that has been removed. This difference is the liquidity-saving for the firms.
This situation is presented graphically in Figure 8 where, as in Figure 6, we can see the same light blue line of net positions. This is because removal of the cyclic structure does not change the net positions of individual firms. The difference, relative to Figure 6, is the inclusion of two additional curves: a dark green line on the credit side and a dark red line on the debt side of the plot. Together, they represent the new credit and debt positions of the firms that were part of the cyclic structure. This implies that for the firms that were not included these two lines reproduce the lighter spikes. We note that the dark green line indicating the credit positions of the firms in the remaining obligation network is always above the blue net positions curve, since the net position cannot be higher than the sum of all incoming cashflows. Similarly, the dark red line indicating the debt position of the firms in the remaining obligation network lies below the blue net positions line since the net position cannot be smaller (more negative) than the sum of all outgoing cashflows. The difference between the light columns and dark lines in Figure 8 represents the actual (“Euro”) liquidity savings for each firm.8 It is hard to estimate the total savings for the community from this figure, but it clearly shows that the savings are distributed across the community independently of the net positions of individual firms.
To show the distribution of liquidity-saving that can be realized through TCT, we have reordered the firms in descending order of this variable in Figure 9. Since no firm can save more than its potential cashflow from its credit position, the blue line representing the individual firms’ liquidity-saving lies within the boundaries of their credit positions shown as light-green columns. The figure also shows an interesting small red “tail” of firms’ debt positions on the right side of the horizontal axis. These firms did not benefit from any liquidity-saving since their balance is negative. We recall that in this first part of the analysis we are treating the Sardex credits as if they were Euros, so the credit line property of mutual credit accounts does not play a role here. In this context, the negative balances simply mean that these accounts are overdrawn.
So far we have shown the liquidity-saving potential of obligation networks with the data for the whole year. However, one-year long queues of payment orders are not practical except in special cases such as long-overdue payments and non-performing loans (NPLs). To demonstrate the effect of liquidity-saving by cyclic structure removal, we have broken down the Sardex 2019 B2B transaction data into months. As shown in Table 1, we have processed each monthly batch with TCT. For each month we used the total value and the number of invoices in the monthly batch as the TCT input. The TCT output shows the amount in “Euros” saved by the removal of the cyclic structure from the obligation network, the number of invoices that are part of the cyclic structure, and the remaining amount that has to be settled from the individual firms’ accounts. The percentages shown are relative to the TCT input. We should clarify that the settlement “from the individual firms’ accounts” just mentioned implies “Euro” payments that are not part of the current analysis. The assumption is that a separate Euro bank account, not considered here, would be used to settle the remainder of the obligations. However, in this paper, we do consider the situation where a simulated CC is used to settle at least part of these remaining obligations, as presented in the next section.
The amounts saved by TCT have to be accounted for by each participating firm. Firms receive a set-off notice with the accounting instructions. The notice contains a list of account receivables and a list of account payables with amounts to be deducted from each side of the balance sheet. The sum of all deductions on account receivables, across the whole network, equals the sum of all deductions on account payables. With this action, the firms save liquidity and reduce their balance sheet size, leading to a lower risk calculation in case, for example, of a loan application. The DPOs and DROs (Days Payables Outstanding and Days Receivables Outstanding) are reduced, and the debt-to-equity ratio is improved for all participating firms.
The result of TCT processing for the month of May 2019 is shown graphically in Figure 10. Figure 10a shows all the Sardex B2B transactions. The firms are represented as black dots and the invoices or obligations as gray arrows where the thickness of the arrow is proportional to the value of the obligation. Highly connected firms are positioned near the centre of the graph. This representation allows us to see that there are communities with more intense business activity and that these communities are well connected. Figure 10b shows the graph of the result of the TCT run to demonstrate the size of the cyclic structure in comparison to the obligation network. The graph of the cyclic structure contains the same firms as the graph of the obligation network (i.e., the same set of dots is used even if not all of them are connected) to make the visual comparison easier. As in part (a) of the figure, the gray arrows represent the individual transactions that are part of the cyclic structure. To visualize the complexity of the cyclic structure three individual cycles are highlighted in colour. The pink cycle is an example of a simple small cycle between three firms. It is an isolated example near the edge of the graph. The red and blue cycles are representatives of the most common type of cycle found in the cyclic structure—long and intertwined across different communities in the obligation network. The two green paths are “bridges” between the blue and red cycles but, together with the corresponding red and blue segments, they could also be interpreted as forming a fourth cycle that overlaps the other two. This is how overlapping cycles form the cyclic structure. Any attempt to treat the cycles individually, therefore, breaks the cyclic structure and diminishes the benefits to the community.
The quantitative analysis of the Sardex 2019 B2B transactions shows that the community can benefit substantially from obligation-clearing. We can see that on average over 40% of invoices can be at least partially settled with TCT and that this represents over 23% of the total value of invoices issued. This represent a significant liquidity-saving for individual firms and the community.

2.2. Inclusion of Simulated Mutual Credit Data in the Invoice-Netting Network

In the previous section, we have analysed the effect of invoice-netting on the obligation network without the presence of any source of liquidity. In this second part of the analysis, we introduce a simulated mutual credit CC on the same transaction data set.9 Although we could have used 10% of each Sardex balance at the beginning of 2019 as an initial balance for the simulated CC, we thought it was a stricter test of the effectiveness of mutual credit to assume that the circuit would start from 0 balances. As it happens, a simulated CC monetary mass sufficient for the operation of the circuit was generated within the first month. In other words, the analysis shows that the historical effects of an initial CC balance are weaker than the real-time trading effect. This is consistent with the purpose and structural properties of mutual credit, as described in Section 4.
To get as close as possible to real-life conditions, we have adopted the average credit limit policy used by Sardex for negative balances, i.e., each firm can go into debt by up to 2% of their annual turnover.10 The scenario for this analysis is that all payment orders are delayed to the end of the month and settled all at once in a single event. Payment orders delayed in a queue form an obligation network that is the basis of our analysis. As we have shown in the previous section we can calculate the net (Euro) position of every firm in such a network. Table 1 shows that even without external liquidity the clearing of such an obligation network can deliver significant savings. Now that we have a liquidity source we can increase the value of the obligations discharged further.
To include liquidity in the TCT algorithm, the network is enlarged by adding special liquidity nodes. As explained in Section 4, adding one or more liquidity nodes creates new cycles. One of the advantages of TCT (for scalability and speed) is that the clearing does not need to be performed in separate steps: first without liquidity source, then with liquidity source. When some liquidity is available it can be performed simultaneously for both. In fact, the complexity of the cyclic structure is such that in general more liquidity is saved by performing the two steps at the same time than separately. Although this paper is not the right place to prove such a theorem, we now describe in some detail the various flows specifically associated with the introduction of a CC as a liquidity source in order to show how the two instruments used together can provide a significant risk-mitigation effect for NPLs. We again focus on the analysis of the month of May 2019.
To set up the clearing problem we start at the end of April, at which time we assume that:
  • The Euro payments that were not cleared in April have all been paid (using normal bank transfers).
  • There is a distribution of positive and negative (simulated) CC balances throughout the circuit.
  • Some firms have maxed out on their credit lines (i.e., their balances are negative and cannot go more negative) but the credit lines of many others are either unused or underused.
In order to reduce (from the point of view of the TCT algorithm) the problem with liquidity to the problem without liquidity already discussed, the next step is to treat the positive and negative CC balances as if they were themselves obligations. At a very high level, then, for each month analysed, the obligation-clearing process in the presence of a mutual credit CC unfolds as follows:
  • all the Euro obligations (invoices) are entered
  • all the liquidity source obligations (CC balances) are recorded and entered as well
  • the resulting very complex network is analysed and a cyclic structure (much larger than when no liquidity is used) is identified
  • all the obligations in the cyclic structure are cleared in a single step (the cyclic structure is “removed”)
  • any remaining Euro balances are paid by normal bank transfers.
The result of integrating TCT with CC is shown in Figure 1111 for the same May 2019 data set used for Figure 10. More precisely, Figure 11 corresponds to Figure 10b, i.e., in the interest of readability it only shows the (new) cyclic structure. The firms are arranged in a circle with special liquidity source nodes positioned outside and below the circle. The set of firms is divided into two clusters: the first cluster (shown in green in the figure) does not make use of the CC liquidity and corresponds more closely to the cyclic structure shown in Figure 10b, although it is not identical to it.12 The second cluster contains all the rest. The figure has been created with the objective of providing an intuitive visualization of the composition of this larger cyclic structure. To unpack and understand the new cycles created by connecting the liquidity source, it is helpful to split the process into separate logical steps, even though the TCT algorithm performs all the steps at the same time. This is done by breaking down Step 3 above into the following sub-steps, which refer to the four larger liquidity nodes:
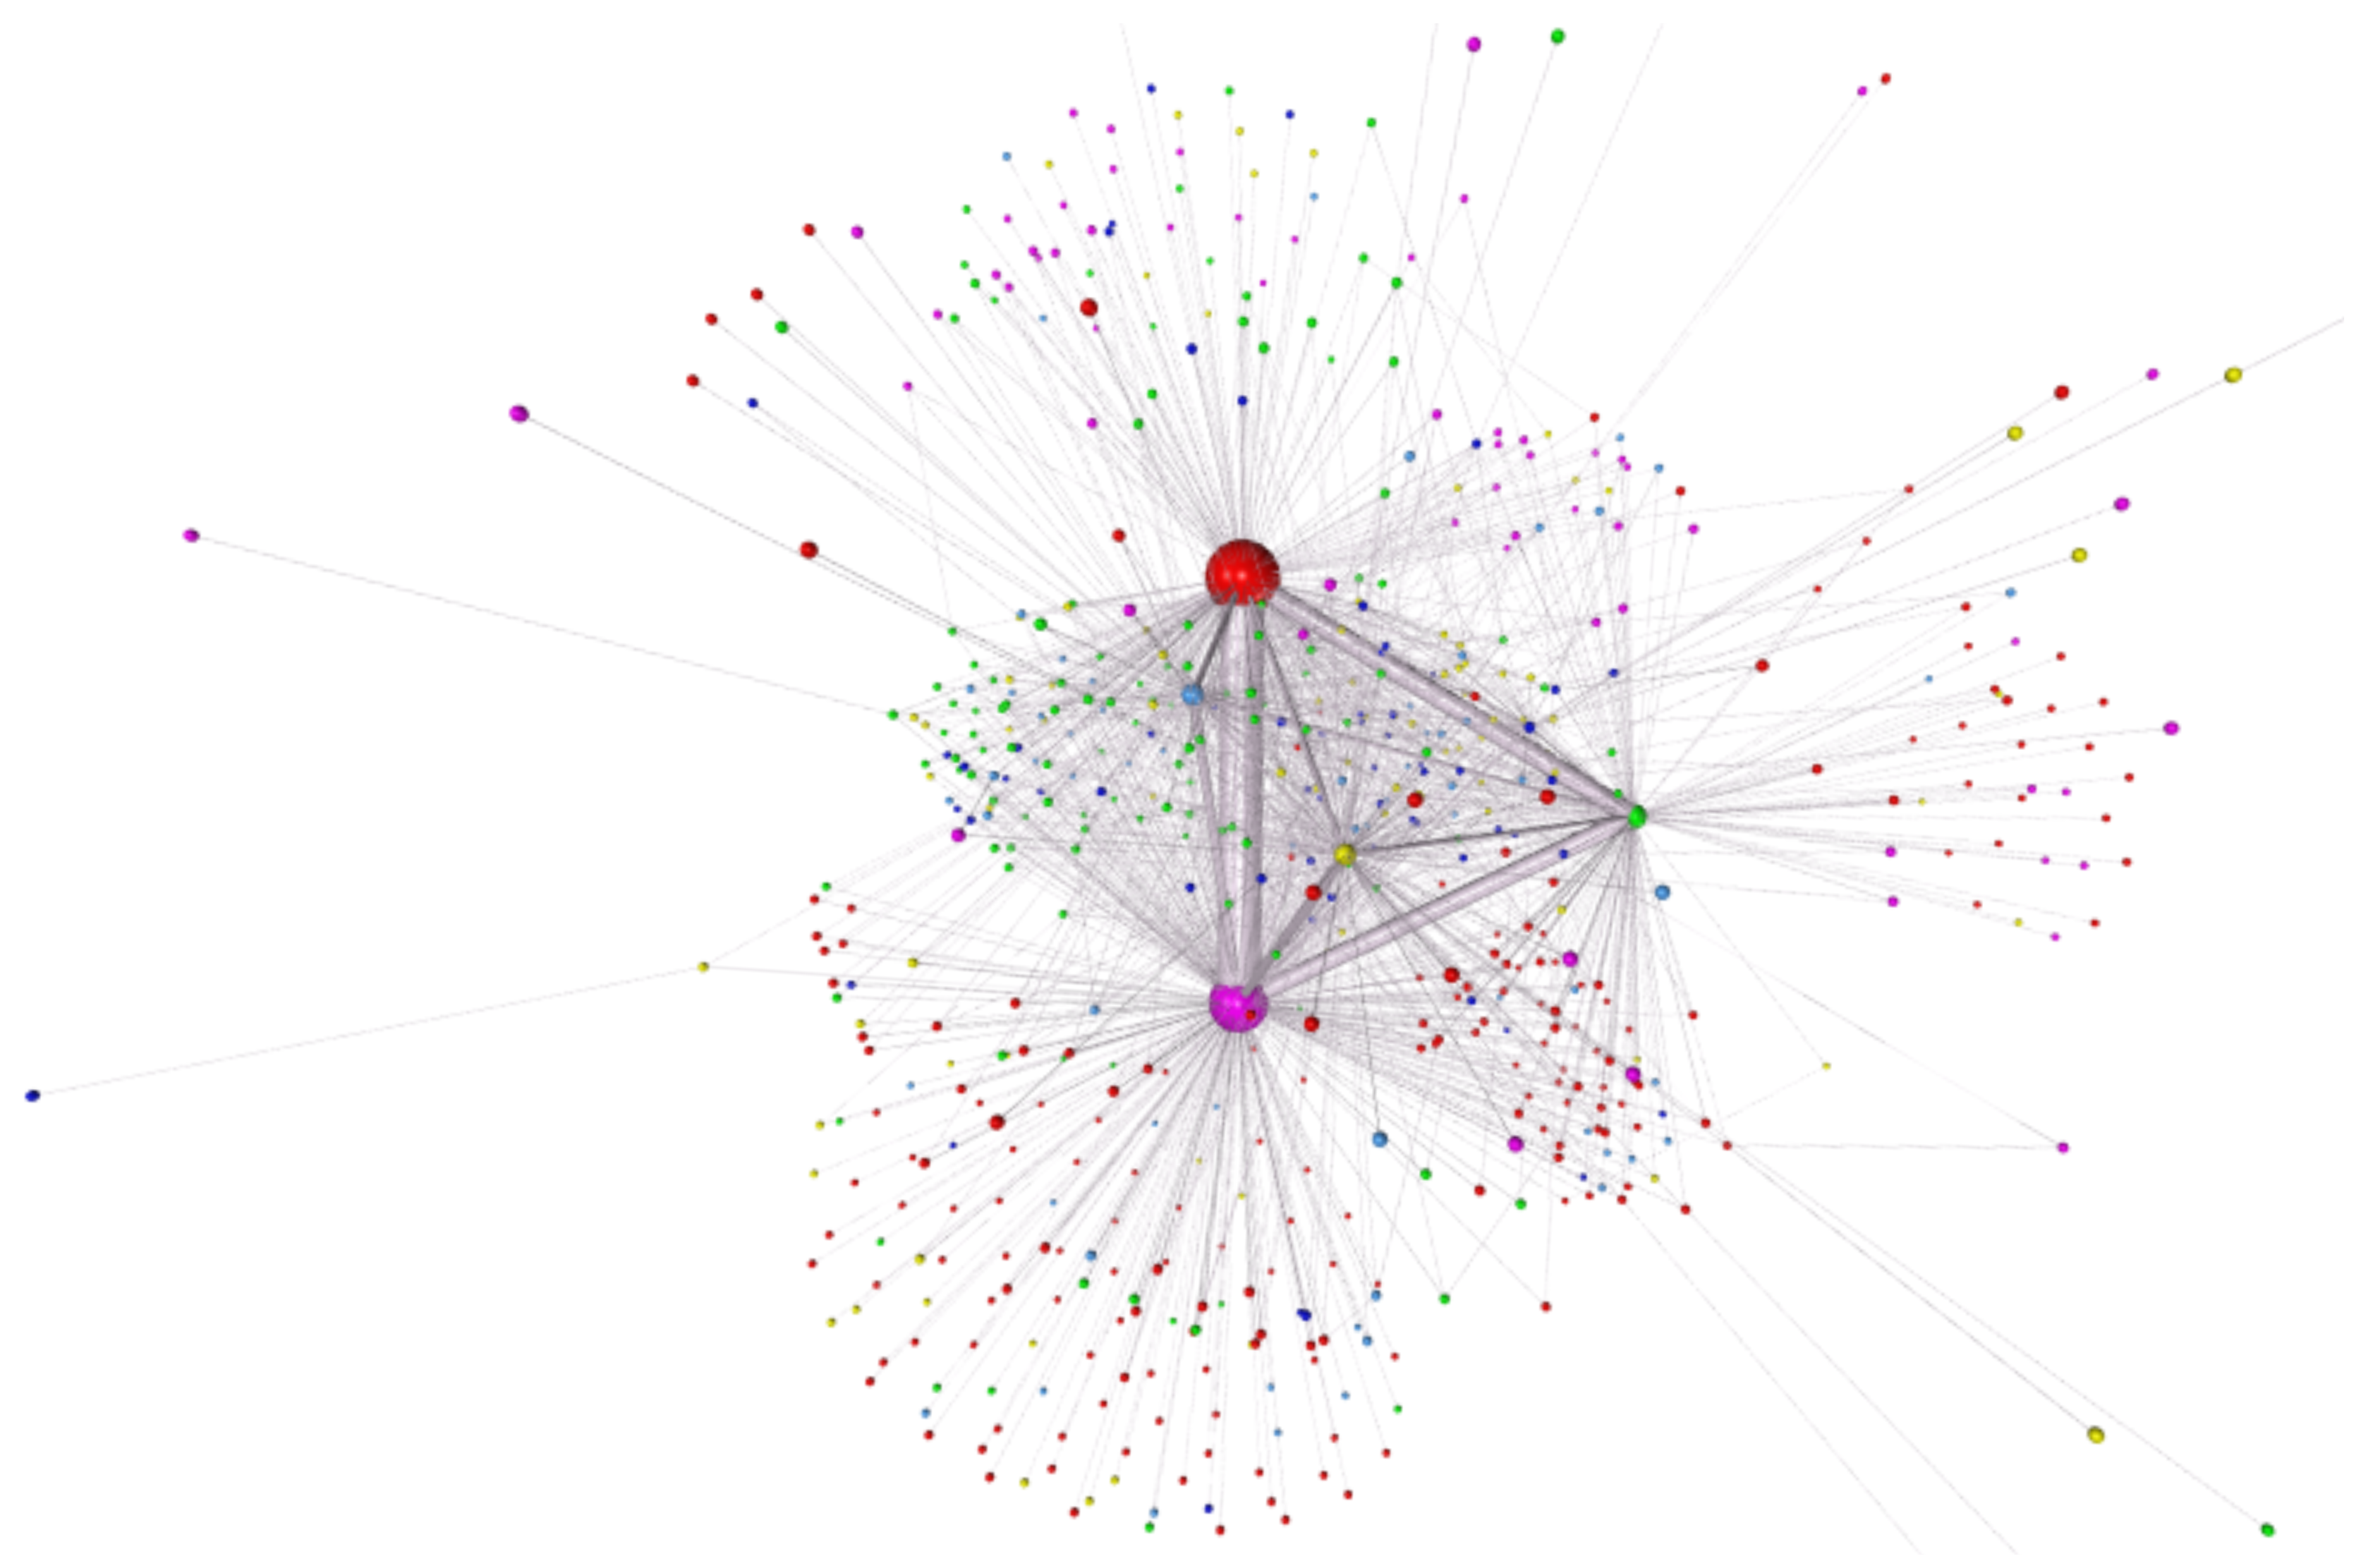
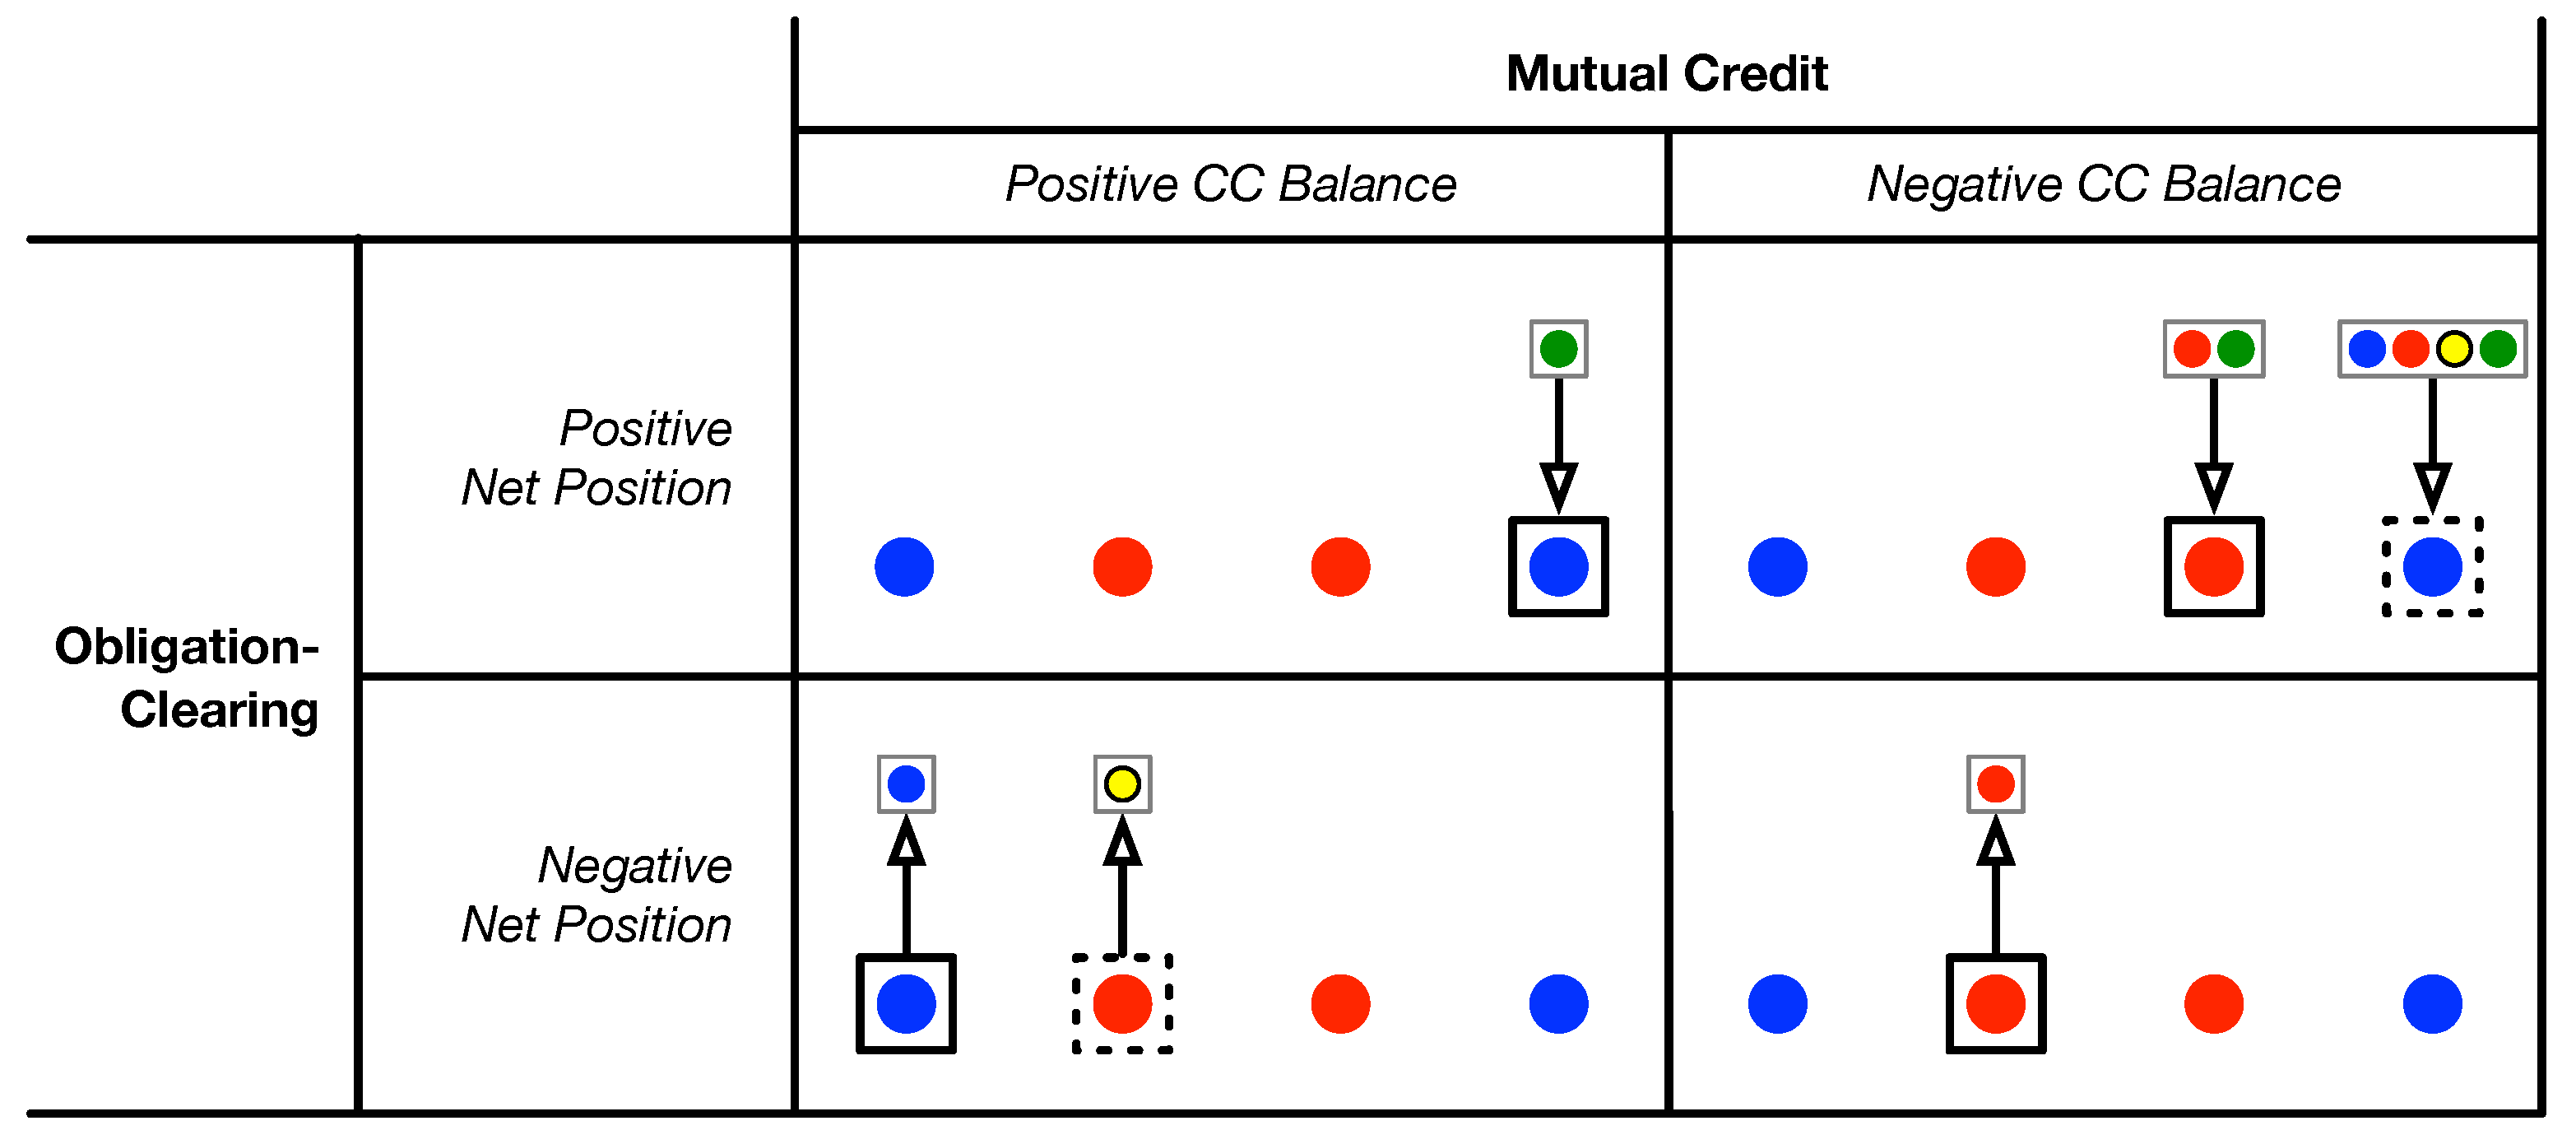
  • Firms with a negative net position and positive CC balance get a link FROM the Positive CC Balance node (blue dot, bottom-left).
    —If their positive CC balance is smaller than their negative net position they may get an additional link
    FROM the CC Credit Line node (red dot, second from the left).
  • Firms with a negative net position and negative CC balance get a link FROM the CC Credit Line node (red dot, second from the left).
  • Firms with a positive net position and negative CC balance are linked TO the CC Repayment node (red dot, third from the left).
    —If their positive net position is greater than the negative CC balance they may get an additional link
    TO the CC Balance Increase node (blue dot, bottom-right).
  • Firms with a positive net position and a positive CC balance are linked TO the CC Balance Increase node (blue dot bottom right).
  • The overall liquidity source node (CC Source), the bigger pink dot on the bottom, is connected to the four flow-type nodes in a way that closes all the cycles. Arrow thickness is proportional to volume.
We should emphasize that all flows in the figure are part of a cycle. Therefore, a flow conservation rule applies to all the nodes in the figure, including the liquidity source and the four flow-type nodes. The flow conservation rule means that the sum of all inflows equals the sum of all outflows for each node. Therefore, the net position of every firm is not affected but the size of its balance sheet is reduced. This applies also to the CC circuit as a whole. The net position of the CC circuit stays equal to zero (as it should by definition of mutual credit) since all outflows equal all inflows, but the exposure of individual firms might change due to new credits issued or credits repaid.
Regarding the firms themselves, blue nodes are firms that use their positive CC balance, red nodes use their CC credit line only, and yellow nodes use both. The colours of the edges match the colours of the source nodes. To explain the green edges, it helps to imagine an example in the form of a simple chain of firms (see Section 4), although the topology in the cyclic structure is significantly more complex. The first node of such a chain receives an arrow from the 1st and/or 2nd liquidity node and can never be green. The rest of the chain can be formed by firms of any colour which, however, are not connected to the special nodes. The last firm of such a chain can be of any colour and issues an edge (which could be green) to the 3rd and/or 4th node in order to close the cycle. This is because, even though the green firms do not make use of their own CC balance or credit limit directly, they may receive credits from other firms with which they are trading. Figure 12 summarizes the liquidity connections in the cyclic structure for the four combinations of user positions.
Figure 13 shows a comparison of the remainders with the total value of the obligations for three different scenarios: obligation-clearing without CC (line: TCT); the value of obligations cleared just using the CC (line: CC); and value saved using the full potential of obligation-clearing on a payment system together with the CC as a source of liquidity (line: CC and TCT, the case of Figure 11 just discussed).
Observing the remaining debt in these different scenarios we can see that a CC similar to Sardex performs very similarly to obligation-clearing. However, the combined strategy is the clear winner. Using just 2% of annual turnover as a credit limit we consistently settle close to half of the invoices. This is a substantial liquidity-saving that gives the firms an opportunity to manage their Euro liquidity better and use it to finance new growth. Figure 14 shows the monthly remainders as a percentage of monthly invoice totals. January has a slightly different level since we started our model with no credits in the firms’ accounts. The levels even out after the first month of operation. Finally, Figure 15 shows the distribution of Euro debt remaining after the TCT and CC clearing step for the May 2019 example. This figure is analogous to Figure 9, which showed the savings for the whole year for TCT acting alone.

3. Discussion

The practical economic and financial advantages of the liquidity-saving methods presented above are straightforward and do not require much discussion. From a more theoretical point of view, on the other hand, it is interesting to ask whether obligation-clearing can be regarded as a form of money. To begin to answer this question, it is helpful to relate the monetary innovation instruments discussed here within the context of more traditional understandings of the functions of money. This is attempted in Table 2, where obligation-clearing and mutual credit are compared to fiat money.
To speak of the obligation-clearing process as a form of money may seem odd or unwarranted. However, the search for common functional or structural traits is a well-established methodology in the exact sciences and helps make sense of apparently different and disparate phenomena.13 When such a search for common structural traits is applied to social science questions, it can lead to universalist claims that are insensitive to the local context and can cause great damage to people’s lives. The most famous example might be the ‘self-correcting market’ of the 19th Century, as recounted by Polanyi (Polanyi [1944] 2001), which lives on as the ‘free market’ of neoclassical economics today. However, in the present case we are indeed talking about making sense of the properties of rather complex quantitative instruments. The table, therefore, should be seen as an attempt to identify common structural and functional features in the full knowledge of the additional cultural, social, and political dimensions that these different forms of money as non-neutral social constructions necessarily carry (Dini and Kioupkiolis 2019).
All three monetary instruments satisfy the functions of the unit of account and medium of exchange, while the store of the value function is not satisfied by obligation-clearing since it is instantaneous. One way to rationalize the process is to say that in order to clear the obligations around a cycle a currency needs to be created long enough to be passed around that cycle and extinguish all the debts. This is analogous to the well-known story of the travelling salesman who (ad-libbing a bit) arrives in a town and stops at a hotel asking to take a look at a room before actually paying for it. The hotel manager agrees but asks for a $100 bill as a deposit. While the prospective guest is upstairs viewing the room the hotel manager runs across the street and hands over the bill to the shoe store owner, towards whom she had a debt. The shoe store owner takes the bill and goes upstairs to pay the dentist to whom he owed just such an amount. Cutting the story short, the dentist walks over to the hotel and hands the bill back to the manager to pay for a meal in the hotel restaurant from the night before that he had left on credit. Shortly thereafter, the travelling salesman comes back down and says that he is not interested in the room after all. The hotel manager returns the $100 bill and the salesman leaves. No net cashflow has entered the community but all the debts have been extinguished. Obligation-clearing is a much more sophisticated version of the same idea.
In mutual credit, the store-of-value function is “weak” because all balances are held at zero interest. Since interest is the price of money as a commodity, the zero-interest property of mutual credit is a conscious choice to limit the perception of credits as a precious commodity, thereby discouraging hoarding. In fact, it is better for the holders of a positive balance to spend the credits than to hold on to them, which helps the local economy.
The means of final payment is not usually listed in introductory economic texts but we find it helpful because it highlights the role of the State. Although the sociological monetary theory definition of money as “a social relation of credit and debt” (Ingham 2004) seems the most useful for understanding mutual credit, the chartalist definition of money as “that which the State accepts as tax” (Knapp [1924] 1973) is also undeniably important. In the present context, Sardex credits are not accepted as tax by the Italian tax authority; this fact together with its non-convertibility property has so far ensured that Sardex has remained exempt from the PSD II EU directive.14 More importantly, obligation-clearing is very much acceptable by the tax authority and, in fact, the inclusion of the tax authority as an additional node in the obligation network can have a major impact on liquidity-saving beyond the levels already demonstrated here.
Finally, the velocity of circulation of the US$ is approximately 1.5 (Jonung 2018), and of the Euro approximately 1. This variable is a statistical measure of the number of times a unit of account is spent, on average, in a given monetary area in one year. Using 2019 numbers, for Sardex this parameter is calculated from
Velocity = Total transaction volume in one year Average monetary mass in the same year = 52 m 10 m 5 ,
where the monetary mass is calculated by adding up all the positive balances in the circuit. The value of 5 is very high, reflecting the effect of zero interest and the relatively more important role the currency plays within the local economy.
For obligation-clearing, the velocity of circulation can be approximated as the average length of a cycle. We have used an algorithm by Brandes (2001) to calculate the path lengths. In 2019, in the obligation network for Sardex B2B transactions, the average path length between any pair of firms was 3.636, so the average cycle length is 7.272. Since the obligation network cannot be decomposed into cycles only, we can use the cyclic structure to estimate the cycle length more precisely. Using data for the whole year, the average path length in the cyclic structure is 4.094 and the average cycle length is therefore 8.188. So, pending a more in-depth mathematical study, we can provisionally approximate the velocity of circulation as 8.
Regarding more practical aspects, bringing the obligation-clearing model in our analysis to real-life operation would require another modification. We assumed that all payments are delayed until the end of the month, but such a scenario does not have a big chance to succeed in the market. What could be done is to attach an urgency attribute to each payment order. So, urgent payments are processed immediately and settled using the available credit in the accounts of payer firms. The rest goes into an end-of-the-month TCT event where firms can expect to settle more than their CC account balance and credit limit imply. This way they can realize substantial liquidity savings while the working capital for the circuit as a whole is being managed better. Currently, similar methods are used only inside large payment systems, clearing-houses, and large multinationals where the treasurer operates such schemes to deliver liquidity savings. Integrating LSM tools like TCT into CC communities gives access to the treasurer’s tools of large companies also to the managers of the smallest companies.
As a final point, this analysis has shown that obligation-clearing is much more effective than it might have been expected. In other words, it is unlikely that anyone would have imagined that a full 25% of the transactions can be cleared without moving any money at all. It is possible that the amount is so high because the Sardex network is connected particularly strongly. Indeed, this is consistent with the phenomenon called ‘import substitution’ in economics, whereby localism leads economic actors to buy a good locally that could have been imported. In the Sardex case, this is not a choice or preference, it is strictly enforced by the system. Quite apart from the debate of whether import substitution militates against competition and is, therefore, to be avoided, or whether it is instead an affirmation of greater local resilience and market power for economies at the margins, from the point of view of this paper, import substitution increases the number of transactions within the circuit and it makes the network more strongly connected.
Beyond these considerations, however, a more important effect is the rate of participation of the business sector to clearing events. In the Slovenian case, we saw in Section 1.2 that the average participation rate oscillates between 1% of all companies under normal conditions up to 8% in times of crisis. This is to be contrasted with the 100% participation we have artificially imposed in our simulation (both with and without extra CC liquidity). Therefore, we would expect the impact of obligation-clearing on liquidity-saving to be much larger than what Figure 2 suggests if, for example, 50% of all companies in a given country were to participate. Circumstantial evidence for this claim arises from the fact that in Slovenia the volume of exports represents approximately 80% of GDP. These export transactions cannot derive a benefit from obligation-clearing within the national borders. On the other hand, the corresponding number for Germany is 46%, and for Italy, France and the UK approximately 30% (Eurostat 2019). In other words, these other countries have a much larger internal market, both in proportional and in absolute terms. This indirect argument leads us to believe that the research hypothesis stated in Section 1.3 is easily satisfied if at least 40% of all companies in a given country are coaxed into participating, although, of course, a full validation awaits a proper empirical study with data from a complete population of firms.

4. Materials and Methods

In this section, we describe briefly the TCT and the Sardex systems.15

4.1. Brief Technical Description of Tetris Core Technologies (TCT)

TCT involves an extensive collection of knowledge, legal practices, accounting methods, and software tools to reduce mutual indebtedness in the economy through non-monetary intervention. The TCT multilateral set-off in Slovenia is performed once per month on a preset date. It is operated by the government agency AJPES.16 The agency accepts obligation information from enterprises in a standardized electronic format. The information received is checked and organized into the obligation network. Then TCT searches for all multilateral off-set cycles that maximize the total off-set value. Enterprises receive the set-off notice containing all the accounting information as a standardized electronic message. The agency charges a percentage fee for the amount that was successfully set-off.
An obligation network can be viewed as a set of payments due. All the firms in a strongly connected network are part of at least one cycle. Although this sounds encouraging, depending on the distribution of liquidity over the payment system members we can observe situations where payments cannot be processed individually. Leinonen (Leinonen 2005) provides the following definitions for different possible liquidity distributions:
  • Circular is a situation where individual payments can only be settled in a specific order. This situation is resolvable by reordering the payment queue.
  • Gridlock is a situation in which several payments cannot be settled individually but can be settled simultaneously. This situation is resolvable with multilateral off-set.
  • Deadlock is a situation where the individual payments can be made only by adding liquidity to at least one of the system participants.
We have encountered some of these concepts already in the previous sections. We now delve into some of the mathematics upon which TCT is based.

4.1.1. Notation and Definitions

We use standard matrix and lattice algebra. The notation and basic definitions are based on the work of Eisenberg and Noe (2001). We use boldface to denote vector character and uppercase Latin letters for matrices and also for sets. G is reserved to indicate a graph, and N = { 1 , 2 , . . . , n } N . For any two vectors x , y R n , define the lattice operations
x + : = ( m a x [ x 1 , 0 ] , m a x [ x 2 , 0 ] , , m a x [ x n , 0 ] ) x : = ( x ) + = ( m a x [ x 1 , 0 ] , m a x [ x 2 , 0 ] , , m a x [ x n , 0 ] ) .
Let 1 represent an n-dimensional vector all of whose components equal 1, i.e., 1 = ( 1 , , 1 ) . Similarly, 0 represents an n-dimensional vector all of whose components equal 0. Let · denote the l 1 -norm on n. That is,
x : = i = 1 n x i .
We use the following terms:
  • Obligation network is a directed graph where the nodes (or vertices) represent firms and the edges represent the obligations. Parallel edges are allowed to represent multiple obligations between two firms.
  • Nominal liability matrix is a matrix representing total obligations or liabilities between firms. We will define special vectors to describe the properties of the nominal liability matrix.
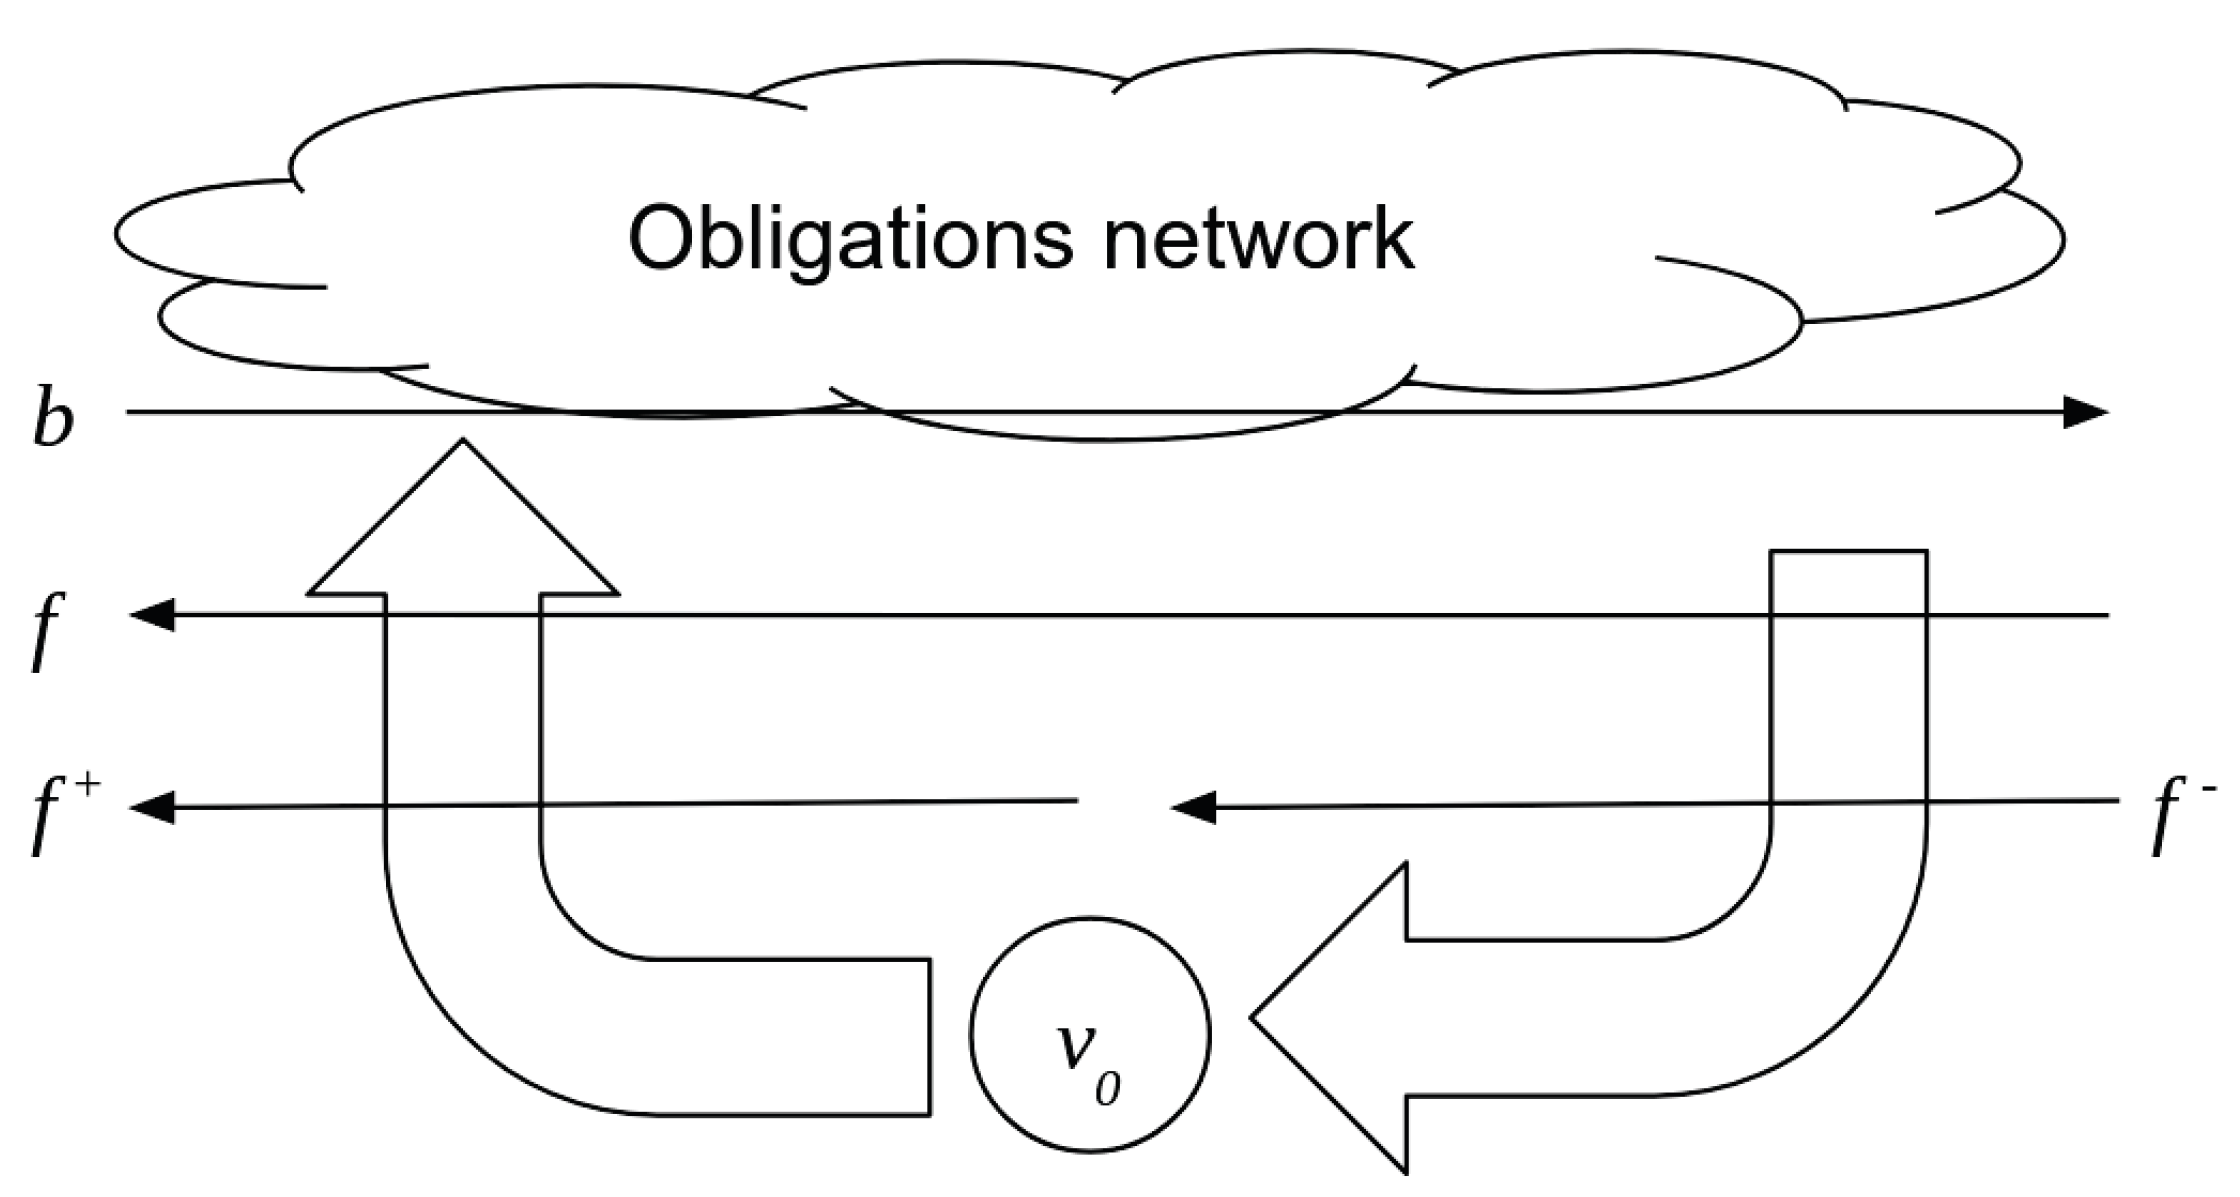
  • Payment system is constructed by adding special function nodes to the obligation network. These special nodes represent sources of funds and a store of value. They can have connections to all nodes in the obligation network, and the set of all connections for each special node will be described by a vector.
Let graph G represent the obligation network with n nodes representing firms, m edges representing obligations between firms, and the function o ( e ) representing the value of a single obligation e E between firm v i and firm v j (e.g., from a single invoice). The graph G may contain multiple edges from node v i to v j . We use ( v i , v j ) E for the subset of E that corresponds to all the edges between node v i and node v j . These definitions are summarized formally as follows:
(4) G = ( V , E , s , t , o ) directed   graph   of   obligations   between   firms (5) V = { v 1 , , v n } set   of   n   nodes   representing   firms (6) E = { e 1 , , e m } set   of   m   edges   representing   individual   obligations (7) e E individual   edge   from   set   E   obligations (8) s : E V assigns   the   source   node   to   each   edge (9) t : E V assigns   the   target   node   to   each   edge (10) o : E R assigns   the   value   of   the   obligation   to   each   edge
The nominal liability matrix L is a square ( n × n ) matrix each of whose entries is the sum of the obligations between two firms. Since companies do not invoice themselves L has zeros on the diagonal. Each entry is given by
L i j = e ( v i , v j ) o ( e ) .
The sum of row i of the nominal liability matrix represents the total debt of firm i and the sum of column j represents the total credit of firm j:
d i = j = 1 n L i j c j = i = 1 n L i j ,
where for the same firm i = j . Equations (12) provide the components of the system-wide credit vector c and debt vector d . The difference between the credit and debt for each firm gives the obligation network’s net position vector b :
b = c d b i = c i d i , d i , c i , b i R , i N .
Definition 1.
A vector b is called balanced if the sum of its components equals 0:
i = 1 n b i = 0 .
Theorem 1.
Vector b representing the net positions of all firms is balanced.
Proof. 
Every obligation that forms the liability matrix contributes towards the net position exactly twice, once as a credit and once as a debt. The sum of all credits is therefore equal to the sum of all debts and the sum of all the net positions equals zero:
j = 1 n c j = j = 1 n i = 1 n L i j = i = 1 n j = 1 n L i j = i = 1 n d i
i = 1 n b i = i = 1 n ( c i d i ) = i = 1 n c i i = 1 n d i = j = 1 n c j i = 1 n d i = 0 .
Corollary 1.
As a consequence of vector b being balanced, the sum of its positive vector components must be equal to the sum of the absolute value of its negative vector components:
b + = b ,
where b + and b are calculated as defined in Equation (2).

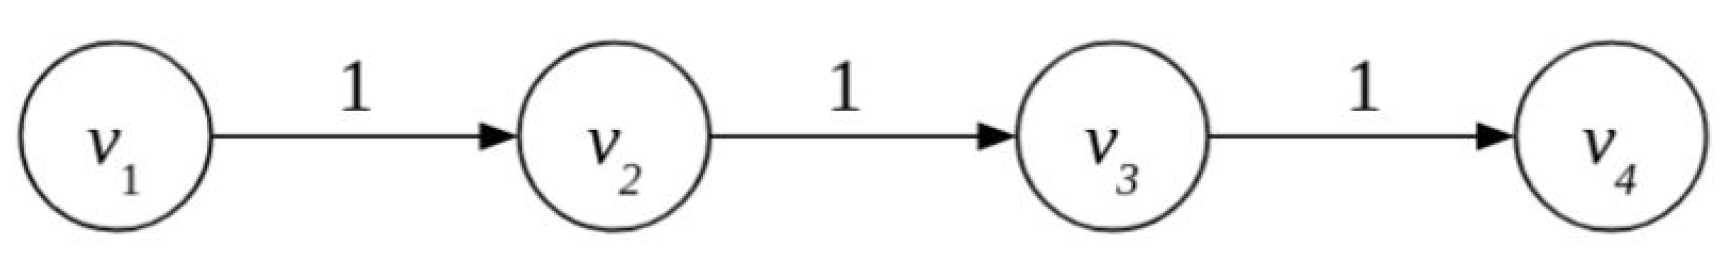
4.1.2. Clearing All the Obligations in the Network

The goal is to clear all the obligations in the obligation network. As shown in Figure 16, to achieve this we introduce a special node v 0 that can act as a liquidity source for all the cashflow towards the obligation network as well as a liquidity sink for all the cashflow from the obligation network. In practice v 0 can be a banking system where every firm in the network has a bank account. It can also be a complementary currency system or any other system with a store-of-value function. The cashflow is represented by an external cashflow vector f R n . When f i > 0 the cashflow for a firm i is towards the obligation network, while when f i < 0 its cashflow is from the network back to its bank account. By adding the cashflow vector, we have created the payment system ( L , f ) .
The cashflow available to firms from v 0 changes their net positions. If vector b represents the net positions of firms in the obligation network, let b * represent the vector of firms’ net positions in the payment system. The value of b * is
b * = b + f .
This simply states that the net position of every firm is increased by cashflow coming into the obligation network or decreased by cashflow going out of the obligation network. If our goal is to clear all the debt in the network, then—assuming enough liquidity is available—after our intervention the net position of every firm in the payment system has to be zero. In such a scenario, the incoming cashflow is used to pay off the debts of all the firms with negative net positions, whereas the outgoing cashflow carries the cash into the bank accounts of the firms with positive (credit) net positions. Therefore,
b * = b + f = 0 f = b .
The payment system in Figure 16 relates to a real-life situation if we take that v 0 is a bank, complementary currency, or some other financial institution that can provide an account-holding function and/or that can serve as a source of liquidity. So the positive values of the cashflow vector f + = ( b ) + represent the payments from individual firms’ accounts at the financial institution, while the negative values of the cashflow vector (or the values of f ) represent the payments out of the network and into individual firms’ accounts. Since the vector b of the firms’ net positions is balanced, the cashflow vector f is also balanced. So the total cashflow flowing into the network equals the cashflow out of the network:
f +   =   f .
Definition 2.
A payment system that can discharge all obligations in an obligation network is balanced.
Theorem 2.
The payment system ( L , f ) where f = b is balanced.
Proof. 
A balanced payment system has to discharge all obligations in the obligation network. That is, for every firm or node in the obligation network the sum of all incoming and outgoing cashflows has to be 0. Therefore, the total credit minus the total debt as defined in Equation (12) plus the external financing has to be 0:
c i d i + f i = b i + f i = b i b i = 0 i N .
Corollary 2.
Every balanced payment system satisfies the flow conservation constraint.
Proof. 
The flow conservation constraint requires all flows into a node to be equal to all outflows from a node. For a balanced payment system this is true for all nodes in the obligation network, as proven in Theorem 2. It is also true for the special node v 0 since the sum of all outgoing cashflow f + equals the sum of all incoming cashflow f , as shown by Equation (20). ☐

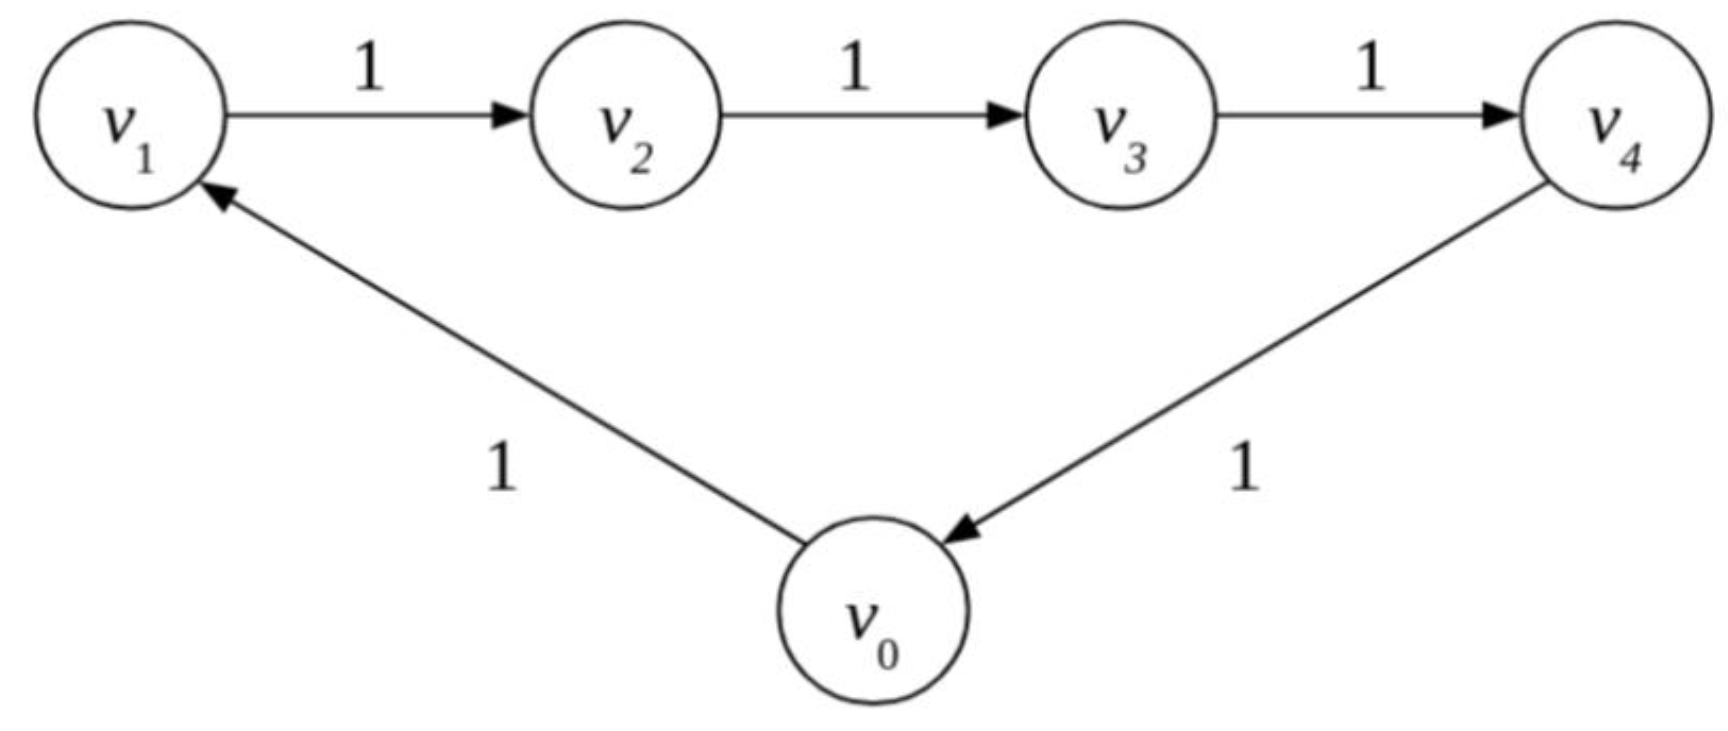
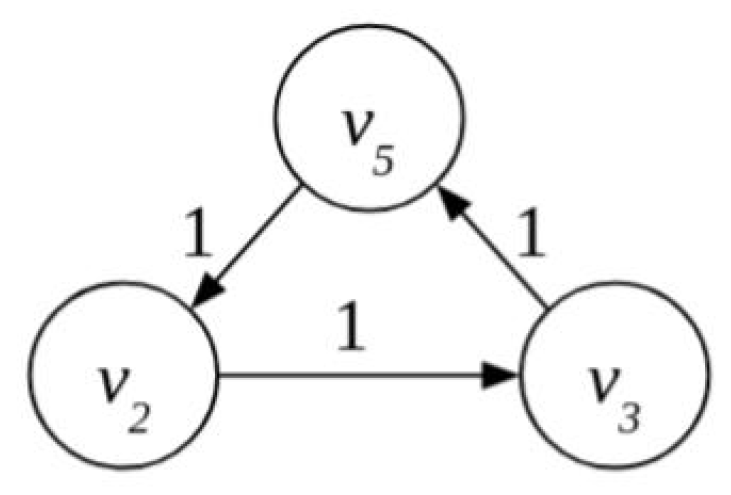
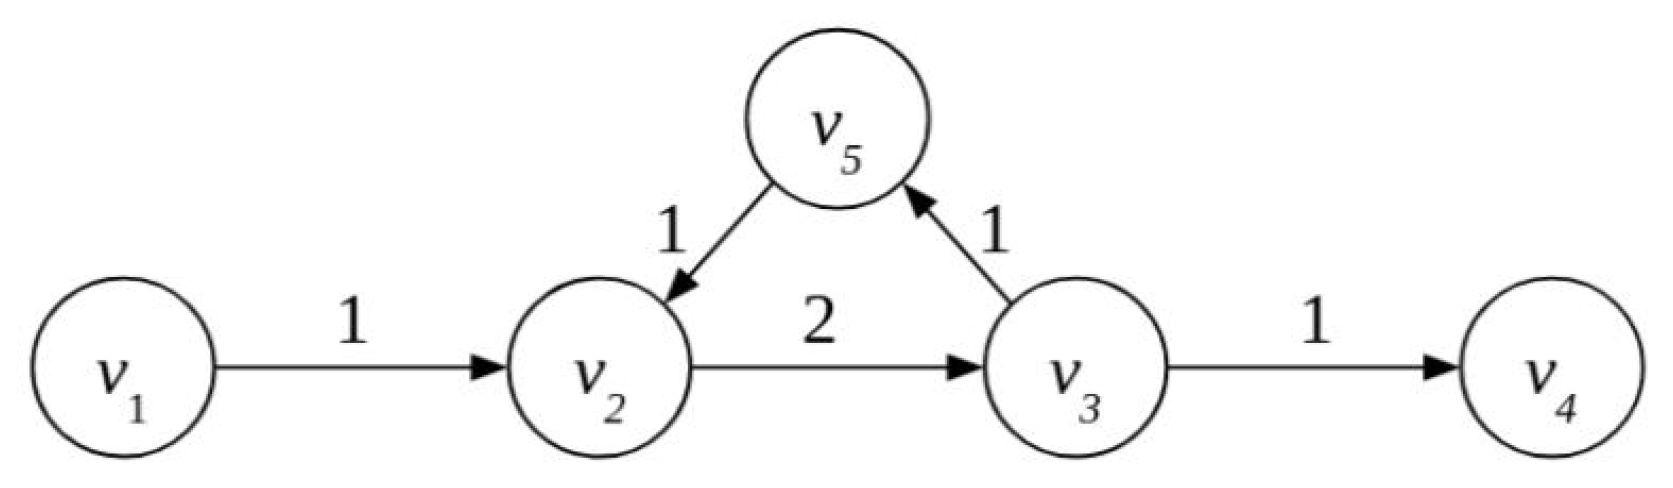
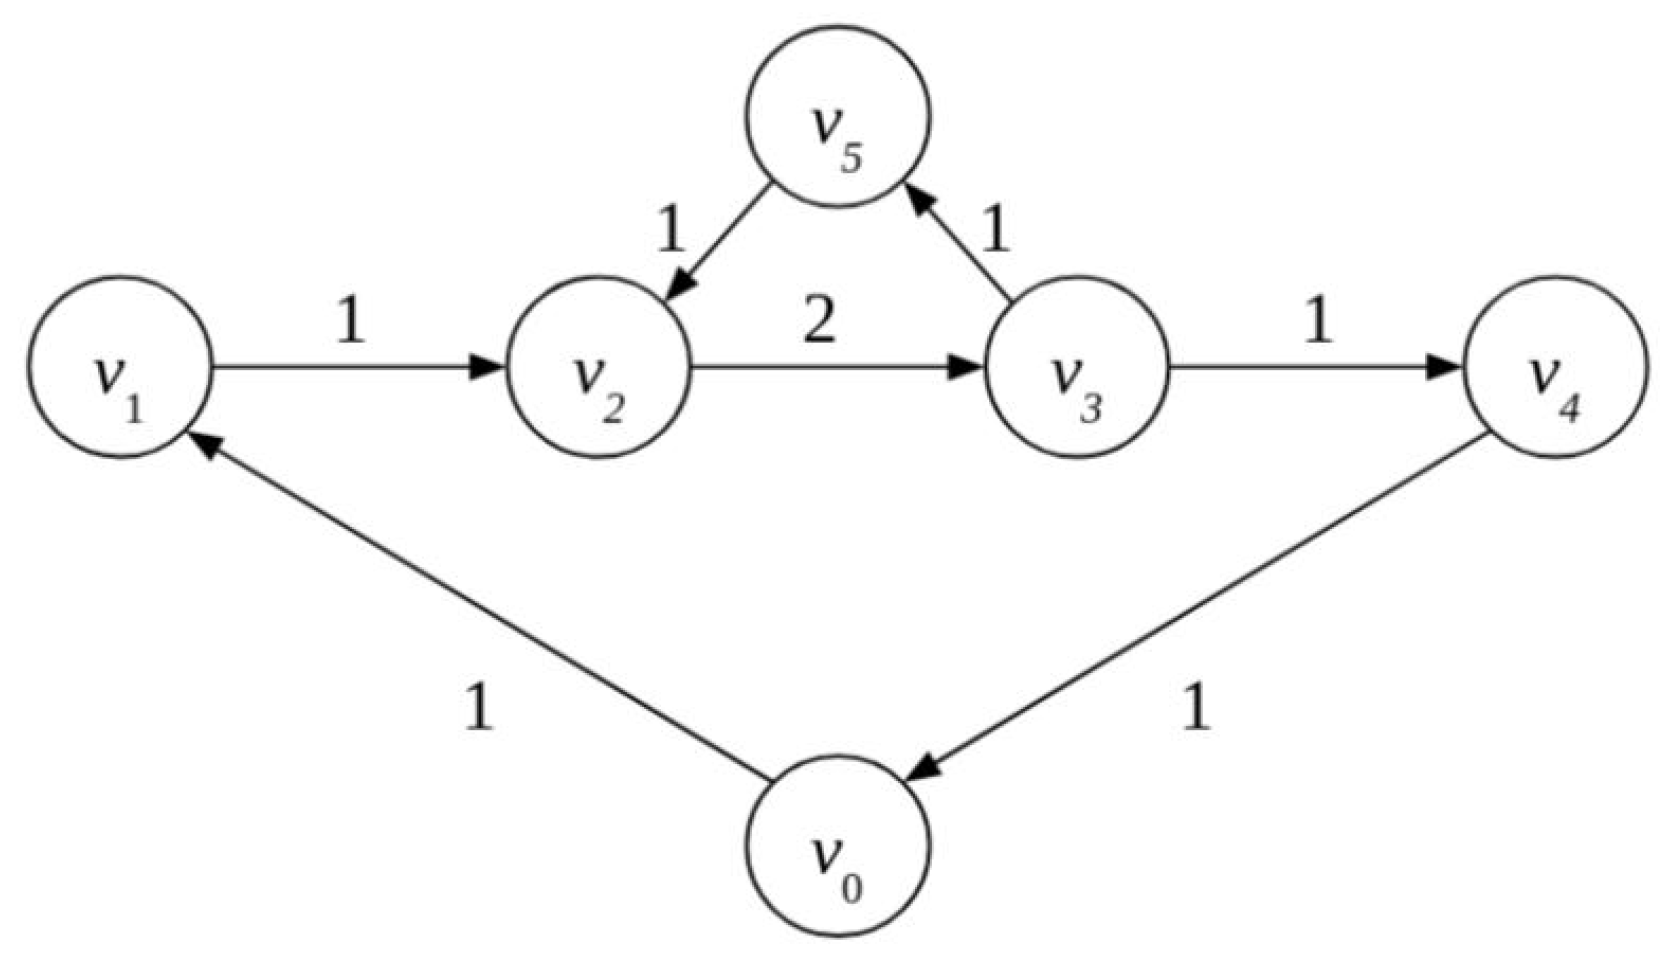
4.1.3. Gridlock Resolution in the Obligation Network

The effects of multilateral obligation set-off can be demonstrated by observing a small obligation network that contains only one chain of four firms, see Figure 17. Firm 1 represented by v 1 has an obligation to pay 1 unit to company v 2 , v 2 to v 3 , and so forth. It is easy to notice that, if Firm 1 has access to one unit of account of liquid assets, all the firms in the chain can clear all their obligations, resulting in Firm 4 having one unit of account more in their assets.
As shown in Figure 18, to visualize the flow of money we have to add a new node v 0 representing a store of value. This could be a bank hosting accounts for the four firms, or even multiple banks that we abstract away as a single node. The new node is connected to the network with two edges: ( v 0 , v 1 ) with a value (weight) of 1, which represents the flow of cash into the obligation network; and ( v 4 , v 0 ) also with weight 1, which represents the flow of cash out of the obligation network. Therefore, clearing the obligation network from Figure 17 leaves Firm 1 with 1 unit of account less in their bank account and Firm 4 with 1 unit of account more.
Figure 18 also clearly shows that providing liquidity is not just a problem of the total amount of liquidity available but also of the distribution of liquidity. If we let the firms with just enough liquid assets to discharge all obligations act as independent actors, it will take three steps or three individual payments to discharge all obligations in the chain. Although there is no gridlock in a chain of obligations, a centralized queue with an LSM will discharge all obligations in a chain simultaneously. This is the time-saving property of LSMs.
Another interesting example of a small obligation network is a cycle. The liquidity required to discharge all obligations in the cycle shown in Figure 19 is 0. Although there is no need for external liquidity sources such a simple cycle cannot be discharged if firms act as independent agents. Without the knowledge of the existence of such a cycle, the multilateral set-off cannot be executed. To discharge all the obligations in a cycle without knowledge of its existence at least one of the firms in the cycle has to use external liquidity to execute the first payment that then cascades around the cycle. Only with a centralized queue and an LSM can all obligations in a cycle be discharged without the use of external liquidity sources. This is the liquidity-saving property of LSMs. Thus, the cycles in an obligation network are the key to liquidity-saving.
Combining a chain and a cycle in a small obligation network we move closer to a real-life situation. Figure 20 shows a possible combination of the same chain and cycle. In this case, we need external sources of liquidity to discharge all the obligations, similarly to the chain example.
The optimal distribution of liquidity from the store of value node v 0 is shown in Figure 21. Although there is enough liquidity in such a system to discharge all obligations it cannot be done if members of the system act as independent agents because the cycle in the system prevents a smooth sequential flow of payments. Firm 2 cannot discharge its obligations even when it receives payment from Firm 1, signalling a gridlock that can be resolved in several ways:
  • Firm 2 borrows from an external source. That implies the need for another edge from node v 0 to node 2 with value 1. The borrowed funds can be returned to v 0 as soon as the payment from Firm 5 to Firm 2 is executed.
  • Any other firm in the cycle borrows from an external source, which would require new edges from node v 0 .
  • Still assuming that 1 unit arrives at v 2 from v 1 , Firms 2 and 3 agree on the partial discharge of the obligation. In this case, the partial payment of 1 unit of account from Firm 2 enables Firm 3 to discharge one of its obligations. If they decide to discharge the obligation to Firm 5, the cycle will be discharged in full. This removes the gridlock situation created by the cycle. The flow of 1 unit from v 0 through the obligation network is therefore unobstructed and all the remaining obligations can be cleared. If Firm 3 decides to discharge the obligation towards Firm 4 before Firm 5 we are back to gridlock.
Only by putting the whole obligation network in a queue with an LSM will the gridlock situation be resolved without the need for additional liquidity or special agreements between the firms.

4.1.4. TCT Non-Monetary Intervention

TCT in its operation does not involve any money. As already discussed its operation can be split into two logical steps or parts. The first part contains all the maximum-value cycles in the network, while the second part contains the remaining chains. Since the first part of the network contains only cycles it can be multilaterally set-off without any external liquidity. The firms involved experience the set-off as a liquidity-saving benefit. The remainder is settled by other monetary means via bank or CC payments. Since the remaining obligation network does not contain any cycles, gridlock situations can no longer arise. This contributes to the stability of the payment system overall and reduces the risk of liquidity shocks and spillovers.
The data for the tables and figures in this paper were processed in an online development TCT environment that is available for research purposes. The monthly data batches contained an average of 11,522 obligations and were processed in around 7 seconds. We processed 12 months without an external liquidity source and 12 months with a liquidity source.

4.2. Sardex Mutual Credit

Sardex is a mainly B2B electronic complementary currency based on mutual credit. In the Sardex mutual credit circuit, the participating companies start with a zero-credits balance, and are assigned by the circuit manager a credit line that is approximately equal to 2% of their turnover. They also sign a contract to commit to selling their products and services for about 10% of their turnover, which is how they recover the debt they incur when their balance goes negative. Assuming Company A has gone negative to a balance of 100 credits by purchasing something from Company B, the balance of Company B has now become +100 credits. Therefore, Company A has created 100 credits. The products and services that Company A will sell over the subsequent 12 months constitute the backing for the 100 credits that were just created. The foregoing implies that the sum of all the positive and negative balances in a mutual credit circuit is always identically zero
In addition, these numbers imply that the ratio of backing to debt is, on average, 10 / 2 = 5 / 1 , which is the inverse of what happens in a speculation bubble. This is why the Sardex system is very stable and resistant to free-riding behaviour. In mutual credit, the debt and credit positions of any one member are not bilateral towards another member or towards the circuit manager, they are towards the circuit as a whole; this highlights the individual responsibility of the user towards the circuit—if the user’s balance is negative—and the collective responsibility of the circuit towards the user—if the user’s balance is positive.
The main operating features of the Sardex system can be summarized as follows:
  • Local: the currency is valid and can be spent only in Sardinia because only Sardinian companies are admitted into the circuit.
  • Non-convertible: Sardex credits cannot be exchanged for Sterling or any other currency. They cannot be bought or sold. They can only be issued and earned by Sardinian companies (usually but not exclusively SMEs) trading in Sardinia.
  • Zero-interest: all Sardex balances, positive or negative, do not accrue interest.
  • Sardex is a B2B system whose membership is primarily composed of SMEs, although their employees can also participate if they voluntarily accept to receive part of their salary in credits (B2E program). More recently, Sardex has developed also a B2C product that comes with the same platform.
  • The power to issue credits is distributed to all the (company) members. Credits are issued when a member goes into debt by paying for a product or service provided by another member.
  • By double-entry book-keeping, for every draw-down of a buyer’s balance, which can go negative, there is an equal and opposite (i.e., positive) movement in the seller’s balance. Therefore, the sum of all the balances in the circuit is always and necessarily zero.
  • Credits can also be destroyed. When a member with a positive balance pays a member with a negative balance, the credits being paid are destroyed (monetary mass decreases).
  • Credit lines are on average at 2% of a member’s turnover, and they are set by the Circuit Manager.
  • Circuit members commit to accepting about 10% of their turnover in credits—by selling their products and services to other circuit members.
  • If the tax authority asks the Circuit Manager to provide information on the trading history of a given member, the Circuit Manager is obliged to provide it. Therefore, Sardex guarantees tax transparency even though it does not engage in or guarantee tax compliance. Tax compliance is the responsibility of each circuit member severally.

5. Conclusions

With each day that goes by money and data are ever more closely linked. In the past making purchases meant using money in exchange for a certain amount of economic value. Today it also represents an exchange of relevant data on who purchased what from whom, when, where, and how it was taxed. Businesses already profit from this richness of available data, especially big tech companies that dominate the market, but business communities and tax administrations are still lagging behind. In this paper, we have shown how the relatively simple type of data associated with invoices can be put to work to generate very substantial benefits for all in the trade credit market.
Liquidity-constrained SMEs usually depend on trade credit more than on bank loans to finance their working capital. The degree of this dependence increases during financial crises. SMEs and start-ups cannot easily produce the collateral needed to access bank loans, so they rely on building trust in a network of suppliers and customers to finance their operations, growth, and development with trade credit. We have demonstrated that mutual credit integrated with obligation-clearing can provide communities of companies a vital alternative source of finance. In our simulation, the businesses managed to discharge almost half of their obligations without fiat money.
As an added benefit, this integration acts as a risk management and mitigation tool. On the one hand, the manager of the CC system manages the firms’ risk exposure by adjusting their credit limits. On the other hand, an NPL recovery mechanism is practically embedded in the clearing system since, by being agnostic about whose liquidity is being saved, the nature of obligation-clearing in the cyclic structure on average mitigates debt exposure equally for everyone. Therefore, since a given amount of liquidity-saving is proportionally more important for an NPL firm than for a solvent firm, the joint participation of all firms in effect transfers part of the debt burden from high-risk to lower-risk firms. The resulting improved risk landscape makes it easier for banks and microcredit institutions to extend credit to loan applicants, to everyone’s benefit.
We have demonstrated the role of a strongly connected player in an obligation network with the integration of CC and obligation-clearing. Like the mutual credit circuit manager in our example, the tax authority also has a connection to all firms. There is a rising trend towards e-administration with an increasing number of online options to collect tax data. Tax authorities are starting to collect supplementary information on taxpayers’ economic activities at the transaction level. This information can form an obligation network. Therefore, it can be employed not merely to enhance monitoring capabilities and tax collection, but also to assist taxpayers, especially SMEs, to save liquidity without negatively impacting the State’s tax revenue. On the contrary, a significant improvement in taxpayers’ liquidity can serve as an incentive to participate in an improved tax reporting system. In addition to increased tax revenues, the economy would equally benefit from saved liquidity in the range of 0.5% to 2% of GDP, for relatively low firm participation rates, as shown in the case of Slovenia.
Our simulations have confirmed the research hypothesis: TCT acting alone saved approximately 25% of overall liquidity, whereas when acting together with mutual credit the savings were close to 50%—thus, much greater than 10% of the traded volume in both cases. Although we recognize that 100% firm participation is uncommon, our simulations suggest that any country that achieves at least 40% participation will verify the research hypothesis, and exceed it if mutual credit is also used as a liquidity source.
In conclusion, the current public health emergency makes the need for extraordinary tools to mitigate the effects of sudden economic downturns even more obvious. In response to the current economic downturn and to future crisis situations, we have presented significant monetary, financial, and fiscal innovations that are already well-tested and that we hope will be taken seriously into consideration by all the stakeholders.

Author Contributions

Conceptualization: Tomaž Fleischman, Paolo Dini and Giuseppe Littera; methodology: T.F. and P.D.; software: T.F. and P.D.; formal analysis: T.F. and P.D.; investigation: T.F. and P.D.; resources: G.L.; data curation: P.D. and T.F.; writing—original draft preparation: P.D. and T.F.; writing—review and editing: P.D., T.F., and G.L.; visualization: T.F.; supervision: P.D.; All authors have read and agreed to the published version of the manuscript.

Funding

This research received no external funding.

Acknowledgments

Particular thanks should be conveyed to Rudi Bric and Tomaž Schara, the authors of the ideas and the algorithm behind the TCT software, for providing privileged access to the TCT application for the quantitative analysis and for offering constructive recommendations at different stages of this research project. Publication of this paper was financially supported by Monneta (https://monneta.org/), a German not-for-profit organization, and the Development Economics Research Group at the International Institute of Social Sciences of Erasmus University Rotterdam (https://www.iss.nl/en).

Conflicts of Interest

The authors declare no conflicts of interest. Paolo Dini worked as a part-time R&D consultant for Sardex S.p.A. 2016-2019.

References

  1. AJPES. 2002–2019 Poročila o Rezultatih VečStranskega Pobota. Agency of the Republic of Slovenia for Public Legal Records and Related Services. Available online: https://www.ajpes.si/Bonitetne_storitve/Vecstranski_pobot/Porocila#b671 (accessed on 17 August 2020).
  2. Bardoscia, Marco, Stefano Battiston, Fabio Caccioli, and Guido Caldarelli. 2017. Pathways towards instability in financial networks. Nature Communications 8: 14416. [Google Scholar] [CrossRef] [PubMed]
  3. Bastian, Mathieu, Sebastien Heymann, and Mathieu Jacomy. 2009. Gephi: An Open Source Software for Exploring and Manipulating Networks. In Third International AAAI Conference on Weblogs and Social Media. pp. 361–62. Available online: https://vbn.aau.dk/ws/files/328840013/154_3225_1_PB.pdf (accessed on 26 November 2020).
  4. BIS. 2008. The Interdependencies of Payment and Settlement Systems. Technical Report. Bank for International Settlements. Available online: https://www.bis.org/cpmi/publ/d84.pdf (accessed on 2 September 2020).
  5. Brandes, Ulrik. 2001. A faster algorithm for betweenness centrality. The Journal of Mathematical Sociology 25: 163–77. [Google Scholar] [CrossRef]
  6. Byck, Shaun, and Ronald Heijmans. 2020. How much liquidity would a liquidity-saving mechanism save if a liquidity-saving mechanism could save liquidity? A simulation approach for Canada’s large-value payment system. De Nederlandsche Bank Working Paper No. 682. Available online: https://www.dnb.nl/en/binaries/Working%20paper%20No.%20682_tcm47-388290.pdf (accessed on 26 November 2020).
  7. Cuñat, Vicente, and Emilia García-Appendini. 2012. Trade credit and its role in entrepreneurial finance. In Oxford Handbook of Entrepreneurial Finance. Oxford: Oxford University Press, pp. 526–57. [Google Scholar] [CrossRef]
  8. Dini, Paolo, and Alexandros Kioupkiolis. 2019. The alter-politics of complementary currencies: The case of Sardex. Cogent Social Sciences 5: 1–21. [Google Scholar] [CrossRef]
  9. DZRS. 1993. Official Gazette of the National Assembly of the Republic of Slovenia. Available online: http://www.sistory.si/cdn/publikacije/36001-37000/36927/Porocevalec_1993-06-10_15.pdf#page=28 (accessed on 29 August 2020).
  10. DZRS. 1994. Official Gazette of the National Assembly of the Republic of Slovenia. Available online: http://www.sistory.si/cdn/publikacije/36001-37000/36976/Porocevalec_1994-05-10_18.pdf#page=36 (accessed on 29 August 2020).
  11. DZRS. 1995. Official Gazette of the National Assembly of the Republic of Slovenia. Available online: http://www.sistory.si/cdn/publikacije/37001-38000/37033/Porocevalec_1995-05-05_16.pdf#page=25 (accessed on 29 August 2020).
  12. Eisenberg, Larry, and Thomas H. Noe. 2001. Systemic Risk in Financial Systems. Management Science 47: 236–49. [Google Scholar] [CrossRef]
  13. Eurostat. 2019. Exports of Goods and Services in % of GDP. Available online: https://ec.europa.eu/eurostat/databrowser/view/tet00003/default/table?lang=en (accessed on 20 November 2020).
  14. Fleischman, Tomazž, and Paolo Dini. 2020. Balancing the payment system. arXiv, arXiv:2011.03517. [Google Scholar]
  15. Flögel, Franz, and Stefan Gärtner. 2020. The COVID-19 Pandemic and Relationship Banking in Germany: Will Regional Banks Cushion an Economic Decline or is A Banking Crisis Looming? Tijdschrift voor Economische en Sociale Geografie 111: 416–33. [Google Scholar] [CrossRef] [PubMed]
  16. Foote, Elizabeth. 2014. Information asymmetries and spillover risk in settlement systems. Journal of Banking & Finance 42: 179–90. [Google Scholar]
  17. Galbiati, Marco, and Kimmo Soramäki. 2010. Liquidity-Saving Mechanisms and Bank Behaviour. Working Paper No. 400. Available online: https://papers.ssrn.com/sol3/papers.cfm?abstract_id=1650632 (accessed on 20 May 2020). [CrossRef]
  18. Graeber, David. 2011. Debt: The First 5000 Years. Brooklyn: Melville Books. [Google Scholar]
  19. Ingham, Geoffrey. 2004. The Nature of Money. Cambridge: Polity. [Google Scholar]
  20. Jonung, Lars. 2018. Demand for Money: An Analysis of the Long-Run Behavior of the Velocity of Circulation. London and New York: Routledge. [Google Scholar]
  21. Juergensen, Jill, José Guimón, and Rajneesh Narula. 2020. European SMEs amidst the COVID-19 crisis: Assessing impact and policy responses. Journal of Industrial and Business Economics 47: 499–510. [Google Scholar] [CrossRef]
  22. Knapp, Georg Friedrich. 1973. The State Theory of Money. New York: Augustus M Kelley. First published 1924. [Google Scholar]
  23. Leinonen, Harry. 2005. Liquidity, risk and speed in payment and settlement systems–A simulation approach. Technical Report, Bank of Finland. Available online: https://helda.helsinki.fi/bof/bitstream/handle/123456789/9355/118263.pdf?sequence=1&isAllowed=y (accessed on 26 November 2020).
  24. Littera, Giuseppe, Laura Sartori, Paolo Dini, and Panayotis Antoniadis. 2017. From an Idea to a Scalable Working Model: Merging Economic Benefits with Social Value in Sardex. International Journal of Community Currency Research 21: 6–21. [Google Scholar]
  25. Motta, Wallis, Paolo Dini, and Laura Sartori. 2017. Self-Funded Social Impact Investment: An Interdisciplinary Analysis of the Sardex Mutual Credit System. Journal of Social Entrepreneurship 8: 149–64. [Google Scholar] [CrossRef]
  26. Mrak, Mojmir. 2004. Slovenia: From Yugoslavia to the European Union. Washington, DC: World Bank. [Google Scholar]
  27. Polanyi, Karl. 2001. The Great Transformation: The Political and Economic Origins of Our Time. Boston: Beacon Press. First published 1944. [Google Scholar]
  28. Sartori, Laura, and Paolo Dini. 2016. Sardex, from complementary currency to institution. A micro-macro case study. Stato e Mercato 107: 273–304. [Google Scholar]
  29. Simmons, Richard, Giuseppe Littera, Nigel Culkin, Paolo Dini, Luca Fantacci, and Massimo Amato. 2020. Helicopter, bazooka or drone? Economic policy for the coronavirus crisis. Politico Blog. March. Available online: https://www.politico.eu/article/helicopter-bazooka-drone-economic-policy-coronavirus-crisis-money/ (accessed on 26 November 2020).
  30. Studer, Tobias. 1998. WIR and the Swiss National Economy. Basel: WIR Bank. [Google Scholar]
  31. SURS. 2020. GDP and National Accounts. Statistical Office of the Republic of Slovenia. Available online: https://www.stat.si/statweb (accessed on 20 November 2020).
  32. Tompkins, Michael, and Ariel Olivares. 2016. Clearing and settlement systems from around the world: A qualitative analysis. Technical report, Bank of Canada. Available online: https://www.econstor.eu/bitstream/10419/173367/1/sdp2016-14.pdf (accessed on 26 November 2020).
  33. Traag, Vincent A., Ludo Waltman, and Nees Jan van Eck. 2019. From Louvain to Leiden: Guaranteeing well-connected communities. Scientific Reports 9: 5233. [Google Scholar] [CrossRef] [PubMed]
  34. van Dalen, Hendrik P., and Kène Henkens. 2020. The COVID-19 Pandemic: Lessons for Financially Fragile and Aging Societies. Work, Aging and Retirement 6: 229–32. [Google Scholar] [CrossRef]
1.
‘Obligation-clearing’ is the most general term, ‘invoice-netting’ is the same concept applied to invoices specifically.
2.
https://www.wir.ch/, since 2004 WIR Bank.
3.
Local Exchange and Trading System: https://www.openmoney.org/, https://www.letslinkuk.net/.
4.
The overall transaction volume for the Sardex system in 2019 was 52 million, the difference being made up of the Business to Employee (B2E) volume (11 million), trade with other Sardex-affiliated circuits in other parts of Italy (0.3 million), real-estate or capital equipment transactions (1.3 million), Business-to-Consumer (B2C) volume (6.5 million), and the trade volume of the circuit manager as a circuit member (1.4 million). We are using the GDP method to calculate the volume, not the clearing-house method. In the clearing-house method since the circuit manager acts as a central counterparty each transaction is counted twice, resulting in volume figures twice the size reported here.
5.
‘Strongly connected graph’ means that there is a route between any two nodes. ‘Complete graph’ means that there is an edge between any two nodes.
6.
7.
There is more than one cyclic structure that corresponds to the single maximum set-off amount, the solution is not unique.
8.
Liquidity-saving can also refer to the amount of debt saved (“debt-saving”).
9.
We remind the reader that the original data does consist of Sardex credits, but we are treating it as if it were all Euros, and are then adding a fictitious CC system on top, as explained in the text.
10.
The “Euro” turnover was calculated by adding up all the transactions for each firm for the 2019 data set being used.
11.
Created with the Gephi (Bastian et al. 2009) network visualization tool.
12.
The presence of the liquidity-based cycles indirectly affects also the part of the cyclic structure that does not rely on liquidity.
13.
In the empirical sciences this is generally known as dimensional analysis and is the basis of the search for dimensionless combinations of variables that “collapse” clouds of data points into surjective relationships that can be curve-fitted to a single function. The method was developed roughly in the same period, in the 19th century, as group theory in abstract algebra, of which it eventually became clear that it was an application, along with many areas of physics.
14.
15.
Following a referee suggestion we are including a minimal description of TCT’s mathematical underpinnings. Please see (Fleischman and Dini 2020) for a more complete presentation of the general theorems.
16.
AJPES stands for “Agency of the Republic of Slovenia for Public Legal Records and Related Services”. They are responsible for: registry keeping, collection, processing and publication of annual reports, statistical research and data collection, credit rating operations, and other commercial activities. https://www.ajpes.si/.
Figure 1. Obligations cleared by TETRIS Core Technologies (TCT) multilateral set-off in the 1991–1994 liquidity crisis.
Jrfm 13 00295 g001
Figure 2. Obligations cleared by TCT multilateral set-off in the 2009–2012 financial crisis.
Jrfm 13 00295 g002
Figure 3. Sardex 2019 business-to-business (B2B) transactions network. Colour-coding by business sector: retail, pink; services, red; hospitality, light green; manufacturing, yellow; wholesale, blue; and construction, light blue. Node size is proportional to the number of invoices issued.
Jrfm 13 00295 g003
Figure 4. Contraction of the Sardex 2019 B2B transaction network by joining adjacent nodes if in the same sector, colour-coded by sector. Retail: pink; services: red; hospitality: light green; manufacturing: yellow; wholesale: blue; and construction: light blue. Node size is proportional to the number of nodes joined, and edge width to the number of edges joined.
Jrfm 13 00295 g004
Figure 5. Spanning tree of Sardex 2019 B2B transactions network. Colour-coding by business sector: retail, pink; services, red; hospitality, light green; manufacturing, yellow; wholesale, blue; and construction, light blue. Node size is proportional to the number of invoices issued.
Jrfm 13 00295 g005
Figure 6. Net positions of individual firms in the Sardex community.
Jrfm 13 00295 g006
Figure 7. Histogram of individual firms’ net positions.
Jrfm 13 00295 g007
Figure 8. Net positions vector with remaining obligations left to be discharged.
Jrfm 13 00295 g008
Figure 9. Savings realized trough TCT superimposed on starting credit and debt.
Jrfm 13 00295 g009
Figure 10. Graph of Sardex B2B transactions in May 2019. (a): all transactions; (b): all cycles, with three cycles and two bridges forming the fourth cycle highlighted in colour. Cycles represent 24.6% of all transactions in May (see Table 1). The graph of all B2B transactions was made using a force-directed algorithm that puts the most weakly connected nodes on the outer edge of the graph.
Jrfm 13 00295 g010
Figure 11. Cyclic structure for the May 2019 payment system including the simulated complementary currency (CC) as a liquidity source. Green nodes represent firms that discharge (not necessarily completely) their Euro obligations entirely inside the obligation network without using any CC liquidity. Blue nodes are firms that use their positive CC balance. Red nodes use their CC credit line only, and yellow nodes use both. The colours of the edges match the colours of the source nodes.
Jrfm 13 00295 g011
Figure 12. Cyclic structure liquidity connections for different user positions.
Jrfm 13 00295 g012
Figure 13. Monthly remaining debt that has to be settled outside the simulated payment system.
Jrfm 13 00295 g013
Figure 14. Monthly remaining debt as a share of all obligations in the obligation network.
Jrfm 13 00295 g014
Figure 15. Remaining Euro debt of individual firms after clearing (TCT and CC) in May 2019.
Jrfm 13 00295 g015
Figure 16. Payment system: obligation network, source/sink of financing v 0 , and vectors representing cashflows.
Jrfm 13 00295 g016
Figure 17. A chain of obligations.
Jrfm 13 00295 g017
Figure 18. Payment system with a chain of obligations.
Jrfm 13 00295 g018
Figure 19. A cycle.
Figure 19. A cycle.
Jrfm 13 00295 g019
Figure 20. An obligation network with a chain and a cycle.
Jrfm 13 00295 g020
Figure 21. Payment system with a chain and a cycle.
Jrfm 13 00295 g021
Table 1. Value and number of invoices in cyclic structures of Sardex 2019 B2B obligation network.
TCT InputTCT Output
Total#Cycles # Remaining
MonthEURInvoicesEUR%Invoices%EUR%
1251910,82459723.7%463842.8%192176.3%
2228410,19246420.4%395138.8%181979.6%
3248111,60352621.2%439637.9%195578.8%
4253111,35958623.2%411536.2%194476.8%
5279212,30268724.6%559045.4%210475.4%
6255111,50562824.6%433837.7%192375.4%
7291012,40868823.7%524642.3%222176.3%
8221710,18341118.6%344233.8%180681.4%
9245611,27160924.8%447139.7%184775.2%
10267112,13463623.8%516042.5%203576.2%
11244111,53855522.8%477641.4%188577.2%
12313713,00782326.3%572344.0%231373.7%
mean258311,52760123.1%465340.2%198176.9%
* All EUR amounts in thousands.
Table 2. Comparison of money functions and properties with obligation-clearing and mutual credit.
Function or PropertyFiatObligation-ClearingMutual Credit
Unit of AccountYesYesYes
Medium of ExchangeYesYesYes
Means of Final Payment (e.g., taxes)YesYesNo
Store of ValueYesNoWeak, by design
Avg. lifetime between creation and destructionYearsMicrosecondsMonths
Velocity of circulation≈1≈8≈5
Publisher’s Note: MDPI stays neutral with regard to jurisdictional claims in published maps and institutional affiliations.

