Article

Application of Discriminant Analysis for Avoiding the Risk of Quarry Operation Failure

by
Adriana Csikosova
1,*,
Maria Janoskova
2 and
Katarina Culkova
1
1
Department of Earth Sources, Faculty BERG, Technical University of Kosice, 042 00 Kosice, Slovakia
2
Department of Management, Pedagogical Faculty, Catholic University of Ruzomberok, 058 01 Poprad, Slovakia
*
Author to whom correspondence should be addressed.
J. Risk Financial Manag. 2020, 13(10), 231; https://doi.org/10.3390/jrfm13100231
Submission received: 3 September 2020 / Revised: 23 September 2020 / Accepted: 26 September 2020 / Published: 28 September 2020
(This article belongs to the Special Issue Volatility Modelling and Forecasting)

Abstract

:
Activity in the mining industry is based on the profitability principle similar to other business sectors. In the case of stone pits, gravel and sand quarries, it presents a very complex task, mainly due to the fact that the economy of localities is influenced greatly by natural conditions, which cannot be changed. The presented contribution deals with the problem of how mining companies, realizing the surface extraction of construction materials, could be profitable in the future. The main research method of this contribution presents regression and correlation analyses with the goal of determining parameters with a decisive influence on the future economic development of the locality. A complex system of stone pit, gravel and sand quarries demanded discriminant analysis to evaluate individual localities with the goal of dividing them into profitable and not profitable localities. The results of the contribution divide localities of quarry mining among profitable or not profitable, serving for predicting the future development of the company, based on discriminant analysis. The results of maximally possible measures respect assumptions, enabling the correct application of such multivariate statistical methods. A further orientation of the research in an area of model creation for predicting the future development of the company is possible in the application of logistic regression and neuron nets.

Graphical Abstract

1. Introduction

In the 1990s, the extraction of raw materials in Eastern Europe was connected with the decreasing production and liquidation of mining capacities. The main reason pertained to economic results and decreasing donations from the state. The other characteristics of this period were privatization processes connected with the restructuring of the mining industry. The extraction of construction materials increased due to the support of foreign capital. However, the public attitude to mining worsened and new mining projects became difficult to realize. Thus, economically strong companies could provide their development mainly by the acquisition of operation localities. The reason for development was not only an effort to evaluate the capital of the company, but also the limited life cycle of the mining organization. The volume of mined stocks and mining intensity determined this. To decide on the acquisition of mining capacity, extraordinary importance is given to the estimation of future economic results. Profit in the future is influenced not only by a single decision of an acquisition but also by the price of the acquisition.
In recent decades in Eastern Europe, there was a rapid development of transport and transport infrastructure as well. To construct or reconstruct highways, speedways, railways and airports, there is a need for a high volume of mined and crushed aggregate. Aggregate is used directly as a filler to concrete or asphalt mixture to the surface layer of roads.
In the past, quarries had been part of construction companies, operating only as supplementary operations. Presently, they present individual companies since they are relatively individual units, managed in the frame of the organizations or corporations. In most cases, in all European countries, the ownership of such mining units underwent private investor management, which expects an evaluation of investment and analyzes the necessity of new investments in detail (Lyandres and Zhdanov 2013). It is given maximal emphasis to the economy of the quarry. Due to the growing demands of quality, the need for high investment in machinery is given, but it brings high depreciation. There is also the need to provide sufficient sales, which is dependent on the competition, but mostly on the price of the product (regarding the distance of the construction from the mining locality). The price of transport plays an important role and, frequently, it could increase the total price of the aggregate. It depends on the total geology of the locality (external natural conditions). Aggregate is only available in some, mostly mountainous, localities, mostly in the Czech Republic and Slovakia. A dense net of open pits causes the impossibility to build a big capacity of a quarry; therefore, the decreasing cost of technology depreciation per ton of aggregate is complicated. Lowland localities are mostly without aggregate sources, obtained by drilling in the quarry, but partially aggregate could be mined from the deposit at sand and gravel plants. Crushed aggregate must be imported from distance localities to communications, where mined aggregate could not be used. Such localities could be found, for example, in Poland, where stocks of crushed aggregate appear in the southwest part. In other regions, road construction depends on aggregate import.
However, the extraction of raw materials presents a very specific business, and as any mining activity, it is influenced by internal natural conditions, such as quality of aggregate, storage conditions, hydrogeology, antifreezing, etc. To record long-term positive economic results in the quarry, a certain number of positive factors must be given. Such factors, connected with natural conditions, have decisive importance, since people do mostly not influence them. However, additionally, there is a whole row of parameters connected with natural conditions influencing the profitability of mining.
The goal of the contribution is to determine how mining companies, realizing surface extraction of construction materials, could be profitable in the future. In the contribution, we deal with a mining company that produces aggregate to gross and production of rare aggregate. The need to make an analysis of the risks of mining company failure results from the situation in the mining industry, when a number of companies registered bankruptcies, needing to be revitalized and restructuralized. In the company, we selected and determined the factors that have a decisive influence on future economic development. These factors had been used as a base for managerial decisions during new acquisitions.

2. Literature Review

The initial summary studies aiming to create a model for predicting the future development of the company appeared in the 1930s. These studies dealt with the analysis of rate indexes in successful and unsuccessful companies. Moreover, Fitzpatrick (1932) tried to identify rate indexes that could be used for predicting the future development of organizations. Smith and Winakor (1935) analyzed accounting reports of unsuccessful organizations and determined indexes with values close to possible bankruptcy. Beaver (1966) conducted research in an area of rate indexes for predicting the future development of the organization with the aim of proving the utility of rate indexes for bankruptcy prediction, confirming that successful companies record the better values of rate indexes than unsuccessful companies do. The mentioned studies show the ability of rate indexes to predict decline and find an index or group of indexes with values close to bankruptcy (Balcaen and Ooghe 2006). However, their results are not clear, since any study emphasizing different indexes and individual indexes are analyzed individually without mutual relations.
Altman (1968) overcame the limitations of a single approach. He included several rate indexes to the prediction model of one index and used the results of previous studies. The index solves the most important rate indexes for the analysis of potential bankruptcy estimation, in which weights are added to the chosen indexes (Atiya 2001). Altman used multivariable discriminant analysis for the construction of the multivariable model for bankruptcy prediction. In recent research, Altman (2013) and Altman et al. (2014) revised his model and, lately, Altman et al. (1977), with the use of discriminant analysis, deduced the second generation of a model for bankruptcy prediction. Altman acknowledged shortages of the model based on linear discriminant analysis (Altman 1981), mostly due to not realizing an assumption of the multivariable distribution of discriminants in any class and compliance of class covariance matrixes. The inability to fill the assumption of multivariable normality leads to the use of other discrimination functions to describe data distribution (Eisenbeis 1977; Mensah 1984). Ohlson (1980) used logistic regression analysis for the creation of a model to predict bankruptcy. From the beginning of the 1990s, neural networks were used for model construction to predict bankruptcy (Odom and Sharda 1990; Tam 1991).
Interesting results are concluded by Bhimani et al. (2010), who analyzed the relationship between chosen indexes and bankruptcy probability according to the data of joint-stock companies in Portugal.
In most classical-model cases, estimation is based on noncasual sample selection, and their structure is different from the companies’ structure in practice. Examples of studies based on the noncasual selection of samples are: Altman (1968); Ohlson (1980); Zavgren (1983); Geng et al. (2015).
Chava and Jarrow (2008), as well as Shumway (2001), found that academic models of Altman, etc., could not be used properly in industrial conditions; however, Shumway’s model provided a more accurate prediction, most likely due to the limited number of bankruptcies in the databases previously available, due to the analyzed subjects that are from the postcommunist country. Hazard and other similar models cannot be used and mostly academic Altman or IN, or bonity index models, can be used for the evaluation of industrial companies.
Presently, we can observe a number of tendencies and connect the application of prediction models during bankruptcy prediction (Štefko et al. 2020). Sun et al. (2014) dealt especially with three development tendencies: the transition from single analysis to multivariable prediction; the transition from classical statistical methods to methods of machine learning, which are based on artificial intelligence; and the intensive connection of hybrid and ensemble classificatory (Mihalovič 2018). In practice, there exists a prevailing method of discrimination analysis and logistic regression (Aziz and Dar 2006).
In the past 30 years, various methods arose using mostly programming and artificial intelligence during the prognosis of the financial situation of the companies. Moreover, mathematical programming has obtained increasing attention. Methods for the prediction of financial health development were used by Freed and Glover (1981), Glover (1990), Koehler and Erenguc (1990), Gass and Assad (2005) and Kwak et al. (2011). The most known and most used method from the higher mentioned is neuron nets.
The presented contribution is limited to prediction in the mining industry. Studies from other sectors (Sun et al. 2019) are closely connected with mining (Borlea and Achim 2014), such as the metallurgical industry, energetic industry (Bobinaite 2015), tourism industry (Andrawis et al. 2011) and the technology sector (Anagnostopoulos and Rizeq 2019). However, the mining industry (especially quarry operations) in the literature has received attention.
There is also a need to evaluate companies with regard to different conditions in different regions and countries. In this connection, Aziz and Dar (2006) provided methods applicable across different countries and found models seem to be generally comparable with little differences in conditions of use. According to Agarwal and Taffler (2008), there is little difference in the predictive ability of prediction methods in the UK. Similar research can be orientated to differences in other countries, such as in the research of Fedorova et al. (2013), Kristof and Virag (2020), Pisula (2020), Kovacova et al. (2019), etc. Due to the aforementioned studies, this paper contributes to the literature in the area of evaluation of the mining industry, in addition to its connection with other industries, and compares the possibility of mining conditions in various regions and countries.

3. Material and Methods

This contribution analyzes mining organization, producing crushed and extracted aggregate for the construction of railways, roads, concrete plants, asphalt mixture for the regulation of waters, etc. The analyzed organization belongs to a multinational joint-stock company.
Data of the research are from the database of basic financial reports from successful and unsuccessful companies. Obtained data were adjusted for the calculation of discriminant analysis. The calculation was made in Microsoft Excel due to the broad availability. We also used the statistical SAS Enterprise Guide. However, the module for discriminant analysis offered only a linear variant. Moreover, the calculation in Excel enabled a detailed understanding of the problematic and more exact adaptation to the research aim.
To detect symptoms of company bankruptcy, the following research questions were determined:
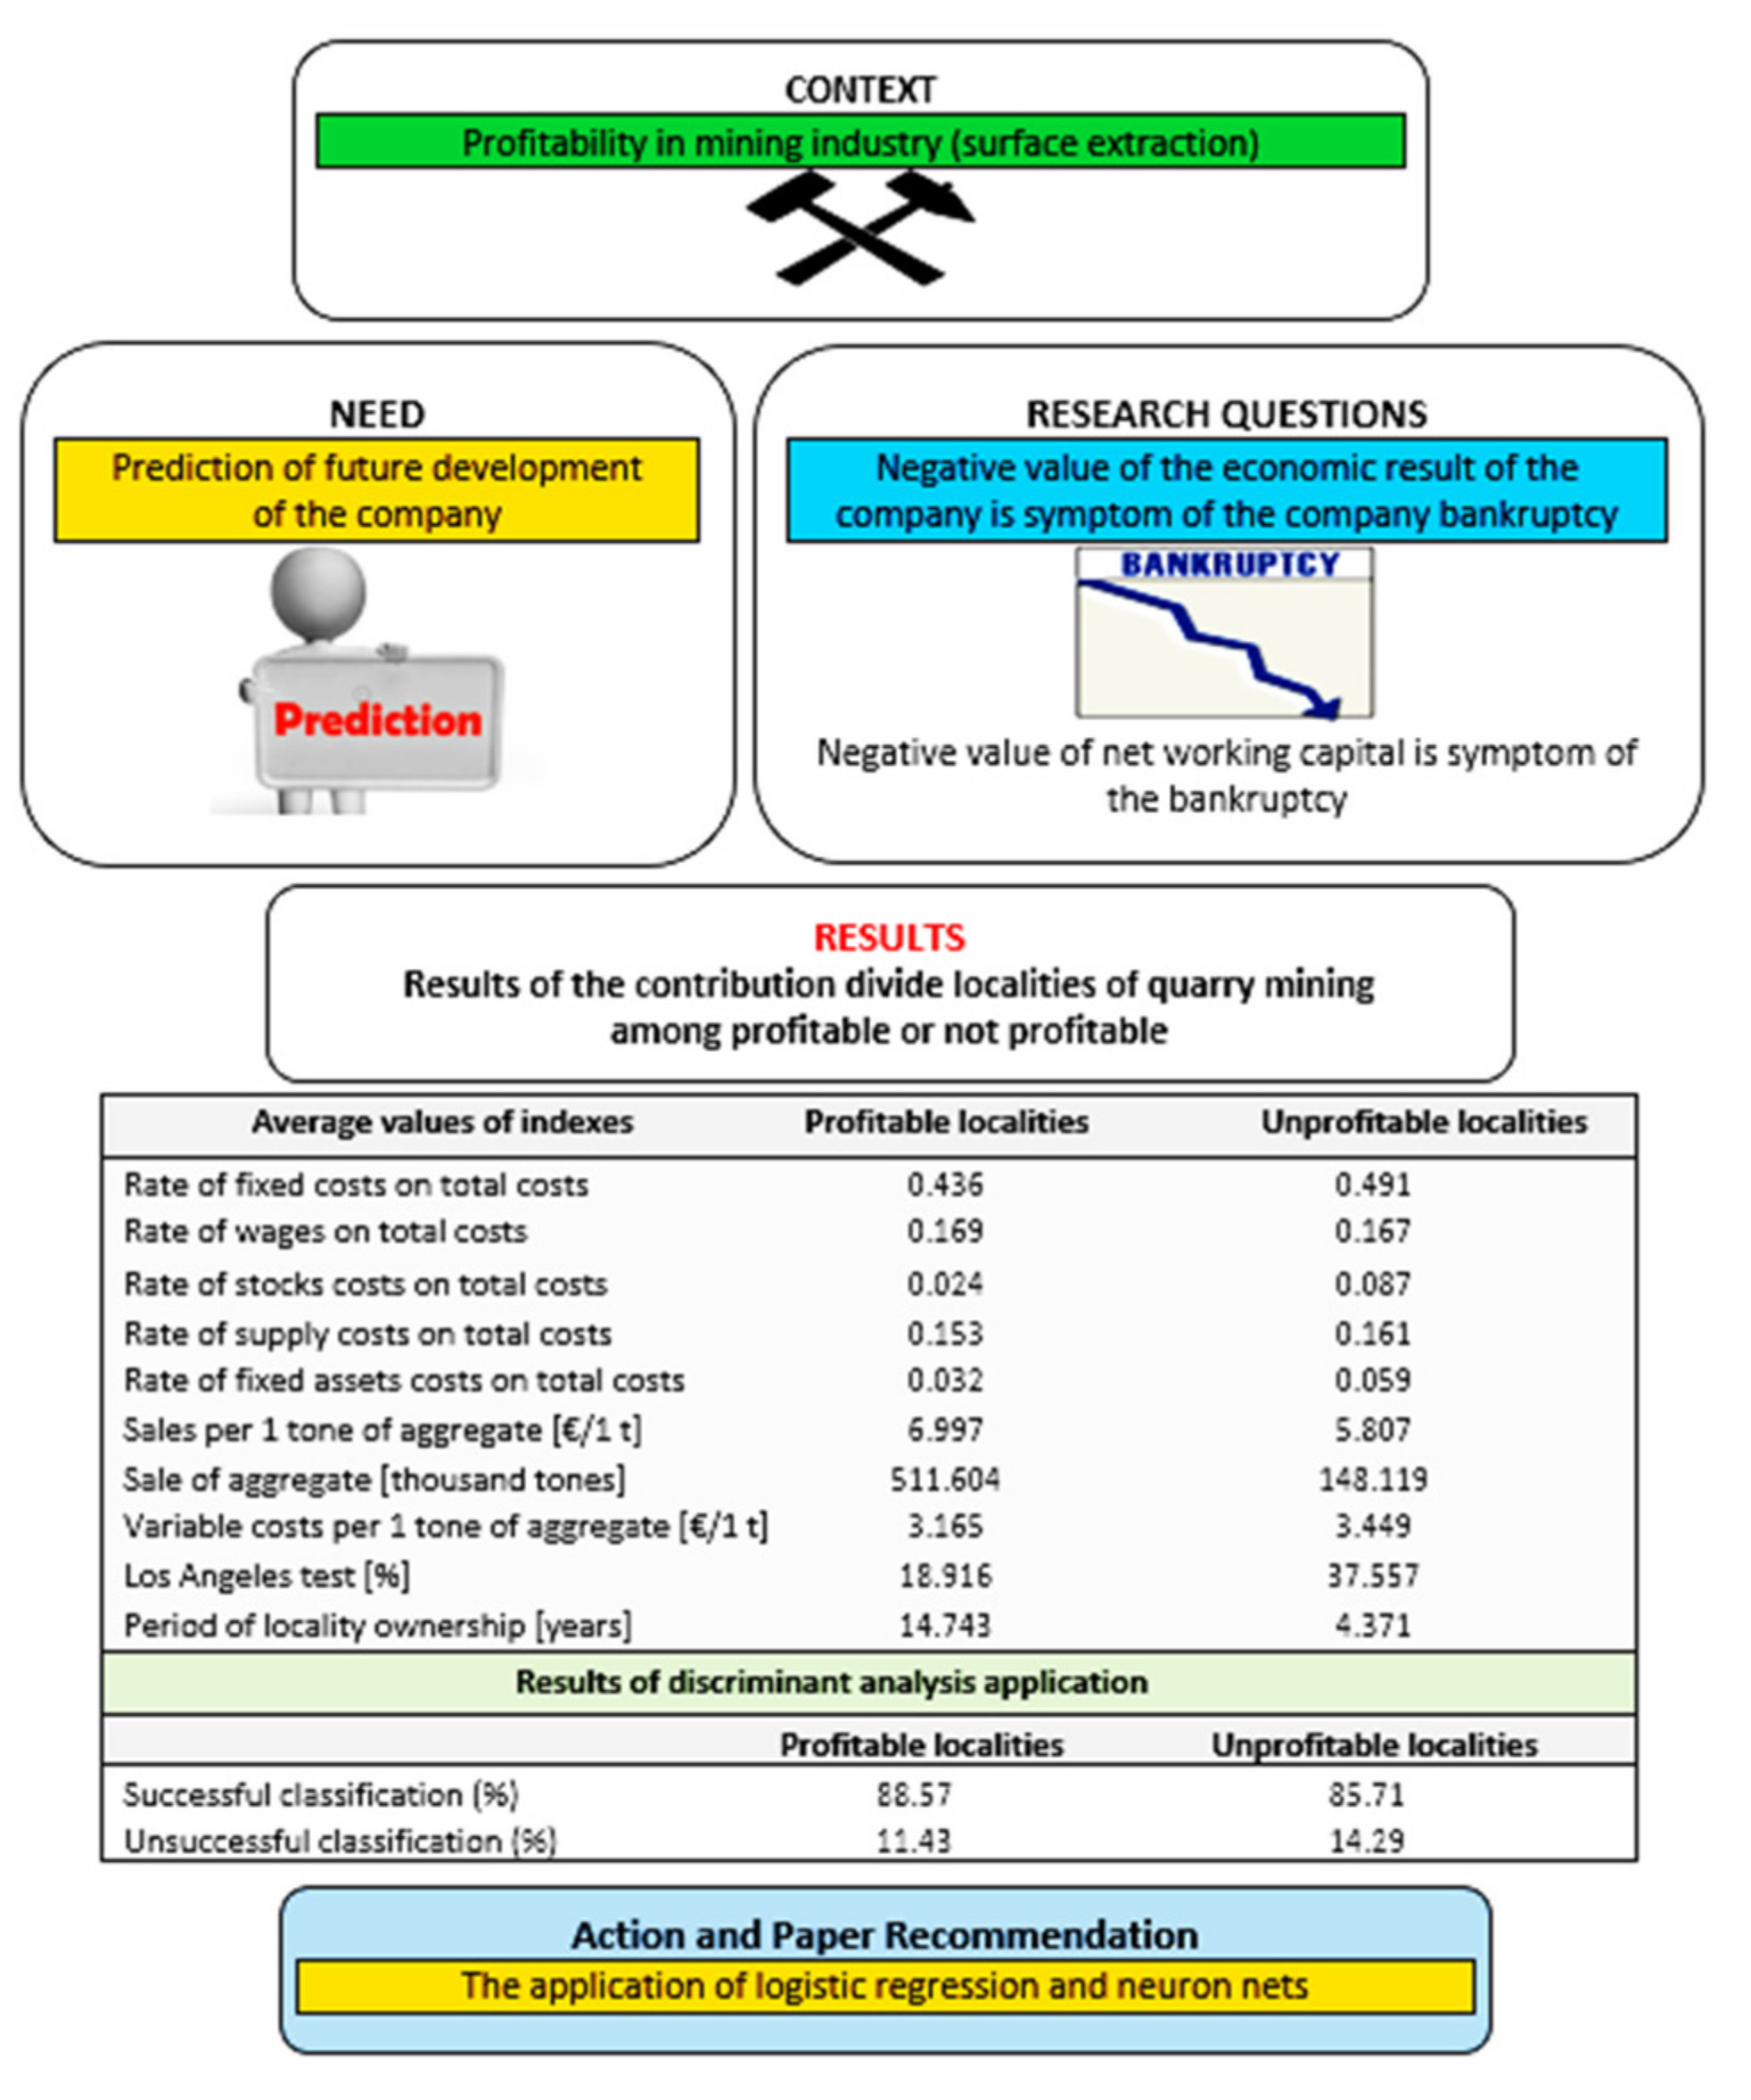
  • We assumed that a negative value of the economic result of the company is a symptom of the company’s bankruptcy.
  • We assumed that a negative value of net working capital is a symptom of bankruptcy.
The research questions result from several years of research, as well as a number of theoretical bases mentioned in the frame of the publication.
During the research, we resulted from the research of Syamni et al. (2018) that used different prediction models in mining companies. The evaluated bankruptcy prediction model in mining can be used as one of the approaches to measure the movement of the market with energy and raw materials, as well as provide competitiveness of the mining companies.
Equipment for aggregate processing in the analyzed company presents a technological link that is rather demanding on investment, projected to the conditions of any raw material. We used a file of 70 localities from several countries in Middle and Eastern Europe. To verify the analysis, we used the next 12 localities, appearing in the Czech Republic, Slovakia, Poland, Hungary, Austria, Croatia and Romania. All localities belong to worldwide corporations; they are managed by the same principles according to a single strategy. All organizations produce aggregate for transport construction. The localities are managed by cost managerial accounting, which reports them as single operation units. Therefore, it is possible to use the sample for a mutual finding of dependence and decisive factors and parameters. In a sample with 70 localities, 35 localities recorded a loss in 2017. A corporation had owned the localities, included in the research file and economic results had been evaluated during the common economic year.
Discriminant analysis enables the evaluation of differences between two or more groups of objects that are characterized by a certain number of signs. According to mentioned evaluation, it is possible to classify analyzed objects into classes. In the case of discriminant analysis using the prediction of future development, companies act as objects, which are classified into two classes, mainly groups of healthy and unhealthy companies (Csikósová et al. 2018). A certain number of quantitative indexes, so-called discriminants, characterizes any company.
The choice of discriminants significantly influences the prediction ability of a result model. Data for calculation of discriminants could be obtained according to accounting reports (balance sheet, loss and profit statement), from which financial rate indexes are calculated (Csikósová et al. 2019).
Choosing the discriminants can be done in two ways. The first uses a rather net mathematical approach when choosing a big number of different rate indexes when we do not know which of them are effective for the classification of the company to the group of healthy or unhealthy companies. During the selection of effective discriminants, we search it by adding or removing discriminants. The value of Malahabisov distance DM2 will change among medium values in both classes. In individual steps of adding or removing discriminants to or from the model, it is possible to use various decision criteria (for example, the Wilk criteria λ).
The second approach of discriminants choice is based on skills, knowledge and intuition of solvers (subjective choice) when the selection of individual discriminants is supported by a theoretical model of solved task. The model of discriminant analysis is created by a linear combination of variables: discriminants that enable the best resolution between successful and unsuccessful companies. Therefore, the most popular method is the linear discriminant analysis, which is used in the contribution. The linear discrimination function presents the following equation:
Di = dlXil + d2Xi2 + ⋯ + dmXim
where:
  • n—Number of companies in the class;
  • m—Number of discriminants;
  • Di—Discrimination score for i-company;
  • Xij—Value of discriminant in i-company (j = 1, … m);
  • dj—Coefficient of linear discrimination function, correspondent to;
  • j—Discriminant (for j = 1, … m).
Several characteristics of the company (discriminants) are, by this method, combined to one multivariable score Di, which has a value between −∞ and ∞. It presents an indicator of the financial health of the company. Its low value speaks about a bad financial situation. Correct application of linear discriminant analysis demands the following assumptions:
  • Discriminants report multivariable normality of distribution;
  • Class of healthy companies and companies, threatened by bankruptcy, have the same covariance matrix.

4. Results

In 2017, localities recorded extraordinary events (new operations, new openings, complex construction of new technology, etc.). These were discarded from the sample because, according to such extraordinary events, the research results could be skewed. Relevant costs were chosen from the localities and the costs were processed into the input tables for the groups of profitable (Table 1) and unprofitable localities (Table 2).
Differences between average values of profitable and unprofitable quarries are statistically important at the 5% level of importance for variables: rate of costs of stocks on total costs, sales per one ton of aggregate, sale of aggregate, Los Angeles test and period of quarry ownership (Meloun and Militký 2004). It means profitable quarries are averagely higher because they have a longer period of ownership, more qualitative production and higher prices, and the land was purchased in the past at lower prices. The average values of analyzed indexes are given in Table 3.
The mentioned comparison provides guidance on what parameters each profitable locality has. The profitable locality should be the biggest (from the perspective of the annual volume of production and sale). It depends obviously on sale. A large volume of aggregate is not possible to stock, not only from the perspective of binding in the stocks but also due to the worsening quality of aggregate due to being stocked for longer than half a year. The quality of raw material in the analysis was made by the Los Angeles test, which should be less than 20%. It presents one of the basic characteristics of the rock that cannot be improved by the adjustment process. Parameters of the rock must be compared not only with applied norms and legislation in a given country where the quarry appears but also with surrounding deposits. In most cases, the weak or strong side of rock characteristics appears in all deposits in a given locality. Profitable localities have also a lower variable cost per one ton of aggregate, a longer period of ownership in concern, a lower rate of cost per property and area of stock in relation to total costs.
A less important difference is the rate of fixed costs on the total cost and the rate of personal and supplement costs on total costs. In all cases, the costs were lower in profitable quarries, except for personal costs, where the difference is small. Profitable quarries also have higher sales per one ton of aggregate, since they sell more qualitative production. Ten parameters that are further used in the analysis were considered relevant and relatively available.
At the sample with 35 profitable and unprofitable localities, correlation and regression analysis were applied. Variables presented the dependence of the economic results on the chosen indexes.
The correlation was processed for the group of profitable and unprofitable localities. At the 5% level of importance for the file with 35 localities, there is a statistically important dependence in the case when the correlation coefficient achieves absolute values higher than 0.3246. In the case of 10 considered variables in a group of profitable localities, the strongest dependence with the correlation coefficient of 0.7438 is at the dependence of the economic results on an annually sold volume in tons. Other dependencies confirm known facts, but they are under the level of statistical importance (see Table 4).
For unprofitable localities, the strongest dependence of the economic results on the time of locality ownership is when the correlation coefficient is 0.3538. Next, statistically important dependence can be found at the dependence of the economic results on an annual sale of aggregate in tons, where there is an indirect rate with the correlation coefficient of −0.3368, which means the more tons the locality sells per year, the higher the expected loss. This fact is very dangerous. For the managerial decision, it means to minimize variable costs at unprofitable localities. For the group of localities, which in spite of a high volume of production, recorded a loss. This is similar in localities that sold a high volume of nonqualitative cheap embankments for construction in a given year. Other correlation coefficients are statistically unimportant (see Table 4).
Linear discriminant analysis was applied in the file with n localities, which was divided into two groups: profitable localities (1 n) and unprofitable localities (2 n). Any locality is characterized by the values of m discriminants. The goal is to find a linear discrimination function by which it is possible to rank the next locality, characterized by higher mentioned discriminants to the group of profitable localities or to the group of unprofitable localities.
The average values of discriminants lead to results—individual coefficient of discriminant analysis and calculation of optimal limit value. Coefficient of discrimination functions a1 to a10 are mentioned in Table 5.
By using discriminants for individual localities in a basic file by the following equation, it is possible to obtain the value of the discrimination function.
fi = ∑ aj·xij, j = 1 − n

5. Discussion

According to the analysis, we can state that correlation analysis presents methods for the evaluation of localities with limited utility. Predicting the economic results of the locality according to dependence on a single index is quite problematic. Real dependencies are more complex for using pair regression and correlation analysis. A number of factors that influence each other in mutual relations influencing the future economic success of the localities are:
  • A prevailing majority of correlations are statistically unimportant.
  • Pair correlations are an insufficient method for the classification of the quarry from the perspective of future economic results.
  • There is therefore a need to use a more sophisticated method. Dependence of yet described 10 parameters had been evaluated by discrimination multivariable analysis with the aim to follow up the dependence of individual parameters among themselves.
  • The use of the control sample proved the suitability of the mentioned method used for the classification of localities from the perspective of their future economic results. The mentioned 10 parameters properly described influences, considerable for economic results of the locality in the future.
The method of locality classification among profitable or unprofitable was applied by the support of managerial decisions. It is used mostly for existing localities that have recorded losses for a long time. It is necessary to decide if the locality can gradually overcome the losses and record profit by various measurements. There is also the possibility to leave the locality in a period of zero for the economic results in the case it has, at the same time, influenced the market position and weakened competition while some big construction in the surrounding area is expected. The locality could be retained in planned loss when this loss is not basic for the economy as a whole and the loss could bring synergic effects (for example increasing sales and profits in another locality).
While the locality is in loss, it is necessary to make measurements that could change the situation to a profitable one. During the planning of such measurements, the mentioned method for the classification of localities by discriminant analysis presents a support tool for the decision if the planned changes and measurements provide the practice demanded effect by the way of improving the economic results.
Again, here, we present the results from the input data, table of sales and fixed and variable costs that were simulated for the future planned state of the locality. It is necessary to estimate the future volume of production and its average price with regard to the competition and total market development. It is also necessary to consider cost burdens resulting from the purchase price of the locality (space of stocks, costs of property, new costs, increasing investments, construction of new technological link, construction of new driveway). The influence of natural conditions reflects economic conditions, as well as the value of the Los Angeles test. During the time of ownership in concern, it is necessary to consider 4–5 years after the acquisition with the aim to avoid the distortion of the resulting discrimination function by this parameter, which could be misleading in the case of acquisition. The resulting value of the discriminant function is compared with the optimal limit value to give an answer for whether the investment is interesting at a given purchase price or not. It must also be discussed over planned sales and costs to evaluate if operation localities could be better and differently managed.
An input parameter for discriminant analysis must be modified for the economic year, which could be typical and maintained for the given locality. It is not proper to use the year for a managerial decision since it is influenced by extraordinary negative circumstances (loss of license, zero sales that can be assumed only for a limited period, extraordinary fixed costs in one given year, other extraordinary circumstances, construction of a new technological link in a given year, etc.) For the decision, it is also not proper to use the year that is influenced by positive realities that we know they appear only extraordinary in the analyzed year or in several years.
This means mainly extra high sales due to the influence of big construction lines in the immediate surroundings of the locality. At the managerial decision, it is necessary to consider the average year, while the locality is not used only for a short-term period of construction, which is not the case of our analyzed localities.
The situation that is found by prediction models must be solved by proper bankruptcy solutions, for example, by liquidation and reorganization. Companies in asset-heavy industries, such as mining, oil and hotel industries), tend to be reorganized (He et al. 2020).
During the prediction, emphasis must be given to the industry, country and term of the prediction (Andrawis et al. 2011). The used indexes can be appropriately combined to discover the probability of proper prediction (Kourentzes et al. 2019).
The presented contribution is limited to prediction in quarries in the mining industry. There is still space for the application of prediction methods in other mining activities from the perspective of different models (Atiya 2020) and different sectors (Bauer and Agarwal 2014; Ho et al. 2013), as well as artificial intelligence, which could increase competition. Moreover, future research can be orientated to a detailed analysis of individual index development, entering prediction models and influencing possible bankruptcy (Kieschnick et al. 2013).
The concept of multivariate normality was overcome in recent applications of statistical multivariate modeling techniques. A copula approach or notion of weak dependence can be utilized instead (Gijbels et al. 2017; Maciak et al. 2020; Pešta and Wendler 2020).

6. Conclusions

According to the differences in the correlation analysis results, we conclude that there is a dependence of the economic results on the annual sale of aggregate in tons. Clearly, this is related to the strongest dependence. At the profitable localities, there was proportional dependence; the higher the volume of the annual sale, the better the economic results. At the unprofitable localities, there was the influence of a big volume of nonqualitative materials from the top of the quarry, supplied to the construction in the area of quarries for loss prices. In case of elimination of such localities from the unprofitable group, this dependence should have an analogical process as in profitable localities. There is also a dependence of the economic results on the period of locality ownership. This dependence is the second strongest. It records the same rate in profitable and unprofitable localities. Period, during which it is possible to influence the management of the quarry, it positively influences the achieved economic results.
To apply the mentioned method properly, it is necessary to simulate operative economic results by variable and fixed costs, mentioned in the contribution with aim-planned measurements that will be included. According to such modified input parameters (which reflect yet planned changes), discriminant analysis is used and the results of the discriminant function are provided in comparison with the optimal limit value to the effectiveness of these measurements in practice. Research questions were confirmed since the results of discriminant analysis were found significant in relation to the bankruptcy probability.
Results of the discriminant analysis could also be used for planned changes in profitable localities. The input parameters and influences of planned measurements are simulated. By this calculation, we achieve the probable impact of these measurements in the practice. Using such a method of classification is proper also during the purchase of new localities for the estimation of locality potential.
The suggested methods for locality classification from the perspective of their future economic results have important contributions for the practice, and they present a significant support tool for the decision-making process. It considers long-term trends that are very important in the area for the business. It means the process of classification based on mathematical methods and discriminant analysis minimizes subjective evaluation and intuition of individuals, which has frequently been used for managerial decisions. The further orientation of the research in the area of model creation for predicting the future development of the company is possible in the application of logistic regression and neuron nets.
Prediction ability of discriminant models is significantly influenced by several factors. It means mainly the choice of independent indexes or discriminants. The choice of discriminants for this contribution has been theoretically supported by the opinion that reasons for the failure of the company, which can lead also to bankruptcy, are damages in the process of capital flow. According to the theoretical model, there were typical reflections of capital shortages in the company in the corresponding financial reports and, consequently, in corresponding rate indexes. Some rate indexes corresponded to the experiences with financial reports of unsuccessful companies excluded from the analysis. This means mostly indexes with values that are illogical from an economical perspective. The choice of proper rate indexes was also empirically supported by the testing of the statistical importance of the differences between medium values of indexes of successful and unsuccessful companies.
It can be concluded that results for the prediction of future development of the company based on discriminant analysis, respect as much as possible the assumptions, enabling correct application of this multivariable statistical method.
The advantage of the model is that it results from the economic environment of the country, and during the estimation of future development of the concrete company, it is possible to determine the values of discriminants from standard financial reports.
Contributions can be viewed as a further attempt to create a model for the estimation of future development of the company based on discriminant analysis. However, it is necessary to regard that any model can reflect economic reality in all contexts. Therefore, it is not possible to view the results of the model application dogmatically.

Author Contributions

Conceptualization, K.C.; methodology, K.C. and A.C.; validation, K.C., A.C., and M.J.; formal analysis, M.J.; investigation, K.C.; resources, M.J.; data curation, K.C. and A.C.; writing—original draft preparation, K.C.; writing—review and editing, M.J.; visualization, M.J.; supervision, A.C.; project administration, K.C. and M.J.; funding acquisition, M.J., and A.C. All authors have read and agreed to the published version of the manuscript.

Funding

This research was funded by VEGA grant number 1/0651/2018 “Research of institutional environment influence to the corporate social responsibility, consumer’s satisfaction and performance of the company” and grant number 1/0515/18 “The decision-making model of process of evaluating raw material policy of regions”.

Conflicts of Interest

The authors declare no conflict of interest.

References

  1. Agarwal, Vineet, and Richard Taffler. 2008. Comparing the performance of market-based and accounting-based bankruptcy prediction models. Journal of Banking and Finance 32: 1541–51. [Google Scholar] [CrossRef] [Green Version]
  2. Altman, Edward I. 1968. Financial ratios, discriminant analysis and prediction of corporate bankruptcy. The Journal of Finance 23: 589–609. [Google Scholar] [CrossRef]
  3. Altman, Edward I. 1981. Application of Classification Techniques in Business, Banking and Finance. Contemporary Studies in Economic and Financial Analysis. Greenwich: JAI Press. [Google Scholar]
  4. Altman, Edward I. 2013. Predicting financial distress of companies: Revisiting the Z-Score and ZETA® models. In Handbook of Research Methods and Applications in Empirical Finance. Edited by Adrian R. Bell, Chris Brooks and Marcel Prokopczuk. Cheltenham: Edward Elgar Publishing, pp. 428–56. [Google Scholar] [CrossRef]
  5. Altman, Edward I., Robert G. Halderman, and Paul Narayanan. 1977. ZETATM Analysis: A new model to identify bankruptcy risk of corporations. Journal of Banking and Finance 1: 29–54. [Google Scholar] [CrossRef]
  6. Altman, Edward I., Malgorzata Iwanicz-Drozdowska, Erkii K. Laitien, and Arto Suvas. 2014. Distressed Firm and Bakruptcy Prediction in an International Context: A Review and Empirical Analysis of Altman’s z Score Model. pp. 1–47. Available online: https://ssrn.com/abstract=2536340 (accessed on 22 November 2019).
  7. Anagnostopoulos, Ioannis, and Anas Rizeq. 2019. Confining value from neural network. A sectoral study prediction of takeover targets in the US technology sectors. Managerial Finance 45: 1433–57. [Google Scholar] [CrossRef]
  8. Andrawis, Robert R., Amir F. Atiya, and Hisham El-Shishiny. 2011. Combination of long term and short-term forecasts, with application to tourism demand forecasting. International Journal of Forecasting 27: 870–86. [Google Scholar] [CrossRef]
  9. Atiya, Amir F. 2001. Bankruptcy prediction for credit risk using neural networks: A survey and new results. IEEE Transactioncs on Neural Network 12: 929–35. [Google Scholar] [CrossRef] [PubMed] [Green Version]
  10. Atiya, Amir F. 2020. Why does forecast combination work so well? International Journal of Forecasting 36: 197–200. [Google Scholar] [CrossRef]
  11. Aziz, Adnan M., and Humayon A. Dar. 2006. Prediction corporate bankruptcy: Where we stand? Corporate Governance 6: 18–33. [Google Scholar] [CrossRef] [Green Version]
  12. Balcaen, Sofie, and Hubert Ooghe. 2006. 35 years of studies on business failure: An overview of the classic statistical methodologies and their related problems. The British Accounting Review 38: 63–93. [Google Scholar] [CrossRef]
  13. Bauer, Julian, and Vineet Agarwal. 2014. Are hazard models superior to traditional bankruptcy prediction approaches? A comprehensive test. Journal of Banking and Finance 40: 432–42. [Google Scholar] [CrossRef]
  14. Beaver, William H. 1966. Financial Ratios as Predictors of Failure. Journal of Accounting Research 4: 71–111. [Google Scholar] [CrossRef]
  15. Bhimani, Alnoor, Mohamed Azzim Gulamhussen, and Samuel Da-Rocha Lopes. 2010. Accounting and no accounting determinants of default: An analysis of privately held firms. Journal of Accounting and Public Policy 29: 571–32. [Google Scholar] [CrossRef]
  16. Bobinaite, Viktorija. 2015. Financial sustainability of wind electricity sectors in the Baltic States. Renewable and Sustainable Energy Reviews 47: 794–815. [Google Scholar] [CrossRef]
  17. Borlea, Sorin N., and Monica V. Achim. 2014. Assessing bankruptcy risk of Romanian metallurgical companies. Metalurgija 53: 279–82. [Google Scholar]
  18. Chava, Sudheer, and Robert A. Jarrow. 2008. Bankruptcy prediction with industry effects. In Financial Derivatives Pricing. Edited by R. A. Jarrow. Singapore: World Scientific Publishing Co., pp. 517–49. [Google Scholar] [CrossRef]
  19. Csikósová, Adriana, Katarína Čulková, and Mária Janošková. 2018. Financial Health of the Company and Bankruptcy Avoiding. Ostrava: VŠB—Technical University of Ostrava. [Google Scholar]
  20. Csikósová, Adriana, Mária Janošková, and Katarína Čulková. 2019. Limitation of Financial Health Prediction in Companies from Post-Communist Countries. Journal of Risk and Financial Management 12: 15. [Google Scholar] [CrossRef] [Green Version]
  21. Eisenbeis, Robert A. 1977. Pitfalls in the Application of Discriminant Analysis in Business, Finance, and Economics. Journal of Finance 32: 875–900. [Google Scholar] [CrossRef]
  22. Fedorova, Elena A., Evgenii V. Gilenko, and Sergey E. Dovzhenko. 2013. Models for bankruptcy forecasting: Case study of Russian Enterprises. Studies on Russian Economic Development 24: 159–64. [Google Scholar] [CrossRef]
  23. Fitzpatrick, Paul J. 1932. A Comparison of Ratios of Successful Industrial Enterprises with Those of Failed Firm. Certified Public Accountant 12: 598–605. [Google Scholar]
  24. Freed, Ned S., and Fred Glover. 1981. Simple but powerful goal programming models for discriminant problems. European Journal of Operational Research 7: 44–60. [Google Scholar] [CrossRef]
  25. Gass, Saul I., and Arjang A. Assad. 2005. An Annotated Timeline of Operations Research. An Informal History. Berlin/Heidelberg: Springer. [Google Scholar]
  26. Geng, Ruibin, Indranil Bose, and Xi Chen. 2015. Prediction of financial distress: An empirical study of listed Chinese companies using data mining. European Journal of Operational Research 241: 236–47. [Google Scholar] [CrossRef]
  27. Gijbels, Irene, Marek Omelka, Michal Pešta, and Noel Veraverbeke. 2017. Score tests for covariate effects in conditional copulas. Journal of Multivariate Analysis 159: 111–33. [Google Scholar] [CrossRef]
  28. Glover, Fr. 1990. In Memory of Darwin Klingman: A Tribute to an Esteemed Colleague and Friend. Interfaces 20: 3–4. [Google Scholar] [CrossRef] [Green Version]
  29. He, Dongwei, Kai Yu, and Jun Wu. 2020. Industry characteristics, court location, and bankruptcy resolution. Journal of Management Analytics 7: 389–423. [Google Scholar] [CrossRef]
  30. Ho, Chun-Yu, Patrick McCarthy, Yi Yang, and Xuan Ye. 2013. Bankruptcy in the pulp and paper industry: Market’s reaction and prediction. Empirical Economics 45: 1205–32. [Google Scholar] [CrossRef]
  31. Kieschnick, Robert, Mark Laplante, and Rabih Moussawi. 2013. Working Capital Management and Shareholders’ Wealth. Review of Finance 17: 1827–52. [Google Scholar] [CrossRef]
  32. Koehler, Gary J., and Selcuk S. Erenguc. 1990. Minimising misclassifications in linear discriminant analysis. Decision Sciences 21: 63–85. [Google Scholar] [CrossRef]
  33. Kourentzes, Nikolaos, Devon Barrow, and Fotios Petropoulos. 2019. Another look at forectas selection and combination: Evidence from forecasting pooling. International Journal of Production Economics 209: 226–35. [Google Scholar] [CrossRef] [Green Version]
  34. Kovacova, Maria, Tomas Kliestik, Katarina Valaskova, Pavol Durana, and Zuzana Juhaszova. 2019. Systematic review of variables applied in bankruptcy prediction models of Visegrad group countries. Oeconomia Copernicana 10: 743–72. [Google Scholar] [CrossRef] [Green Version]
  35. Kristof, Tomas, and Miklos Virag. 2020. A comprehensive review of corporate bankruptcy prediction in Hungary. Journal of Risk and Financial Management 13: 35. [Google Scholar] [CrossRef] [Green Version]
  36. Kwak, Wikil, Susan W. Eldridge, Yyong Shi, and Gang Kou. 2011. Predicting auditor changes using financial distress variables, and the Multiple Criteria Linear Programming (MCLP) and other data mining approaches. Journal of Applied Business Research 27: 73–84. [Google Scholar] [CrossRef] [Green Version]
  37. Lyandres, Evgeny, and Alexei Zhdanov. 2013. Investment opportunities and bankruptcy prediction. Journal of Financial Markets 16: 439–76. [Google Scholar] [CrossRef]
  38. Maciak, Matus, Michal Pešta, and Barbora Peštová. 2020. Change point in dependent and non-stationary panels. Statistical Papers 61: 1385–407. [Google Scholar] [CrossRef]
  39. Meloun, Milan, and Jiri Militký. 2004. Statistical Analysis of Experimental Data (In Czech). Praha: Academia. [Google Scholar]
  40. Mensah, Yaw M. 1984. An examination of the stationarity of multivariate bankruptcy prediction models: A methodological study. Journal of Accounting Research 22: 380–95. [Google Scholar] [CrossRef]
  41. Mihalovič, Matus. 2018. Applicability of scoring models in firms’ default prediction. The case of Slovakia. Political Ekonomie 66: 689–708. [Google Scholar] [CrossRef] [Green Version]
  42. Odom, Marcus D., and Ramesh Sharda. 1990. A Neural network model for bankruptcy prediction. In Proceedings of the IJCNN International Joint Conference on Neural Networks, San Diego, CA, USA, June 17–21; pp. 163–68. [Google Scholar] [CrossRef]
  43. Ohlson, James A. 1980. Financial ratios and the probabilistic prediction of bankruptcy. Journal of Accounting Research 18: 109–31. [Google Scholar] [CrossRef] [Green Version]
  44. Pešta, Michal, and Martin Wendler. 2020. Nuisance-parameter-free change point detection in non-stationary series. TEST 29: 379–408. [Google Scholar] [CrossRef]
  45. Pisula, Tomasz. 2020. An Ensemble Classifier-Based Scoring Model for Prediction Bankruptcy of Polish Companies in the Podkarpackie Voivodeship. Journal of Risk and Financial Management 13: 37. [Google Scholar] [CrossRef] [Green Version]
  46. Shumway, Tyler. 2001. Forecasting bankruptcy more accurately: A simple hazard model. Journal of Business 74: 101–24. [Google Scholar] [CrossRef] [Green Version]
  47. Smith, Raymond F., and Arthur H. Winakor. 1935. Changes in the Financial Structure of Unsuccessful Industrial Corporations. Urbana: University of Illinois. [Google Scholar]
  48. Štefko, Robert, Jarmila Horvathová, and Martina Mokrišová. 2020. Bankruptcy prediction with the use of Data Envelopment Analysis: An empirical study of Slovak Businesses. Journal of Risk and Financial Management 13: 212. [Google Scholar] [CrossRef]
  49. Sun, Jie, Hui Li, Qing-Hua Huang, and Kai-Yu He. 2014. Predicting financial distress and corporate failure: A review from the state-of-the-art definitions, modeling, sampling, and featuring approaches. Knowledge-Based Systems 57: 41–56. [Google Scholar] [CrossRef]
  50. Sun, Jie, Mengjie Zhou, Wenguo Ai, and Hui Li. 2019. Dynamic prediction of relative financial mistress based on imbalanced data stream: From the view of one industry. Risk Management 21: 215–42. [Google Scholar] [CrossRef]
  51. Syamni, Ghazali, M. Shabri Abd Majid, and Widyana Verawaty Siregar. 2018. Bankruptcy prediction models and stock prices of the coal mining industry in Indonesia. Etikonomi 17: 57–68. [Google Scholar] [CrossRef]
  52. Tam, Kar Yan. 1991. Neural network models and prediction of bank bankruptcy. Omega-International Journal of Management Science 9: 429–45. [Google Scholar] [CrossRef]
  53. Zavgren, Christine V. 1983. The prediction of corporate failure: The state of the art. Journal of Accounting Literature 2: 1–37. [Google Scholar]
Table 1. Input table of profitable localities.
LocalityRate of Fix Cost on Total cost (%)Rate of Wages on Total Costs (%)Rate of Stocks Costs on Total Costs (%)Rate of Supply Costs on Total Costs (%)Rate of Fixed Assets Costs on Total Costs (%)Sales on 1 Ton of Aggregate (Eur/ton)Sale of Aggregate (Tons)Variable Costs per 1 Ton (Eur)Los Angeles Test (%)Period of Locality Ownership (Years)
10.410.190.000.250.0610.18217,8413.3212.9017
20.450.200.000.150.025.95175,6172.5519.0017
30.310.060.010.290.027.051,064,6873.4616.1017
40.380.290.000.100.038.2748,8804.0219.4017
50.360.180.000.320.066.2989,7293.4715.6017
60.300.070.000.350.035.441,307,8782.6416.5017
70.470.170.000.260.036.72175,0953.0618.9017
80.430.220.000.190.106.6324,4224.7816.6017
90.400.180.000.130.028.84143,4023.5012.5017
100.360.110.000.230.046.43131,1933.5916.9017
110.400.110.020.080.036.65246,3813.1617.9017
120.410.210.000.020.037.2264,8563.4223.0017
130.370.110.000.140.046.53153,3293.7319.2017
140.460.300.000.010.046.9274,8093.4019.2017
150.450.250.000.020.047.59125,9253.1616.4017
160.410.150.030.090.046.24199,4133.4023.808
170.490.150.010.030.028.07402,4652.5116.604
180.410.250.020.050.036.6392,3023.6417.6012
190.380.100.080.280.016.83336,4323.8318.904
200.370.180.000.080.029.06237,1143.7513.306
210.580.190.010.030.035.55234,9521.6337.006
220.460.110.000.070.038.25371,9132.6413.906
230.350.130.040.290.048.67170,6494.1221.101
240.360.070.050.210.007.071,706,3603.5222.758
250.430.120.200.060.014.61246,0401.8835.0025
260.580.230.100.080.0110.94500,4072.9116.0015
270.550.270.150.130.107.07416,9282.1924.0025
280.580.320.030.020.056.77464,3974.5914.002
290.250.030.000.520.002.32212,3071.9322.0025
300.480.240.030.120.067.2198,5643.7515.0025
310.430.200.000.210.025.841,969,7772.1515.0015
320.450.260.010.300.024.96669,4011.9620.0025
330.570.110.000.070.028.631,335,7553.9420.0015
340.750.050.000.080.007.083,269,6961.5718.0025
350.400.100.020.100.026.38927,2273.5918.009
Table 2. Input table for unprofitable localities.
LocalityRate of Fix Cost on Total Cost (%)Rate of Wages on Total Costs (%)Rate of Stocks Costs on Total Costs (%)Rate of Supply Costs on Total Costs (%)Rate of Fixed Assets Costs on Total Costs (%)Sales on 1 Ton of Aggregate (Eur per ton)Sale of Aggregate (Tons)Variable Costs per 1 Ton (Eur)Los Angeles Test (%)Period of Locality Ownership (Years)
360.430.150.070.040.003.81293,1123.4218.901
370.250.180.040.240.002.4586,0745.7919.201
380.460.170.030.270.098.1584,0533.6929.408
390.400.190.010.110.026.3452,9463.3216.7017
400.410.270.000.010.067.0871,2264.2319.3017
410.630.100.000.020.069.24162,1293.279.204
420.530.140.000.060.036.4249,5393.677.804
430.300.110.070.370.006.10116,1294.7616.101
440.430.330.080.040.001.98157,0433.64100.001
450.600.160.000.130.002.5354,2146.78100.001
460.800.070.280.090.176.5917,3221.8619.301
470.660.340.270.040.084.51216,1071.1824.201
480.470.210.140.390.123.3292,2732.19100.001
490.340.150.100.250.027.00139,7414.6524.301
500.240.040.080.590.057.25152,9055.7715.701
510.350.040.000.430.175.1132,5763.6413.801
520.640.150.200.060.109.3174,4464.0326.702
530.740.010.000.040.552.555,7914.9013.903
540.320.120.000.210.044.4560,4823.050.006
550.490.130.140.040.043.60439,1992.0155.006
560.500.220.060.050.035.82433,8762.6632.502
570.590.190.050.120.096.54207,5163.1020.002
580.650.160.160.030.037.11177,7232.61100.002
590.540.150.120.140.013.55121,2403.0325.005
600.600.200.030.010.0412.0577,2502.8228.005
610.450.390.050.130.027.93152,5174.0524.003
620.260.080.130.650.006.2868,1754.67100.003
630.650.370.270.030.086.06567,8972.1320.002
640.540.270.150.180.028.31180,9172.9420.0025
650.460.100.100.180.037.48166,1843.8216.009
660.570.130.200,150.013.5678,3332.8030.003
670.380.060.080.420.035.45105,3033.3120.003
680.530.110.050.100.015.81275,7463.4725.004
690.120.030.000.010.004.22192,8072.2224.503
700.850.320.100.020.075.2821,3931.25100.004
Table 3. Average values of indexes.
Average Values of IndexesProfitable LocalitiesUnprofitable Localities
Rate of fixed costs on total costs 0.4360.491
Rate of wages on total costs 0.1690.167
Rate of stocks costs on total costs 0.0240.087
Rate of supply costs on total costs 0.1530.161
Rate of fixed assets costs on total costs 0.0320.059
Sales per 1 ton of aggregate (€/1 t)6.9975.807
Sale of aggregate (thousand tons)511.604148.119
Variable costs per 1 ton of aggregate (€/1 t)3.1653.449
Los Angeles test (%)18.91637.557
Period of locality ownership (years)14.7434.371
Table 4. Correlation coefficient for profitable and unprofitable localities.
Correlation of Economic ResultCorrelation Coefficient for Profitable LocalitiesCorrelation Coefficient for Unprofitable Localities
Rate of fixed costs on total costs 0.0985−0.1001
Rate of wages on total costs wages on total costs −0.0097−0.1241
Rate of stocks costs on total costs −0.1976−0.0061
Rate of supply costs on total costs −0.03880.2075
Rate of fixed assets costs on total costs −0.10920.1793
Sales per 1 ton of aggregate (€/1 t)0.20510.2267
Sale of aggregate (thousand tons)0.7483−0.3368
Variable costs per 1 ton of aggregate (€/1 t)−0.1381−0.1614
Los Angeles test (%)−0.18810.0215
Period of locality ownership (years)0.29700.3538
Table 5. Results of discriminant analysis application.
Results of Discriminant Analysis Application
Variable (Discriminant)Coefficient of Discrimination Function
Rate of fixed costs on total costsa1 = −5.213
Rate of wages on total costsa2 = 2.850
Rate of stocks costs on total costsa 3 = −13.648
Rate of supply costs on total costsa4 = −1.688
Rate of fixed assets costs on total costsa5 = 0.711
Sales per 1 ton of aggregate (€/1 t)a6 = 0.312
Sale of aggregate (thousand tons)a7 = 0.002
Variable costs per 1 ton of aggregate (€/1 t)a8 = −0.378
Los Angeles test (%)a9 = −0.016
Period of locality ownership (years)a10 = 0.236
Optimal Limit ValueC = 0.133726

