Do Diamond Stocks Shine Brighter than Diamonds?


Abstract
:1. Introduction
2. Some Recent Research
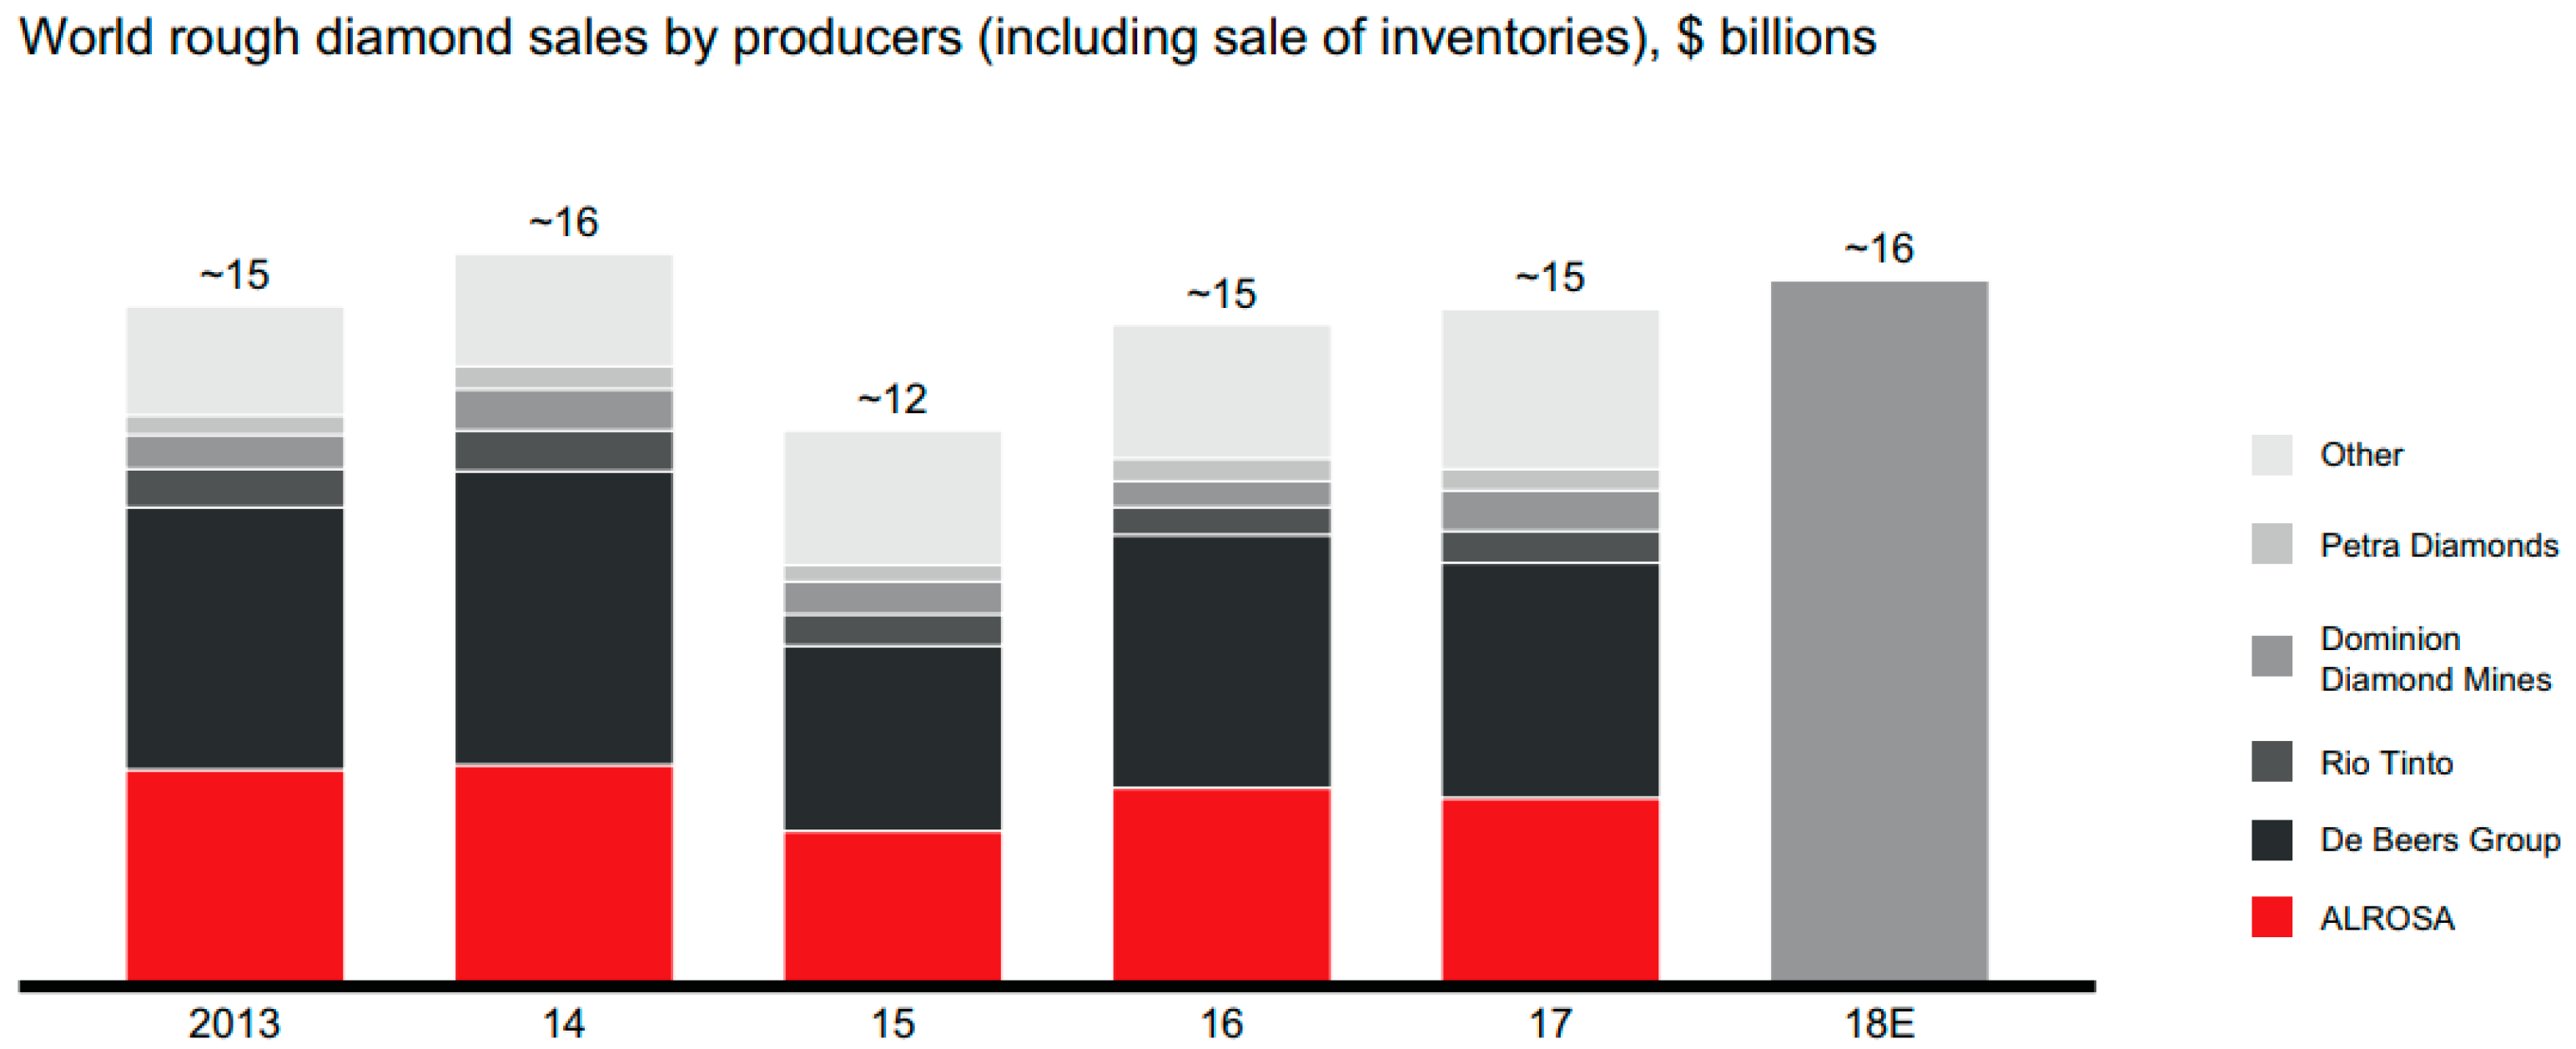
3. The Market of Diamond Mining Stocks
4. Methodology
5. Data
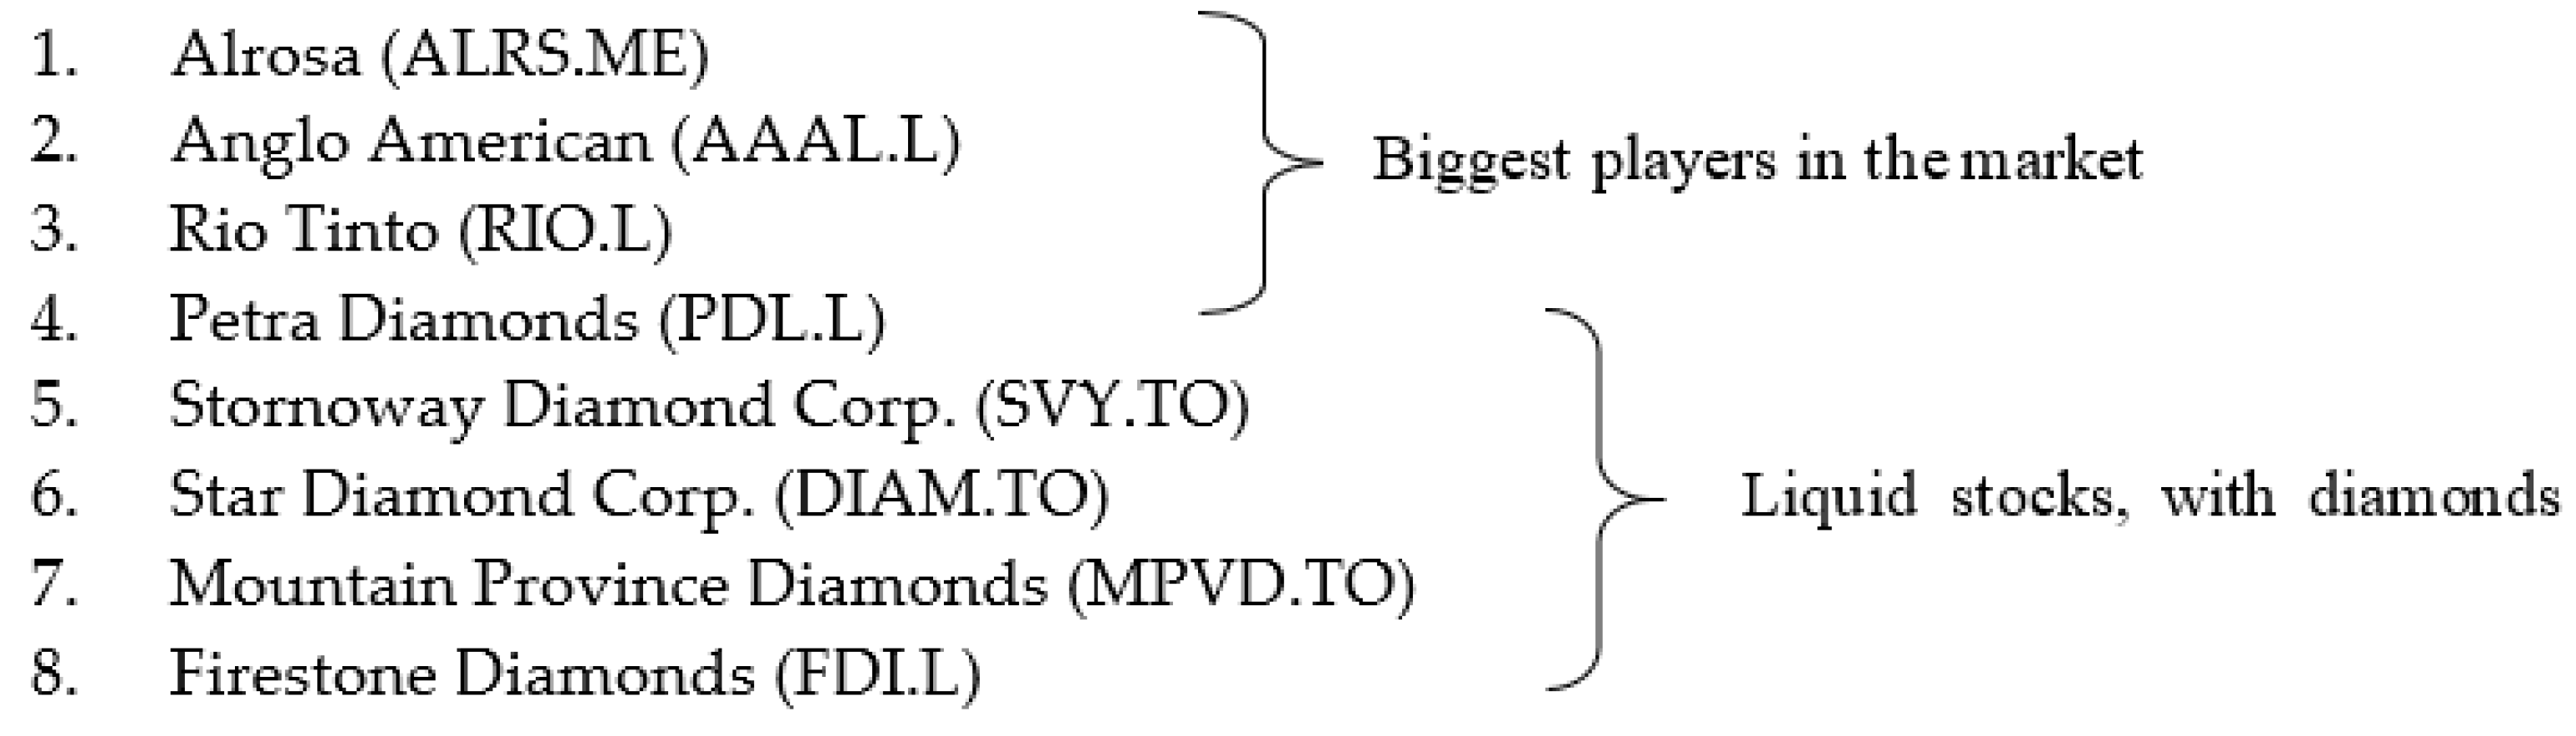
- All companies are involved in the process of diamond exploration and mining;
- All companies are publicly traded on one or more Stock exchanges.
- Diamonds as the main activity: The company is involved exclusively in diamond mining activities;
- Liquidity: The average traded volume of the equity is at least 100,000;
- Time series length: The company has been listed on an Exchange since 6 April 2007.
6. The Diamond Stock Market
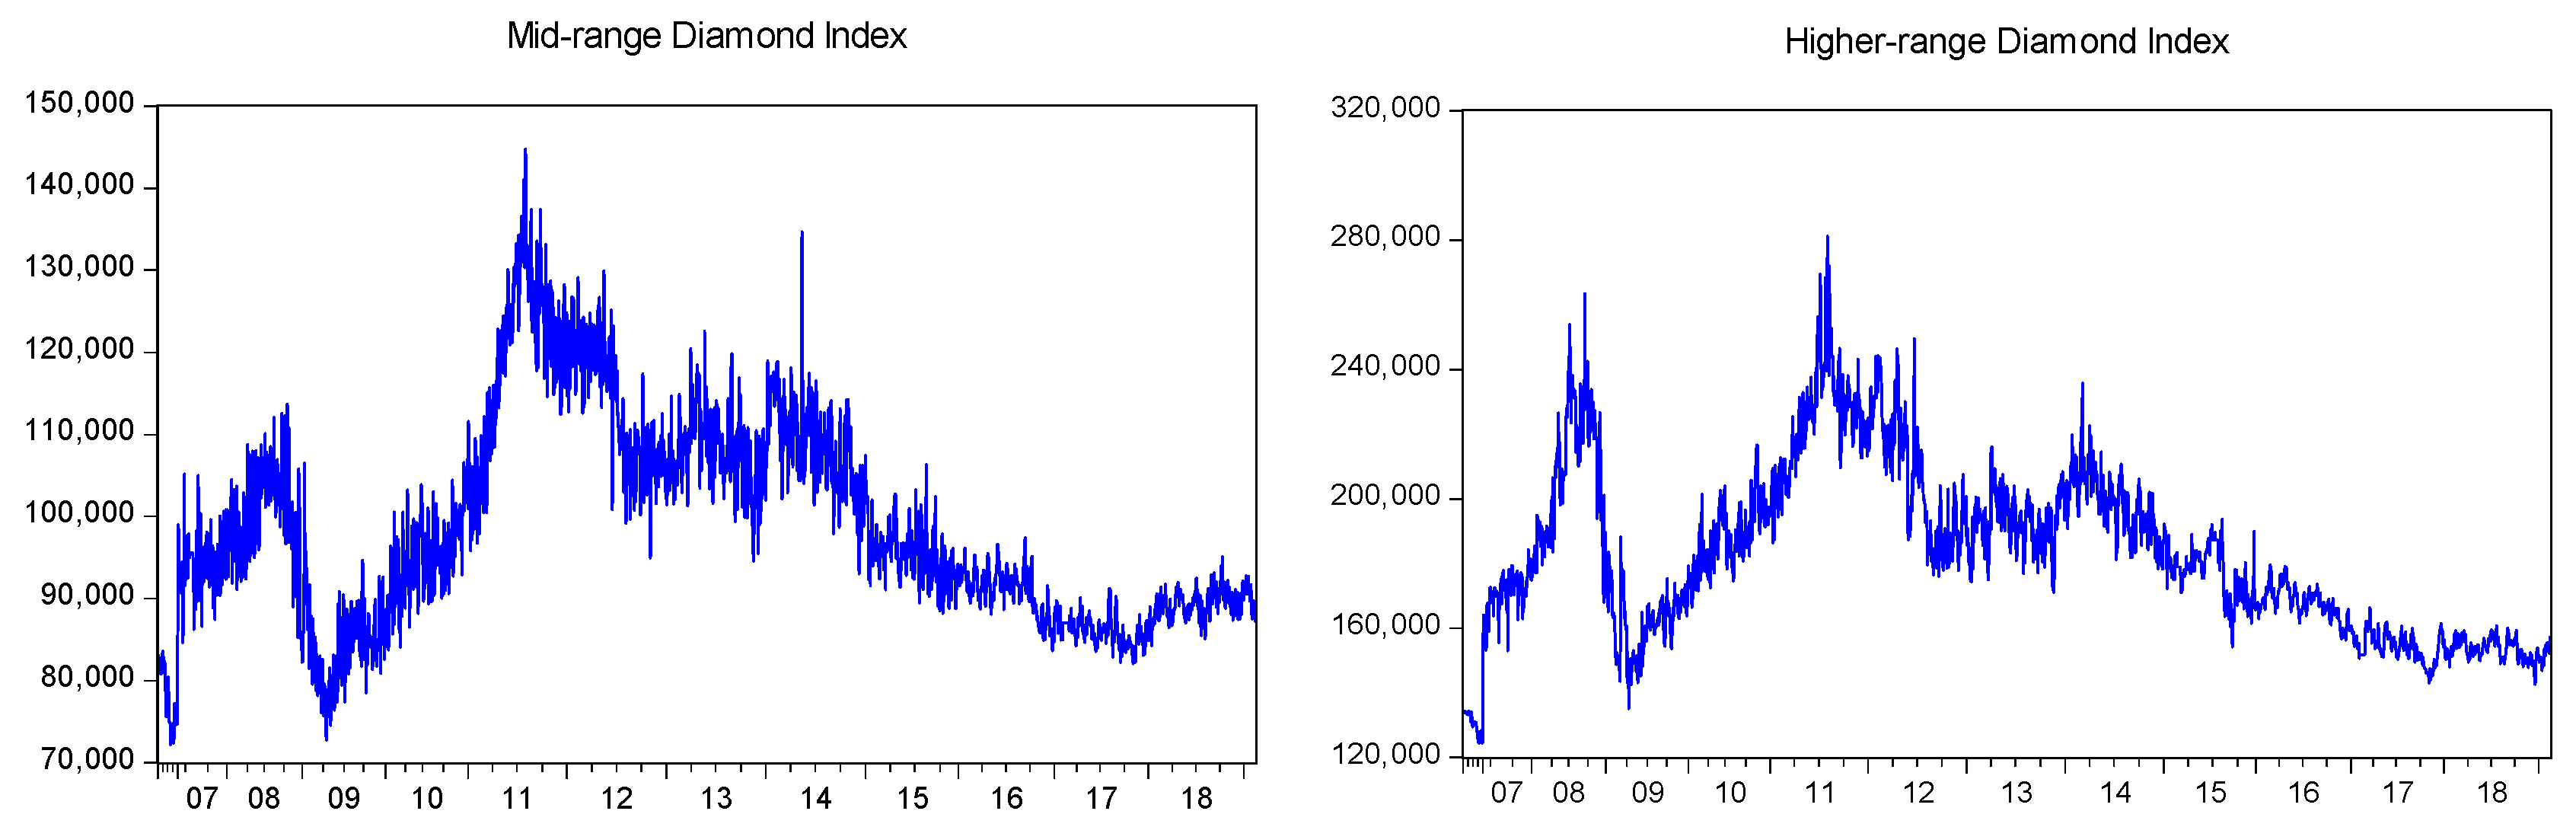
Diamond Stocks vs. Diamond Prices
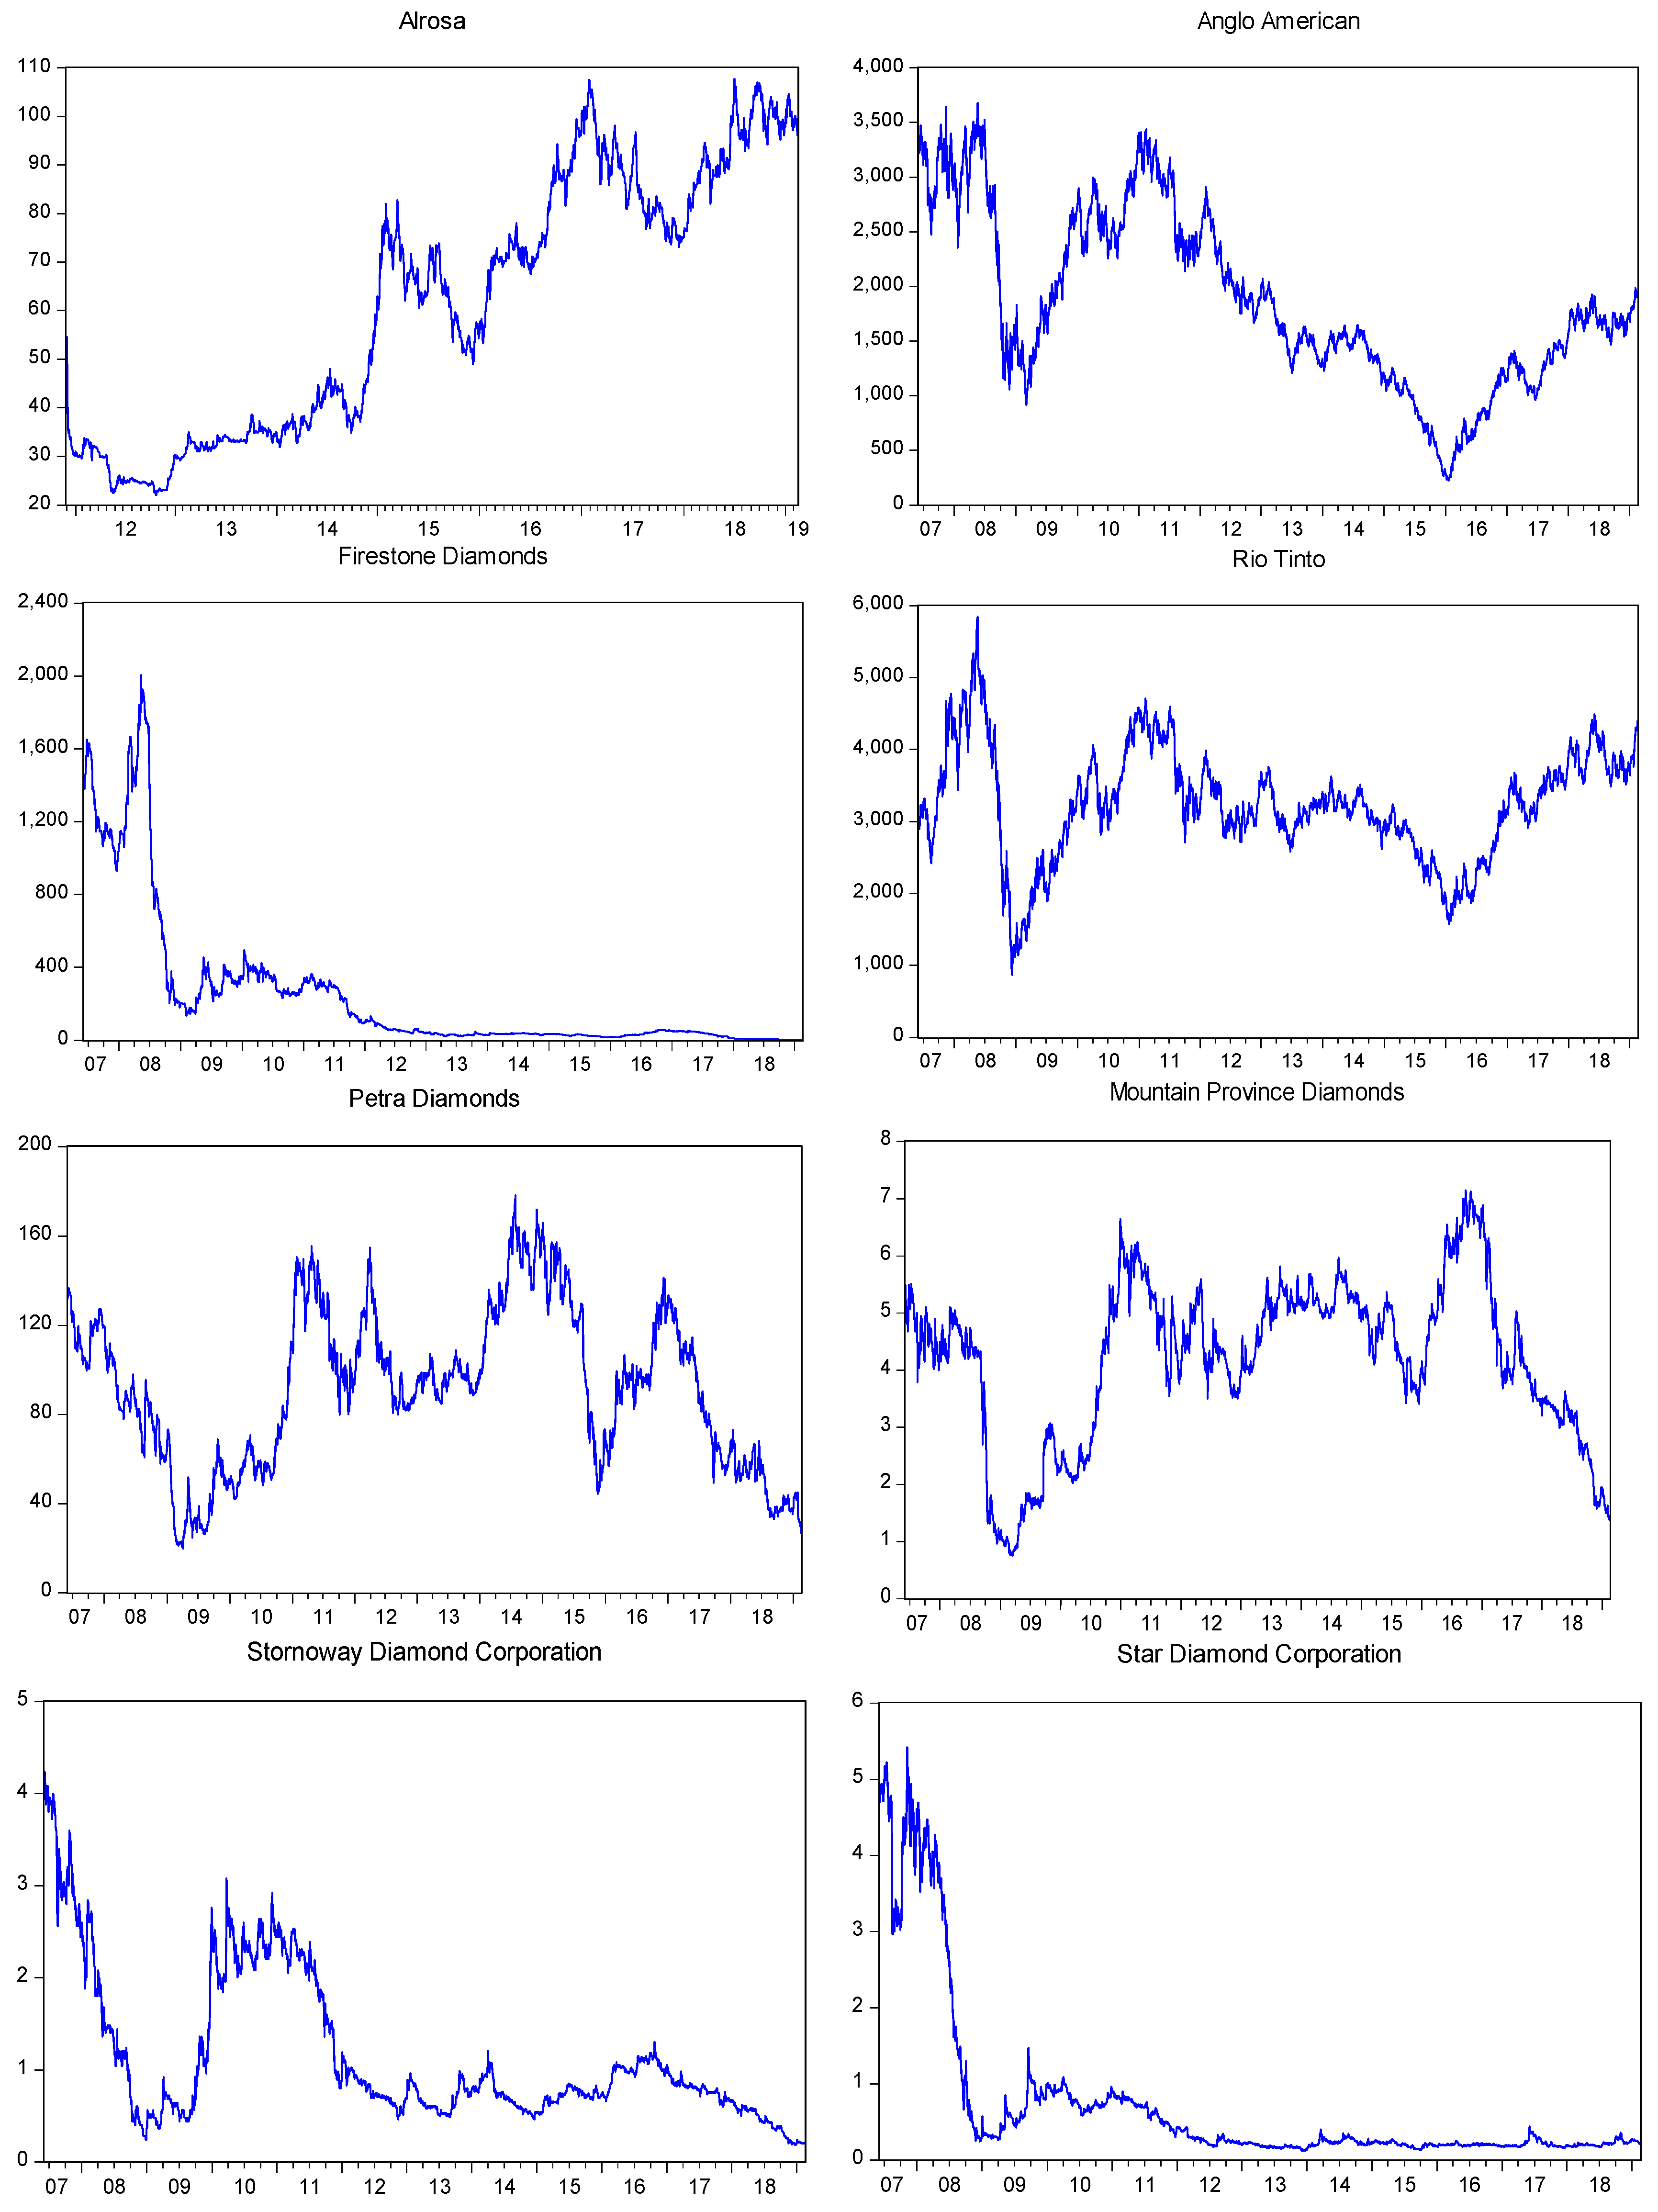
- —measures the daily return of stock at time ;
- —measures the daily return of regional market stock index at time ;
- —measures the daily return of diamond index at time ;
- MICEX, Russian Stock Index;
- The S&P/Toronto Stock Exchange 60;
- FTSE 100 Index, corresponding to London Stock Exchange.
7. Concluding Remarks
Author Contributions
Funding
Conflicts of Interest
References
- Adler, Claire. 2010. Martin Rapaport: The Time Has Come for a Mass Market in Sparklers. Financial Times. Available online: https://www.ft.com/content/e72e5078-3155-11df-9741-00144feabdc0 (accessed on 26 February 2014).
- Ariovich, G. 1985. The economics of diamond price movements. MDE Managerial and Decision Economics 6: 234–40. [Google Scholar] [CrossRef]
- Auer, Benjamin R., and Frank Schuhmacher. 2013. Diamonds—A precious new asset? International Review of Financial Analysis 28: 182–89. [Google Scholar] [CrossRef]
- Auer, Benjamin R. 2014. Could diamonds become an investor’s best friend? Review of Managerial Science 8: 351–83. [Google Scholar] [CrossRef]
- Bai, Jushan, and Pierre Perron. 1998. Estimating and testing linear models with multiple structural changes. Econometrica 66: 47–78. [Google Scholar] [CrossRef]
- Bai, Jushan, and Pierre Perron. 2003. Computation and analysis of multiple structural change models. Journal of Applied Econometrics 18: 1–22. [Google Scholar] [CrossRef]
- Bain and Company, and Antwerp World Diamond Center. 2011. The Global Diamond Industry: Lifting the Veil of Mystery. Antwerp: Bain & Company and Antwerp World Diamond Center Private Foundation. [Google Scholar]
- Bain and Company, and Antwerp World Diamond Center. 2012. The Global Diamond Industry: Portrait of Growth. Antwerp: Bain & Company and Antwerp World Diamond Center Private Foundation. [Google Scholar]
- Bain and Company, and Antwerp World Diamond Center. 2013. The Global Diamond Report 2013. Journey through the Value Chain. Antwerp: Bain & Company and Antwerp World Diamond Center Private Foundation. [Google Scholar]
- Bain and Company, and Antwerp World Diamond Center. 2018. The Global Diamond Industry 2018: A Resilient Industry Shines through. Antwerp: Bain & Company and Antwerp World Diamond Center Private Foundation. [Google Scholar]
- Cameron, Jackie. 2014. Investors Talk up Diamond Mining Stocks. Happily-Ever-After Shares? BizNews. Available online: http://www.biznews.com/global-investing/2014/08/30/investors-talk-up-diamond-mining-stocks-happily-ever-shares/ (accessed on 7 January 2016).
- Cardoso, Margarida, and Luis Chambel. 2005. A valuation model for cut diamonds. International Transactions in Operational Research 12: 417–36. [Google Scholar] [CrossRef]
- Carlin, Sven. 2017. Two Diamond Stocks to Watch in Upcoming Diamond Supply Gap. Available online: https://seekingalpha.com/article/4112406-two-diamond-stocks-watch-upcoming-diamond-supply-gap (accessed on 15 February 2019).
- Chesters, Laura. 2014. Are Diamonds Your New Best Friend? London Evening Standard. Available online: http://www.standard.co.uk/business/business-news/are-diamonds-your-new-best-friend-9168739.html (accessed on 22 November 2014).
- D’Ecclesia, Rita Laura, and Vera Jotanovic. 2018. Are Diamonds a safe haven? Review of Managerial Science 12: 937–68. [Google Scholar] [CrossRef]
- Dimson, Elroy. 1979. Risk measurement when shares are subject to infrequent trading. Journal of Financial Economics 7: 197–226. [Google Scholar] [CrossRef]
- Engle, Robert. 1982. Autoregressive conditional heteroscedasticity with estimates of the variance of United Kingdom inflation. Econometrica 50: 987–1007. [Google Scholar] [CrossRef]
- Engle, Robert. 2002. Dynamic conditional correlation—A simple class of multivariate GARCH models. Journal of Business & Economic Statistics 20: 339–50. [Google Scholar] [CrossRef]
- Even-Zohar, Chaim. 2012. Diamond Prices Could Fall in 2012 as Supply, Demand in Balance—Tacy Ltd. FORBES. Available online: http://forbes.com/sites/kitconews/2012/03/06/diamond-prices-could-fall-in-2012-as-supply-demand-in-balance-tacy-ltd/#522994d82db8 (accessed on 22 February 2014).
- Fowler, David J., and C. Harvey Rorke. 1983. Risk Measurement When Shares Are Subject to Infrequent Trading: Comment. Journal of Financial Economics 12: 279–83. [Google Scholar] [CrossRef]
- Golan, E. 2012. The diamond investment promise: Are diamonds finally a commodity? Idex Magazine 275: 87–95. [Google Scholar]
- Golan, E. 2013. Diamond prices and the forces that shape them. Idex Magazine 268: 90–117. [Google Scholar]
- Gupta, Samir, Michael Polonsky, Arch Woodside, and Cynthia M. Webster. 2010. An impact of external forces on cartel network dynamics: Direct research in the diamond industry. Industrial Marketing Management 39: 202–10. [Google Scholar] [CrossRef]
- Jorion, Philippe. 1990. The exchange rate exposure of U.S. multinationals. Journal of Business 63: 331–45. [Google Scholar] [CrossRef]
- Karo, Margherita. 1968. The U.S. jewelry industry. Financial Analysts Journal 24: 49–56. [Google Scholar] [CrossRef]
- Kempton, Daniel R. 1995. Russian and De Beers: Diamond conflict or cartel? South African Journal of International Affairs 3: 94–131. [Google Scholar] [CrossRef]
- Lee, Junsoo, and Mark C. Strazicich. 2003. Minimum Lagrange Multiplier Unit Root Test with Two Structural Breaks. Review of Economics and Statistics 85: 1082–89. [Google Scholar] [CrossRef]
- Levenstein, Margaret C., and Valerie Y. Suslow. 2006. What determines cartel success? Journal of Economic Literature 44: 43–95. [Google Scholar] [CrossRef]
- Low, Rand Kwong Yew, Yiran Yao, and Robert Faff. 2016. Diamonds vs. precious metals: What shines brightest in your investment portfolio? International Review of Financial Analysis 43: 1–14. [Google Scholar] [CrossRef]
- Lu, Chenxi, Terence Tai-Leung Chong, and Wing Hong Chan. 2010. Long Memory in Diamond Market Returns and Volatility, Economic Research Paper 2010-2. Laurier Centre for Economic Research and Policy Analysis. The Chinese University of Hong Kong.
- Mcgee, S. 2013. Diamonds: A Better Safe Haven than Gold? The Fiscal Times. Available online: http://thefiscaltimes.com/Columns/2013/05/14/Diamonds-A-Better-Safe-Haven-Than-Gold (accessed on 25 February 2014).
- McKeough, Pat. 2015. What Is One of the Most Promising Canadian Diamond Stocks? TSI Wealth Daily Advice. Available online: http://www.tsinetwork.ca/daily-advice/mining-stocks/promising-canadian-diamond-stocks/ (accessed on 7 January 2016).
- Nelson, Daniel B. 1991. Conditional heteroskedasticity in asset returns: A new approach. Econometrica 59: 347–70. [Google Scholar] [CrossRef]
- O’Keefe, Matthew, and Erik Bermel. 2014. Why This Is an Opportune Time to Buy Canadian Diamond Stocks. The Globe and Mail. Research Report. Available online: http://www.theglobeandmail.com/globe-investor/investment-ideas/research-reports/why-canadian-forestry-stocks-are-a-buy-right-now/article18913942/ (accessed on 12 February 2015).
- Rapaport, Martin. 2009. Diamonds May Become as Attractive for Investors as Gold. Rough and Polished. Available online: http://rough-polished.com/en/exclusive/26124.html (accessed on 25 February 2013).
- Renneboog, Luc, and Christophe Spaenjers. 2012. Hard assets: The returns on rare diamonds and gems. Finance Research Letters 9: 220–30. [Google Scholar] [CrossRef]
- Scott, Frank, and Aaron Yelowitz. 2010. Pricing anomalies in the market for diamonds: Evidence of conformist behavior. Economic Inquiry 48: 353–68. [Google Scholar] [CrossRef]
- Shevelyova, I. 2006. The world diamond market: Logic of the organization and functioning. Economics and Management 2: 79–85. [Google Scholar]
- Sizemore, Charles Lewis. 2015. 5 Cheap “Diamond in the Rough” Stocks to Buy. Available online: https://www.kiplinger.com/slideshow/investing/T052-S001-5-cheap-diamond-in-the-rough-stocks-to-buy/index.html (accessed on 3 March 2019).
- Spar, Debora L. 2006. Markets: Continuity and change in the international diamond market. Journal of Economic Perspectives 20: 195–208. [Google Scholar] [CrossRef]
- Steinberg, Julie. 2012. Investing in Diamonds: The Clear-Cut Truth. The Wall Street Journal. Available online: http://blogs.wsj.com/totalreturn/2012/10/24/investing-in-diamonds-the-clear-cut-truth/ (accessed on 3 March 2014).
- Treadgold, Tim. 2013. Diamonds Could Soon be an Investor’s Best Friend as Demand Rises and Supply Falls. Forbes. Available online: http://forbes.com/sites/timtreadgold/2013/10/24/diamonds-could-soon-be-an-investors-best-friend-as-demand-rises-and-supply-falls/ (accessed on 26 February 2014).
- Tufano, Peter. 1998. The determinants of stock price exposure: Financial engineering and the gold mining industry. The Journal of Finance 53: 1015–52. [Google Scholar] [CrossRef]
- Turrell, Rob. 1982. Rhodes, De Beers and monopoly. The Journal of Imperial and Commonwealth History 10: 311–43. [Google Scholar] [CrossRef]
- Vaillant, Nicolas G., and François-Charles Wolff. 2013. Understanding Diamond Pricing Using Unconditional Quantile Regressions. HAL Working Papers. IDEAS halshs-00853384. Available online: https://econpapers.repec.org/paper/halwpaper/halshs-00853384.htm (accessed on 3 March 2015).
- Wieczner, Jen. 2014. For Investors, Diamonds Might Be the New Gold. Fortune. Available online: http://fortune.com/2014/02/19/for-investors-diamonds-might-be-the-new-gold (accessed on 2 March 2015).
- Zimnisky, Paul. 2013. Diamonds: Driven by Market Forces for the First Time in 100 Years. Hard Assets. Available online: http://resourceinvestor.com/2013/04/09/diamonds-driven-market-forces-first-time-100-years (accessed on 15 October 2013).
| 1 | Reserves are a part of resources whose extraction is economically justifiable, based on feasibility studies. |
| 2 | The stationarity of log returns has been tested and confirmed and the results can be obtained upon request. |
| 3 | Results can be obtained upon request. |
| 4 | The remaining correlation series have not been reported, as they do not differ significantly from those reported in Figure 8. All results are available upon request. |


| No | Company | Ticker | Exchange | Currency | IPO (mm/dd/yy) | Av. Volume |
|---|---|---|---|---|---|---|
| 1. | Alrosa * | ALRS.ME | MICEX | RUB | 11/29/11 | 8,468,875 |
| 2. | Anglo American | AAAL.L | LSE | GBP | 05/24/99 | 4,551,716 |
| 3. | Rio Tinto | RIO.L | LSE | GBP | 01/07/88 | 4,149,613 |
| 4. | BlueRock Diamonds * | BRD.L | LSE | GBP | 04/09/13 | 4,021,770 |
| 5. | Petra Diamonds * | PDL.L | LSE | GBP | 04/01/00 | 1,963,700 |
| 6. | Botswana Diamonds * | BOD.L | LSE | GBP | 02/02/11 | 826,091 |
| 7. | Lucara Diamond Corp. * | LUC.TO | TSX | CAD | 08/14/07 | 408,936 |
| 8. | Stornoway Diamond Corp. * | SVY.TO | TSX | CAD | 08/08/96 | 349,232 |
| 9. | Star Diamond Corp. * | DIAM.TO | TSX | CAD | 02/10/87 | 202,216 |
| 10. | Newfield Resources Ltd. * | NWF.AX | ASX | AUD | 01/05/11 | 173,439 |
| 11. | Mountain Province Diamonds * | MPVD.TO | TSX | CAD | 01/05/96 | 158,342 |
| 12. | Firestone Diamonds * | FDI.L | LSE | GBP | 08/14/98 | 109,490 |
| 13. | GEM Diamonds * | GEMD.L | LSE | GBP | 02/14/07 | 84,299 |
| 14. | North Arrow Minerals Inc. * | NAR.V | TSXV | CAD | 10/25/07 | 41,904 |
| 15. | Pangolin Diamonds Corp. * | PAN.V | TSXV | CAD | 08/20/14 | 37,185 |
| 16. | Diamcor Mining * | DMI.V | TSXV | CAD | 08/08/96 | 26,621 |
| 17. | Trans Hex Group Ltd. * | TSX.JO | JSE | ZAR | 01/08/90 | 12,312 |
| 18. | Tsodilo Resources Ltd. | TSD.V | TSXV | CAD | 10/25/07 | 11,440 |
| 19. | Diamond Fields Resources Inc. | DFIFF | TSXV | CAD | 01/14/99 | 611 |
| 20. | Archon Minerals Ltd. * | ACS.V | TSXV | CAD | 08/16/12 | 122 |
| 21. | Alrosa Nurba * | ALNU.ME | MICEX | RUB | 08/12/11 | 60 |
| Company | Market Value (Millions in USD) | Market to Book Ratio Price/Book | Growth Rate of Sales (%) | Growth Rate of Assets (%) |
|---|---|---|---|---|
| Alrosa | 10,686.00 | 2.70 | 8.80 | −3.90 |
| Anglo American | 34,144.00 | 1.40 | 5.21 | −4.30 |
| Rio Tinto | 97,896.00 | 2.18 | 1.20 | −5.00 |
| Petra Diamonds | 211.00 | 0.40 | 25.50 | −3.50 |
| Stornoway D. C. | 120.00 | 0.29 | 0.60 | −4.20 |
| Star D. C. | 77.00 | 1.44 | no revenues * | −0.03 |
| Mountain P. D. | 194.00 | 0.51 | 82.80 | 9.50 |
| Firestone D. | 17.00 | 0.20 | 1.24 | −2.20 |
| Company | Mean | Min | Max | Prc. 5% | Prc. 95% | |
|---|---|---|---|---|---|---|
| Diamond Stock Prices | ||||||
| Alrosa | Level | 60.48 | 22.00 | 107.70 | 24.66 | 100.52 |
| Return | 0.00 | −0.21 | 0.34 | −0.03 | 0.03 | |
| Anglo American | Level | 1807.40 | 221.10 | 3680.00 | 643.09 | 3227.45 |
| Return | 0.00 | −0.24 | 0.21 | −0.05 | 0.05 | |
| Rio Tinto | Level | 3198.80 | 818.70 | 5847.20 | 1762.20 | 4419.01 |
| Return | 0.00 | −0.46 | 0.20 | −0.04 | 0.04 | |
| Petra Diamonds | Level | 91.68 | 11.53 | 178.32 | 31.77 | 150.69 |
| Return | 0.00 | −0.23 | 0.29 | −0.05 | 0.05 | |
| Stornoway D. C | Level | 1.13 | 0.18 | 4.32 | 0.39 | 2.68 |
| Return | 0.00 | −0.22 | 0.19 | −0.05 | 0.05 | |
| Star D. C. | Level | 0.67 | 0.12 | 5.42 | 0.17 | 3.90 |
| Return | 0.00 | −0.31 | 0.43 | −0.06 | 0.06 | |
| Mountain P. D. | Level | 4.19 | 0.68 | 7.15 | 1.35 | 6.25 |
| Return | 0.00 | −0.33 | 0.35 | −0.04 | 0.05 | |
| Firestone D. | Level | 226.03 | 2.63 | 2005.00 | 5.34 | 1175.00 |
| Return | 0.00 | −0.54 | 0.32 | −0.06 | 0.05 | |
| Diamond Price Indices | ||||||
| MDI | Level | 98,910.00 | 72,206.00 | 14,4760.00 | 83,136.00 | 122,710.00 |
| Return | 0.00 | −0.17 | 0.22 | −0.06 | 0.06 | |
| HDI | Level | 18,3023.00 | 124,472.00 | 281,240.00 | 149,519.00 | 231,381.00 |
| Return | 0.00 | −0.15 | 0.19 | −0.04 | 0.04 | |
| Diamond Stock Prices | |||||||
| Alrosa | 0.09 | 1.14 | 0.00 | −0.80 | *** 0.01 | 3.51 | I(1) |
| Anglo American | 7.59 | 1.43 | 0.00 | −2.00 | 0.00 | −0.66 | I(1) |
| Rio Tinto | 16.98 | 2.37 | −0.01 | −2.69 | 0.00 | 0.23 | I(1) |
| Petra Diamonds | 0.25 | 1.53 | 0.00 | −2.02 | 0.00 | −0.22 | I(1) |
| Stornoway D. C. | 0.01 | 2.09 | * −0.01 | −3.15 | 0.00 | −1.18 | I(1) |
| Star D. C. | 0.00 | 0.88 | * 0.00 | −3.27 | 0.00 | −0.57 | I(1) |
| Mountain P. D. | 0.01 | 1.42 | 0.00 | −1.73 | 0.00 | −0.11 | I(1) |
| Firestone D. | 1.18 | 1.35 | −0.01 | −2.55 | 0.00 | −1.19 | I(1) |
| Diamond Price Indices | |||||||
| Mid-range D. I. | 1238.05 | 2.33 | −0.01 | −2.15 | −0.11 | −1.54 | I(1) |
| Higher-range D. I. | *** 2903.46 | 3.40 | −0/01 | −3.19 | −0.32 | −2.58 | I(1) |
| Series | No. | F-Stat. | 1st Break (mm/dd/yy) | 2nd Break (mm/dd/yy) | 3rd Break (mm/dd/yy) | 4th Break (mm/dd/yy) | 5th Break (mm/dd/yy) |
|---|---|---|---|---|---|---|---|
| Diamond stock prices | |||||||
| Alrosa | 4 | 36.54 | 09/18/2013 | 12/15/2014 | 01/19/2015 | 09/05/2016 | - |
| Anglo American | 4 | 92.56 | 11/13/2009 | 05/14/2012 | 12/11/2014 | 11/22/2016 | - |
| Rio Tinto | 4 | 35.52 | 08/03/2010 | 05/04/2012 | 06/15/2015 | 12/05/2016 | - |
| Petra Diamonds | 5 | 91.80 | 03/03/2009 | 12/02/2010 | 11/11/2013 | 08/14/2015 | 05/18/2017 |
| Stornoway D. C. | 4 | 31.56 | 12/21/2009 | 10/20/2011 | 08/17/2015 | 05/17/2017 | - |
| Star D. C. | 2 | 283.43 | 03/05/2009 | 11/17/2011 | - | - | - |
| Mountain P. D. | 3 | 24.65 | 09/02/2010 | 05/13/2013 | 04/27/2017 | - | - |
| Firestone D. | 4 | 134.49 | 03/03/2009 | 09/19/2011 | 06/26/2013 | 05/18/2017 | - |
| Diamond price indices | |||||||
| Mid-range D. I. | 4 | 220.38 | 12/15/2010 | 08/13/2012 | 12/03/2014 | 10/12/2016 | - |
| Higher-range D.I. | 4 | 134.82 | 11/03/2010 | 07/09/2012 | 08/10/2015 | 05/30/2017 | |
| F-Stat. | Prob. (F-Stat.) | ARCH Effect | |||
|---|---|---|---|---|---|
| Diamond Stock Prices | |||||
| Alrosa | *** 70.28 | 0.00 | *** 67.56 | 0.00 | YES |
| Anglo American | *** 112.74 | 0.00 | *** 108.32 | 0.00 | YES |
| Rio Tinto | *** 45.79 | 0.00 | *** 45.06 | 0.00 | YES |
| Petra Diamonds | *** 3.01 | 0.01 | *** 17.93 | 0.01 | YES |
| Stornoway D. C. | *** 72.24 | 0.00 | *** 70.36 | 0.00 | YES |
| Star D. C. | *** 130.26 | 0.00 | *** 124.21 | 0.00 | YES |
| Mountain P. D. | *** 87.80 | 0.00 | *** 85.03 | 0.00 | YES |
| Firestone D. | *** 31.67 | 0.00 | *** 31.33 | 0.00 | YES |
| Diamond Price Indices | |||||
| Mid-range D. I. | *** 74.37 | 0.00 | *** 80.86 | 0.00 | YES |
| Higher-range D. I. | *** 40.07 | 0/00 | *** 39.28 | 0.00 | YES |
| Model | |||||
|---|---|---|---|---|---|
| Diamond Stock Prices | |||||
| Alrosa | E-GARCH (1,1) | *** −1.29 | *** 0.31 | *** 0.66 | *** −0.06 |
| (−11.26) | (11.44) | (66.43) | (3.52) | ||
| Anglo American | E-GARCH (1,1) | *** −0.11 | *** 0.09 | *** 0.90 | *** −0.05 |
| (−7.51) | (9.05) | (665.09) | (−7.60) | ||
| Rio Tinto | E-GARCH (1,1) | *** −0.14 | *** 0.11 | *** 0.86 | *** −0.06 |
| (−7.67) | (10.13) | (645.24) | (−8.15) | ||
| Petra Diamonds | E-GARCH (1,1) | *** −0.17 | *** 0.12 | *** 0.78 | *** −0.03 |
| (−7.89) | (10.39) | (406.73) | (−4.76) | ||
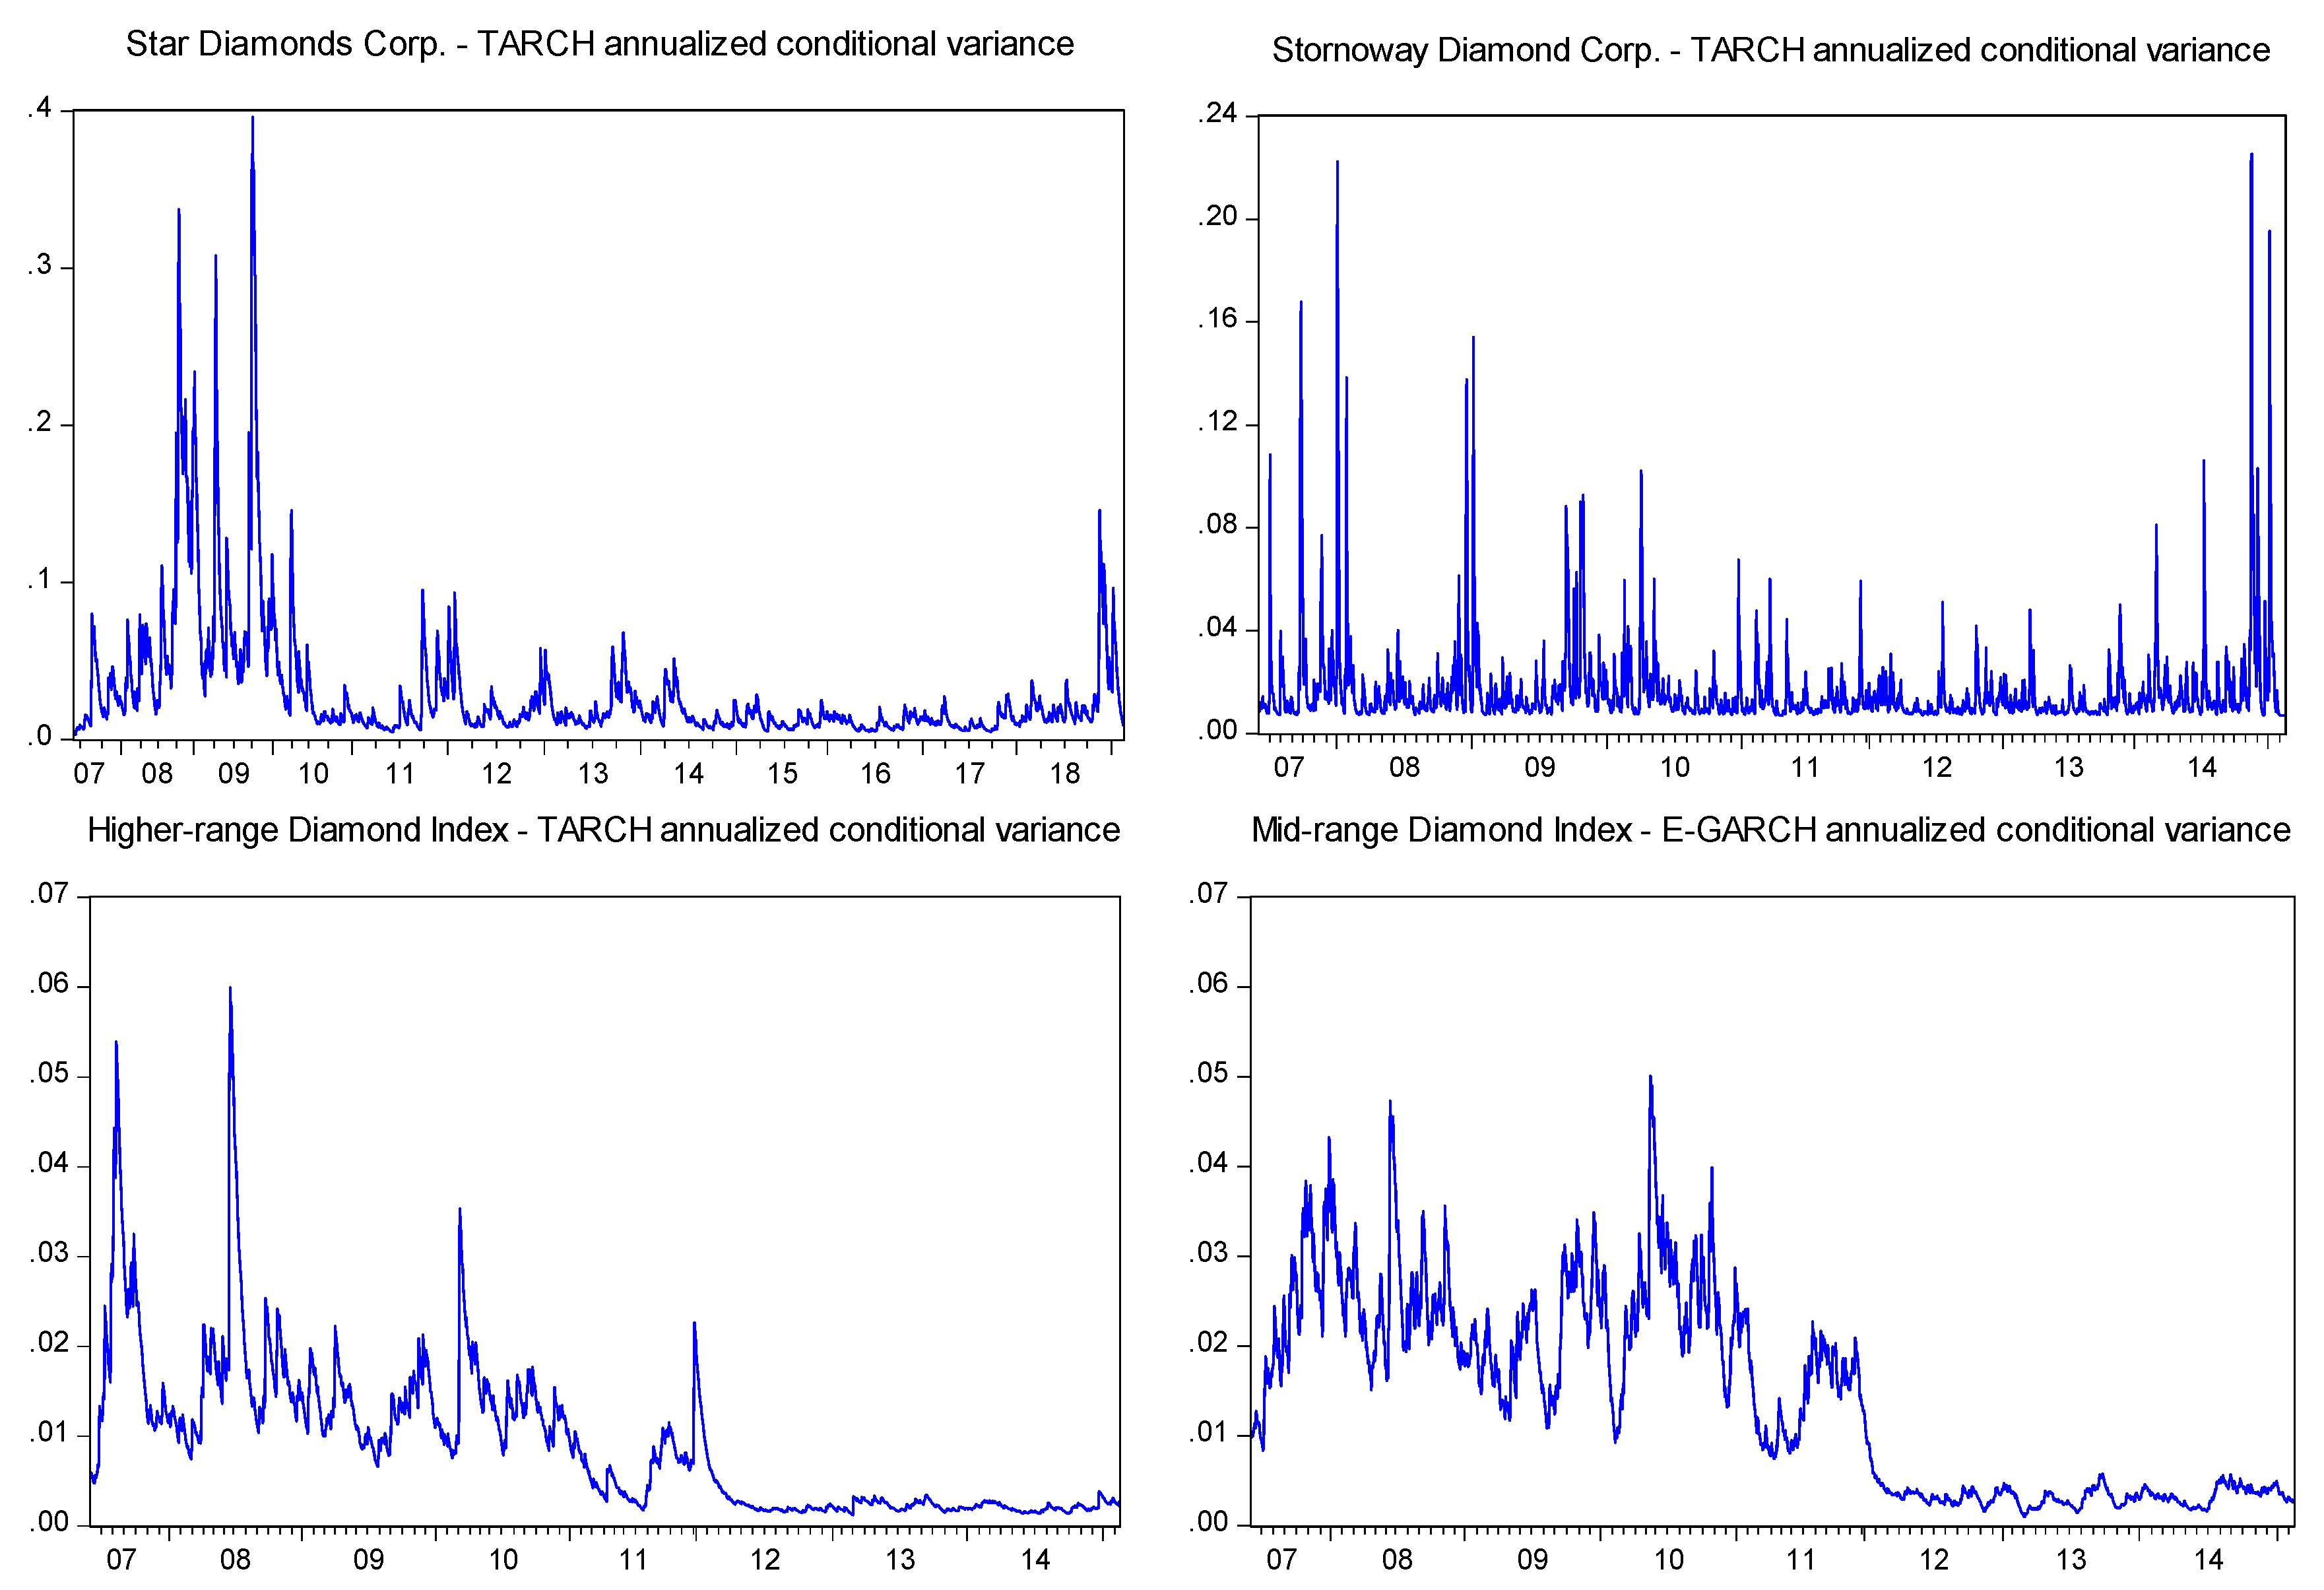
| Stornoway D. C | TARCH (1,1) | *** 0.00 | *** 0.34 | *** 0.51 | ** 0.08 |
| (9.85) | (11.20) | (14.69) | (0.01) | ||
| Star D. C. | TARCH (1,1) | *** 0.00 | *** 0.09 | *** 0.88 | *** 0.05 |
| (7.24) | (7.33) | (175.66) | (5.30) | ||
| Mountain P. D. | E-GARCH (1,1) | *** −0.18 | *** 0.14 | *** 0.82 | *** −0.04 |
| (−12.35) | (17.57) | 621.45 | (−9.23) | ||
| Firestone D. | TARCH (1,1) | *** 0.00 | *** 0.01 | *** 0.96 | *** 0.03 |
| (17.87) | (13.98) | 782.21 | 14.99 | ||
| Diamond Price Indices | |||||
| MDI | E-GARCH (1,1) | *** −0.09 | *** 0.12 | *** 0.89 | ** −0.01 |
| (−6.31) | (8.79) | (724.59) | (−2.39) | ||
| HDI | TARCH (1,1) | *** 0.00 | *** 0.01 | *** 0.95 | ** 0.02 |
| (3.68) | (10.01) | (258.45) | (2.44) | ||
| Cross-Correlation Matrix | Alrosa | Anglo A. | Rio Tinto | Petra D. | Stornoway D. C. | Star D. C. | Mountain P. D. | Firestone D. | Mid DI | Higher DI |
|---|---|---|---|---|---|---|---|---|---|---|
| Diamond Stock Prices | ||||||||||
| Alrosa | 1.00 | 0.11 | 0.15 | 0.08 | 0.02 | −0.03 | 0.05 | 0.00 | 0.05 | 0.04 |
| Anglo A. | 0.11 | 1.00 | 0.80 | 0.25 | 0.08 | 0.01 | 0.08 | 0.02 | −0.02 | 0.04 |
| Rio Tinto | 0.15 | 0.80 | 1.00 | 0.25 | 0.07 | 0.00 | 0.08 | 0.04 | −0.01 | 0.06 |
| Petra D. | 0.08 | 0.25 | 0.25 | 1.00 | 0.04 | −0.01 | 0.12 | 0.04 | 0.00 | −0.04 |
| Stornoway D. C. | 0.02 | 0.08 | 0.07 | 0.04 | 1.00 | 0.01 | 0.04 | 0.00 | −0.01 | 0.03 |
| Star D. C. | −0.03 | 0.01 | 0.00 | −0.01 | 0.01 | 1.00 | 0.03 | 0.01 | 0.00 | 0.04 |
| Mountain P. D. | 0.05 | 0.08 | 0.08 | 0.12 | 0.04 | 0.03 | 1.00 | −0.01 | 0.04 | 0.06 |
| Firestone D. | 0.00 | 0.02 | 0.04 | 0.04 | 0.00 | 0.01 | −0.01 | 1.00 | 0.01 | 0.02 |
| Diamond Price Indices | ||||||||||
| Mid-range DI | 0.05 | −0.01 | −0.01 | 0.00 | −0.01 | 0.00 | −0.01 | −0.01 | 1.00 | 0.28 |
| Higher-range DI | 0.04 | −0.01 | 0.01 | 0.04 | 0.03 | −0.02 | 0.02 | 0.00 | 0.28 | 1.00 |
| Series | Mid-Range Diamond Index | Higher-Range Diamond Index | ||||||
|---|---|---|---|---|---|---|---|---|
| a | z-Stat | b | z-Stat. | a | z-Stat | b | z-Stat | |
| Alrosa | *** 0.99 | 61.23 | ** 0.00 | 2.56 | *** 0.78 | 45.79 | *** 0.00 | 14.35 |
| Anglo A. | *** 0.83 | 6.82 | ** 0.02 | 2.23 | *** 0.95 | 18.48 | 0.01 | 0.97 |
| Rio Tinto | *** 0.92 | 16.89 | *** 0.02 | 10.81 | *** 0.98 | 37.65 | * 0.01 | 1.91 |
| Petra D. | *** 0.98 | 26.64 | 0.01 | 0.75 | 0.71 | 0.59 | 0.52 | 0.60 |
| Stornoway D. C. | 0.64 | 1.32 | * 0.02 | 1.93 | * 0.79 | 2.19 | 0.02 | 0.89 |
| Star D. C. | 0.63 | 1.28 | *** 0.02 | 3.10 | 0.69 | 1.37 | 0.02 | 1.14 |
| Mountain P. D. | *** 0.76 | 2.59 | 0.01 | 0.95 | *** 0.82 | 7.86 | * 0.02 | 1.72 |
| Firestone D. | 0.80 | 0.38 | *** 0.00 | 2.87 | 0.80 | 1.25 | *** 0.00 | 17.94 |
| Alrosa | 0.02 | *** 0.65 | 0.00 | *** 0.65 |
| (0.22) | (21.62) | (0.13) | (21.75) | |
| Anglo American | 0.00 | 1.63 | 0.00 | 1.63 |
| (0.26) | (64.28) | (−0.05) | (63.99) | |
| Rio Tinto | −0.01 | *** 1.52 | 0.00 | *** 1.52 |
| (−0.72) | (66.78) | (−0.20) | (67.00) | |
| Petra Diamonds | 0.02 | *** 0.84 | 0.03 | *** 0.84 |
| (0.46) | (14.23) | (1.19) | (14.14) | |
| Stornoway D. C | −0.02 | *** 0.64 | 0.02 | *** 0.63 |
| (0.28) | (11.88) | (0.38) | (11.77) | |
| Star D. C. | −0.01 | *** 0.60 | −0.06 | *** 0.59 |
| (0.02) | (9.36) | (−2.34) | (9.36) | |
| Mountain P. D. | ** 0.04 | *** 0.71 | * 0.07 | *** 0.71 |
| (2.23) | (14.14) | (3.10) | (14.07) | |
| Firestone D. | 0.01 | *** 0.37 | −0.01 | *** 0.37 |
| (0.51) | (8.32) | (−0.33) | (8.36) |
© 2019 by the authors. Licensee MDPI, Basel, Switzerland. This article is an open access article distributed under the terms and conditions of the Creative Commons Attribution (CC BY) license (http://creativecommons.org/licenses/by/4.0/).
Share and Cite
Jotanovic, V.; D’Ecclesia, R.L. Do Diamond Stocks Shine Brighter than Diamonds? J. Risk Financial Manag. 2019, 12, 79. https://doi.org/10.3390/jrfm12020079
Jotanovic V, D’Ecclesia RL. Do Diamond Stocks Shine Brighter than Diamonds? Journal of Risk and Financial Management. 2019; 12(2):79. https://doi.org/10.3390/jrfm12020079
Chicago/Turabian StyleJotanovic, Vera, and Rita Laura D’Ecclesia. 2019. "Do Diamond Stocks Shine Brighter than Diamonds?" Journal of Risk and Financial Management 12, no. 2: 79. https://doi.org/10.3390/jrfm12020079
APA StyleJotanovic, V., & D’Ecclesia, R. L. (2019). Do Diamond Stocks Shine Brighter than Diamonds? Journal of Risk and Financial Management, 12(2), 79. https://doi.org/10.3390/jrfm12020079