Abstract
This study examines the managerial power-hypothesis of selective hedging, which holds that selective hedging is observed more frequently in companies where managers have greater latitude to execute hedging proposals without serious scrutiny or questioning. The hypothesis is tested using hand-collected data on corporate governance and derivative positions from the oil and gas industry. The results support the view that managerial power increases selective hedging. The main governance dimension associated with selective hedging is the extent of inside ownership. Firms with high inside ownership have excessive variability in their derivative portfolios, were more prone to opportunistic behavior following the great rise in the oil price in the mid-2000s, and have lower realized cash flow from hedging.
JEL Classification:
G30; G32
1. Introduction
Selective hedging is defined as the practice of varying the size and timing of derivative transactions based on market views (Stulz 1996; Adam et al. 2015). Academic research has shown that this practice is commonplace (Brown et al. 2006; Adam and Fernando 2006; Géczy et al. 2007; Adam et al. 2015, 2017). Selective hedging is thought to be compatible with shareholder wealth maximization under two specific conditions. According to (Stulz 1996), managers need, first of all, to possess an information advantage over the market, and second, selective hedging must not endanger the firm’s financial health.
An alternative view holds that selective hedging reflect agency problems related to risk management. It is well known that managers may derive personal benefits from derivative usage (Stulz 1984; Smith and Stulz 1985) and are susceptible to overconfidence (Brown et al. 2006; Géczy et al. 2007). If such agency problems are indeed an important driving factor behind selective hedging we would expect that the extent to which it occurs is influenced by corporate governance arrangements. More specifically, we expect that selective hedging is observed more frequently in those companies where managers are entrenched and have more power to execute hedging proposals without serious scrutiny or questioning.
The managerial power-hypothesis is tested using hand-collected data on corporate governance and derivative positions from the oil and gas industry between 2000 and 2008. The sample contains 352 usable selective-hedging observations (the full sample consists of 842 firm-years in a balanced sample). The sample period has the advantage that it incorporates the great rise in hydrocarbon prices that started in the mid-2000s. This “wall of cash” brought about an unprecedented increase in revenue in oil firms that entailed significantly lower financial distress risk (see Andrén and Jankensgård 2015). The abundance of cash in this period suggested less hedging was needed as financial distress risk decreased significantly. However, the historically high prices also tempted managers to opportunistically lock in prices, offering us a unique window for observing selective hedging behavior.
Inside ownership stands out among the governance measures in terms of explaining selective hedging. Derivative portfolios are more variable and unpredictable in firms where managers and directors together control a larger portion of the firm’s shares. A natural way to interpret the finding on inside ownership is in terms of an entrenchment-effect. Given more managerial power, these managers enjoy more freedom in implementing a hedging program on a discretionary basis. The view that entrenched managers hedge more selectively finds additional support in that selective hedging is higher when the firm has a staggered board. Staggered boards are a well-known mechanism for limiting the abilities of outsiders to monitor the executive team (Bebchuk et al. 2002).
Firms with high inside ownership were also more prone to opportunistic behavior in response to the great rise in oil and gas prices in the mid-2000s. Firms, consistent with opportunistic behavior, responded to this price shock by increasing hedge ratios and by extending the average weighted maturity of their derivative portfolios. This served to lock in what was perceived to be attractive prices far above historical averages. The data shows that high insider-ownership firms were more prone to extend the average maturity of hedging contracts in response to the shock.
Inside ownership furthermore increases the likelihood of a change in the dominant hedging style. Previous studies have shown that there is substantial variation in hedging style, which refers to the specific combination of different types of derivative instruments used (Adam 2009; Croci et al. 2017). A high rate of change in hedging style (e.g., switching from using mainly forward contracts to options) is suggestive of selective hedging. The dominant strategy used changes in over 40% of firm-years, suggesting considerable excess variability.
Moreover, inside ownership is associated with lower derivative cash flows. Derivative cash flows are the payoffs from realized (cash settled) derivative contracts. Previous research has found that selective hedging is not associated with any superior performance (Treanor et al. 2014; Fabling and Grimes 2015). The results in this article suggest that more variable hedging portfolios, in fact, have lower derivative cash flows compared to more stable ones. This negative effect is particularly strong in high-inside ownership firms, which is consistent with the managerial power-hypothesis of selective hedging. In this view, managerial power lowers the quality of decision-making because the firm’s governance system does not pressure managers to be diligent.
Managerial ownership, while potentially increasing managerial power, is usually also thought to align the interests of managers and shareholders. Inside ownership indicates that executives have skin in the game and are betting money that is, to a fair extent, their own. This, together with the finding that they also hedge more selectively, suggests that these managers are confident in their own abilities to outwit the market. However, the below-average performance in terms of derivative payoffs could also indicate that they are overconfident, i.e., overestimating their abilities and chance of success. The overconfidence-interpretation relates to Adam et al. (2015), who show that managers exhibit hedging behavior over time that is consistent with overconfidence. A similar conclusion is found in Beber and Fabbri’s (2012) study, who analyze how selective hedging relates to CEO characteristics like education and age.
Stulz’s (1996) theory of selective hedging finds support in the data in that leverage decreases selective hedging, but firm size increases it. Debt appears to have a disciplining effect on selective hedging, akin to how Jensen (1986) envisioned debt to mitigate other forms of agency costs, such as overspending. Size, on the other hand, given the superior resources of large firms, can be viewed as a proxy for information advantage.
The main contribution of this study is to develop the managerial power-hypothesis of selective hedging and provide new evidence on the corporate governance-selective hedging relation. The extant evidence on how selective hedging is influenced by governance is sparse. Géczy et al. (2007), using survey evidence, find that firms with many anti-takeover provisions describe themselves as engaging in speculative behavior more frequently. Brown et al. (2006) and Adam et al. (2015) also explore the role of corporate governance, but with inconclusive results. In contrast to these studies, the present study finds support for the view that selective hedging is an outgrowth of the agency problem of risk management and that the quality of corporate governance matters.
This article also contributes by extending the definition of selective hedging. Thanks to the richness of the data, it is able to go beyond the analysis of volatility in hedge ratios and incorporate more dimensions of selective hedging. The extended definition of selective hedging is the practice of varying the timing, size, style, and maturity of derivative positions based on market views. The main measure of selective hedging in this article is a composite of these three dimensions of selective hedging. Finally, the article contributes by being the first in the literature to bring evidence from an exogenous shock to the underlying price. The tremendous rise in oil prices in the mid-2000s offers a window into opportunistic hedging behavior not available under business-as-usual conditions.
The paper proceeds as follows. Section 2 develops the entrenchment-hypothesis of selective hedging. Section 3 outlines the sample and methodology used. Section 4 presents the results from the empirical analysis of determinants of selective hedging. Section 5 relates selective hedging to corporate performance. Section 6 concludes the paper.
2. Hypothesis Development
When managers act solely to promote shareholder wealth, the extent of corporate hedging will be guided by various kinds of frictions, such as taxes or bankruptcy (Smith and Stulz 1985) or underinvestment (Froot et al. 1993). A hedging program can be designed to lower the probability of such costly “lower tail outcomes”, and thereby enhance shareholder value (Stulz 1996). If this model is descriptive, it follows that changes in corporate hedging should be dictated largely by changes in the probability and cost of various forms of financial distress.
It is widely recognized, however, that managers may use corporate hedging in order to promote private benefits. The agency problem of risk management was first analyzed formally by Stulz (1984), who showed that risk-averse and under-diversified managers will hedge in excess of the optimal hedge ratio from the point of view of shareholders. Tufano (1996) concludes, in a landmark empirical study, that “theories of managerial risk aversion seem more informative than those of shareholder value maximization.”
Reasons why managers may want to engage in selective hedging include the intrinsic enjoyment of speculation, and conforming to an established culture in which taking speculative views is the norm. It should also be considered that firms in some cases develop internal functions devoted to risk management. Such units, for reasons related to self-esteem and internal promotion, have an inherent interest in the extensive use of derivatives. This kind of “mission creep” is suggested by Géczy et al. (2007), who state that “firms are motivated to use derivatives to hedge. Once the fixed costs of a derivative operation are in place, however, some firms extend these operations to include active trading based on a market view.”
Anecdotal and survey evidence strongly support the notion that managers believe that they can outwit the markets. In their survey of corporate risk management practice, Bodnar et al. (1998) conclude that “it is apparent that a majority of firms sometimes take into account their opinion about market conditions when choosing a risk management strategy”.
The broader hypothesis under examination in this article is that selective hedging increases with managerial power. The hypothesis suggests that there should be less selective hedging in firms with high-quality governance arrangements that rein in managerial power. Below, the expected impact on selective hedging from seven governance-dimensions related to managerial power is outlined.
A staggered board structure is a governance arrangement, in which only a part of the board of directors, usually a third, stand for election each year, such that at least two general meetings are needed to replace a majority of the board members. An acquiring firm, thus, cannot oust the whole board at the same time, which is possible when all directors are elected each year. Bebchuk et al. (2002) argue that staggered boards are highly effective in entrenching the management of the firm and constitute the most effective antitakeover mechanism.
(Hypothesis 1) H1:
Firms with a staggered board hedge more selectively.
Inside ownership also serves to entrench managers, as the ability of outsiders to monitor them decreases (Shleifer and Vishny 1997). However, inside ownership is generally thought to align the interests of executive officers with those of shareholders, and is commonly used in empirical research as a measure of the degree of agency problems in a firm (Kalcheva and Lins 2007). This should lower any tendency to hedge selectively if managers themselves believe that this activity is actually not value-creating but is done for personal benefit. On the other hand, if managers believe that selective hedging is indeed good for shareholders, and hence for themselves, they would hedge more selectively with inside ownership. The effect of inside ownership on selective hedging is, therefore, theoretically indeterminate.
(Hypothesis 2A) H2A:
Firms with high inside ownership hedge more selectively.
(Hypothesis 2B) H2B:
Firms with high inside ownership hedge less selectively.
According to Hermalin and Weisbach (2003), the board of directors can be viewed as part of a market solution to the various agency problems that afflict organizations. The board is supposed to monitor executive management on behalf of shareholders. However, CEOs may “capture” and control the board, in which case the board’s ability to perform its monitoring role is undermined. Two board characteristics that have been used in the literature to proxy for “board capture” are CEO–Chairman duality and the fraction of executive directors on the board. It is commonly argued that when the chairmanship of the board and the position of CEO are held by the same individual, management has “de facto control” (Brickley et al. 1997). In a similar vein, to exercise effective control the board members should be independent of the CEO (Hermalin and Weisbach 2003). Additionally, ad-hoc hedging proposals that are motivated by view-taking may be harder to push through if the board is large, as there is a higher probability of a dissenting and critical view that blocks the proposal.
(Hypothesis 3) H3:
Firms with CEO-Chairman duality hedge more selectively.
(Hypothesis 4) H4:
Firms with a high fraction of executives on the board hedge more selectively.
(Hypothesis 5) H5:
Firms with a large board hedge less selectively.
The final corporate governance-category to be considered is monitoring by outside owners. An important remedy to the corporate agency problem concerns block ownership. According to Shleifer and Vishny (1986), both the incentive and ability of investors to monitor management generally increases in the size of ownership stakes. Investors holding smaller equity stakes lack incentives to incur the costs of monitoring management. One particular category of owners that has generated substantial interest among researchers over the last couple of decades is institutional owners. Institutional investors are usually considered to represent a professional form of corporate governance with a strong shareholder-value orientation (Chung and Zhang 2011).
(Hypothesis 6) H6:
Firms with large non-inside owners hedge less selectively.
(Hypothesis 7) H7:
Firms with large institutional investors hedge less selectively.
3. Data and Methodology
3.1. Sample
The dataset used in this paper is based on a sample of oil and gas firms (SIC 1311 or 2911) between 2000 and 2008.1 The oil and gas industry is generally considered ideal for studying corporate hedging because it has significant exposures to a hedgeable risk factor (i.e., the oil price), a great deal of variation in hedge ratios, and sufficiently detailed disclosure with regard to hedging activities (Jin and Jorion 2006).
The oil and gas industry is suitable for studying managerial power because it is notorious for its high level of agency problems. It was singled out by Jensen (1986) as particularly prone to wasting free cash flows on investments that were gratifying to managers but value-destroying for owners. Andrén and Jankensgård (2015) document a strong relation between cash flow and investment among large firms in this industry following the record prices in the mid-2000s, which the authors argue is consistent with high agency costs of free cash flow. Kumar and Rabinovitch (2013) argue that the desire to “build empires” by overinvesting gives managers an incentive to increase hedging intensity because it shields the firm from capital market discipline. Using data from the oil and gas industry, they find evidence showing that entrenched CEOs are associated with higher hedge ratios. The authors do not, however, investigate how managerial power impacts selective hedging.
The sample period has the advantage of spanning two market regimes: the 2000 to 2003 period, characterized by a relatively “stable” oil price, and the 2004 to 2008 period, characterized by a sharply rising oil price that successively reached new record levels. This constitutes a major exogenous shock, which allows us to examine determinants of selective hedging in two different sets of market conditions.2 In the latter period, prices were far outside the range of historically observed prices. This feature is useful to study selective hedging because prices that greatly exceeded the historical average must have seemed like a good opportunity to lock in attractive prices for managers in the industry.
The sample overlaps significantly with the one used in Andrén and Jankensgård (2015). To be eligible for inclusion in the sample a firm has to have a SIC code of either 1311 or 2911, be listed on a stock exchange, and have total assets exceeding $1m in all years. 101 firms (909 firm-years) meet these requirements. While introducing some survivorship-bias, balancing the panel in this fashion has the advantage that it reinforces the natural experiment-aspect of the research design—the same set of firms is tracked in two different market regimes.
Corporate governance data is hand-collected from proxy statements (DEF 14A) and annual reports (10-K filings). These documents must be available on Edgar (www.sec.gov/edgar) in the selected time period and the governance aspects must be unambiguously stated. Sixty-seven firm-year observations are lost due to this requirement. All financial data is retrieved from Datastream without further loss of observations, leaving the number of firm-years in the full sample at 842.
To study selective hedging an extended analysis is carried out based on 439 firm-years for firms identified as hedgers. Hedging firms are identified through a keyword search.3 It is required that firms report their derivative positions in sufficient detail to quantify the different hedging strategies. This criterion essentially means that firms must report their hedging position in tabular form. Fortunately, a large majority of firms use this type of disclosure. Firms that report a Value-at-Risk or a sensitivity measure, which are also allowed under US accounting rules, are excluded because the information is insufficient to determine the extent and type of hedging strategies.4 In total, an additional eight firms (72 observations) are lost due to unavailability of sufficiently detailed hedging data, bringing the total number of hedging firm-years to 367.
3.2. Model Specification
The main empirical model is a logit regression with a measure of selective hedging as the dependent variable (Equation (1)). The model relates the probability (log-odds) of a firm-year being classified as selectively hedging to an array of explanatory variables (X in Equation (1)). The explanatory variables are a set of financial and corporate governance variables, to be described in this section.
3.3. Variables
3.3.1. Selective Hedging
The main measure of selective hedging in this article is the year-on-year change in the composition of derivative portfolios. The argument is that a portfolio that remains stable year-on-year suggests that hedging is executed on a routine basis, perhaps guided by an established rule or hedging policy that governs the hedging decision. Selective hedging, on the other hand, implies less such commitment and routine.5 A derivative portfolio is considered “stable” if it resembles the previous year’s portfolio sufficiently on the three dimensions of amount, maturity, and style.
Incorporating the style and maturity-dimensions allows for a richer description of hedging behavior. The hedge ratio-approach used in previous studies overlooks other ways in which there may be a change, or “surprise”, between two balance sheet dates. Consider the case of Apache Corp. Between 2003 and 2004 the hedge ratio remained at a comparable level (18 vs. 20%).6 However, the portfolio composition was very different in these years. In 2003 the portfolio consisted mainly of linear hedging instruments (83%), whereas in 2004 Apache had 88% collars and 10% cash-financed put options. Also, between these two dates the weighted average maturity of the hedging position increased from 1.1 to 1.8, a considerable extension of the time horizon of the hedging instruments. A purely hedge-ratio-based measure of selective hedging, however, would have indicated that there was practically no variation in this derivative portfolio, and thus no selective hedging.
There is indeed substantial richness in terms of how firms hedge (Adam 2009; Croci et al. 2017). Three main strategies are discernable in the oil and gas industry: a cash-financed insurance strategy7, a linear strategy8, and the collar strategy (Jin and Jorion 2006; Croci et al. 2017).9 Another way a derivative portfolio can be characterized is in terms of its maturity, i.e., how far out in time its positions are due. For example, managers can hedge further out in time when they think forward rates are opportune and want to lock them in. Three measures are calculated to capture these dimensions of hedging:
D_AMOUNT = (1 | ABS(%∆(AMOUNT)) > TA;0)
D_MATURITY = (1 | ABS(∆(MATURITY)) > TM;0)
D_STYLE = (1 | ABS(∆(STYLE)) > = 1;0)
The prefix “D_” indicates the difference, or change, in each of these three variables. AMOUNT is the number of units hedged, expressed in terms of barrels of oil equivalents (thousands). It is the sum of linear derivative contracts (forwards, futures, and swaps) and put options bought. MATURITY is the weighted average maturity of the firm’s derivative portfolio, stated in years. STYLE is a categorical variable that takes on a value according to which hedging strategy is the dominant one (i.e., makes up the largest fraction) in the firm’s portfolio of financial derivatives. Four strategies are used: no hedging; cash-financed put options; collar; and linear. Definitions follow those in Croci et al. (2017).
SELHEDGE is a composite variable that takes the value zero if D_AMOUNT, D_MATURITY, and D_STYLE simultaneously are smaller than predefined thresholds, or one otherwise (see Equation (5)). A value of zero for SELHEDGE represents, for an investor reading annual reports, a “surprise-free” and stable derivative portfolio (see Appendix A for a stylized example.)
SELHEDGE = (0 | D_AMOUNT = 0 ∩ D_MATURITY = 0 ∩ D_STYLE = 0; 1)
The thresholds TA and TM indicate what is to be considered a substantial change and have to be arbitrarily defined. The initial values are as follows. A percentage change in the volume hedged (D_AMOUNT) will be considered substantial if it exceeds 50% in absolute terms. This threshold corresponds to a one-standard deviation move in annual production growth (which has a sample median of 9% and a standard deviation of 57%). This implies a very modest risk that D_AMOUNT is driven by production growth-related changes in hedging, even if one makes the strong assumption that the hedged volume follows production 1:1. A change in the average weighted maturity (D_MATURITY) will be considered sufficient if it is larger than 0.5 years in absolute terms. Again, we are looking for changes that are substantial, as opposed to fine-tunings within the normal course of business. Reaching the threshold would happen if, for example, a firm initially hedges 2000 barrels of oil with a one year horizon (maturity = 1), and in the following year hedges 1000 with a 1-year horizon and 1000 with a 2-year horizon (maturity = 1.5). For the change in the dominant hedging strategy (D_STYLE), no threshold has to be defined.
In previous literature, selective hedging is a function of the level of variability around some average or predicted value of hedging (i.e., the forecasted fraction of production hedged) (Brown et al. 2006; Adam and Fernando 2006; Adam et al. 2015). To reconcile with this literature, continuous measures of selective hedging based on the hedge ratio are analyzed for robustness.
3.3.2. Corporate Governance Variables
All governance variables are hand-collected from annual reports (10-K) and proxy statements (DEF 14A) to ensure consistent coding. INSIDEOWN is defined as the number of shares beneficially held by all executive officers and directors as a group, divided by the total number of shares. STAGGER is an indicator variable that takes the value one if the firm has a staggered (classified) board, or is zero otherwise. BOARDSIZE is the number of directors serving on the board. EXECSHARE is the ratio of executive officers to the total number of directors. DUALITY is an indicator variable that takes the value one when the CEO is also the chairman of the board, or is zero otherwise. INSTITUTIONAL is defined as the sum of the shares held by institutional investors above a 5%-threshold, divided by the total number of shares. BLOCK is similarly defined as the sum of non-managerial ownership above the 5% threshold, divided by the total number of shares. Block and institutional ownership were collected from the section about securities ownership and beneficial owners in the firm’s proxy statement.
3.3.3. Other Variables
DERIVATIVE is a binary variable that takes the value 1 if the firm uses financial derivatives in a given year, and zero otherwise. As a proxy for information advantage, I follow Adam et al. (2015) and use firm size. ASSETS is defined as total assets (WC02999). To measure financial status the firm’s indebtedness and cash resources are used. LEVERAGE is defined as the book value of debt divided by total assets (WC03255/WC02999). CASH is defined as cash and cash equivalents divided by total assets (WC02001/WC02999). The firm’s investment rate is an additional control, given the prominent role of investment opportunities in the theory of hedging (Froot et al. 1993). CAPEX is defined as investments in fixed assets divided by total assets (WC04601/WC02999). The variables CAPEX, CASH, and LEVERAGE are winsorized at the 2.5 and 97.5 percentiles.10 POST2003 is a regime shift dummy that takes the value one in the years 2004–2008 to capture the exogenous shock, and zero otherwise.
3.4. Descriptive Statistics
Table 1 presents descriptive statistics for the variables used in the study. Judging by the mean value of assets, the firms in the full sample are considerably larger than in previous studies using data from the oil and gas industry (Haushalter 2000; Jin and Jorion 2006). This is explained by the inclusion of giant firms ExxonMobil, Chevron, and ConocoPhillips in this sample.11 The full sample-median, however, is lower compared to the one reported in Jin and Jorions study ($152 vs. $208 million), indicating that the sample contains a significant fraction of relatively small firms. The corporate governance variables are similar to the ones reported in Adam et al. (2015) for the gold mining industry. The oil and gas industry has a larger share of firms with a staggered board (mean 37% vs. 29% in the gold industry). The median leverage is similar in the both industries (21% vs. 17%). The comparison of the mean and median values for INSIDEOWN (21% vs. 13%) reveals a significant skew to the right. This comes about due to a very high level of inside ownership among some of the smaller firms in the industry. In the hedging sub-sample, consisting of firms that are on average larger, the skew is much less pronounced (mean 12% vs. median 7%).12 The fraction of hedgers in the sample is 52%. The corresponding number in Haushalter (2000) is also just above 50%, whereas in Jin and Jorion (2006) it is 67%.

Table 1.
Descriptive statistics.
Table 2 reports differences in means for hedgers and non-hedgers. It shows, consistent with previous research, that hedging firms are much larger than non-hedgers. In addition, hedging firms also have higher leverage, lower inside ownership, and higher institutional ownership, larger boards, and a lower fraction of executives on the board. Correlation coefficients are untabulated to preserve space. Correlations between SELHEDGE and the explanatory variables are generally low. The strongest correlation is with inside ownership (0.15, statistically significant at the 1%-level).13
Table 2.
Mean of hedgers vs. non-hedgers.
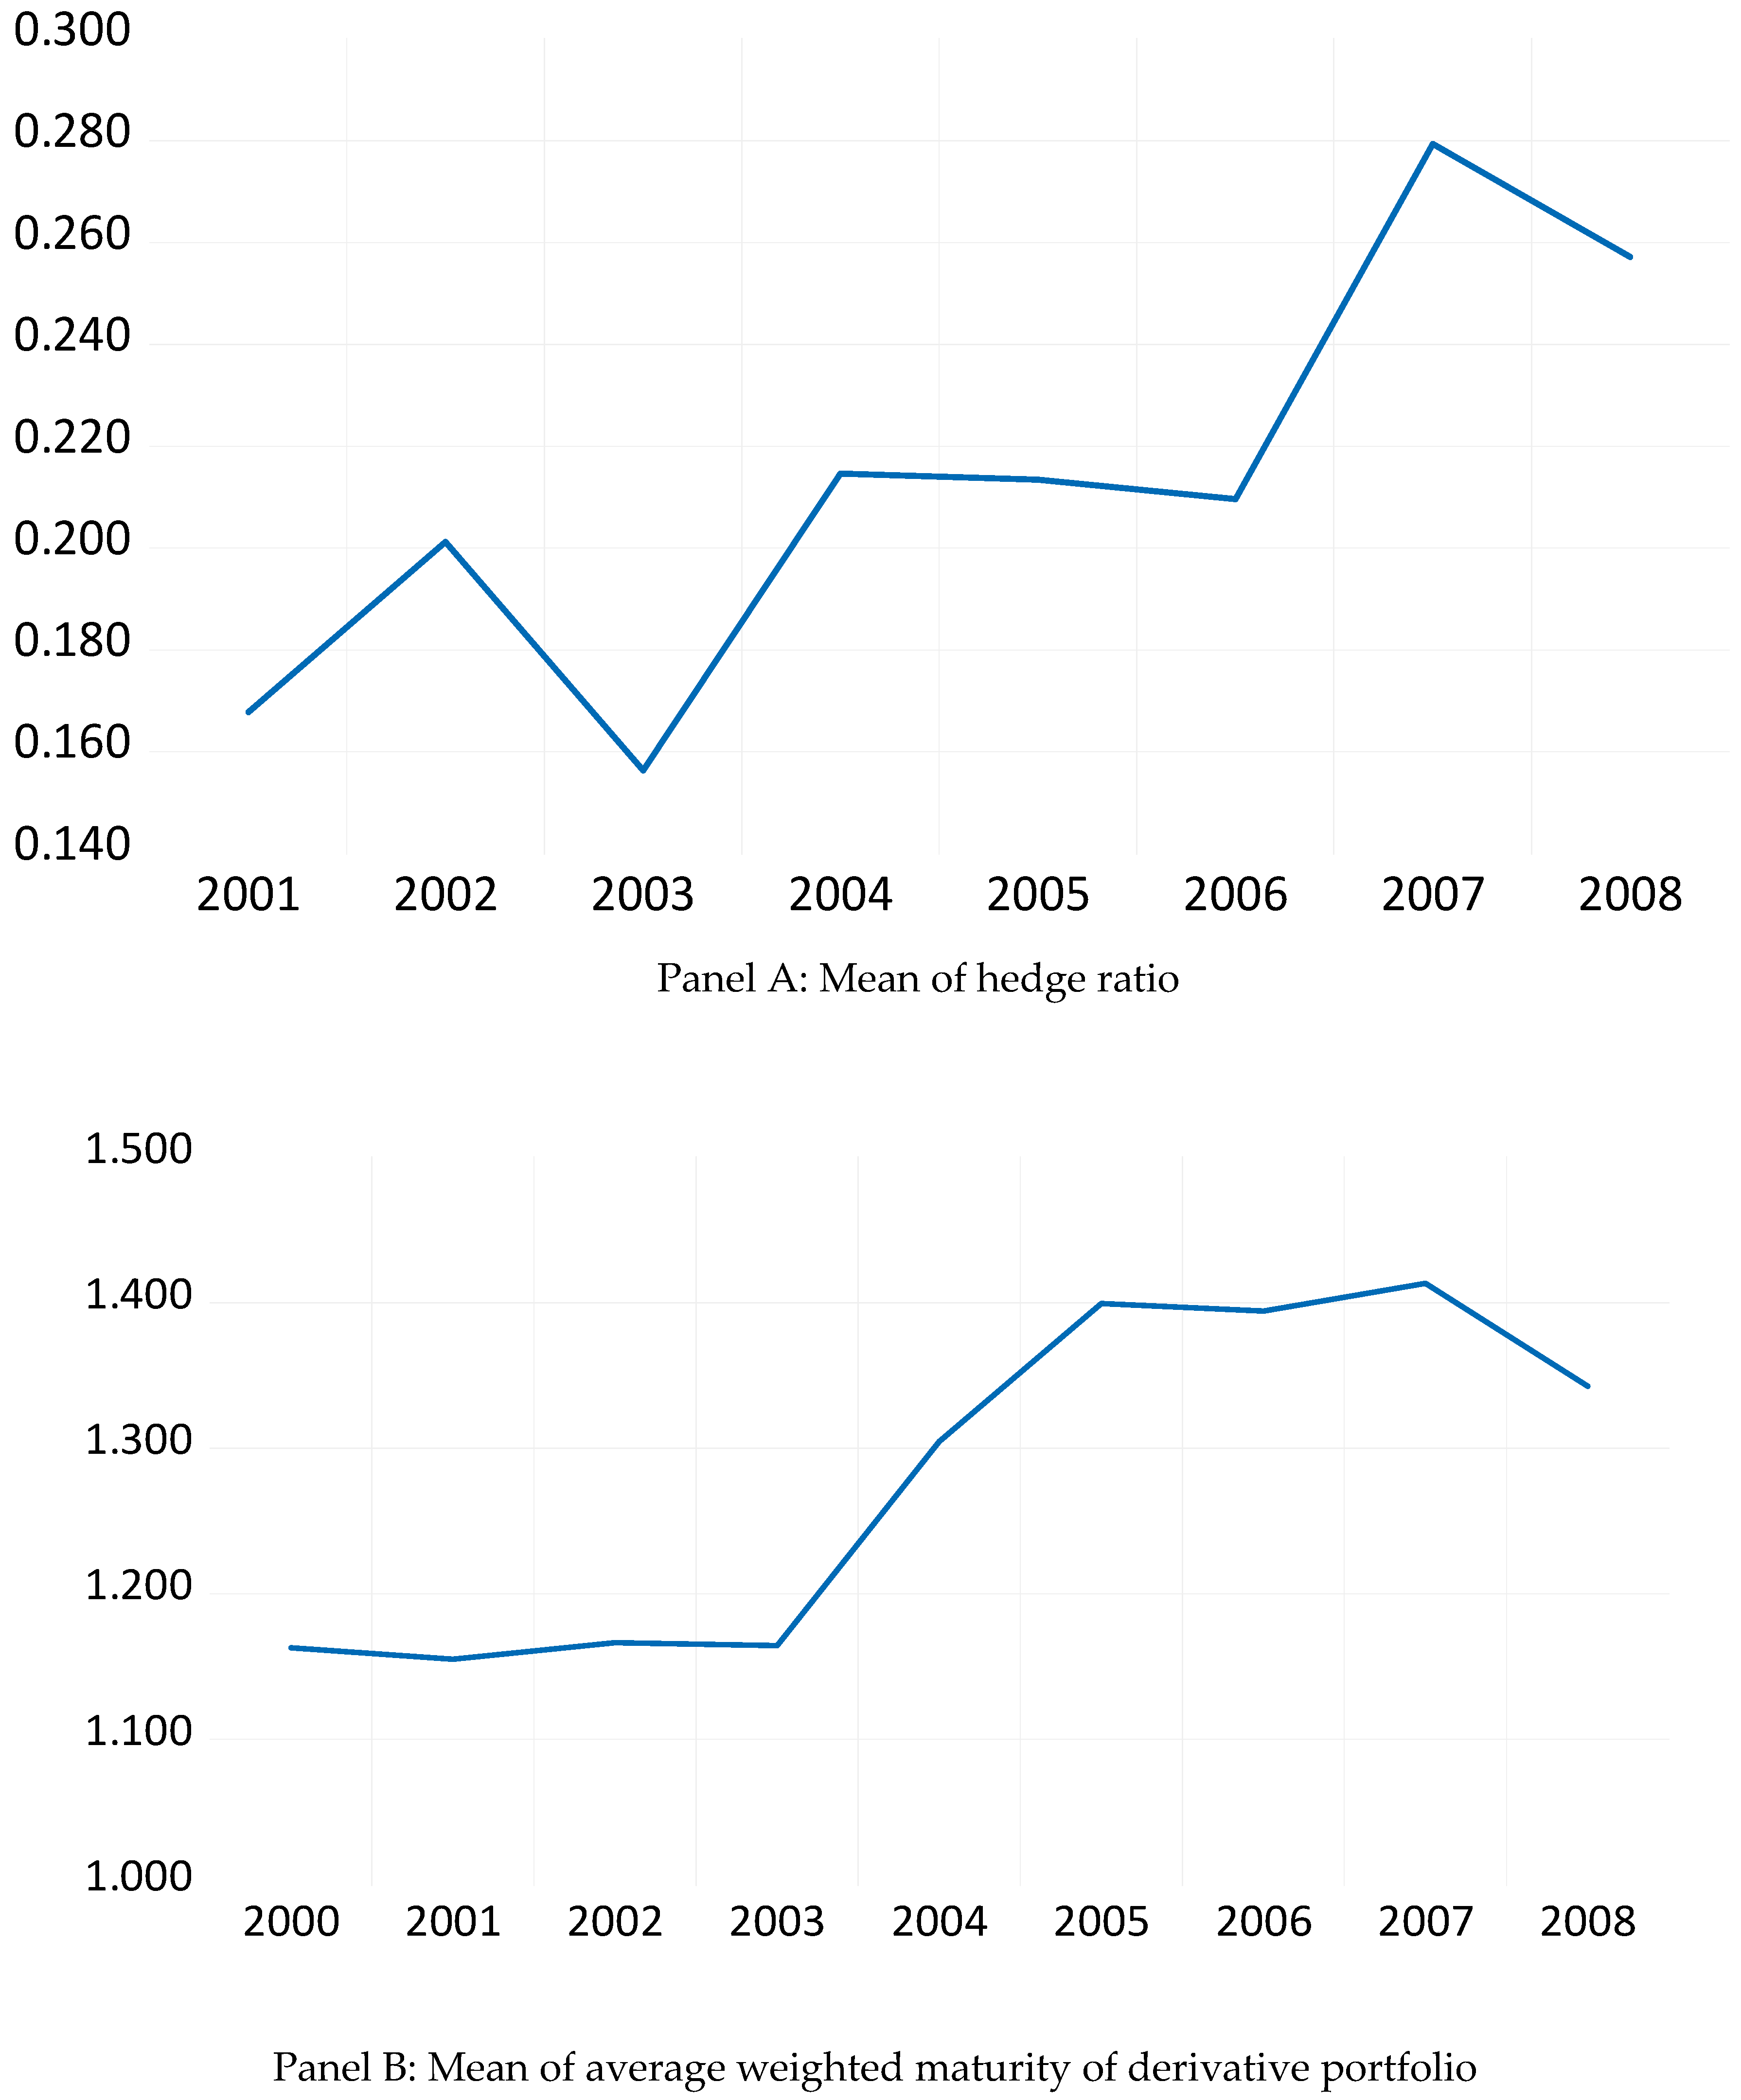
Figure 1 illustrates that both the hedge ratio and average hedging maturity went up in the abundance period. This increase in hedging intensity goes against the prediction of the efficient-hedging hypothesis, according to which hedging should decrease considering the lower financial distress risk in that period. Instead, the findings suggest opportunistic behavior. Apparently, many firms took the opportunity to lock in what was perceived as historically high prices. Another observation is that the collar strategy becomes increasingly common after 2003 (graph not shown). The fraction of firm-years in which the dominant strategy is linear or insurance correspondingly went down. A possible explanation for the preference for collars after 2003 is that if managers believed that even larger deviations from the historical mean were unlikely, selling upside by writing calls might have seemed like a cheap way to finance the put options bought.

Figure 1.
Hedge ratio and maturity over time. This Figure illustrates the development of the mean hedge ratio (Panel A) and the mean weighted average maturity of derivative portfolios (Maturity, Panel B) in the oil and gas industry over time. The higher the maturity, the further out in time the firm’s derivative contracts will tend to be realized. Hedge ratio and maturity are defined in Section 3.3.1.
SELHEDGE has a grand mean of 73% (untabulated), indicating that only in about one-quarter of firm-years in the derivative portfolio are considered stable between two balance sheet dates. This is consistent with previous evidence suggesting considerable excess volatility in derivative portfolios (Brown et al. 2006). This lack of predictability is corroborated by a reading of annual reports for 43 hedging firms in 2006. It found that remarkably, not a single firm signaled any degree of commitment to a particular hedging policy.14 The sample means for its constituent parts D_AMOUNT, D_STYLE, and D_MATURITY are 58%, 40%, and 11% respectively. Post-shock, there was a statistically significant decrease in SELHEDGE, driven primarily by less variability in hedging style.
4. Empirical Results
4.1. Determinants of Selective Hedging
In this section the issue of which factors are associated with the degree of selective hedging is addressed. Because the analysis by necessity is confined to firms that are users of derivatives, the sample decreases to 352 firm-years.15 Table 3 reports the results from three different model specifications. Model 1 is the baseline regression. Model 2 adds the log of production, both contemporaneous and lagged, to account for the fact that hedging volumes may change in entirely predictable ways if the firm’s production changes.16 To further rule out that the results are driven by changes in production, Model 3 instead includes the change in production (normalized by total assets). According to Table 3, several financial and governance variables are helpful in explaining selective hedging. The McFadden R2 of the regression increases from 0.018 to 0.074 when the governance variables are included.
Table 3.
Determinants of selective hedging.
The results in Table 3 suggest that firms with a staggered board and a high share of inside ownership hedge more selectively (p-values = 0.05 and 0.00, respectively). The former finding relates to Géczy et al. (2007) who, using survey-data, find evidence suggesting that take-over defenses are more common in firms that frequently speculate. Adam et al. (2015), on the other hand, find no consistent relation between a staggered board and selective hedging. Comparable results are few with regard to managerial ownership. Adam et al. (2015) do not analyze this variable. Géczy et al. (2007) find that the fraction of shares held by the Chief Financial Officer is positively related to firms’ describing themselves as frequent speculators. Brown et al. (2006) regress their measure of selective hedging on the fraction of shares held by officers and directors, but find no relation.
Board size influences SELHEDGE negatively (p-value = 0.04), in agreement with the view that a large board size has a disciplining role in corporate hedging.17 This variable is analyzed in Adam et al. (2015), who find, in three out of the four models reported, that the variability of hedge ratios is higher in firms with large boards.
Size influences SELHEDGE positively (p-value = 0.08), suggesting that large firms engage more in selective hedging. This is contrary to the finding in Adam et al. (2015) and Beber and Fabbri (2012), but in line with Géczy et al. (2007). The finding supports the argument in Stulz (1996) that firms with an information advantage, i.e., large firms, should do more selective hedging.
Leverage has a negative sign (p-value = 0.02). The same relation is found in Géczy et al. (2007), whereas Beber and Fabbri (2012) find no association.18 That more leveraged firms are less prone to hedge selectively is consistent with Stulz’s (1996) argument that firms need not only an information advantage but also enough financial muscle to support selective hedging. When leverage is high, firms focus on the essentials of meeting cash commitments, which leaves less scope for selective hedging.
To summarize, the managerial power-hypothesis of selective hedging finds support in that both insider ownership and a staggered board increase selective hedging (H1 and H2A). The finding on board size also supports this interpretation (H5). The other board characteristics (CEO–Chairman duality and the fraction of executives on the board) do not explain cross-sectional differences in selective hedging (H3 and H4). Neither block ownership nor institutional ownership has explanatory power (H6 and H7). A natural interpretation of these findings is that inside ownership and staggered boards are relatively more powerful mechanisms for entrenching management teams, thus paving the way for more selective hedging.
4.2. Robustness Tests and Reconciliation with Previous Literature
This section presents the results from robustness checks (Table 4). Models 1 and 2 change the threshold values for AMOUNT to 70% and 100%, respectively. That is, in Model 1 a change in the number of barrels of oil equivalents hedged exceeding 70% is considered sufficiently large, as opposed to 50% in the original specification. Models 3 and 4 change the threshold values for MATURITY to 0.4 years and infinity, respectively. The latter effectively means that this criterion is excluded from the computation of SELHEDGE. Models 5 and 6 change the sample period to 2000–2003 and 2005–2008, respectively. As mentioned previously, the 2004–2008 period is characterized by abundant cash flows and financing opportunities thanks to historically high oil prices. Model 7 uses the log of INSIDEOWN to take into account the positive skew of this variable.
Table 4.
Robustness tests.
The most salient take-away in Table 4 is the robustness of the result on inside ownership. The initial results on size, leverage, staggered board, and board size are more sensitive to the choice of specification. A number of additional robustness measures are carried out, which are not tabulated to preserve space. In one of these tests the sum of D_AMOUNT, D_STYLE, and D_MATURITY is used instead of requiring them to be zero simultaneously. When the sum is used, firm fixed effects are included to account for omitted variable bias. In another test the Heckit-procedure (Heckman 1979) is implemented to addresses the selection-bias that results from keeping only hedgers in the sample. In yet another, the hedge ratio is included to control for the possibility that SELHEDGE is systematically related to the initial level of the hedge ratio. In all of these regressions the result on INSIDEOWN continues to hold with a statistical significance at the 1%-level.
To reconcile the measure of selective hedging used in this paper with the one used by the previous literature, two continuous measures of selective hedging based on variability in the hedge ratio are analyzed. To preserve space, these are not tabulated but are available on request. First, the absolute value of the change in the hedge ratio is used as the dependent variable, such that positive and negative deviations from last year’s hedge ratio are treated equally. INSIDEOWN has a positive sign and is weakly significant (p-value = 0.08). Next, the firm-specific volatility of the hedge ratio is used (using all valid firm-years over the 9-year period, obtaining 69 observations). The sign on INSIDEOWN remains positive but does not reach significance at conventional levels (p-value = 0.11).
STYLE and MATURITY are dimensions of hedging behavior not previously explored in the selective hedging-literature. To learn more about how each is affected by corporate governance these variables are explored in unreported regressions. INSIDEOWN is positively related to D_STYLE (p-value = 0.04), meaning that inside ownership increases the probability of experiencing a shift in the dominant hedging strategy used. An analysis of MATURITY also supports a positive relation between inside ownership and selective hedging. In a regression with MATURITY as the dependent variable, INSIDEOWN is negative (p-value = 0.06), which indicates that high-inside ownership managers keep hedging positions with lower weighted average maturity. The POST2003 dummy is positive, reflecting the previously discussed extension of average maturity post-shock. When an interaction term between POST2003 and INSIDEOWN is added the coefficient is positive and significant at the 1%-level, suggesting that high inside-ownership managers were more prone to respond opportunistically by locking in the unprecedented price increases.
5. Selective Hedging and Performance
Selective Hedging and Derivative Cash Flows
A question of considerable interest is whether managers succeed in persistently generating excess profits through selective hedging. This question is addressed by Adam and Fernando (2006), who show that while gold mining firms tend to make consistent gains from their derivative portfolios, the profits from selective hedging appear small at best. Brown et al. (2006) also conclude that compelling evidence that selective hedging leads to better performance is lacking. Overall, evidence on this issue is sparse and limited to the gold mining industry.
To shed light on this question, the gain or loss from hedging activities, as reported in the net income statement, is collected. Whenever reported, the realized, or cash settled, gain/loss is used. In some cases, the reported number is not sufficiently detailed as to determine whether it contains an unrealized component.19 To get an acceptable sample size these gains and losses are still included. GAINLOSS is computed as the hedging gain and loss divided by sales, obtaining 260 usable observations. One outlier is detected. Isramco in 2006 has a hedging gain that represents 86% of sales (which was $3 million is this year). The nearest obtained values are around 40% (the median is −2.5%).
The 2000s was a dismal decade for corporate hedging in the oil and gas industry. Between 2000 and 2008, only 28% of firm-years showed gains. This is in contrast to the finding in Adam and Fernando (2006), who report that gold mining firms are consistently making hedging gains, a finding that the authors attribute to the realization of a positive risk premium in the forward market. Their sample period has a different profile, however, in that it contains both ups and downs, whereas the sample in this study spans the great rise in hydrocarbon prices. Also, in contrast to the gold market, the oil futures price has historically been in backwardation, meaning that the forward price is lower than the spot price.
To examine the cross-sectional determinants of hedging gains and losses, Table 5 reports two regressions in which GAINLOSS is the dependent variable, excluding the Isramco outlier. Model 1 only contains SELHEDGE. MODEL 2 uses size and inside ownership as independent variable. Size is a proxy for informational advantage, whereas inside ownership is included, since the analysis so far has revealed this variable to be strongly related to hedging behavior. Period fixed effects are used to account for the possibility that there is a systematic impact from the year-specific difference between spot and forward prices.
Table 5.
Determinants of hedging gains and losses.
In Model 1 in Table 5 it can be seen that SELHEDGE, on its own, is negatively related to GAINLOSS (p-value = 0.06). Selective hedging has a negative average effect, corresponding to about 2% of sales. It means that if between two balance sheet dates there is a change in the derivative portfolio large enough to exceed on or more of the threshold values, during that year there is a negative effect on hedging gains and losses. Model 2 shows that size is significant (p-value = 0.04).20 The sign is positive, supporting the argument that large firms have an informational advantage. Inside ownership, however, does not achieve significance. Models 3 and 4 provide interaction terms. The interaction between SELHEDGE and size (Model 3) shows that the effect of SELHEDGE (p-value = 0.00) is more favorable in large firms, supporting the view that these firms have an informational advantage. The interaction term between SELHEDGE and INSIDEOWN (p-value = 0.00) goes in the other direction—the higher the inside ownership, the worse the outcome.
It may be debated to which degree derivative cash flows can be meaningfully evaluated on a stand-alone basis. After all, much hedging activity takes place with the expressed goal of reducing risk. This argument by investigating the determinants of revenue volatility, finding no evidence that selective hedging is associated with lower volatility (available from the author on request). The lower average derivative cash flows in firms that hedge selectively is therefore not counterbalanced by a reduction in cash flow risk.
6. Conclusions
The results in this article support the broad hypothesis that managerial power leads to more selective hedging. The findings suggest that the quality of corporate governance is an important determinant of the excess variability in derivative portfolios. Specifically, levels of selective hedging are higher in firms characterized by high inside-ownership and staggered boards.
The results are based on an industry―oil and gas―that benefits from both high-quality hedging data and from being known for high levels of agency costs. The results should be generalizable to other industries as well, however, as there is little to suggest that managerial power should influence selective hedging differently in other settings. An interesting angle to continue this line of investigation would be to examine selective hedging and its relation to indicators of managerial power in an international sample of commodity firms. Such a setting would allow cross-cultural differences in agency costs and corporate governance to be explored.
The results also have practical implications. They suggest that shareholders and outside directors in firms with entrenched management teams need to increase their efforts to rein in selective hedging. A high degree of variability in hedging creates unpredictability, as well as a general lack of transparency about what exposure investors actually have. The results of this study do not suggest that shareholders are compensated for this reduced transparency by persistent gains or lower risk from selective hedging.
Funding
This research received no external funding.
Conflicts of Interest
The author declares no conflict of interest.
Appendix A. Stylized Example of Calculation of SELHEDGE
Assume that, at year-end 2002, a firm has sold forward 1000 barrels of oil, and bought put options covering 2000 barrels. Both contracts expire in 12 months. In this case, the nominal volume (AMOUNT) is 3000 (1000 + 2000). The weighted average maturity (MATURITY) is 1 year (since no position has a maturity exceeding one year). The dominant strategy (STYLE) is insurance (2000 > 1000). Three main hedging strategies are discernible in the oil and gas industry: linear, insurance, and collar (Croci et al. 2017). A linear strategy means that a firm has secured a fixed price on some portion of its production through price swaps, forward contracts, or futures. An insurance strategy is defined as one in which the firm predominantly buys put options and finances these at least 50% with cash on hand (the remainder is typically financed by selling call options.) If more than 50% of the puts bought are financed with sold calls the strategy is considered a collar strategy. At year end the following year (2003), the firm has in place two forward contracts. Both covers a volume of 1000, but one contract expires in 12 months, whereas the second does so in 24 months. At year end 2003 the nominal volume is 2000 (1000 + 1000). The dominant strategy is now linear (only forward contracts are used). The weighted average maturity is 1.5 (0.5 × 1 + 0.5 × 2). Comparing the two portfolios, we see that the nominal volume has changed by 33% (1000/3000). If this percentage exceeds the chosen threshold value, D_AMOUNT will register a one, or otherwise zero. The dominant strategy has changed from insurance to linear. Hence D_STYLE will register a one (zero if it had not changed). The change in average weighted maturity is 0.5 (1.5–1). If this number exceeds the selected threshold, D_MATURITY will register a one, or otherwise zero. SELHEDGE will take the value one if at least one of D_AMOUNT, D_STYLE, and D_MATURITY takes the value 1, i.e., there is a material change, or “surprise”, in derivative portfolio composition.
References
- Adam, Tim. 2009. Capital expenditures, financial constraints, and the use of options. Journal of Financial Economics 92: 238–51. [Google Scholar] [CrossRef]
- Adam, Tim R., and Chitru S. Fernando. 2006. Hedging, speculation, and shareholder value. Journal of Financial Economics 81: 283–309. [Google Scholar] [CrossRef]
- Adam, Tim R., Chitru S. Fernando, and Evgenia Golubeva. 2015. Managerial Overconfidence and Corporate Risk Management. Journal of Banking and Finance 60: 195–208. [Google Scholar] [CrossRef]
- Adam, Tim R., Chitru S. Fernando, and Jesus M. Salas. 2017. Why do firms engage in selective hedging? Evidence from the gold mining industry. Journal of Banking and Finance 77: 269–82. [Google Scholar] [CrossRef]
- Andrén, Niclas, and Håkan Jankensgård. 2015. Wall of cash: The investment-cash flow sensitivity when capital becomes abundant. Journal of Banking and Finance 50: 204–13. [Google Scholar] [CrossRef]
- Bebchuk, Lucian Arye, John C. Coates IV, and Guhan Subramanian. 2002. The powerful antitakeover force of staggered boards: Theory, evidence, and policy. Stanford Law Review 54: 887–951. [Google Scholar] [CrossRef]
- Beber, Alessandro, and Daniela Fabbri. 2012. Who times the foreign exchange market? Corporate speculation and CEO characteristics. Journal of Corporate Finance 18: 1065–87. [Google Scholar] [CrossRef]
- Bodnar, Gordon M., Gregory S. Hayt, and Richard C. Marston. 1998. 1998 Wharton survey of financial risk management by US non-financial firms. Financial Management 27: 70–91. [Google Scholar] [CrossRef]
- Brickley, James A., Jeffrey L. Coles, and Gregg Jarrell. 1997. Leadership structure: Separating the CEO and Chairman of the Board. Journal of Corporate Finance 3: 189–220. [Google Scholar] [CrossRef]
- Brown, Gregory W., Peter R. Crabb, and David Haushalter. 2006. Are firms successful at selective hedging? The Journal of Business 79: 2925–49. [Google Scholar] [CrossRef]
- Chung, Kee H., and Hao Zhang. 2011. Corporate governance and institutional ownership. Journal of Financial and Quantitative Analysis 46: 247–73. [Google Scholar] [CrossRef]
- Clayton Williams. 2006. 10-K Filing. Available online: https://www.sec.gov/edgar.shtml (accessed on 5 March 2019).
- Croci, Ettore, Alfonso Del Giudice, and Håkan Jankensgård. 2017. CEO age, risk incentives, and hedging strategy. Financial Management 46: 687–716. [Google Scholar] [CrossRef]
- Fabling, Richard, and Arthur Grimes. 2015. Over the Hedge: Do Exporters Practice Selective Hedging? Journal of Futures Markets 35: 321–38. [Google Scholar] [CrossRef]
- Froot, Kenneth A., David S. Scharfstein, and Jeremy C. Stein. 1993. Risk management: Coordinating corporate investment and financing policies. Journal of Finance 485: 1629–58. [Google Scholar] [CrossRef]
- Géczy, Christopher C., Bernadette A. Minton, and Catherine M. Schrand. 2007. Taking a view: Corporate speculation, governance, and compensation. The Journal of Finance 62: 2405–43. [Google Scholar] [CrossRef]
- Haushalter, G. David. 2000. Financing policy, basis risk, and corporate hedging: Evidence from oil and gas producers. The Journal of Finance 55: 107–52. [Google Scholar] [CrossRef]
- Heckman, James J. 1979. Sample selection bias as a specification error. Econometrica 47: 1251–71. [Google Scholar] [CrossRef]
- Hermalin, Benjamin E., and Michael S. Weisbach. 2003. Boards of directors as an endogenously determined institution: A survey of the economic literature. Federal Reserve Bank of New York Economic Policy Review 9: 7–26. [Google Scholar]
- Jensen, Michael C. 1986. Agency Costs of Free Cash Flow, Corporate Finance, and Takeovers. American Economic Review 76: 323–29. [Google Scholar]
- Jin, Yanbo, and Philippe Jorion. 2006. Firm value and hedging: Evidence from U.S. oil and gas producers. The Journal of Finance 61: 893–919. [Google Scholar] [CrossRef]
- Kalcheva, Ivalina, and Karl V. Lins. 2007. International evidence on cash holdings and expected managerial agency problems. Review of Financial Studies 20: 1087–112. [Google Scholar] [CrossRef]
- Kumar, Praveen, and Ramon Rabinovitch. 2013. CEO entrenchment and corporate hedging: Evidence from the oil and gas industry. Journal of Financial and Quantitative Analysis 48: 887–917. [Google Scholar] [CrossRef]
- Petroquest. 2006. 10-K Filing. Available online: https://www.sec.gov/edgar.shtml (accessed on 5 March 2019).
- Shleifer, Andrei, and Robert W. Vishny. 1986. Large shareholders and corporate control. The Journal of Political Economy 3: 461–88. [Google Scholar] [CrossRef]
- Shleifer, Andrei, and Robert W. Vishny. 1997. A survey of corporate governance. Journal of Finance 52: 737–83. [Google Scholar] [CrossRef]
- Smith, Clifford W., and Rene M. Stulz. 1985. The determinants of firms’ hedging policies. Journal of Financial & Quantitative Analysis 20: 391–405. [Google Scholar]
- Stulz, René M. 1984. Optimal hedging policies. The Journal of Financial and Quantitative Analysis 19: 127–40. [Google Scholar] [CrossRef]
- Stulz, René M. 1996. Rethinking risk management. Journal of Applied Corporate Finance 9: 8–25. [Google Scholar] [CrossRef]
- Treanora, Stephen D., Daniel A. Rogersb, David A. Carterc, and Betty J. Simkinsc. 2014. Exposure, hedging, and value: New evidence from the U.S. airline industry. International Review of Financial Analysis 34: 200–11. [Google Scholar] [CrossRef]
- Tufano, Peter. 1996. Who manages risk? An empirical examination of risk management practices in the gold mining industry. The Journal of Finance 51: 1097–137. [Google Scholar] [CrossRef]
| 1 | Firms with SIC 1311 are engaged in exploration and production, whereas SIC 2611 are petroleum refinement firms. While 2611 firms have downstream assets, they tend also to have significant upstream assets. No firm included is net short in oil and gas assets. |
| 2 | The shock was not anticipated. Prior to 2004, the forward curve gave little or no indication about the increase that was about to take place, suggesting that it was largely unexpected by industry participants. Futures prices did not start their rise until spot prices started rising. |
| 3 | Examples of search words are: item 7a, hedge, derivative, market risk, swap, collar, forward, and floor. |
| 4 | Disclosure of market risks for US companies is regulated by Financial Reporting Release No. 48 (“FRR 48”), issued by SEC in 1997. |
| 5 | The annual report of Clayton Williams is informative in this regard (Clayton Williams 2006). They state that: “The decision to initiate or terminate commodity hedges is made by management based on its expectation of future market price movements. We have no set goals for the percentage of our production we hedge […]” |
| 6 | The hedge ratio is defined as the fraction of annual production hedged. First the sum of hedged contracts is calculated as the number of linear hedging instruments (forwards, futures, and swaps) plus put options bought. This amount is then divided by expected production. Both magnitudes are expressed in terms of barrels of oil equivalents. For simplicity, it is assumed that expected production is equal to realized production (i.e., perfect foresight). Natural gas is converted into barrels of oil equivalents using the standard assumption that 6 Mcf of gas has the same energy content as 1 bbl of oil. |
| 7 | An insurance strategy involves the purchase of put options that provide a payoff if the firm’s output price falls below a pre-defined level (the strike price). |
| 8 | Linear strategies refer to hedging strategies for which the payoff is a linear function of the underlying price risk. This category includes forwards, futures, and price swaps. |
| 9 | Purchases of put options are generally financed with cash-on-hand or by selling call options. The latter is typically referred to as a “collar” strategy and is a very common strategy in the oil and gas industry. |
| 10 | The winsorization at the 2.5 and 97.5th percentiles is required to deal with outlier issues that remain if the 1st and 99th percentiles are used. Negative equity occurs in a non-trivial fraction of firm years in the oil and gas industry, which creates many extreme values for financial ratios. |
| 11 | Unfortunately, the three giant firms do not report their derivative portfolios in tabular form and are hence excluded from the hedging-subsample. |
| 12 | To account for this, in the multivariate estimations I use an alternative definition of INSIDEOWN, which adds 1 and then takes the natural log. The results from using this variable are reported in Section 4. |
| 13 | Correlation tables are available from the author on request. |
| 14 | The following statement by Petroquest is entirely typical (Petroquest 2006): “We periodically seek to reduce our exposure to commodity price volatility by hedging a portion of production through commodity derivative instruments”. These disclaimer-like statements provide little or no guidance as to what logic guides the firm’s hedging decisions, leaving investors largely in the dark about future derivative positions. |
| 15 | This number is lower than the 367 firm-years classified as derivative usage reported in Section 3. SELHEDGE is calculated in terms of year-on-year changes, so that the first year (2000) drops out. On the other hand, adding to the number of observations on SELHEDGE, is the fact that a firm that has previously hedged, but does not do so in a given year, automatically is coded as a 1 for D_AMOUNT because it indicates a major shift in portfolio composition (from positive values to zero). |
| 16 | Data to compute PRODUCTION is obtained from Capital IQ. The number is expressed in barrels of oil equivalents (thousand). |
| 17 | In untabulated regressions, board size is found to also reduce the probability of being classified as a hedger. Firms with large boards therefore seem to hedge less, and, conditional on hedging, also hedge less selectively. |
| 18 | Leverage is not included in the empirical model of Adam et al. (2015), who instead choose to include the Z-score and its quadratic term. |
| 19 | For example, a firm may state that “in 200X revenues were decreased by Y million due to hedging activities”. An unrealized component may be included in this number to the extent that the firm sees a change in the fair value of its hedging assets and liabilities and does not apply hedge accounting. However, the prevailing practice among oil and gas firms is to include only realized effects in revenue. Unrealized gains and losses are typically placed in operating expenses, or in other expenses (not included in operating income). |
| 20 | If the outlier observation is included the p-value increases to 0.06. |
© 2019 by the author. Licensee MDPI, Basel, Switzerland. This article is an open access article distributed under the terms and conditions of the Creative Commons Attribution (CC BY) license (http://creativecommons.org/licenses/by/4.0/).