Article

Intellectual Capital Performance and Profitability of Banks: Evidence from Pakistan

1
School of Finance and Economics, Jiangsu University, Zhenjiang 212013, China
2
QFBA-Northumbria University, Doha 23245, Qatar
3
College of Management, Shenzhen University, Shenzhen 518060, China
*
Author to whom correspondence should be addressed.
J. Risk Financial Manag. 2019, 12(2), 56; https://doi.org/10.3390/jrfm12020056
Submission received: 23 March 2019 / Accepted: 30 March 2019 / Published: 4 April 2019
(This article belongs to the Section Banking and Finance)

Abstract

:
The study contributes to the existing literature on intellectual capital (IC) performance and profitability by extending evidence from Pakistan. The study examines the impact of IC performance on the profitability of Pakistani financial institutions. It further examines how corporate governance, bank specific, industry specific, and country specific indicators effect Pakistani banks’ profitability. The result reports both the linear and non-linear impact of IC performance on profitability, which affirms an inverted U–shaped relationship. Among the three value added intellectual coefficient (VAIC) components, capital employed efficiency (CEE), and human capital efficiency (HCE) are found to have a significantly positive and structural capital efficiency (SCE) is found to have a significantly negative impact on bank profitability. The study notes a positive impact on profitability of factors like board independence, directors’ compensation, and higher capitalization. It reports a negative impact on profitability of factors like board size, board meetings, credit risk, industry concentration and economic growth. The results also indicate low profitability of banks during the period of government transition. The study provides insights into the important profitability drives and suggests that the impact of investment in IC on profitability is limited to an extent. The findings of this study are likely to be useful for policy makers, management, and academics.

Graphical Abstract

1. Introduction

A sound and healthy financial system is essential for an economy to operate and grow. Within a financial system, the banking sector is widely regarded as the most influential sector (Tan 2016). Since Pakistan got its independence in 1947, the Pakistani banking sector has experienced daunting challenges and several regime changes. The lack of human and financial resources, political interference, and political instability have hindered industry growth in the past. Amid all these challenges, the banking sector has grown steadily, largely due to the growth of Pakistani economy, at 5.2% over the last two decades (Yao et al. 2018). The improved performance of the Pakistani banking sector remains significant considering its importance for the economy. This study, therefore, undertakes to offer insights into the factors that have contributed to the improved performance of Pakistani banks and draws upon the implications for policy makers, regulators, and bank management.
There exists consensus that the balance sheet items are not the sole basis to create value. The non-balance sheet items like information, knowledge, intellectual property, expertise, systems, and processes also have a significant value-creation relevance. Banks are considered to be a knowledge-intensive sector (Firer and Williams 2003; Mavridis and Kyrmizoglou 2005). The existence and development of intellectual capital (IC) is considered critical to the profitability and growth of banks (Branco et al. 2011). The modern banks operate in a more dynamic and challenging environment due to intense competition, fat changing consumer preferences, technological advancement, and continuous innovation in systems and processes (Joshi et al. 2010). Human capital, as a factor of intellectual capital, helps boost the banking sector due to its pivotal role in technological advancement (World Bank 2003). Unlike the manufacturing industry, the operational success, growth, and profitability of banks do not rely largely on physical assets. As the sector offers a range of diversified financial services, it relies more on IC components like knowledge, skills, expertise, processes, advanced system, and information. Due to the intellectually intense nature of the banking sector, it provides a significant scope for intellectual capital research (Mavridis 2004).
This study contributes to the existing literature in several ways. The IC studies in the context of the Pakistani banking sector are not only scarce but also limited in depth and breadth. For example, most existing studies rely on a limited sample size. Our study is the first that examines the impact of IC performance on the profitability of 26 Pakistani banks over a ten years period from 2007 to 2016. Most existing studies on IC (Al-Musali and Ismail 2014; Al-Musali and Ismail 2016; Meles et al. 2016; Mondal and Ghosh 2012; Nawaz and Haniffa 2017; Ozkan et al. 2016; Ting and Lean 2009; Yalama 2013) are rather limited, as they do not consider the impact of corporate governance and other relevant internal and external indicators on bank performance. A number of corporate governance theorists (Donaldson and Davis 1991; Jensen and Meckling 1976; Pfeffer and Salancik 1978; Williamson 1985) as well as existing studies (Andres and Vallelado 2008; Chang et al. 2015; Fan et al. 2007; Farag and Mallin 2017; Grove et al. 2011; Isaac 2017; Liang et al. 2013; Peng and Mansor 2015; Vafeas 1999) have extended evidence on the significant impact of corporate governance (CG) indicators on bank profitability. However, most of these studies do not take into account the impact of IC of the organization. Further, the existing studies on IC neglected to take into consideration the impact of bank-specific variables (BSV), industry-specific variables (ISV), and country-specific variables (CSV). Previous studies have concluded that BSV, ISV, and CSV have a significant impact on bank profitability, but these studies ignored the role of intangible resources (Dietrich and Wanzenried 2011; Dinç 2005; García-Herrero et al. 2009; Haris et al. 2019; Micco et al. 2007; Smirlock 1985; Tan 2016; Yao et al. 2018). This study, the first attempt of its kind, uses a comprehensive set of both intangible and tangible indicators categorized into intellectual capital (value added intellectual coefficient (VAIC) and its components), corporate governance variables (board size, board independence, board meetings, directors compensation), bank-specific variables (bank size, capitalization, credit risk, private ownership, and foreign ownership), industry-specific variables (industry concentration), and country specific variables (economic growth, regulatory changes, and government transition). Further, most studies on IC employ a limited number of profitability indicators, usually one or two. The two most common indictors used are return on assets (ROA) or return on equity (ROE), and the impact of IC on interest income, which is the primary income source for the banks, is largely ignored. The existing studies also failed to account for profit margin (PM), which measures the actual income generated from the operations after taking care of costs. Therefore, in order to be more robust, this study employs four accounting measures of profitability: return on assets (ROA), return on equity (ROE), net interest margin (NIM) and profit margin (PM). These factors are employed in notable studies by Yao et al. (2018) and Tan (2016). Moreover, our study uses the generalized method of moments (GMM) because the issue of persistent profitability has also been ignored in the existing literature on IC, resulting in the problem of unobserved heterogeneity. Arellano and Bover (1995) developed the GMM model to allow using lagged profitability indicators as independent variables to deal with profitability persistence and offer unbiased and consistent results as compared to the popular Ordinary Least Square (OLS) method.
The rest of this paper is arranged as follows. Section 2 provides a brief review of the Pakistani banking industry; Section 3 develops the hypothesis based on related literature; Section 4 discusses sample, data, and methodology; Section 5 discusses the findings of the paper; and finally, Section 6 concludes and provides policy implications, limitations, and further research directions.

2. Review of the Pakistani Banking Industry

The Pakistani banking industry has performed well over the last few decades. Its contribution to the economic growth of the country is difficult to overstate. Upon its independence in August 1947, Pakistan inherited a banking sector dominated by foreign banks. There were only 97 branches of five domestic banks operating in 1951; however, as of today the domestic banks have almost wiped out foreign banks and account for 98% of the industry in terms of assets (Yao et al. 2018). This remarkable growth has resulted from a number of banking reforms introduced over the last few decades. The industry suffered a setback in 1974 when the Pakistan government nationalized almost all domestic banks. In 1980s, realizing the adversity of nationalization, the government started issuing licenses to a handful of private banks to operate alongside the nationalized banks. Also, a series of reforms were initiated to address the adverse consequences of nationalization and to streamline the industry (Hardy and Patti 2001; Khan and Hasan 1998). Patti and Hardy (2005) argued that those reforms were necessary to steer the banking industry and make it more competitive by removing operational inefficiencies. The reforms, though inevitable, had a slow impact on the growth and performance of Pakistani banks due to challenges related to higher risk exposure, higher financial cost, high service cost, and credit restrictions (Akhtar 2006). However, a significant improvement has been noted during the last decade. From 2007 to 2016, the sector saw its total assets increased by 413%, equity increased by 215%, banks deposit increase by 299%, advances, and investment grew by 160% and 877% respectively (Yao et al. 2018). As far as the intellectual capital performance of the Pakistani industry is concerned, the value-added increased by 330% (from 153,954 to 508,029 million rupees) and capital employed efficiency (CEE) increased to 0.393 from 0.290. Despite these improvements, the VAIC (a measure of intellectual capital) decreased to 3.919 from 4.281, human capital efficiency (HCE) decreased to 2.874 from 3.294, structural capital efficiency (SCE) decreased to 0.652 from 0.696, ROA decreased to 1.28% from 1.69%, ROE decreased to 14.60% from 15.21%, NIM decreased to 3.80% from 7.16% and PM decreased to 2.10% from 2.54%. Table 1 reports the intellectual capital performance of the Pakistani banking industry over the period from 2007 to 2016. The results are also graphically presented in Figure 1 and Figure 2 to study trends.

3. Literature Review and Hypothesis Development

3.1. Intellectual Capital (IC)

The resource-based and knowledge-based theories acknowledge that intangible resources are the essential source of competitive advantage and performance improvement. The IC classification has been defined by several researchers in terms of different components (Kamath 2007). The IC, first classified by Sveiby (1997), includes human, structural, and customer capital. Bontis (1996) later replaced customer capital with rational capital. In another study, the IC was classified into four components: human, customer, innovation, and process (Wang and Chang 2005). Several methodologies have been derived and utilized to measure IC performance (Andriessen 2004; Berg 2002; Chan 2009). However, the Value Added Intellectual Coefficient VAICTM, developed by Pulic (1998), is the most widely accepted methodology to measure IC performance. This classifies IC into three components: capital employed efficiency (CEE), human capital efficiency (HCE), and structural capital efficiency (SCE). The evidence in support of VAIC has grown in existing literature (Bontis et al. 2000; Cabrita and Vaz 2006; Cabrita et al. 2017; Joshi et al. 2010; Kamath 2007; Mavridis 2004; Mavridis and Kyrmizoglou 2005; Meles et al. 2016; Mondal and Ghosh 2012; Nawaz and Haniffa 2017; Yalama and Coskun 2007). The hypothesized development of VAIC and its components based on the related literature is discussed below.
VAIC: A number of recent and earlier studies applied VAIC to measure the IC performance of the banking sector in different countries, including Greece (Mavridis and Kyrmizoglou 2005), Austria (Pulic 2000), Croatia (Pulic 2001), India (Kamath 2007), Australia (Joshi et al. 2010), Japan (Mavridis 2004), and Malaysia (Goh 2005). Among recent studies, Nawaz and Haniffa (2017) found a positive relationship between the VAIC and ROA of Islamic Financial Institutions (IFIs) in 21 countries. Al-Musali and Ismail (2016) found a positive relationship between VAIC and profitability of banks in the GCC region. Moreover, many studies in different countries e.g., Haris et al. (2018) and Ahmad and Ahmed (2016) in Pakistan, Mondal and Ghosh (2012) in India, Ting and Lean (2009) in Malaysia, Al-Musali and Ismail (2014) in Saudi Arabia, Meles et al. (2016) in the US and Alhassan and Asare (2016) in Ghana, also found a positive relationship between VAIC and profitability. In addition, Ozkan et al. (2016) found no relationship between the VAIC and ROA of Turkish banks, and Singh et al. (2016) also found no significant association between the VAIC and ROA in Indian banks.
It is suggested that the relationship between IC performance and profitability could be non-linear1, because the positive impact of IC performance depends upon the efficient utilization of intangible resources, which are difficult to control. Moreover, the higher investment on human capital and structural capital could undermine profitability if the management fails to generate higher efficiency. Previously, Britto et al. (2014) used VAIC and found a non-linear relationship between IC and performance. Thus, this study intends to propose the following hypothesis:
H1. 
There exists a non-linear relationship between IC performance and the profitability of Pakistani banks.
CEE: The firms work with combinations of tangible and intangible resources. Although IC is an important element of performance, the value of physical capital is also essential in improving performance (Pulic 1998). Goh (2005) emphasized that physical capital is crucial to the banking sector. Firer and Williams (2003) also argued that the physical capital is the most significant source of performance. The CEE measured the efficiency of capital employed. The positive relationship between CEE and the firm performance is reported by Chen et al. (2005); Puntillo (2009); Ahmad and Ahmed (2016); Nawaz and Haniffa (2017); Al-Musali and Ismail (2016); Mondal and Ghosh (2012); Ting and Lean (2009); Al-Musali and Ismail (2014); Meles et al. (2016); Yalama (2013); and Ozkan et al. (2016). Whereas, an insignificant relationship between CEE and performance is reported by Joshi et al. (2010) and Firer and Williams (2003). Thus, we propose the following hypothesis.
H2. 
CEE has a positive impact on the profitability of Pakistani banks.
HCE: According to capital theorists, organizational performance is influenced by enhancement in its employees knowledge, skills, and abilities (Becker 1964; Schultz 1961). The physical resources of a company are utilized by its human resources to create value. The knowledge, experience, skills, creativity, ideas, and expertise of employees, as well as efficacy of management, are the components of human capital that improve the performance of an organization (Nielsen et al. 2006). Human capital (HC) is a source of new ideas and techniques, which can be utilized to improve products and processes (Berg 1969). The World Bank (2003) report asserts that human capital is the most important components of IC for banks. Similarly, Becker et al. (2001) argue that an increase in investment on employee competencies leads to improved financial performance. Mavridis and Kyrmizoglou (2005) further state that human capital is comparatively more essential for banks than physical capital. However, HCE measures the efficiency of HC and has been used in a number of previous studies (Haris et al. 2018; Alhassan and Asare 2016; Meles et al. 2016; Mondal and Ghosh 2012; Ozkan et al. 2016; Pulic 1998, 2000, 2004). Previously, studies reported the positive impact of HCE on the performance of financial institutions in different countries, including GCC countries (Al-Musali and Ismail 2016), Pakistan (Haris et al. 2018; Ahmad and Ahmed 2016), Turkey (Ozkan et al. 2016; Yalama 2013), India (Mondal and Ghosh 2012), Malaysia (Ting and Lean 2009), Saudi Arabia (Al-Musali and Ismail 2014), US (Meles et al. 2016), and Australia (Joshi et al. 2010). In addition, few studies also found that HCE has an insignificant impact on performance (Firer and Williams 2003; Puntillo 2009). This study also examines the impact of HCE on the profitability of Pakistani banks and thus develops the following hypothesis.
H3. 
The HCE has a positive impact on Pakistani banks profitability.
SCE: Structural capital (SC) refers to what remains in an organization when human and physical resources are excluded. This study takes a holistic view of IC and acknowledges Sveiby’s distinction between internal and external structure (Sveiby 1997). Thus, the SC refers to intangibles, owned and retained by firms, that facilitate development of a business structure that promotes efficiency and growth (Edvinsson 1997). The SC may include operations, systems and procedures (Hsu and Wang 2012), culture and environment (Bozbura 2004; Mondal and Ghosh 2012), information technologies capital, i.e., structural IC, process of knowledge management, and learning capacity (Ting and Lean 2009), and propel organization value creation activities (Nawaz and Haniffa 2017). SCE was developed by Pulic (1998) as a proxy to measure the efficiency of SC. However, the available literature reveals mixed evidence regarding the impact of SCE on performance. On the one hand, Cabrita and Vaz (2006); Puntillo (2009); and Al-Musali and Ismail (2016) found a positive relationship between SCE and profitability of banks in Portugal, Italy, South Africa, and the GCC region, respectively. On the other hand, Chen et al. (2005) and Ahmad and Ahmed (2016) found a negative relationship, while Ting and Lean (2009); Mondal and Ghosh (2012); and Nawaz and Haniffa (2017) found no relationship between SCE and the profitability of financial institutions in Malaysia, banks in India, and Islamic financial institutions in Asia, Europe, and the Middle-East regions, respectively. Thus, the hypothesis developed is as follows.
H4. 
The SCE has a negative impact on the profitability of Pakistani banks.

3.2. Corporate Governance

Sound corporate governance practices are essential to the sustainability of modern firms. Many existing theories show that a sound corporate governance mechanism improves the performance of a business. These theories include agency theory, transaction cost theory, stewardship theory, and resource-dependence theory (Donaldson and Davis 1991; Jensen and Meckling 1976; Pfeffer and Salancik 1978; Williamson 1985). There is a vast body of literature available that examines the significant impact of corporate governance indicators on the performance of banking industry (for instance, Andres and Vallelado 2008; Farag et al. 2017; García-Meca et al. 2015; Liang et al. 2013; among other). The hypothesis developed to measure the impact of corporate governance indicators are discussed below.
Board Size: Shareholders require a large and diverse board to minimize agency problems, to deal with the complexity of banking operation, and to improve performance (Adams and Mehran 2003; Adams and Mehran 2012; Yermack 1996). Previously, Farag et al. (2017); Isaac (2017); Nawaz (2017); and Andres and Vallelado (2008) found a positive relationship between profitability and an increase in the board size. However, Lipton and Lorsch (1992), and Jensen (1993) suggested that a board beyond seven to eight members does not perform efficiently and negatively effects profitability. Previously, Mollah and Zaman (2015); Liang et al. (2013); Masulis et al. (2012); Tanna et al. (2011); Staikouras et al. (2007); and Pathans et al. (2007) reported a negative relationship between board size and profitability. This study undertakes the following hypothesis to test this.
H5. 
There is a negative relastionship between the board size and profitability of Pakistani banks.
Board Independence: Agency theory suggests that independent directors perform a better monitoring role than the internal directors. Independent directors, free from conflict of interest, bring an independent and objective view, resulting in a minimizing of agency problems. Previously, Liang et al. (2013) argued that board independence is a central theme to a sound corporate governance and reported its positive impact on performance. Further, Yeung (2018); Esman and Kebede (2013); Tanna et al. (2011); Andres and Vallelado (2008); Pathan et al. (2007) also found a positive impact of board independence on financial performance. Thus, this study proposes the following hypothesis.
H6. 
There is a positive impact of board independence on profitability of Pakistani banks.
Board Meetings: Agency theory suggests that a higher frequency of board meetings reduces agency problems, improves the monitoring role of directors, and also improves performance. Studies by Yulia (2016); Andres and Vallelado (2008); Liang et al. (2013) and Grove et al. (2011) found a positive impact of frequent board meetings on performance. On the other hand, Jensen (1993) argued that the board meetings are set to overcome existing problems only and are not useful to monitor the performance. Previously, Vafeas (1999); Farag et al. (2017); and Isaac (2017) found a negative relationship between the higher frequency of board meetings and profitability. The hypothesis this study undertakes is:
H7. 
The relationship between frequency of board meetings and profitability of Pakistani banks can be positive or negative.
Directors Compensation: For sound governance practices, director compensation is an important aspect (Chang et al. 2015). Higher compensation motivates the directors to put extra effort toward minimizing agency problems and monitoring performance (Matolcsy and Wright 2011; Murphy 1985). Hermalin and Weisbach (1998) argued that the positive association between a director’s compensation and performance shows a sound corporate governance mechanism. Previously, Chang et al. (2015); Peng and Mansor (2015); Doucouliagos et al. (2007); Ghosh (2006); John and Qian (2003); Ang et al. (2002); and Hall and Liebman (1998) found a positive impact of director compensation on profitability.
H8. 
There is a positive impact of director compensation on profitability of Pakistani banks.

3.3. Bank-Specific Variables

Bank Size: Having a large asset base suggests that the bank has diversified options available to earn higher income. A blend of interest bearing (loans, investments) and non-interest bearing (fixed assets, intellectual property) assets is an important strategic decision for the management to sustain performance. However, existing literature provides mixed evidence with regards to the impact of banks size on profitability. On the one hand, the banks having large interest-bearing assets enjoy economies of scale and economies of scope and earn higher returns (Bourke 1989; Elsas et al. 2010; Iannotta et al. 2007; Molyneux and Thornton 1992). Previously, a number of studies found a positive association between bank size and profitability (Haris et al. 2019; Lee et al. 2015; Mostak Ahamed 2017; Saona 2016). More specifically, Tan et al. (2017) reported a positive impact of bank size on profitability (as measured by ROA and ROE) of Chinese banks. On the other hand, few studies argued that the large banks are difficult to monitor (Tan and Floros 2012a) and can enjoy economies of scale up to a certain level. Beyond that, the further increase in size leads to a decline in profitability due to inefficiency and bureaucratic reasons (Athanasoglou et al. 2008; Berger and Humphrey 1994; Pasiouras and Kosmidou 2007; Yao et al. 2018). Previously, Tan and Floros (2012a); Tan (2016); and Tan (2017) reported a significantly negative impact of bank size on the profitability of Chinese banks. This study undertakes the following hypothesis to measure the impact of bank size and profitability.
H9. 
The relationship between Pakistani bank size and profitability can be positive or negative.
Capitalization: The profitability of a bank is negatively affected by a higher financial cost, which can be minimized through capital injection by shareholders. A well-capitalized bank relies less on external finance and earns higher profitability due to a lower cost of internally generated funds. Therefore, an increase in capitalization protects a bank from bankruptcy, creates cushions to make risky decisions, and enhances profitability (Tan and Anchor 2016). Previously, Haris et al. (2019); Yao et al. (2018); Saona (2016); and Dietrich and Wanzenried (2011) found a positive impact of higher capitalization on profitability. Specifically, Tan (2017) and Tan (2016) reported a positive impact on profitability while Tan et al. (2017) reported a positive impact on ROA and NIM and a negative impact on ROE. Tan and Floros (2012b) reported a negative impact of higher capitalization on the profitability (NIM) of Chinese banks. In addition, Sun et al. (2017) also reported a negative relationship between higher capitalization and profitability. Thus, this study proposes the following hypothesis.
H10. 
The impact of higher capitalization on profitability of Pakistani banks can be negative or positive.
Credit Risk: A higher risk tends to reduce long-term profitability. Banks are required to hold more provisions to compensate bad loans, which reduces both assets size and the profitability of banks (Haris et al. 2019). A higher credit ratio indicates poor loan quality and poor credit management. A number of studies have found a negative impact of credit risk on profitability (Dietrich and Wanzenried 2011; García-Herrero et al. 2009; Yao et al. 2018). More specifically, Tan and Floros (2012b); García-Herrero et al. (2009); Tan (2017) and Tan et al. (2017) found a negative impact of credit risk on banks’ profitability in China, while Sufian (2009) found a positive impact of credit risk on profitability. This study undertakes the following hypothesis to examine the impact of credit risk and profitability.
H11. 
There is a negative relationship between credit risk and the profitability of Pakistani banks.
Ownership Structure: In our sample, we have either private-owned banks or government-owned banks. In addition, some private-owned banks in Pakistan represent foreign ownership. Agency theory suggests that the foreign ownership brings diversity and increases the performance of institutions. It is, therefore, important to control the ownership effect to examine whether or not ownership structure has an effect on profitability. The literature does not extend conclusive evidence on the impact of ownership. For instance, Micco et al. (2007) argued that it is not necessary that government banks are less profitable than private banks. Also, Iannotta et al. (2007) found higher profitability, while Yao et al. (2018) found lower profitability for private-owned banks, as compared to government-owned ones.
H12. 
The ownership structure has a significant on the profitability of Pakistani banks.

3.4. Industry and Country-Specific Variables

Industry Concentration: A higher concentration leads to lower profitability due to the monopolistic position of the largest banks. The industry concentrated by a few banks reveals the low market power for non-concentrated banks. Similarly, the small banks are bound to reduce their margins to compete with concentrated banks. Previously, Smirlock (1985) found that the industry concentrated by a few banks earns lower interest spread. Recently, Yao et al. (2018); García-Herrero et al. (2009); Naceur (2003); Tan and Floros (2012a); and Tan et al. (2017) found a negative impact of industry concentration on profitability, while Tan and Floros (2012b); Goddard et al. (2004) reported a positive impact of the concentration on profitability and Berger (1995) found no relationship. This study undertakes the following hypothesis.
H13. 
There is a negative relationship between a higher concentration and the profitability of Pakistani banks.
Economic Growth: Higher economic growth generates a higher demand for banking products. During the economic boom, banks experienced a surge in lending, borrowing, and other financial services, resulting in improved profitability. Studies by Yao et al. (2018); Tan (2016); Tan (2017); Lee et al. (2015); Dietrich and Wanzenried (2011); Goddard et al. (2004) found a positive relationship between economic growth and banking sector profitability. While, studies by Saona (2016); Tan and Floros (2012b); Tan and Floros (2012c) found a negative impact of economic growth on profitability. In addition, studies by Tan et al. (2017) and Bouzgarrou et al. (2018) found both a positive and negative impact of economic growth on the profitability of Chinese and French banks, respectively. This study undertakes the following hypothesis.
H14. 
Economic growth has a positive impact on the profitability of Pakistani banks.
Government Transition: In a politicized economy, banks tend to lend more money at a lower cost and offer favorable terms to firms linked to politicians. These preferential bank loans fund electoral campaigns of politicians and suppress the management’s ability to achieve a sustainable business growth. Micco et al. (2007) argued that during the period of government elections, the state-owned banks lend higher amounts of money with lower interest charges, which tend to reduce their profitability. This view is also supported earlier by Dinç (2005). Recently, Yao et al. (2018) and Jackowicz et al. (2013) found a lower profitability of banks during government transitions. Moreover, using a sample of nine public sectors banks in Pakistan over the period 2010–2016, Haris et al. (2019) found lower profitability during periods of elections and government change. This study examines this issue in the form of following hypothesis.
H15. 
Pakistani banks show low profitability during periods of government transition.
Regulatory Changes: The State bank of Pakistan (SBP), as the only central bank of the country, sets and monitors capital requirements in order to strengthen the solvency and profitability of the banks and other financial institutions. During the year 2013, the SBP introduced new regulatory changes and decided to implement BASEL-III reforms issued by Basel Committee on Banking Supervision2. In lieu of these reforms, the SBP raised the capital adequacy and minimum capital requirements from time to time, with the intention of the full implementation of BASEL-III by December 2019. The strong capital base provides protection for financial institutions against the adverse shocks of different risks and, consequently, upsurges the likelihood of earning higher profitability. Therefore, it is important to evaluate whether these requirements of regulatory capital affect banks profitability positively or not.
H16. 
There could be a positive impact of regulatory changes on the profitability of Pakistani banks.

4. Methodology and Data

4.1. Sample and Data

According to the State Bank of Pakistan (SBP), there are 33 banks operating in Pakistan. Out of the 33 banks, 21 are private commercial banks, 08 are government-owned banks, and 04 are foreign banks. Foreign banks hold only 2.46% share in terms of sector assets and thus excluded. This study focuses on the remaining 29 local banks, holding 97.54% market share (see SBP website).3 A private commercial bank named ‘MCB Islamic Bank’ was established in 2015. Therefore, this bank is also excluded from this study. Further, the study also excludes Dubai Islamic Bank Pakistan Limited and Punjab Provincial Co-operative Bank Ltd. due to the non-availability of required corporate governance data. Finally, a total sample of 26 local banks is used to investigate research hypotheses.
The data has been accessed from the annual reports and audited financial statements of all banks. The authors obtain data from the databases maintained by the central bank of the country, as well as the respective banks. To validate the GMM assumption of small T and large N (Roodman 2009), this study uses annual data which is collected for the period of 10 years from 2007 to 2016. The dates related to economic growth were obtained from the World Bank database. A government-owned commercial bank named ‘Sindh Bank Ltd. (SBL)’ was established in 2010, so only 6 years (2011–2016) of financial reports are available. Moreover, the corporate governance data of another government-owned bank named ‘SME Bank Ltd. (SMEBL) are missing before 2012. Therefore, we can only obtain five years of data (2012–2016). This makes our data slightly unbalanced with 251 bank-year observations.

4.2. Variable Selection

4.2.1. Profitability Indicators

This study employs four profitability indicators used by Yao et al. (2018) and Tan (2016). These are return on assets (ROA), return on equity (ROE), net interest margin (NIM), and profit margin (PM). The ROA is measured as net profit divided by average assets, which reflects the income generating capacity of a bank from its assets. The ROE is the ratio of net profits to average equity, which determines the ability to utilize money invested by shareholders to generate profits. The NIM is calculated as net interest income divided by average earning assets and determines the ability of a bank to make investment decisions to generate interest income after compensating for interest cost. The PM is calculated as profit before taxation to average assets; it evades the effect of corporate taxes on profits earned and shows the actual profitability generated from operation.

4.2.2. Explanatory Variables

IC Indicators

The VAICTM developed by Pulic (1998) is an appropriate and reliable proxy to measure the impact of IC. Therefore, we follow previous studies (Xu and Wang 2018; Ghosh and Mondal 2009; Ozkan et al. 2016; Pulic 1998, 2004), and use VAIC and calculate it as follows:
V A I C i t = C E E i t + H C E i t + S C E i t
where V A I C i t represents the Value Added Intellectual Coefficient of i banks at time t; C E E i t represents the capital employed efficiency of i banks at time t; H C E i t represents the human capital efficiency of i banks at time t; and S C E i t represents the structural capital efficiency of i banks at time t. The VAIC is a sum of these three components. However, in order to calculate the VAIC components, it is required to derive the value-added (VA) amount, based on previous studies (Chu et al. 2011, Ozkan et al. 2016, Pulic 2004), which is:
V A i t = O P i t + P C i t + D i t + A i t
where V A i t represents value-added; O P i t represents operating profit of a bank; P C i t means personnel cost (salaries, wages, and other benefits); D i t means depreciation; and A i t represents amortization, consistent with Xu and Wang (2018). However, the components of VAIC are calculated as follows:
C E E i t = V A i t / C E i t
where C E i t refers to capital employed by a bank and is measured as the book value of equity (difference of total assets and total liabilities).
H C E i t = V A i t / H C i t
where H C i t , consistent with Xu and Wang (2018), refers to human capital and represents personnel expenses, including salaries, wages and all other expenses incurred on employees, e.g., allowances, bonuses, staff training, charges for defined benefits plans, contributions to employees’ provident funds, etc.
S C E i t = S C i t / V A i t
where S C i t represents structure capital, derived by the difference of V A i t and H C i t (Xu and Wang 2018), see the following Equation (6):
S C i t = V A i t H C i t

Other Variables

Alongside IC performance and profitability, this study also examines the impact of corporate governance, bank-specific, industry-specific, and country-specific indicators on profitability. To evaluate the impact of corporate governance indicators, the study follows Farag et al. (2017); Liang et al. (2013); Andres and Vallelado (2008); Doucouliagos et al. (2007) and Vafeas (1999). The study uses a natural logarithm of total board members as a proxy of board size (BODSIZE); the ratio of independent directors to total directors is used as a proxy of board independence (BIND); the natural logarithm of board meetings held in a year is used as a proxy of frequency of board meetings (BMEETs); and the natural logarithm of total compensation paid to the directors and CEO is used as a proxy of directors’ compensation (DCOMP).
To examine the impact of BSV, ISV, CSV, the study follows Yao et al. (2018) and Tan (2016) and uses the natural logarithm of total assets as a proxy for bank size (BSIZE); the ratio between shareholders equity and total assets is used to measure the capitalization (CAP); and the ratio of loan loss provisions to total loans as a proxy for credit risk (Risk). The study uses two dummy variables to measure the ownership effect, one is bank type (BTYPE) that equals 1 if a bank is privately-owned and 0 otherwise, and the other is foreign ownership (FOWN), which equals 1 if a bank represents any foreign ownership and 0 otherwise. For ISV, the five banks concentration ratio (IC5) is used to measure the impact of industry concentration. The annual growth of gross domestic product (GDPR) as CSV is used to control the impact of economic growth of the country. The study uses another dummy variable that equals 1 for the government transition4 (2008–2009 & 2013–2014) and 0 otherwise, to control the impact of government transition (GOV), including the election period. The study also uses a dummy variable of regulatory changes (REGC) and assigned a value of 1 to the years from 2013–2016 (the period of BASEL-III) and 0 to the years from 2007–2012 (the period of BASEL-II) to measure the impact of change in regulatory requirements, as per BASEL-III guidelines.
Further, see Table 2 for a detailed summary of all dependent and independent variables, along with their definitions and expected results.

4.3. Analysis Approach and Methodology

Profitability tends to persist over time, and bank profitability is affected by certain characteristics of banks that are not easy to identify or measure in an equation. This creates the problem of unobserved heterogeneity. For example, the performance of banks can be affected by the management attitude toward risk, and internal politics, or the managers’ behaviors (Yao et al. 2018). If the influence of these characteristics and persistence of profitability is not taken into consideration, the calculated coefficients can be biased due the correlation between error term and explanatory variables. Further, the inclusion of endogenous variables in an equation also produces biased results, e.g., equity to assets ratio can be higher for the most profitable banks because they retain more reserves, leading to an increase in future equity and profitability (Athanasoglou et al. 2008); and the board size might be determined by the firm performance (Andres and Vallelado 2008; Farag et al. 2017). Consequently, due to the existence of an unobserved fix effect and endogeneity, the use of the ordinary least square (OLS) method produces inconsistent and biased results (Andres and Vallelado 2008; Baltagi 2001). Therefore, following Yao et al. (2018), this study uses the Generalized Method of Moments (GMM) which was first used by Arellano and Bond (1991) for dynamic panel data. It allows the use of lagged dependent variable on the left side and lag of all strictly exogenous variables to the right side to address the unobserved fix effect by differencing, the so called difference GMM. Later, Blundell and Bond (1998) and Arellano and Bover (1995) built a system of two equations, the first-difference equation and the level equation. Referred to as the System GMM, this model introduces more instruments into the system improving the efficiency of the GMM. The baseline methodology is two-step GMM system estimator. It deals with the problems of serial correlation, endogeneity, unobserved heterogeneity, and efficiently uses orthogonality conditions, thereby producing more consistent and unbiased results (Baum et al. 2003; Roodman 2009).
To deal with endogeneity, this study follows Yao et al. (2018); Athanasoglou et al. (2008); Farag et al. (2017) and Andres and Vallelado (2008). It uses board size and capitalization as the endogenous variables and instruments them with different lag-lengths (3–5), along with the lag of profitability measures. Further, the study also instruments the strictly exogenous variables in levels. However, the system-GMM reduces small sample biases, Windmeijer (2005) has shown in the Monte Carlo studies that estimated asymptotic standard errors can be downward biased in small samples while using an efficient two-step GMM. Since this study does not employ a large set of samples, to avoid any potential bias in the estimation of asymptotic standard errors, we intend to apply Windmeijer (2005) corrections, which produce a more robust and correct inference, to the standard errors. This is also consistent with Yao et al. (2018).
Since GMM allows the use of instruments, the validity of these instruments is crucial for the consistency of the GMM performance (Yao et al. 2018). The GMM calculates Hansen-J statistics of the over-identifying restrictions under the null of joint validity of the instruments. It indicates that residuals and instruments are not correlated. Further, for the validity of instrument subsets, GMM also calculates the difference-in-Hansen test (also called C-statistics) under the null of exogeneity of the instrument subset (Roodman 2009). The problems of Arellano and Bond (1991) serial correlations, i.e., first-order autocorrelation (AR-1) and second-order autocorrelation (AR-2), are also addressed by GMM under the null of no serial correlations. However, the absence of AR-2 indicates the validity of GMM even in the presence of AR-1. Further, the study has applied ‘orthogonal deviation’ because, in an unbalanced panel data, orthogonal deviation’ subtracts the average of future available observations of a variable in the transformed data and reduces the gap, while the use of first-difference transformations magnifies the gap (Arellano and Bover 1995).

4.4. Econometric Specification

This study applies GMM on unbalanced dynamic panel data of 26 banks for the period 2007-2016 in order to analyze the impact of IC performance on profitability, while, for the first time, regressing corporate governance (CG), bank-specific (BS), industry-specific (IS), and country-specific (IS) variables in a single equation. Moreover, this study controls the impact of government transition (GOV). For that, this study develops two econometric models, one model (Equation (7) measures the impact of VAIC, and the other model (Equation (8) measures the joint impact of VAIC components, i.e., CEE, HCE, SCE, on each profitability indicator.
Considering the time persistence of profitability, and following Yao et al. (2018); Farag et al. (2017); Athanasoglou et al. (2008); and Andres and Vallelado (2008), we add one year lagged of each profitability indicator on the left side as an independent variable. This process makes our model dynamic. The econometric models for this study are as follows:
P i t = α 0 + δ P i t 1 + β j V A I C i t + k = 1 K β k C G i t k + l = 1 L β l B S V i t l + β m I S V t + β n C S V t + β o G O V t + v i t + μ i t
P i t = α 0 + δ P i t 1 + β h C E E i t + β i H C E i t + β j S C E i t + k = 1 K β k C G i t k + l = 1 L β l B S V i t l + β m I S V t + β n C S V t + β o G O V t + v i t + μ i t
where P i t expresses the profitability indicators measured as ROA, ROE, NIM, PM; P i t 1 is the one year lag of profitability; δ represents the persistent profitability; δ value ranges from 0 to 1; values of lag dependent variables closer to 0 represent a competitive market and high adjustment speed; α is the constant term; β is the coefficient; v i t is the unobserved bank individual effect; and μ i t is residual.

5. Results and Findings

In order to ensure the validity of the unbalanced panel data, pre-estimation tests are applied. For that, firstly, an augmented Dicky-Fuller test for unbalanced panel data was conducted to check the unit root. However, the significant p-values of each variable rejected the null hypothesis. This result serves as an indication that variables do not contain unit roots (see Table 3). Secondly, a VIF-variance inflationary test was also performed to test the multicollinearity problem in the data. The VIF values of each variable reject the existence of multicollinearity in the data at the cut-off value of 10 (Netter et al. 1989). The VIF values are reported in Table 4. We also performed a correlation analysis (see Table 4). The correlation matrix reports the relationship among independent variables and also tests the problem of multicollinearity. However, the correlation coefficient <0.8 indicates the absence of collinearity among variables (Kennedy 2008).

5.1. Descriptive Statistics

Table 5 presents the statistics summary of all variables over the period 2007–2016. The results show that the banks in Pakistan report, on average, 0.5 percent ROA, 4.8 percent ROE, 4.3 percent NIM, and 0.9 percent PM over the analysis period. The VAIC mean value of 2.8777 is higher than the mean VAIC value of 2.08777 in Ghana (Alhassan and Asare 2016) and lower than the mean VAIC 3.925 of all Islamic Financial Institutions (IFIs) in 22 countries (Nawaz and Haniffa 2017). Further, the positive average mean values of CEE (0.2812), HCE (2.1979), and SCE (0.4010) suggest that human capital has remained the most significant and CEE the least significant IC components to explain the performance and profitability of Pakistani banks.

5.2. Main Findings

Our results are robust to the estimated asymptotic standard errors (Windmeijer (2005)). The four profitability indicators and set of control variables are categorized as CG, BSV, ISV, CSV, and GOV. The GMM results are reported in Table 6, where each profitability indicator has two sub-models, sub-model 1 tests Equation (7) and sub-model 2 tests Equation (8).
In Table 6, the significant coefficients of the lagged profitability prove the dynamic nature of the models. This result indicates that the current year performance of Pakistani banks is positively affected by their past performance. The p-values of 1% of F-statistics indicate the joint significance of the models. The results report the problem of AR-1 in some models but the insignificant p-values of AR-2 in all estimated models indicate the absence of AR-2 and lead to accepting the null of no serial correlation. The insignificant p-values of Hansen-J and C-statistics in all models also prove the validity of instruments and the exogeneity of the instruments subsets utilized to address the endogeneity.
The study reports the significant positive impact of VAIC and the significant negative impact of VAIC-SQ on the Pakistani banks’ profitability when measured by ROA, ROE, NIM, and PM. The results indicate an inverted U-shaped relationship between VAIC and profitability and lead to the acceptance of H1. The positive relationship is consistent with Haris et al. (2018); Nawaz and Haniffa (2017); Meles et al. (2016) and Ting and Lean (2009). The result suggests that the profitability of banks increase with an increase in the IC performance up to a certain level, and after that, a further increase in IC performance decreases profitability. Previously, Britto et al. (2014) indicated a similar behavior of IC investment and profitability. Moreover, the results suggest that banks in Pakistan are capable, up to a certain level, of generating value and sustaining competitive advantage through their IC and financial capital resources.
Among the VAIC components, we find significant positive impact of CEE on profitability when measured by ROE, NIM, and PM. This result is consistent with Nawaz and Haniffa (2017); Al-Musali and Ismail (2016) and Ozkan et al. (2016), and supports H2. This result indicates that banks in Pakistan are efficient in utilizing their financial assets to remain profitable. No matter which profitability indicator we used, our study reports the significant positive association between the HCE and profitability when measured by ROE, ROE, NIM, and PM. This is consistent with Haris et al. (2018); Mondal and Ghosh (2012); and Goh (2005), and supports H3. The result suggests that the investment in human capital generates higher efficiency and thus increases profitability. The study also finds a significant negative impact of SCE on profitability. This result is consistent with Mondal and Ghosh (2012) and Ting and Lean (2009), and supports H4. This result indicates that higher investment in the non-physical components such as system and procedures does not generate the higher efficiency and thus deteriorates profitability.
Among corporate governance indicators, the BOSZIE is found to have a significant negative relationship with profitability when measured by ROA, ROE, and PM. This significant negative relationship between BODSIZE and profitability is consistent with Liang et al. (2013) and indicates that an increase in the BODSIZE leads to inefficiency, gives more control to the CEO, makes cost (control/coordination) outweigh the benefits (monitoring/advising), and, therefore, decreases the profitability of banks in Pakistan. This result supports H5. The BIND is found to have a significant (p < 0.05) positive association with profitability when measured only by ROE. This positive impact of BIND and profitability is consistent with Liang et al. (2013) and Andres and Vallelado (2008), and supports H6 and the agency theory that independent directors always protect the interest of shareholders, and different roles played by them enhance the profitability of institutions and generate value for the shareholders. The BMEETs is found to have a significant (p < 0.05) negative impact on profitability, as measured by ROA and PM, which is consistent with Isaac (2017) and Vafeas (1999). This result supports H7 and suggests that the board meetings are not effective to improve the performance of banks in Pakistan. This inefficiency may be caused the fact that the independent and foreign directors on board are usually unable to attend meetings and possess less information, which delays the decision process and thus reduces profitability. We find that the significant (p < 0.05) impact of DCOMP on profitability, as measured by NIM only, supports H8. However, our study does not report the significant impact of DCOMP on ROA, ROE, or PM.
The study does not find a significant relationship between BSIZE and profitability, which is consistent with Shah and Jan (2014), and does not support H9. This study found a significant positive impact of CAP on NIM and PM, but an insignificant impact on ROA and PM. The significant positive relationship between higher capitalization and profitability is consistent with Haris et al. (2019); Yao et al. (2018); and Tan (2016), supporting H10. This result shows that the higher capitalization of Pakistani banks prevents them from excessive external finance cost and thus increases their profitability. Consistent with Haris et al. (2019); Yao et al. (2018) and Tan (2016), this study also found a strong significant relationship of RISK with profitability when measured by ROA, ROE, NIM, and PM. This result supports H11 and shows that Pakistani banks are exposed to risky exposures which require them to have a higher provisioning to absorb the impact of risky lending, which later turns into non-performing loans and thus decreases profitability. The significant negative coefficients of the BTYPE show that, in Pakistan, the privately-owned banks earned lower NIM than government-owned banks during the period under analysis, thereby supporting H12. Previously, Yao et al. (2018) reported the same significantly lower NIM of private-owned banks than government-owned banks in Pakistan. The foreign ownership (FOWN) in the Pakistani banking industry was found to have a significant (p < 0.05) positive impact on the profitability when measured by ROE only, whereas we do not find any significant difference in the profitability, when measured by ROA, NIM, and PM, of those banks who represent foreign ownership and those who do not.
The IC5 are found to have a significant negative relationship with ROE and NIM, which is insignificant with ROA and PM. The significant impact of IC5 on profitability is consistent with Yao et al. (2018) and Tan (2016). This result indicates that the earning ability of small banks in Pakistan is suppressed due to the market power and monopolistic position of large banks and thus reduces the profitability of small banks. This result supports H13. The findings indicate a significant negative relationship between GDPR and the profitability of banks in Pakistan when measured by NIM and PM. The significant negative coefficients of GPR indicate the negative impact of the country’s economic growth on the bank’s profitability, thus supporting H14.
The significant negative coefficients of GOV indicate a lower ROA, ROE, and PM during the period of government transition (2008–2009 and 2013–2014) than during non-transition periods. This result affirms the political interference in the Pakistani banking industry during the government transition to support the electoral campaigns of politicians (Yao et al. 2018), because during the period of government elections, the politically-connected banks lend more to those firms linked with politicians on low cost and easy terms, and thus reduce the bank’s profitability (Micco et al. 2007 and Liang et al. 2013). This result supports H15. The results do not report any significant coefficients of REGC, which indicate that regulatory changes in Pakistan have not impacted the profitability of banking industry. Thus, we reject H16.

6. Conclusions

This study is the first attempt to examine the profitability of banks in a developing country by regressing several performance indicators in a single equation. The performance indicators regressed are intellectual capital, governance, and variables specific to banks, banking industry, and country. Using the dynamic panel data set of 26 banks over the period of 2007–2016, the GMM was applied to deal with profitability persistence, unobserved heterogeneity, and endogeneity. Following Yao et al. (2018) and Tan (2016), the four accounting measures of profitability, ROA, ROE, NIM, and PM were used. This study reports the positive impact of IC performance on profitability and also affirms an inverted U-shape relationship between IC performance and profitability. Among the VAIC components, we find a positive impact of CEE and HCE, but a negative impact of SCE, on profitability. On the other hand, we report that board independence, directors’ remuneration, and higher capitalization positively impact profitability, while a larger board size, higher frequency of board meetings, higher credit risk, industry concentration and economic growth negatively impact the profitability of banks in Pakistan. The study also concludes that the banks in Pakistan earn lower profitability during the period of government transition.
The results of this study reveal the importance of IC to enhance bank profitability, implying that, for the policy-makers and management of the banks, IC performance has significant relevance to bank performance. Further, in lieu of the findings, we suggest that the Pakistani banking industry put a specific limit on investing in the IC in order to draw the desired profitability. This suggests a note of caution for management, that investment in IC generates positive performance to a certain extent, but then a decreasing trend begins. The findings suggest that higher capitalization helps to reduce cost and improve profitability. Therefore, it is suggested the banks management maintain an optimum level of equity at a low cost to offer a higher return on shareholders wealth. The investment on human capital is significant because enhanced skills and expertise will improve the performance of banks in Pakistan. The results also suggest to the bank management in Pakistan that there is an urgent need to develop a mechanism to generate a value creation efficiency of SC in order to obtain the desired profitability. The board size of Pakistani banks is relatively large, exhibiting a negative impact on profitability, possibly due to coordination and communication problems. The board structure of Pakistani banks is dominated by outside directors, including foreign directors. Consequently, with the presence of too many outside directors, and due to the limited time and their absence, frequent meetings are not useful to exchange information among directors and control performance. The results also suggest that Pakistani banks are more open to risky loans and thus generate higher credit risk. Therefore, they should avoid disbursing the riskier loans to strengthen profitability. Further, it is suggested that policy makers and bank management should take significant measures to combat the negative influence of political involvement in general and, in particular, during periods of government transition. For instance, banks can lobby for necessary legislative measures. Moreover, banks can counter political interference by strengthening corporate governance and adopting enhanced disclosure and social responsibility policies.
This study on Pakistani financial institutions only focuses on banks, and future studies can extend to include other financial institutions like leasing, insurance, credit unions, asset management firms, etc. This study measures IC performance using VAIC. However, future studies may utilize other methodologies, and it would be interesting to see if different results are generated. Moreover, the same set of variables can be replicated on the banking sector of other emerging economies. It is further recommended that future studies should consider the impact of any changes in regulations or supervisory practices as additional control variables in regression.

Author Contributions

Conceptualization, M.H.; methodology, M.H.; software, M.H.; validation, M.H., G.T. and H.M.J.; formal analysis, M.H.; investigation, M.H.; resources, M.H.; data curation, M.H., G.T. and H.M.J.; writing—original draft preparation, M.H.; writing—review and editing, A.M.; visualization, M.H. and A.M.; supervision, H.Y.; project administration, H.Y.; funding acquisition, H.Y.

Funding

This work was supported by the National Natural Science Foundation of China no. 71701082 and 71271103.

Acknowledgments

The authors would like to thank the anonymous referees very much for their valuable comments and suggestions. This work would not have been possible without their support. We also thank all those who contributed in diverse ways in making the work complete.

Conflicts of Interest

The authors declare no conflict of interest.

References

  1. Adams, Renée, and Hamid Mehran. 2003. Is corporate governance different for bank holding companies? Economic Policy Review 9: 123–42. [Google Scholar] [CrossRef]
  2. Adams, Renée B., and Hamid Mehran. 2012. Bank board structure and performance: Evidence for large bank holding companies. Journal of Financial Intermediation 21: 243–67. [Google Scholar] [CrossRef]
  3. Ahmad, Muhammad, and Naveed Ahmed. 2016. Testing the relationship between intellectual capital and a firm’s performance: An empirical investigation regarding financial industries of Pakistan. International Journal of Learning and Intellectual Capital 13: 250–72. [Google Scholar] [CrossRef]
  4. Akhtar, Shamshad. 2006. Pakistan banking Sector—The Need for Second Tier of Reforms. Available online: http://www.bis.org/review/r070117f.pdf (accessed on 7 August 2017).
  5. Al-Musali, Mahfoudh Abdul Karem, and Ku Nor Izah Ku Ismail. 2014. Intellectual capital and its effect on financial performance of banks: Evidence from Saudi Arabia. Procedia-Social and Behavioral Sciences 164: 201–7. [Google Scholar] [CrossRef]
  6. Al-Musali, Mahfoudh Abdulkarem, and Ku Nor Izah Ku Ismail. 2016. Cross-country comparison of intellectual capital performance and its impact on financial performance of commercial banks in GCC countries. International Journal of Islamic and Middle Eastern Finance and Management 9: 512–31. [Google Scholar] [CrossRef]
  7. Alhassan, Abdul Latif, and Nicholas Asare. 2016. Intellectual capital and bank productivity in emerging markets: Evidence from Ghana. Management Decision 54: 589–609. [Google Scholar] [CrossRef]
  8. Andres, Pablo de, and Eleuterio Vallelado. 2008. Corporate governance in banking: The role of the board of directors. Journal of Banking & Finance 32: 2570–80. [Google Scholar] [CrossRef]
  9. Andriessen, Daniel. 2004. IC valuation and measurement: Classifying the state of the art. Journal of Intellectual Capital 5: 230–42. [Google Scholar] [CrossRef]
  10. Ang, James, Beni Lauterbach, and Ben Z. Schreiber. 2002. Pay at the executive suite: How do US banks compensate their top management teams? Journal of Banking & Finance 26: 1143–63. [Google Scholar] [CrossRef]
  11. Arellano, Manuel, and Stephen Bond. 1991. Some tests of specification for panel data: Monte Carlo evidence and an application to employment equations. The Review of Economic Studies 58: 277–97. [Google Scholar] [CrossRef]
  12. Arellano, Manuel, and Olympia Bover. 1995. Another look at the instrumental variable estimation of error-components models. Journal of Econometrics 68: 29–51. [Google Scholar] [CrossRef]
  13. Athanasoglou, Panayiotis P., Sophocles N. Brissimisa, and Matthaios D. Delis. 2008. Bank-specific, industry-specific and macroeconomic determinants of bank profitability. Journal of international financial Markets, Institutions and Money 18: 121–36. [Google Scholar] [CrossRef]
  14. Baltagi, Badi H. 2001. Econometric Analysis of Panel Data, 2nd ed. Chichester: John Wiley & Sons. [Google Scholar]
  15. Baum, Christopher F., Mark E. Schaffer, and Steven Stillman. 2003. Instrumental variables and GMM: Estimation and testing. The Stata Journal 3: 1–31. [Google Scholar] [CrossRef]
  16. Becker, Brian E., Mark A. Huselid, and Dave Ulrich. 2001. The HR Scorecard: Linking People, Strategy and Performance. Watertown: Harvard Business Press Books. [Google Scholar]
  17. Becker, Gary S. 1964. Human Capital Theory. New York: Columbia. [Google Scholar]
  18. Berg, Herman Anthony Van den. 2002. Models of Intellectual Capital Valuation: A Comparative Evaluation. Paper presented at Conference: Knowledge Summit Doctoral Consortium 2002, Queen’s Centre for Knowledge-Based Enterprise, Queen’s University School of Business, Ontario. Available online: http://business.queensu.ca/knowledge/consortium2002/ModelsofICValuation.pdf (accessed on 19 October 2017).
  19. Berg, Ivar E. 1969. Jobs: The Great Training Robbery. New York: Praeger Publishers. [Google Scholar]
  20. Berger, Allen, and David Humphrey. 1994. Bank Scale Economies, Mergers, Concentration, and Efficiency: The U.S. Experience. Working Paper No. 94. Philadelphia, PA, USA: Financial Institution Centre, University of Pennsylvania, Available online: http://fic.wharton.upenn.edu/fic/papers/94/9425.pdf (accessed on 24 August 2017).
  21. Berger, Allen N. 1995. The Profit-Structure Relationship in Banking: Tests of Market-Power and Efficient Structure Hypotheses. Journal of Money, Credit and Banking 27: 404–31. [Google Scholar] [CrossRef]
  22. Blundell, Richard, and Stephen Bond. 1998. Initial conditions and moment restrictions in dynamic panel data models. Journal of Econometrics 87: 115–43. [Google Scholar] [CrossRef]
  23. Bontis, Nick. 1996. There’s a price on your head: Managing intellectual capital strategically. Business Quarterly 60: 40–47. [Google Scholar]
  24. Bontis, Nick, William Chua Chong Keow, and Stanley Richardson. 2000. Intellectual capital and business performance in Malaysian industries. Journal of Intellectual Capital 1: 85–100. [Google Scholar] [CrossRef] [Green Version]
  25. Bourke, Philip. 1989. Concentration and other determinants of bank profitability in Europe, North America and Australia. Journal of Banking & Finance 13: 65–79. [Google Scholar] [CrossRef]
  26. Bouzgarrou, Houssam, Sameh Jouida, and Waël Louhichi. 2018. Bank profitability during and before the financial crisis: Domestic versus foreign banks. Research in International Business and Finance 44: 26–39. [Google Scholar] [CrossRef]
  27. Bozbura, F. Tunc. 2004. Measurement and application of intellectual capital in Turkey. The Learning Organization 11: 357–67. [Google Scholar] [CrossRef]
  28. Branco, Manuel Castelo, Catarina Delgado, Cristina Sousa, and Manuel Sa. 2011. Intellectual capital disclosure media in Portugal. Corporate Communications: An International Journal 16: 38–52. [Google Scholar] [CrossRef]
  29. Britto, Daniel Pitelli, Eliane Monetti, and Joao da Rocha Lima Jr. 2014. Intellectual capital in tangible intensive firms: The case of Brazilian real estate companies. Journal of Intellectual Capital 15: 333–48. [Google Scholar] [CrossRef]
  30. Cabrita, Maria do Rosário, and Jorge Landeiro Vaz. 2006. Intellectual capital and value creation: Evidence from the Portuguese banking industry. The Electronic Journal of Knowledge Management 4: 11–20. [Google Scholar]
  31. Cabrita, Maria do Rosário Meireles Ferreira, Maria de Lurdes Ribeiro da Silva, and Ana Maria Gome. 2017. Competitiveness and disclosure of intellectual capital: An empirical research in Portuguese banks. Journal of Intellectual Capital 18: 486–505. [Google Scholar] [CrossRef]
  32. Chan, Kin Hang. 2009. Impact of Intellectual Capital on Organisational Performance: An Empirical Study of Companies in the Hang Seng Index (Part 1). Learning Organization 16: 4–21. [Google Scholar] [CrossRef]
  33. Chang, Chen-Shan, Shang-Wu Yu, and Cheng-Huang Hung. 2015. Firm risk and performance: The role of corporate governance. Review of Managerial Science 9: 141–73. [Google Scholar] [CrossRef]
  34. Chen, Ming-Chin, Shu-Ju Cheng, and Yuhchang Hwang. 2005. An empirical investigation of the relationship between intellectual capital and firms’ market value and financial performance. Journal of Intellectual Capital 6: 159–76. [Google Scholar] [CrossRef]
  35. Chu, Samuel Kai Wah, Kin Hang Chan, and Wendy W.Y. Wu. 2011. Charting intellectual capital performance of the gateway to China. Journal of Intellectual Capital 12: 249–76. [Google Scholar] [CrossRef]
  36. Dietrich, Andreas, and Gabrielle Wanzenried. 2011. Determinants of bank profitability before and during the crisis: Evidence from Switzerland. Journal of International Financial Markets, Institutions & Money 21: 307–27. [Google Scholar]
  37. Dinç, I. Serdar. 2005. Politicians and banks: Political influences on government-owned banks in emerging markets. Journal of Financial Economics 77: 453–79. [Google Scholar] [CrossRef]
  38. Donaldson, Lex, and James H. Davis. 1991. Stewardship Theory or Agency Theory: CEO Governance and Shareholder Returns. Australian Journal of Management 16: 49–65. [Google Scholar] [CrossRef]
  39. Doucouliagos, Hristos, Janto Haman, and Saeed Askary. 2007. Directors’ Remuneration and Performance in Australian Banking. Corporate Governance: An International Review 15: 1363–83. [Google Scholar] [CrossRef]
  40. Edvinsson, Leif. 1997. Developing Intellectual Capital at Skandia. Long Range Planning 30: 366–73. [Google Scholar] [CrossRef]
  41. Elsas, Ralf, Andreas Hackethal, and Markus Holzhäuser. 2010. The anatomy of bank diversification. Journal of Banking & Finance 34: 1274–87. [Google Scholar] [CrossRef]
  42. Esman, Morekwa Nyamongo, and Temesgen Kebede. 2013. The effect of governance on performance of commercial banks in Kenya: A panel study. Corporate Governance: The International Journal of Business in Society 13: 236–48. [Google Scholar] [CrossRef]
  43. Fan, Joseph P. H., T. J. Wong, and Tianyu Zhang. 2007. Politically connected CEOs, corporate governance, and Post-IPO performance of China’s newly partially privatized firms. Journal of Financial Economics 84: 330–57. [Google Scholar] [CrossRef]
  44. Farag, Hisham, and Chris Mallin. 2017. Board diversity and financial fragility: Evidence from European banks. International Review of Financial Analysis 49: 98–112. [Google Scholar] [CrossRef]
  45. Farag, Hisham, Chris Mallin, and Kean Ow-Yong. 2017. Corporate governance in Islamic banks: New insights for dual board structure and agency relationships. Journal of International Financial Markets, Institutions and Money. [Google Scholar] [CrossRef]
  46. Firer, Steven, and S Mitchell Williams. 2003. Intellectual capital and traditional measures of corporate performance. Journal of Intellectual Capital 4: 348–60. [Google Scholar] [CrossRef]
  47. García-Herrero, Alicia, Sergio Gavilá, and Daniel Santabárbara. 2009. What explains the low profitability of Chinese banks? Journal of Banking & Finance 33: 2080–92. [Google Scholar] [CrossRef]
  48. García-Meca, Emma, Isabel-María García-Sánchez, and Jennifer Martínez-Ferrero. 2015. Board diversity and its effects on bank performance: An international analysis. Journal of Banking & Finance 53: 202–14. [Google Scholar] [CrossRef]
  49. Ghosh, Saibal. 2006. Do board characteristics affect corporate performance? Firm-level evidence for India. Applied Economics Letters 13: 435–43. [Google Scholar] [CrossRef]
  50. Ghosh, Santanu Kumar, and Amitava Mondal. 2009. Indian software and pharmaceutical sector ic and financial performance. Journal of Intellectual Capital 10: 369–88. [Google Scholar] [CrossRef]
  51. Goddard, John, Phil Molyneux, and John O. S. Wilson. 2004. Dynamics of Growth and Profitability in Banking. Journal of Money, Credit and Banking 36: 1069–90. [Google Scholar] [CrossRef]
  52. Goh, Pek Chen. 2005. Intellectual capital performance of commercial banks in Malaysia. Journal of Intellectual Capital 6: 385–96. [Google Scholar] [CrossRef]
  53. Grove, Hugh, Lorenzo Patelli, Lisa M Victoravich, and Pisun Tracy Xu. 2011. Corporate governance and performance in the wake of the financial crisis: Evidence from US commercial banks. Corporate Governance: An International Review 19: 418–36. [Google Scholar] [CrossRef]
  54. Hall, Brian J., and Jeffrey B. Liebman. 1998. Are CEOS Really Paid Like Bureaucrats? The Quarterly Journal of Economics 113: 653–91. [Google Scholar] [CrossRef]
  55. Hardy, Daniel C., and Emilia Bonaccorsi di Patti. 2001. Bank Reforms and Bank Efficiency in Pakistan. Working Paper. Washington, DC, USA: International Monetary Fund. [Google Scholar]
  56. Haris, Muhammad, HongXing Yao, Gulzara Tariq, and Ali Malik. 2019. An Evaluation of Performance of Public Sector Financial Institutions: Evidence from Pakistan. International Journal of Business Performance Management 20: 145–163. [Google Scholar] [CrossRef]
  57. Haris, Muhammad, HongXing Yao, Gulzara Tariq, Hafiz Mustansar Javaid, and Ali Malik. 2018. The Impact of Intellectual Capital and Employee Size on Bank Profitability: A Comparative Study of Islamic and Conventional Banks in Pakistan. Pacific Business Review International 11: 66–82. [Google Scholar]
  58. Hermalin, Benjamin E., and Michael S. Weisbach. 1998. Endogenously Chosen Boards of Directors and Their Monitoring of the CEO. The American Economic Review 88: 96–118. [Google Scholar]
  59. Iannotta, Giuliano, Giacomo Nocera, and Andrea Sironi. 2007. Ownership structure, risk and performance in the European banking industry. Journal of Banking & Finance 31: 2127–49. [Google Scholar] [CrossRef]
  60. Isaac, Ofoeda. 2017. Corporate governance and non-bank financial institutions profitability. International Journal of Law and Management 59: 854–75. [Google Scholar] [CrossRef]
  61. Jackowicz, Krzysztof, Oskar Kowalewski, and Łukasz Kozłowski. 2013. The influence of political factors on commercial banks in Central European countries. Journal of Financial Stability 9: 759–77. [Google Scholar] [CrossRef]
  62. Jensen, Michael C. 1993. The modern industrial revolution, exit, and the failure of internal control systems. The Journal of Finance 48: 831–80. [Google Scholar] [CrossRef]
  63. Jensen, Michael C., and William H. Meckling. 1976. Theory of the firm: Managerial behavior, agency costs and ownership structure. Journal of Financial Economics 3: 305–60. [Google Scholar] [CrossRef]
  64. John, Kose, and Yiming Qian. 2003. Incentive Features in CEO Compensation in the Banking Industry. Economic Policy Review 9: 109–21. [Google Scholar]
  65. Joshi, Mahesh, Daryll Cahill, and Jasvinder Sidhu. 2010. Intellectual capital performance in the banking sector: An assessment of Australian owned banks. Journal of Human Resource Costing & Accounting 14: 151–70. [Google Scholar] [CrossRef]
  66. Kamath, G. Barathi. 2007. The intellectual capital performance of the Indian banking sector. Journal of Intellectual Capital 8: 96–123. [Google Scholar] [CrossRef]
  67. Kennedy, Peter. 2008. A Guide to Econometrics. Malden: Blackwell. [Google Scholar]
  68. Khan, Ashfaque H., and Lubna Hasan. 1998. Financial Liberalization, Savings, and Economic Development in Pakistan. Economic Development and Cultural Change 46: 581–97. [Google Scholar] [CrossRef]
  69. Lee, John Y., Glenn Growe, Marinus DeBruine, and Inkyung Cha. 2015. Measuring the Impact of the 2007–2009 Financial Crisis on the Performance and Profitability of U.S. Regional Banks. Advances in Management Accounting. Bingley: Emerald Group Publishing Limited 25: 181–206. [Google Scholar]
  70. Hsu, Li-Chang, and Chao-Hung Wang. 2012. Clarifying the Effect of Intellectual Capital on Performance: The Mediating Role of Dynamic Capability. British Journal of Management 23: 179–205. [Google Scholar] [CrossRef]
  71. Liang, Qi, Pisun Xu, and Pornsit Jiraporn. 2013. Board characteristics and Chinese bank performance. Journal of Banking & Finance 37: 2953–68. [Google Scholar] [CrossRef]
  72. Lipton, Martin, and Jay W. Lorsch. 1992. A modest proposal for improved corporate governance. The Business Lawyer 48: 59–77. [Google Scholar]
  73. Masulis, Ronald W., Cong Wang, and Fei Xie. 2012. Globalizing the boardroom—The effects of foreign directors on corporate governance and firm performance. Journal of Accounting and Economics 53: 527–54. [Google Scholar] [CrossRef]
  74. Matolcsy, Zoltan, and Anna Wright. 2011. CEO compensation structure and firm performance. Accounting & Finance 51: 745–63. [Google Scholar] [CrossRef]
  75. Mavridis, Dimitrios G. 2004. Intellectual capital performance of the Japanese banking sector. Journal of Intellectual Capital 5: 92–115. [Google Scholar] [CrossRef]
  76. Mavridis, Dimitrios G., and Pantelis Kyrmizoglou. 2005. Intellectual capital performance drivers in the Greek banking sector. Management Research News 28: 43–62. [Google Scholar] [CrossRef]
  77. Meles, Antonio, Claudio Porzio, Gabriele Sampagnaro, and Vincenzo Verdolive. 2016. The imapct of intellectual capital efficiency on commercial banks performance: Evidence from the US. Journal of Multinational Financial Management 36: 64–74. [Google Scholar] [CrossRef]
  78. Micco, Alejandro, Ugo Panizza, and Monica Yañez. 2007. Bank ownership and performance. Does politics matter? Journal of Banking & Finance 31: 219–41. [Google Scholar] [CrossRef]
  79. Mollah, Sabur, and Mahbub Zaman. 2015. Shari’ah supervision, corporate governance and performance: Conventional vs. Islamic banks. Journal of Banking & Finance 58: 418–35. [Google Scholar] [CrossRef]
  80. Molyneux, Philip, and John Thornton. 1992. Determinants of European bank profitability: A note. Journal of Banking and Finance 16: 1173–78. [Google Scholar] [CrossRef]
  81. Mondal, Amitava, and Santanu Kumar Ghosh. 2012. Intellectual capital and financial performance of Indian banks. Journal of Intellectual Capital 13: 515–30. [Google Scholar] [CrossRef]
  82. Mostak Ahamed, M. 2017. Asset quality, non-interest income, and bank profitability: Evidence from Indian banks. Economic Modelling 63: 1–14. [Google Scholar] [CrossRef]
  83. Murphy, Kevin J. 1985. Corporate performance and managerial remuneration: An empirical analysis. Journal of Accounting and Economics 7: 11–42. [Google Scholar] [CrossRef]
  84. Naceur, Samy Ben. 2003. The determinants of the Tunisian banking industry profitability: Panel evidence. Paper presented at the Economic Research Forum (ERF) 10th Annual Conference, Marrakesh, Morocco, December 16–18; Available online: www.mafhoum.com/press6/174E11.pdf (accessed on 20 August 2017).
  85. Nawaz, Tasawar. 2017. Exploring the Nexus Between Human Capital, Corporate Governance and Performance: Evidence from Islamic Banks. Journal of Business Ethics, 1–21. [Google Scholar] [CrossRef]
  86. Nawaz, Tasawar, and Roszaini Haniffa. 2017. Determinants of financial performance of Islamic banks: An intellectual capital perspective. Journal of Islamic Accounting and Business Research 8: 130–42. [Google Scholar] [CrossRef]
  87. Netter, J., W. Wasserman, and M. H. Kutner. 1989. Applied Regression Models. Homewood: Richard D. Irwin. [Google Scholar]
  88. Nielsen, Christian, Per Nikolaj Bukh, Jan Mouritsen, Mette Rosenkrands Johansen, and Peter Gormsen. 2006. Intellectual capital statements on their way to the stock exchange: Analyzing new reporting systems. Journal of Intellectual Capital 7: 221–40. [Google Scholar] [CrossRef]
  89. Ozkan, Nasif, Sinan Cakan, and Murad Kayacan. 2016. Intellectual Capital and Financial Performance: A Study of the Turkish Banking Sector. Borsa Istanbul Review. [Google Scholar] [CrossRef]
  90. Pasiouras, Fotios, and Kyriaki Kosmidou. 2007. Factors influencing the profitability of domestic and foreign commercial banks in the European Union. Research in International Business and Finance 21: 222–37. [Google Scholar] [CrossRef]
  91. Pathan, Shams, Michael Skully, and J. Wickramanayake. 2007. Board Size, Independence and Performance: An Analysis of Thai Banks. Asia-Pacific Financial Markets 14: 211–27. [Google Scholar] [CrossRef]
  92. Patti, Emilia Bonaccorsi di, and Daniel C. Hardy. 2005. Financial sector liberalization, bank privatization, and efficiency: Evidence from Pakistan. Journal of Banking & Finance 29: 2381–406. [Google Scholar]
  93. Peng, Lee Siew, and Isa Mansor. 2015. Directors’ remuneration, governance and performance: The case of Malaysian banks. Managerial Finance 41: 26–44. [Google Scholar] [CrossRef]
  94. Pfeffer, Jeffrey, and Gerald R. Salancik. 1978. The External Control of Organizations: A Resource Dependence Perspective. New York: Harper and Row. [Google Scholar]
  95. Pulic, Ante. 1998. Measuring the Performance of Intellectual Potential in Knowledge Economy. Available online: http://www.measuring-ip.at/Opapers/Pulic/Vaictxt.vaictxt.html (accessed on 18 October 2017).
  96. Pulic. 2000. VAIC—An Accounting Tool for IC Management. International Journal of Technology Management 20: 702–14. [Google Scholar]
  97. Pulic. 2001. Value Creation Efficiency Analysis of Croatian Banks 1996–2000. Available online: www.vaic-on.net (accessed on 18 October 2017).
  98. Pulic. 2004. Intellectual capital—Does it create or destroy value? Measuring Business Excellence 8: 62–68. [Google Scholar] [CrossRef]
  99. Puntillo, Pina. 2009. Intellectual Capital and business performance. Evidence from Italian banking industry. Electronic Journal of Corporate Finance 4: 97–115. [Google Scholar]
  100. Roodman, D. 2009. How to do xtabond2: An introduction to difference and system GMM in Stata. Stata Journal 9: 86–136. [Google Scholar] [CrossRef]
  101. Saona, Paolo. 2016. Intra- and extra-bank determinants of Latin American Banks’ profitability. International Review of Economics & Finance 45: 197–214. [Google Scholar] [CrossRef]
  102. Schultz, Theodore W. 1961. Investment in human capital. The American Economic Review 51: 1–17. [Google Scholar]
  103. Shah, Syed Qasim, and Rizwan Jan. 2014. Analysis of Financial Performance of Private Banks in Pakistan. Procedia—Social and Behavioral Sciences 109: 1021–25. [Google Scholar] [CrossRef]
  104. Singh, Sukhdev, Jasvinder Sidhu, Mahesh Joshi, and Monika Kansal. 2016. Measuring intellectual capital performance of Indian banks: A public and private sector comparison. Managerial Finance 42: 635–55. [Google Scholar] [CrossRef]
  105. Smirlock, Michael. 1985. Evidence on the (Non) Relationship between Concentration and Profitability in Banking. Journal of Money, Credit and Banking 17: 69–83. [Google Scholar] [CrossRef]
  106. Staikouras, Panagiotis K., Christos K. Staikouras, and Maria-Eleni K. Agoraki. 2007. The effect of board size and composition on European bank performance. European Journal of Law and Economics 23: 1–27. [Google Scholar] [CrossRef] [Green Version]
  107. Sufian, Fadzlan. 2009. Determinants of Bank profitability in a Developing Economy: Empirical evidence from the China Banking Sector. Journal of Asia-Pacific Business 10: 201–307. [Google Scholar] [CrossRef]
  108. Sun, Poi Hun, Shamsher Mohamad, and M. Ariff. 2017. Determinants driving bank performance: A comparison of two types of banks in the OIC. Pacific-Basin Finance Journal 42: 193–203. [Google Scholar] [CrossRef]
  109. Sveiby, K. E. 1997. The New Organizational Wealth: Managing and Measuring Knowledge-Based Assets. San Francisco: Berrett-Koehler Publishers. [Google Scholar]
  110. Tan, Yong, and Christos Floros. 2012a. Bank profitability and inflation: The case of China. Journal of Economic Studies 39: 675–96. [Google Scholar] [CrossRef]
  111. Tan, Yong, and Christos Floros. 2012b. Bank profitability and GDP growth in China: A note. Journal of Chinese Economic and Business Studies 10: 267–73. [Google Scholar] [CrossRef]
  112. Tan, Yong, and Christos Floros. 2012c. Stock market volatility and bank performance in China. Studies in Economics and Finance 29: 211–28. [Google Scholar] [CrossRef]
  113. Tan, Yong. 2016. The impacts of risk and competition on bank profitability in China. Journal of International Financial Markets, Institutions and Money 40: 85–110. [Google Scholar] [CrossRef] [Green Version]
  114. Tan, Yong. 2017. The impacts of competition and shadow banking on profitability: Evidence from the Chinese banking industry. The North American Journal of Economics and Finance 42: 89–106. [Google Scholar] [CrossRef]
  115. Tan, Yong, and John Anchor. 2016. Stability and Profitability in the Chinese Banking Industry: Evidence from an autoregressive-distributed linear specification. Investment Management and Financial Innovations 13: 120–29. [Google Scholar] [CrossRef]
  116. Tan, Yong, Christos Floros, and John Anchor. 2017. The profitability of Chinese banks: Impacts of risk, competition and efficiency. Review of Accounting and Finance 16: 86–105. [Google Scholar] [CrossRef]
  117. Tanna, Sailesh, Fotios Pasiouras, and Matthias Nnadi. 2011. The effect of board size and composition on the efficiency of UK banks. International Journal of the Economics of Business 18: 441–62. [Google Scholar] [CrossRef]
  118. Ting, Irene Wei Kiong, and Hooi Hooi Lean. 2009. Intellectual capital performance of financial institutions in Malaysia. Journal of Intellectual Capital 10: 588–99. [Google Scholar] [CrossRef]
  119. Vafeas, Nikos. 1999. Board meeting frequency and firm performance. Journal of Financial Economics 53: 113–42. [Google Scholar] [CrossRef]
  120. Wang, Wen-Ying, and Chingfu Chang. 2005. Intellectual capital and performance in causal models: Evidence from the information technology industry in Taiwan. Journal of Intellectual Capital 6: 222–36. [Google Scholar] [CrossRef]
  121. Williamson, Oliver E. 1985. The Economic Institutions of Capitalism. New York: The Free Press. [Google Scholar]
  122. Windmeijer, Frank. 2005. A finite sample correction for the variance of linear efficient two-step GMM estimators. Journal of Econometrics 126: 25–51. [Google Scholar] [CrossRef]
  123. World Bank. 2003. Lifelong Learning in the Global Knowledge Economy: Challenges for Developing Countries. Washington, DC: World Bank, Available online: https://www.voced.edu.au/content/ngv:29323 (accessed on 18 October 2017).
  124. Xu, Jiang, and Binghan Wang. 2018. Intellectual Capital, Financial Performance and Companies’ Sustainable Growth: Evidence from the Korean Manufacturing Industry. Sustainability 10: 4651. [Google Scholar] [CrossRef]
  125. Yalama, Abdullah, and Metin Coskun. 2007. Intellectual capital performance of quoted banks on the Istanbul stock exchange market. Journal of Intellectual Capital 8: 256–71. [Google Scholar] [CrossRef]
  126. Yalama, Abdullah. 2013. The relationship between intellectual capital and banking performance in Turkey: Evidence from panel data. International Journal of Learning and Intellectual Capital 10: 71–87. [Google Scholar] [CrossRef]
  127. Yao, Hongxing, Muhammad Haris, and Gulzara Tariq. 2018. Profitability Determinants of Financial Institutions: Evidence from Banks in Pakistan. International Journal of Financial Studies 6: 53. [Google Scholar] [CrossRef]
  128. Yermack, David. 1996. Higher market valuation of companies with a small board of directors. Journal of Financial Economics 40: 185–211. [Google Scholar] [CrossRef]
  129. Yeung, Jim C. K. 2018. Nonlinear Effect of Board Size on Corporate Performance: Impact of the Cultural Backgrounds of Directors in Hong Kong. Asia-Pacific Journal of Financial Studies 47: 107–31. [Google Scholar] [CrossRef]
  130. Yulia, Titova. 2016. Are board characteristics relevant for banking efficiency? Evidence from the US. Corporate Governance: The International Journal of Business in Society 16: 655–79. [Google Scholar] [CrossRef]
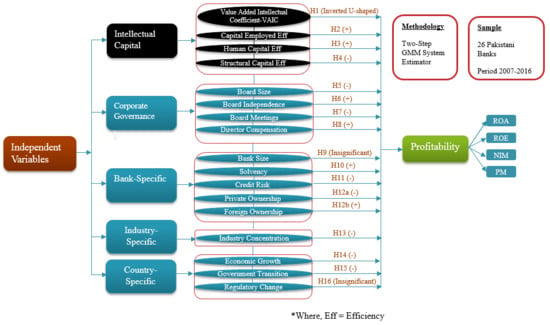
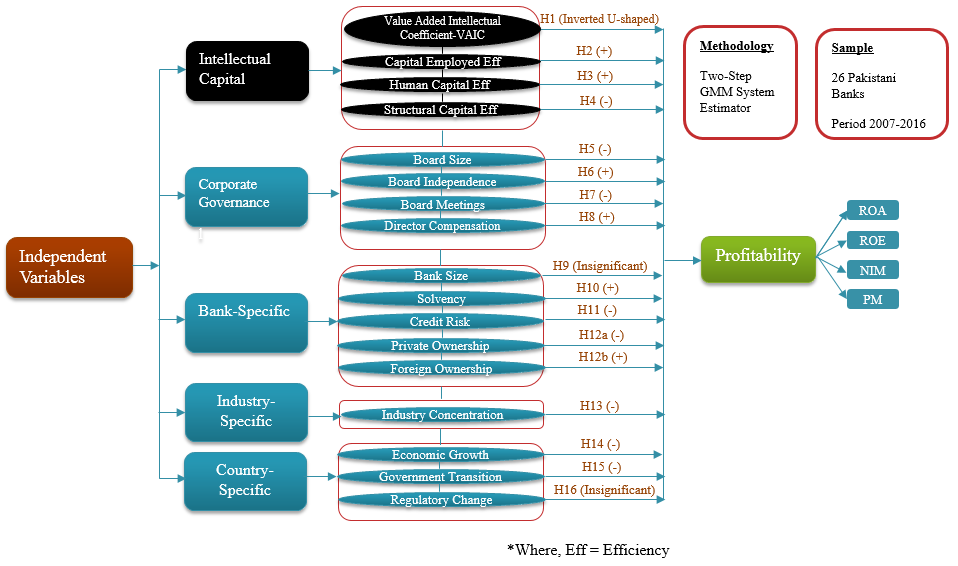
1
We use the squared value of VAIC (VAIC-SQ) to check the non-linear relationship between IC performance and profitability. The significant positive coefficients of VAIC and significant negative coefficients of VAIC-SQ affirm the inverted U-shape relationship between IC performance and profitability (see Table 5).
2
State Bank of Pakistan (SBP) is the central bank of country. All circulars can be accessed from http://www.sbp.org.pk/bpd/index.htm.
3
The Information is accessed from http://sbp.org.pk/publications/q_reviews/qpr.htm.
4
The value 1 has assigned to the year 2008–2009 (transition from Pakistan Muslim League-Qaid to Pakistan People Party) and has also been assigned to the period 2013–2014 (transition from Pakistan People Party to Pakistan Muslim League Noon) and 0 otherwise.
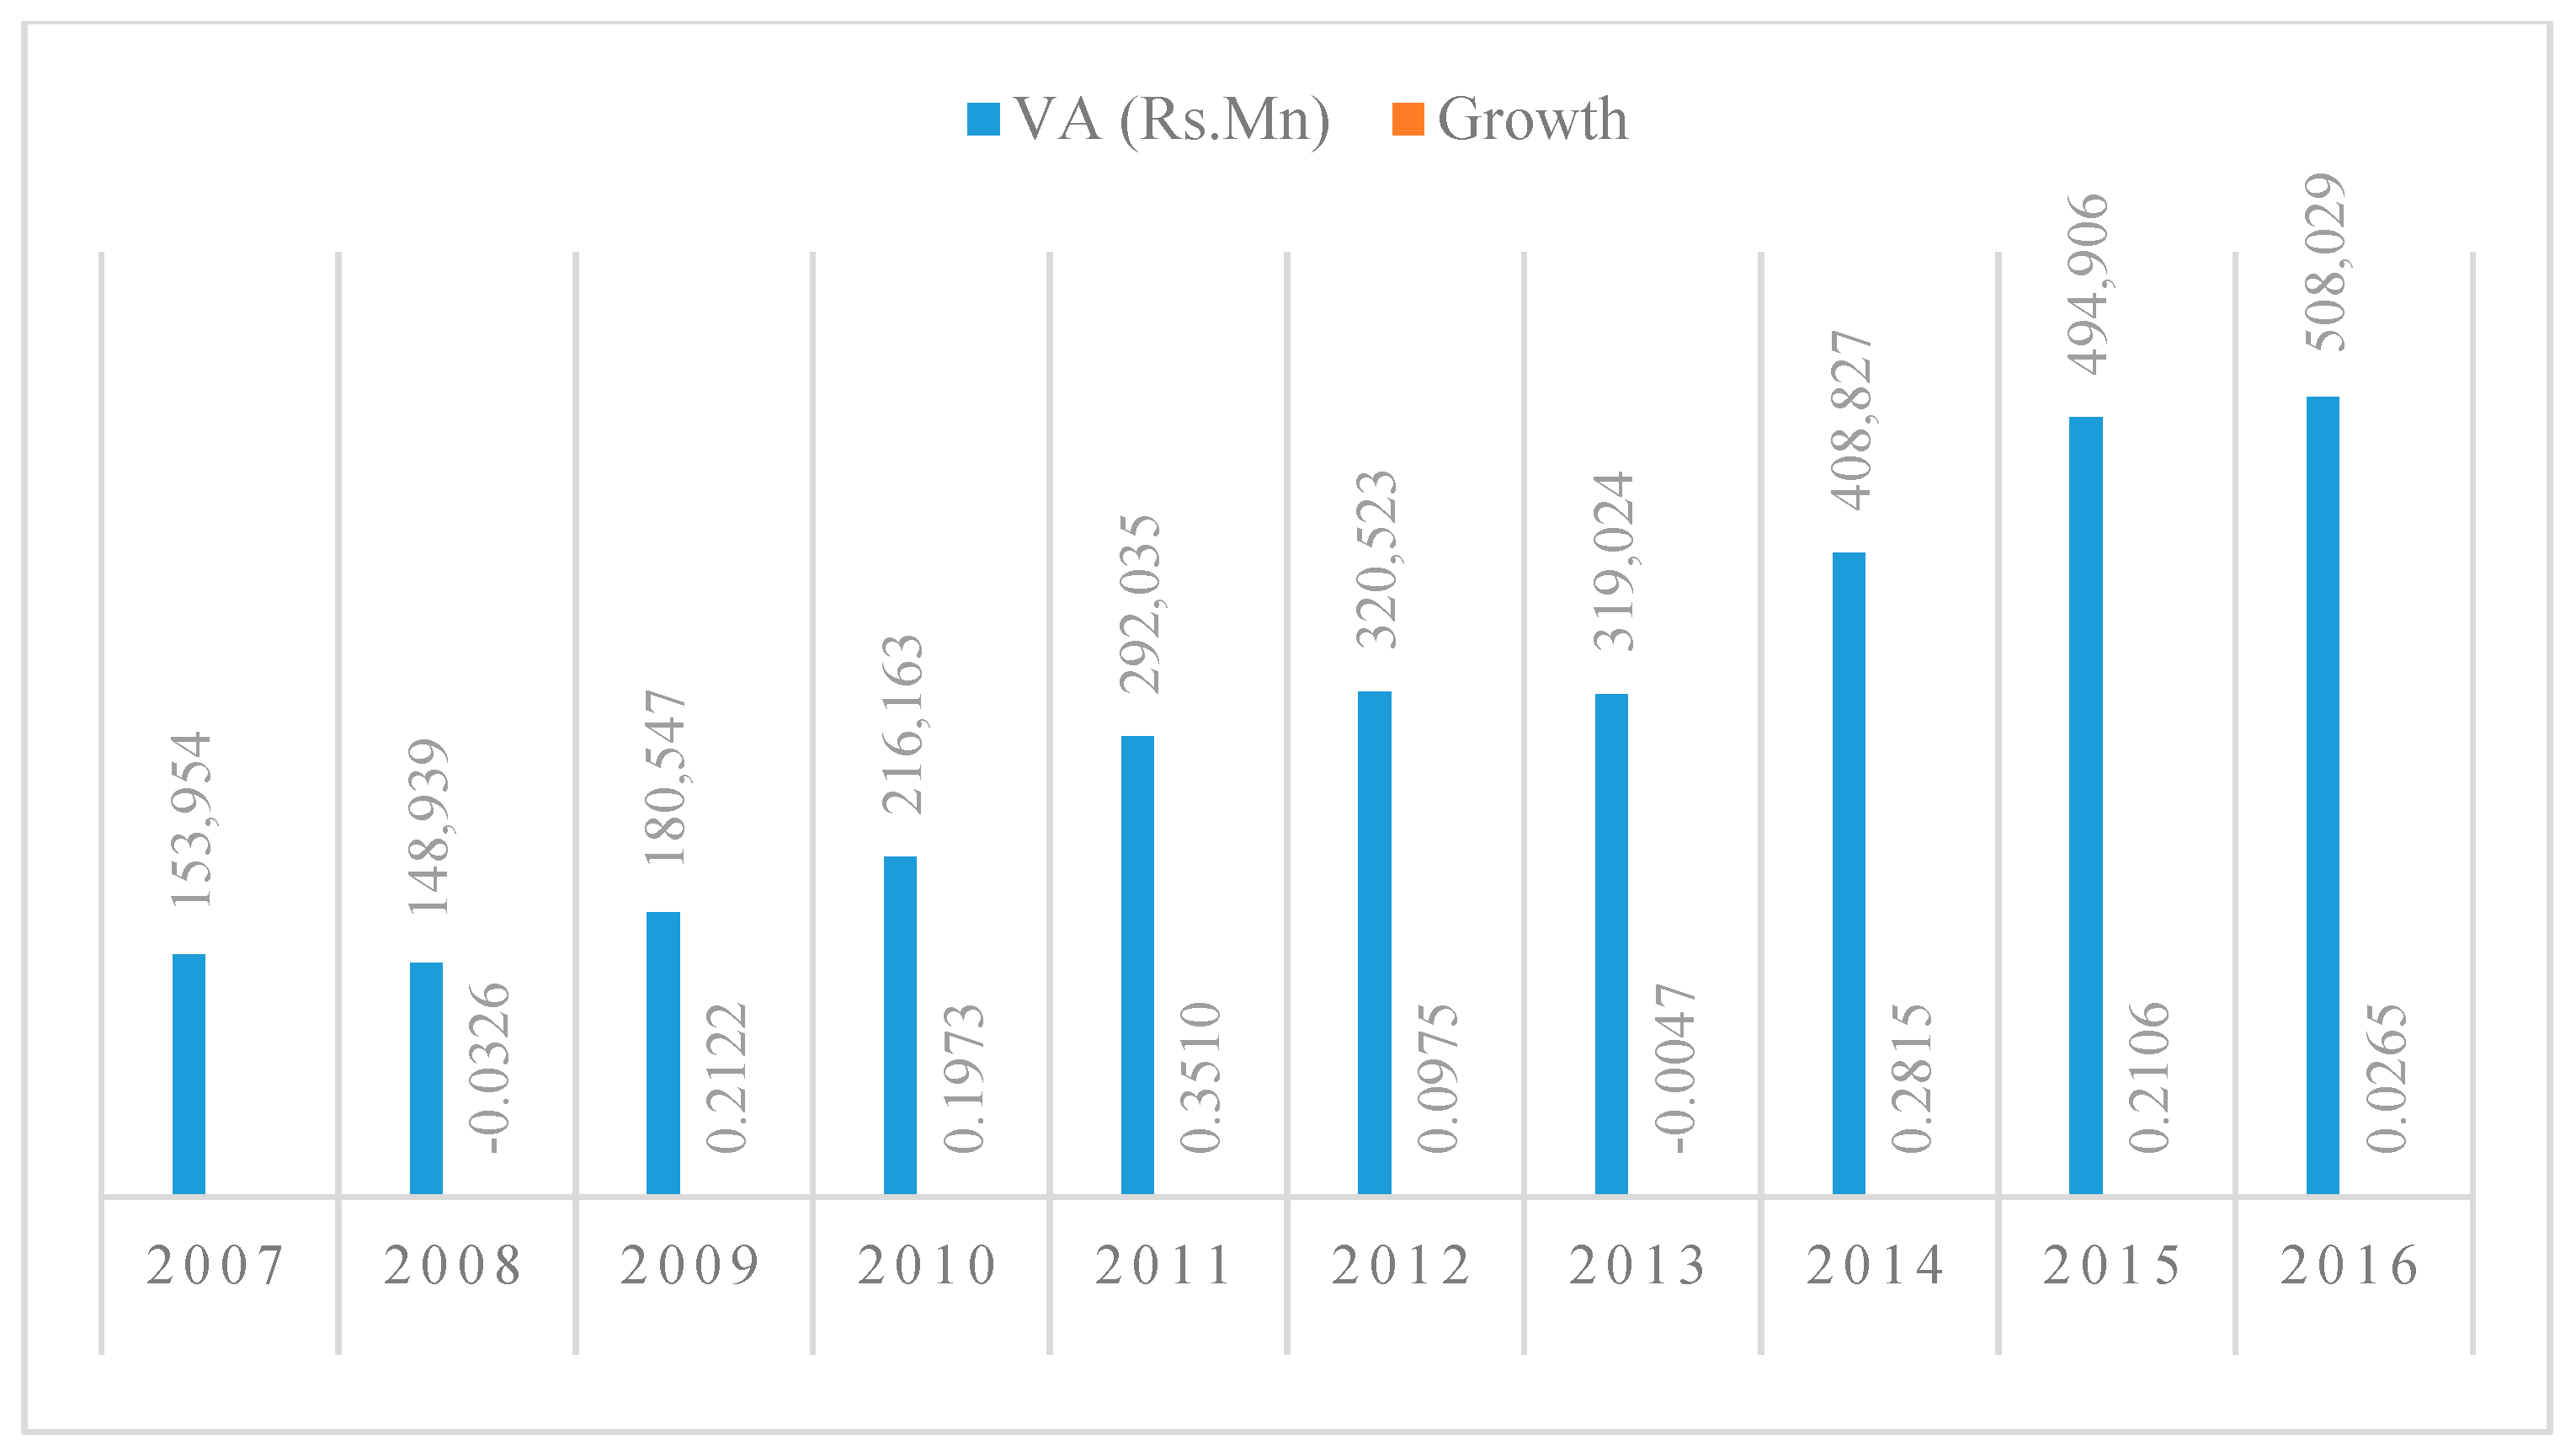
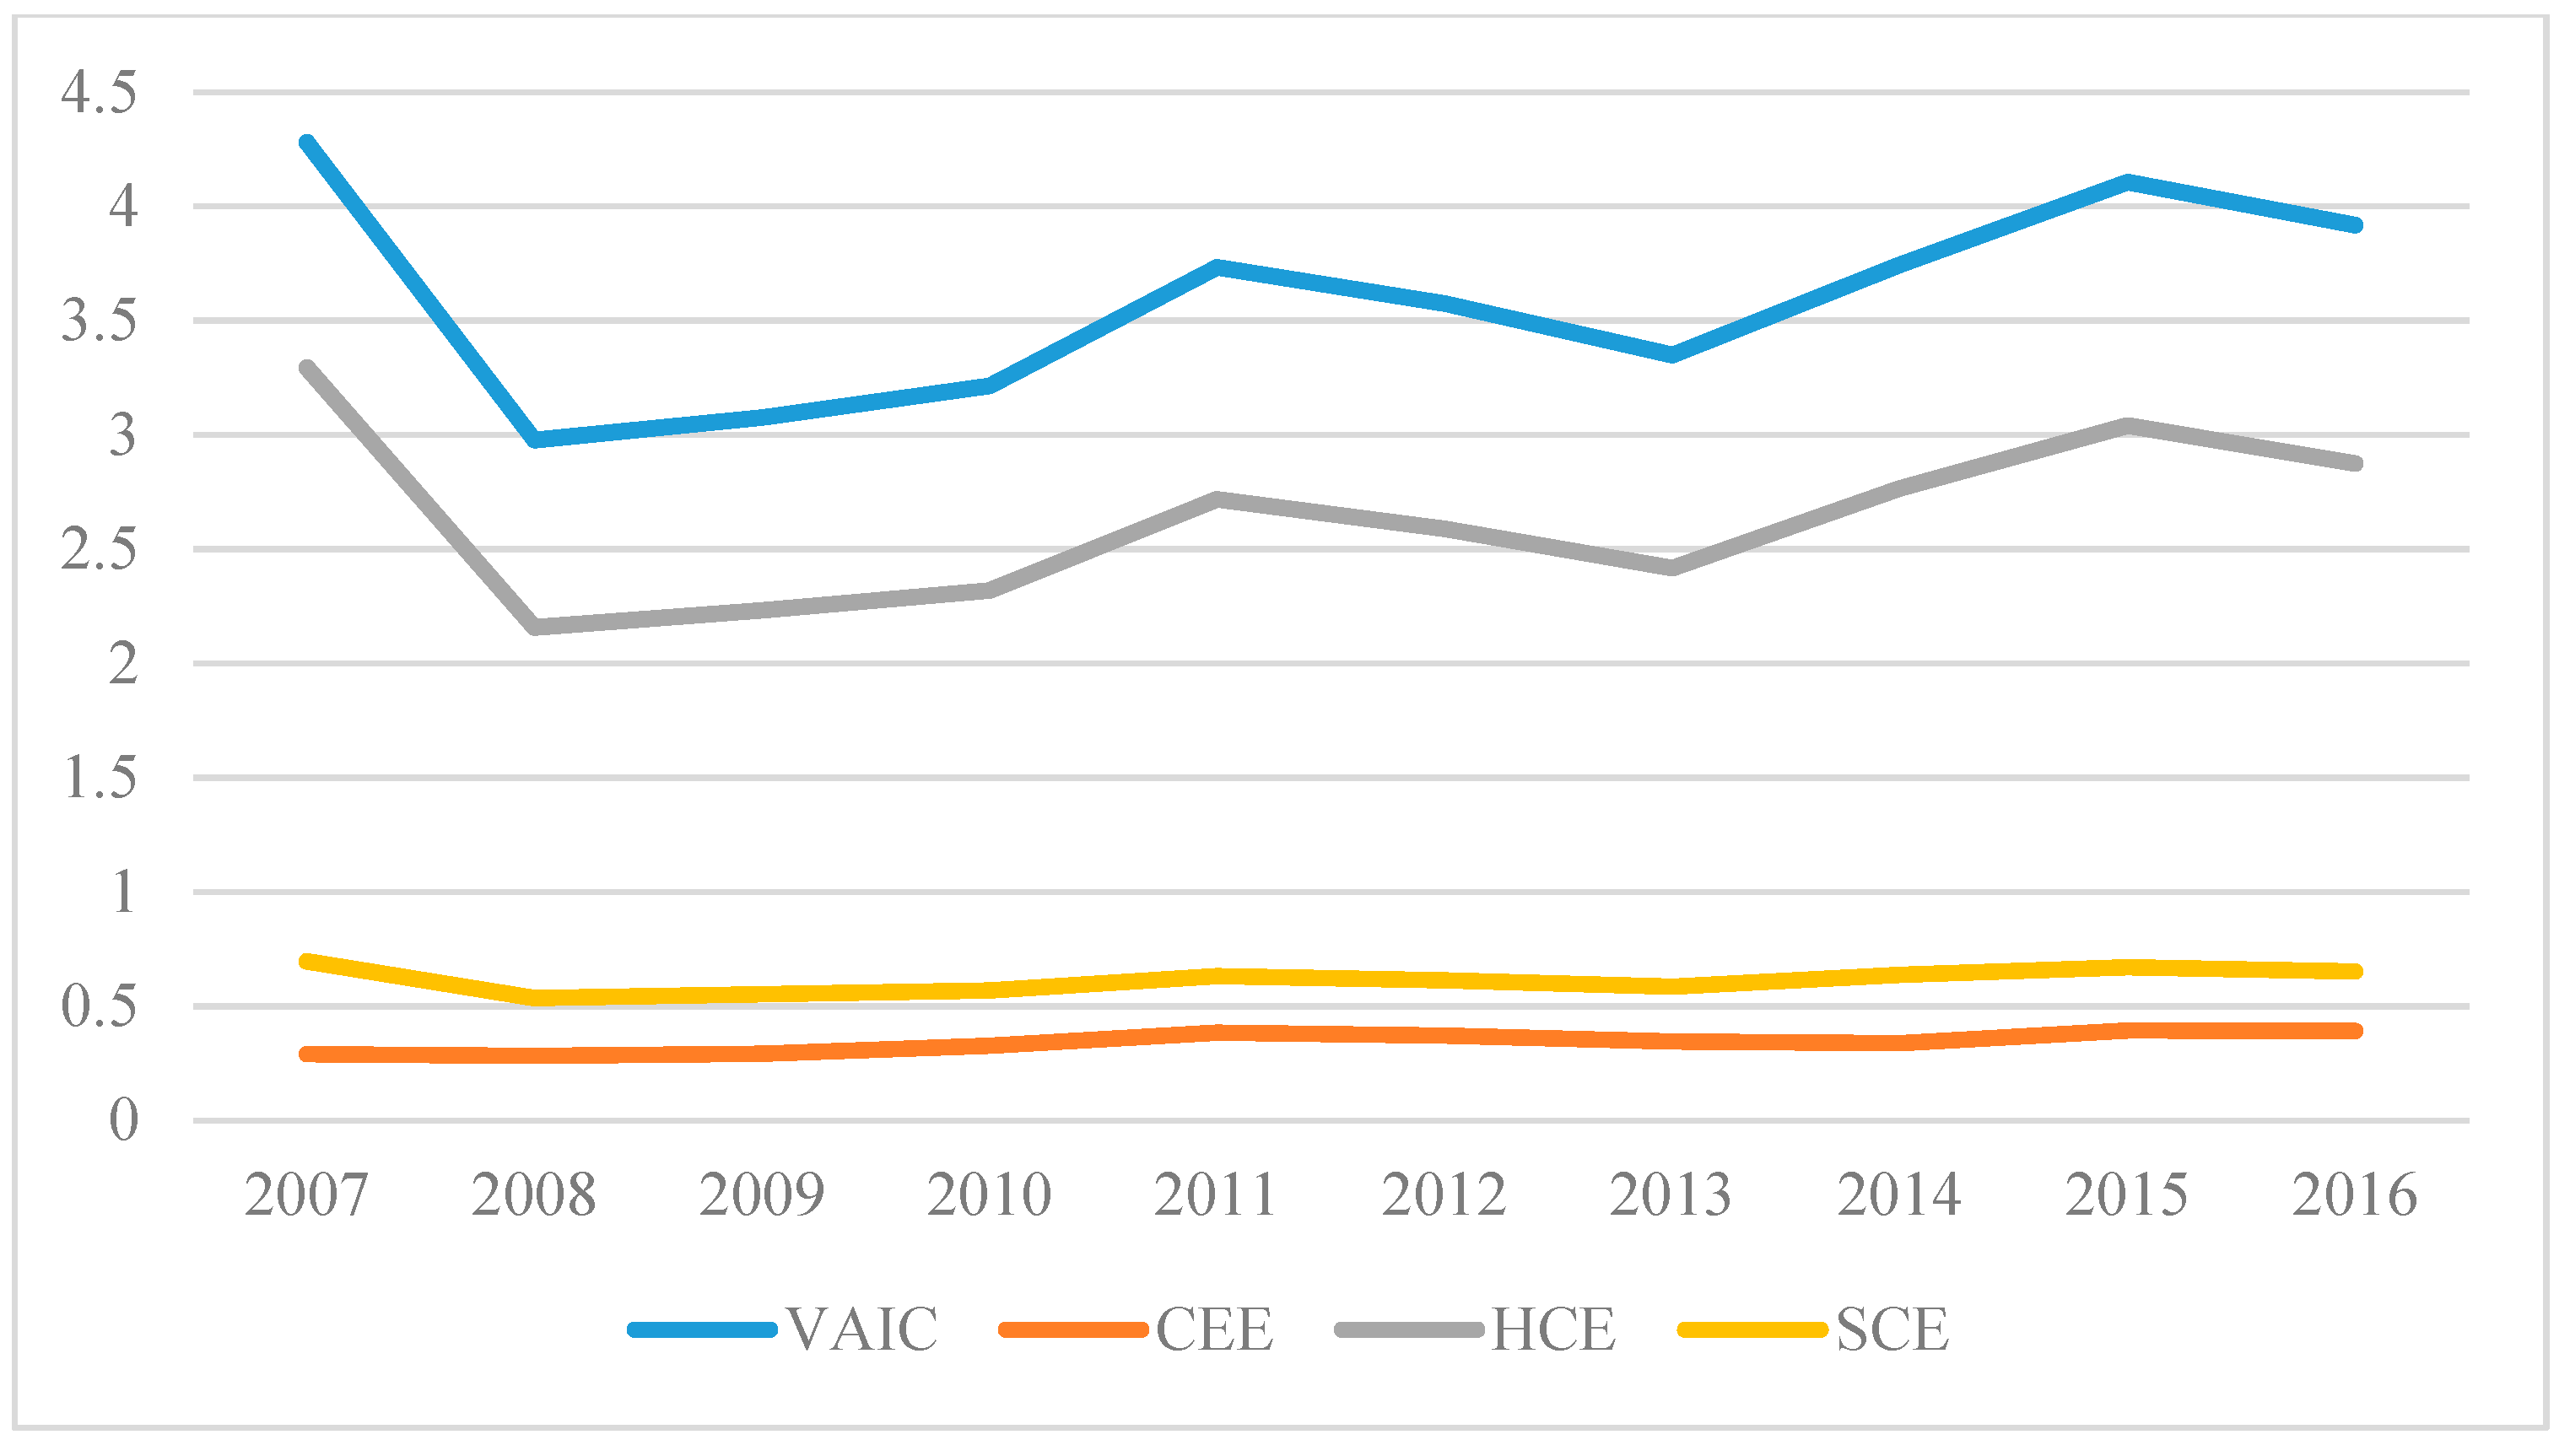
Figure 1. Value-added and value-added growth during the period from 2007 to 2016. Source: compiled by authors.
Jrfm 12 00056 g001
Figure 2. The trend of VAIC and its components (CEE, HCE, and SCE) from 2007 to 2016. Source: compiled by authors.
Jrfm 12 00056 g002
Table 1. Trend in value added intellectual coefficient (VAIC)TM and its components of the Pakistani banking industry.
YearVAICCEEHCESCEVA (Rs.MN)VA-Growth
20074.28050.28973.29430.6964153,954-
20082.97740.28332.15760.5365148,939−0.0326
20093.07660.29172.23280.5521180,5470.2122
20103.21440.32732.31840.5687216,1630.1973
20113.73370.38422.71750.632292,0350.3510
20123.57440.37212.58860.6137320,5230.0975
20133.34980.34552.41790.5864319,024−0.0047
20143.74370.33932.7660.6385408,8270.2815
20154.10580.39413.04060.6711494,9060.2106
20163.91860.39262.8740.652508,0290.0265
2007–20163.59750.34202.64080.6147
Notes: VAIC, Value added intellectual capital coefficient; CEE, Capital employed efficiency; HCE, Human capital efficiency; SCE, Structural capital efficiency; VA, Value-added. Period 2007–2016 represents average results. VA-Growth represents the annual growth in value added of banking industry. The negative VA growth during the year 2008 and 2013 was due to the government elections in Pakistan. Source: compiled by authors.
Table 2. List of variables.
VariablesNotationDescriptionExpected Results
DEPENDENT
Return on AssetsROAProfit after tax to average assets
Return on EquityROEProfit after tax to average equity
Net Interest MarginNIMInterest income-interest expense/average earning assets
Earning assets defined as investment, advances, and lending to financial institutions
Profit MarginPMProfit before tax to average assets
INDEPENDENT
Intellectual Capital
Value Added Intellectual CoefficientVAICSee Equation (1)+/−
Capital Employed EfficiencyCEESee Equation (3)+
Human Capital EfficiencyHCESee Equation (4)+
Structural Capital EfficiencySCESee Equation (5)+/−
Corporate Governance
Board SizeBODSIZELogarithm of total number of board members+/−
Board IndependenceBINDIndependent directors to total members in a board+
Board MeetingsBMEETsLogarithm of total board meetings held in a year+/−
Director CompensationDCOMPLogarithm of total compensation paid to the board of directors +
Bank-Specific
Bank SizeBSIZELogarithm of total assets+/−
SolvencySOLVTotal shareholder’s equity to total assets+
Credit RiskRISKTotal loan loss provisions to total advances-
Bank TypeBTYPEEquals to 1 if a bank is private owned and 0 otherwise+/−
Foreign OwnershipFOWNEquals to 1 if a bank represent any foreign ownership and 0 otherwise+/−
Industry-Specific
Industry ConcentrationIC5Ratio between the total assets of largest five banks and total assets of all domestic banks-
Country-Specific
Economic GrowthGDPRAnnual percent change in the gross domestic product of the country+/−
Regulatory ChangesREGCEqual to 1 if any regulatory change (2013–2016) and 0 otherwise+
Government Change GOVEqual to 1 if the government transition (2008–2009 & 2013–2014) and 0 otherwise-
Note: The five large banks include Habib bank limited, National bank of Pakistan, United bank limited, Allied bank limited, and MCB bank limited, which collectively hold a 52.57% share of assets. Source: compiled by authors.
Table 3. Unit root test (Augmented Dickey Fuller-ADF).
Bank Specific VariablesIntellectual Capital VariablesCorporate Governance VariablesIndustry & Country-Specific Variables
Coef.PV Coef.PV Coef.PV Coef.PV
ROA206.8240.000VAIC210.6370.000BODSIZE116.9990.000IC5134.5010.000
ROE134.0980.000CEE135.9120.000BIND109.6830.000GDPR108.5270.000
NIM106.2540.000HCE203.6610.000BMEETs168.9460.000REGC68.9730.038
PM146.7660.000SCE122.4710.000DCOMP229.1660.000GOV95.4260.000
BSZIE148.3180.000
CAP202.4710.000
RISK109.3750.000
BTYPE71.0240.017
FOWN115.5330.000
Source: compiled by authors.
Table 4. Correlation Matrix.
VAICCEEHCESCEBODSIZEBINDBMEETSDCOMPBSIZECAPRISKBTYPEFOWNIC5GDPRREGCGOVVIF
VAIC1.000 1.33
CEE0.328 ***1.000 1.40
HCE0.937 ***0.285 ***1.000 1.30
SCE0.381 ***−0.134 **0.0561.000 1.64
BODSIZE0.211 ***−0.1010.175 ***0.197 ***1.000 1.40
BIND−0.0430.076−0.059−0.004−0.189 ***1.000 1.42
BMEETs−0.136 **−0.226 ***−0.134 **0.039−0.157 **0.303 ***1.000 1.50
DCOMP0.241 ***0.140 **0.191 ***0.155 **0.245 ***0.145 **−0.0191.000 2.26
BSZIE0.3550.151 **0.270 ***0.278 ***0.317 ***0.1020.156 **0.585 ***1.000 2.31
CAP−0.010−0.141 **0.019−0.022−0.0910.208 ***−0.029−0.273 ***−0.346 ***1.000 1.38
RISK−0.288 ***0.142 **−0.145 **−0.506 ***−0.341 ***0.025−0.018−0.197 ***−0.343 ***−0.0221.000 1.40
BTYPE0.157 **0.0880.111 *0.135 **0.313 ***−0.163 **−0.387 ***0.426 ***0.235 ***−0.188 ***−0.265 ***1.000 1.89
FOWN−0.011−0.029−0.0440.0860.097−0.182−0.348 ***0.346 ***−0.0070.013−0.720.496 ***1000 1.66
IC50.016−0.152 **0.0430.008−0.003−0.164 **−0.058−0.226 ***−0.197 ***0.102−0.0550.030 1.000 2.12
GDPR0.112 *0.228 ***0.113 *−0.0480.0210.217 ***0.0050.212 ***0.167 ***−0.0410.088−0.044 −0.140 **1.000 4.32
REGC0.0200.204 ***0.018−0.062−0.0090.267 ***0.0100.278 ***0.231 ***−0.104 *0.108 *−0.051−0.084−0.525 ***0.740 ***1.000 6.41
GOV−0.093−0.136 **−0.0900.007−0.0520.007−0.046−0.076−0.0640.057−0.016−0.006 0.079−0.160 ** 1.0001.70
Notes: ***, **, * are indicating the significance level at 1%, 5%, and 10% respectively. Source: compiled by authors.
Table 5. Summary Statistics.
Variable Obs.MeanStd. Dev.MinMax
ROA2510.0050.019−0.0920.044
ROE2510.0480.248−2.0300.334
NIM2510.0430.019−0.0200.100
PM2510.0090.025−0.0950.060
VAIC2473.0154.271−12.04553.444
CEE2470.2910.529−3.9994.578
HCE2472.2933.769−9.15552.050
SCE2470.4331.493−11.1625.287
BODSIZE2422.1150.1951.3862.565
BIND2390.2690.21300.875
BMEETs2361.8150.3120.6932.833
DCOMP24710.8070.8328.04512.839
BSZIE25119.0231.30615.48321.596
CAP2510.1110.0790.0020.762
RISK2470.1370.25901.912
BTYPE2510.7570.43001
FOWN2510.4340.49701
IC52510.5400.0120.5250.562
GDPR2513.7091.3351.6075.741
REGC2510.4140.49401
GOV2510.3980.49401
Notes: The few variables have lower number of observations due to the missing values of some banks during some years, mostly 2007 and 2008. Only 60 values are missing, which are 1.26% of the 4769 total values. However, we use generalized method of moments (GMM) with orthogonal deviation that produces consistent and unbiased estimates in case of missing values (Arellano and Bover 1995). Source: compiled by authors.
Table 6. GMM results.
ROAROENIMPM
12121212
DEPt − 10.554 ***
(0.198)
0.607 ***
(0.195)
0.276 ***
(0.057)
0.252 ***
(0.088)
0.644 ***
(0.130)
0.449 **
(0.172)
0.317 ***
(0.088)
0.317
(0.207)
VAIC0.007 ***
(0.002)
0.051 ***
(0.016)
0.003 ***
(0.001)
0.007 ***
(0.002)
VAIC-SQ−0.001 **
(0.000)
−0.005 ***
(0.002)
−0.001 **
(0.000)
−0.001 ***
(0.000)
CEE 0.008
(0.009)
0.138 **
(0.064)
0.006 ***
(0.002)
0.015 *
(0.008)
HCE 0.006 **
(0.003)
0.040 *
(0.024)
0.002 ***
(0.001)
0.004 **
(0.002)
SCE 0.006
(0.005)
0.100
(0.061)
−0.002 **
(0.001)
−0.003 *
(0.002)
BODSIZE−0.071 ***
(0.024)
−0.053 **
(0.025)
−0.335 **
(0.157)
−0.489 *
(0.262)
0.001
(0.022)
−0.012
(0.015)
−0.044 *
(0.024)
−0.040 *
(0.023)
BIND0.006
(0.011)
0.006
(0.014)
0.180 **
(0.083)
0.162
(0.164)
−0.007
(0.007)
−0.011
(0.007)
−0.008
(0.009)
0.003
(0.011)
BMEETs−0.021 **
(0.008)
−0.022 ***
(0.007)
0.022
(0.127)
−0.100
(0.135)
0.001
(0.011)
0.009
(0.010)
−0.017 **
(0.008)
0.023
(0.014)
DCOMP−0.005
(0.004)
−0.005
(0.003)
−0.118
(0.123)
−0.252
(0.198)
0.002
(0.005)
0.009 **
(0.004)
−0.005
(0.005)
−0.003
(0.012)
BSIZE−0.005
(0.005)
−0.005
(0.004)
0.049
(0.054)
0.040
(0.074)
0.002
(0.003)
−0.003
(0.003)
0.001
(0.004)
0.004
(0.006)
CAP−0.029
(0.021)
0.003
(0.023)
0.320
(0.511)
0.278
(0.536)
0.051 ***
(0.017)
0.055 **
(0.025)
0.024 **
(0.012)
0.007
(0.021)
RISK−0.068 **
(0.033)
−0.057 *
(0.032)
−0.966 ***
(0.151)
−1.360 ***
(0.350)
−0.004
(0.032)
−0.058 ***
(0.012)
−0.055 **
(0.022)
−0.068 ***
(0.021)
TYPE0.004
(0.012)
−0.010
(0.009)
−0.049
(0.355)
0.305
(0.179)
−0.010
(0.009)
−0.021*
(0.012)
−0.021 **
(0.008)
−0.010
(0.019)
FOWN−0.005
(0.012)
−0.001
(0.012)
0.367 **
(0.134)
−0.045
(0.144)
−0.004
(0.013)
−0.008
(0.018)
−0.001
(0.008)
0.008
(0.013)
IC50.125
(0.144)
0.350
(0.200)
−3.476 **
(1.478)
−0.972
(1.418)
−0.432 ***
(0.156)
0.036
(0.140)
0.198
(0.161)
−0.056
(0.107)
GDPR0.005
(0.005)
0.001
(0.004)
0.016
(0.024)
−0.029
(0.055)
−0.003 **
(0.001)
0.000
(0.002)
−0.004 *
(0.002)
−0.001
(0.002)
REGC−0.013
(0.015)
−0.002
(0.008)
−0.088
(0.058)
0.109
(0.111)
−0.001
(0.006)
−0.010
(0.009)
0.012
(0.007)
−0.004
(0.010)
GOV.−0.014 **
(0.007)
−0.020 ***
(0.007)
−0.064
(0.039)
−0.158 ***
(0.048)
0.009
(0.006)
0.001
(0.002)
−0.008 *
(0.004)
−0.010 *
(0.005)
Const.0.278 *
(0.127)
0.094
(0.104)
2.778 **
(1.370)
3.557 *
(1.907)
0.208 **
(0.079)
−0.004
(0.010)
0.016
(0.069)
0.044
(0.081)
Obs.210210210210211213211213
Banks2626262626262626
Instrument2526262625262626
F-statistics21.26 ***41.92 ***57.72 ***99.43 ***190.74 ***150.10 ***165.69 ***57.41 ***
AR-1 (p-value)−1.43(0.153)−1.35(0.178)−0.67(0.502)−1.22(0.222)0.02(0.985)−2.11(0.035)−1.74(0.082)−1.51(0.131)
AR-2 (p-value)−0.47(0.641)−0.79(0.428)−0.67(0.502)−1.15(0.251)0.53(0.597)−1.06(0.288)0.74(0.457)−0.38(0.703)
Hansen-J (p-value)5.65(0.686)4.82(0.776)2.90(0.968)3.06 0.931)7.62(0.471)2.36(0.968)3.15(0.958)4.94(0.764)
C-statistics (p-value)1.81(0.614)1.50(0.682)0.75(0.860)0.55(0.909)3.57(0.311)1.76(0.623)0.31(0.959)1.88(0.597)
Notes: The study applied GMM two-step system estimator with orthogonal deviation. The Windmeijer (2005) robust standard errors are in parenthesis. ***, **, * are indicating the significance level at 1%, 5% and 10% respectively. Following Yao et al. (2018), Athanasoglou et al. (2008), Farag et al. (2017) and Andres and Vallelado (2008), It uses board size and capitalization as the endogenous variables and instrument them with different lag-lengths (3–5) along with the lagged of profitability measures. The significant p-values of F-statistics indicate the joint significance of the model. AR-1 is the results of Arellano-Bond first order autocorrelation while AR-2 is the second order autocorrelation. The insignificant p-values of AR-2 lead to accept the null of no autocorrelation. The insignificant p-value of Hansen-J statistics addresses the over-identifying restrictions under the null of joint validity of exogenous instruments. The insignificant p-values of Difference-in-Hansen test as the C-statistics lead to accept the null of exogeneity of the full instrument subset. DEPt − 1 refers to one year lag of dependent variables and VAIC-SQ refers to squared term of VAIC. Source: compiled by authors.

