1. Introduction
Dated back to antiquity, management control plays a significant role in ensuring the financial viability of a company, and economic stability in a country. The first empirical models of control in such big companies as Ford, General Motors, Du Pont Company, and later at General Electric, laid the foundation of the universal theory of scientific management, and later, other theories in the field. Also, it supported the research of R. Anthony and R. Simons, developed at Harvard Business School. A significant contribution was brought about by a set of laws adopted during specific stages of economic development, usually after economic crises—Companies Act of 1862, Securities Exchange Act of 1934, Sarbanes-Oxley Act of 2002. After analysing the causes that generated the need to implement these regulations, we observe that the first one appeared against a background of discontent of English colonists. The Securities Exchange Act of 1934 contributed to the elimination of deficiencies of the economic crises of 1929–1933, and the historical context of the SOX law originated in the wave of scandals around big companies around 2000.
New approaches in science focus on the relations between accounting and management using a set of notions of systemic value. Specific financial and accounting information are needed in order to make any decision. Cost calculation and distribution methods refer to the functions of managerial accounting, and their use in the decision-making process becomes a function of the executive management. Accounting through the range of information it provides is involved in managerial decision-making. It is no longer viewed only as a technical tool for providing information but rather as in-company decision making. So, considering that both theoretical and practical issues are company-driven, then the main idea stems from the following research question: What is the theoretical background, and which are the factors that influence management control processes?
The answer to theoretical grounding is provided by theory, and the pragmatic approach investigates the factors influencing management control. The existence of management control theories shows how deep the matter has been studied. We analysed from a traditional perspective the agency, transactional costs and contingency theories. The resource-based, institutional, planned behaviour and upper echelons theories refer to modern approaches to management control.
Behavioural theories are the newest approaches in science, investigating the relations among management control, management strategies and company performance. In addition, the systemic view generated the expansion of the field of study. Management control has been defined as all procedures implemented by the executive management to achieve its strategic goals. For this purpose, the empirical analysis of the degree of influence of various factors on management control should include the following factors: control environment, management strategies and budgetary system, operational control and company performance.
2. Literature Review
Over time, literature in the field confirmed that the issue of control has been one of the most researched topics. In antiquity, control was known as a verification of collections to the state budget. Later, there appeared to be a need to check the operations of big companies and colonies. Pragmatically, control has been first recorded in Ancient Greece, and theoretically, the first studies appeared during feudalism, and later in capitalism. At the beginning of the 20th century, significant changes occurred in its evolution. The results of the period were reflected in the studies of
Taylor (
1911),
Fayol (
1949) and in the research of other authors.
Demartini (
2014) presents control as the “central idea” of scientific management (
Copley and Taylor 1923;
Giglioni and Bedeian 1974;
Person 1929). Therefore, Copley and
Taylor (
1923) and
Locke (
1982) believe that Taylor had introduced a system of accounting and costs back in 1893.
Even if at the beginning of the 20th century, management control was viewed as a centralised function of management (
Demartini 2014;
Lichtner 1924;
Holden et al. 1941;
Rowland 1947) together with other authors, the meaning of management control including the planned control was extended. H. Fayol in his treatise of 1916 (
Fayol 1949) entitled: Administration industrielle et Générale, developed the universal theory of management. He included management control to the six company functions: technical, commercial, financial, security, accounting and management. He cautioned that the management function is executive and is included into the six functions of enterprise government that should not be confused with government (
Dunlevy 1965).
Viewed as a reference author in the field of management control,
Anthony (
1988) used the notion of “management control”. He formulated three definitions. In the version of 1988, management control was seen as: “the process by which managers influence other members of an organization to implement their strategies”.
Simons (
1994,
2000) continued Anthony’s initial research at Harvard Business School, defining management control as a set of mechanisms and instruments needed by the manager in decision-making and operations. Management control involves two dimensions: an economic and a strategic one. The first involves the selection and design of operating procedures needed for reaching the objectives. The second dimension refers to organizational and psycho-social factors by which individuals are guided in their actions complying with the operational standards (
Cappelletti 2008).
Boisselier et al. (
2013) observed the following lines of research in the evolution of management control:
First (
Anthony 1988) is a technical view oriented towards utility;
second (
Grenier 1990) is a larger view where the effects of control reflect a function of managerial behaviour.
Review of various theoretical approaches to management control underlines its significance in delivering information useful for managers and employees in managing the company. Also, we should observe that even if until the end of the 19th century management control had been studied form the perspective of accounting, starting with the 20th century, it should be viewed as an academic discipline having a pragmatic approach as it helps managers in implementing their strategies. Its efficiency, effectiveness and economy is related to the scarcity of resources that should be combined properly in order to reach the objectives.
The appearance of a wide range of management control theories was a good occasion to solve problems related to its disciplinary belonging: management or accounting. Most researchers state that the origins of management control are grounded in the neoclassical economic theory.
Bouquin and Pesqueux (
1999) noted two significant theories: agency and rational anticipation theory. Agency theory presents the life of homo economicus through shareholders and top management. Rational anticipation theory is newer and guarantees to the appointed executive manager the decision-making right, achieving a rational correlation between forecasts and pre-set objectives (
Bouquin and Pesqueux 1999).
In reviewing organizational control theories,
Demartini (
2014) noted two main lines of research. The first one provides a socio-political and a corporate governance perspective, and the second one refers to company management behaviour at all levels. Moreover, Arrow’s definition of organizational control (
Arrow 1964) was interpreted by
Cyert and March (
1963) from two viewpoints: “operating rules” and “enforcement rules”. Operational rules refer to the structure of the accounting computer system and affect all employees that have to do their tasks. Enforcement rules refer to behaviour of managers, and ways used to motivate them in reaching organizational objectives. In this sense, management control is seen as a combination of individual and organizational goals (
Demartini 2014;
Cyert and March 1963;
Ouchi 1979;
Flamholtz 1996). Therefore,
Demartini (
2014) divided organizational control theories into four categories: economic, sociological, psychological and behavioural. The first two refer to traditional approaches:
Economic theories: agency and transactional cost theory;
Sociological theories: contingency theory, general theory on systemic approach.
Psychological and behavioural theories have been viewed as elements of modern approaches.
Agency theory appeared in the late 60s and early 70s.
Eisenhardt (
1989) noted two types of problems that this theory wanted to solve. The first type aims to solve conflicts between the principal and the agent caused by different objectives and desires, as well as difficulties that appear when the agent is verified by the principal. The second type refers to risk-sharing when the principal and the agent have or practice different attitudes towards risk. Finally,
Eisenhardt (
1989) and
Jensen (
1983) stated that these problems lead to similar analysis underlining the two dimensions: principal-agent theory and the positivist theory.
In the early 70s of the 20th century, Williamson, in his research, tried to improve the flaws of the firm theory provided by neo-classicists. Dominated by the ideas of institutional economy, he started from research of Coase, Barnard and Commons stating that during 1940–1970, the firm was seen as a function of production. Using the contributions of Coase, Commons, Arrow and Chandler to legal issues in contracts, he brought his contribution to the development of transaction cost theory (
Coriat and Weinstein 1995;
Essoua 2006). However, Williamson’s greatest contribution to science was the fact that he opted for hierarchical-functional structure of a firm in a multi-divisional M-form. It is characterised by a centralised structure for strategic planning, resource allocation and the control of autonomous operational divisions (
Essoua 2006;
Williamson 1994). The aim of M form is to reduce the discretionary power of department leaders that could generate negligence in operations, pursuing personal interests and compromises. By emphasizing the new hierarchical-functional structure of a firm, Williamson wanted to eliminate the flaws of U-form developed earlier by F. Taylor.
Coase carried out a set of studies on transaction cost theory, in which he stated that “the entrepreneur should fulfil his duties with the lowest cost considering that he should obtain factors of production at the lowest transaction cost on the market … as he can always return to the free market if he does not manage to get the best price” (
Demartini 2014;
Coase 1937). This suggests that a manager should be assessed by his ability to conclude contracts at lower prices than on the market. Also, he should be cautious as any time in case of failure, he should be able to return to the market.
Demartini (
2014) and
Fama (
1980) state that in investigating the transaction costs, the firm could be seen as a “nexus of contracts”. Therefore, the notion of company property is irrelevant and is just a condition for the firm existence. The focus is placed on the executive manager who should take important decisions regarding allocation of resources. Also, we may note the separation of risk bearers from holders of decision-making rights, or business owners from decision-makers.
Probably, Otley in his studies was inspired by the ideas of
Etzioni (
1969) or
Demartini (
2014), who argued that social systems cannot function as a computer system, except in the case when their interests and values match. Similarly,
Lawrence and Lorsch (
1967) stressed out that company performance depends on the compatibility between organizational variables and environmental features. Most recent studies maintain Otley’s main idea. For instance, in the analysis of factors influencing the structure of internal control,
Jokipii (
2010) foresaw four main features of contingency features: strategies, company size, organizational structure and perceived uncertainties about the environment.
Therefore, the agency, transaction cost and contingency theories are the traditional theoretical grounding of management control. Before the appearance of these theories, researchers faced a great number of problems related to the place of management control; some insisted that it is linked to management, whilst others believed it is a matter of accounting. The company is the core of these theories, and their theoretical foundation is centred around the relations among the main actors involved in reaching a company’s goals. It is true that at the macroeconomic level, this approach has been scrutinized. Modern management control theories play the role of finding solutions at the macroeconomic level.
The tradition continues also in the 21st century but the mainstream research converges to other values. In this sense, we have presented resource-based, institutional, planned behaviour and upper echelon theories. According to
Braganza et al. (
2013),
Wernerfelt (
1984),
Peteraf (
1993) and
Hart (
1994), the resource-based theories look at management control from the performance perspective. The institutional theory has a broader scope, making reference to the macroeconomic level, and it appeared due to criticism made to macroeconomic theories.
Herremans and Nazari (
2016) proved that the institutional theory helps understand organizational behaviour in the context of cultural norms and cognitive structures scrutiny (
Aupperle et al. 1985;
McGuire et al. 1988). Also, other researchers divided institutional influences into three categories: regulatory, normative and cultural-cognitive. The regulating influence imposes specific pressure, the company being forced to handle its rules and behaviour in order to reach the highest standards. The normative influence is related to company’s reaction to the pressure of clients, multitude of norms, and requirements of other companies. Some researchers argue that these three categories of influence operate separately, and contend that cognitive influence produce a transfer of “conscious to the unconscious” (
Herremans and Nazari 2016;
Aupperle et al. 1985;
Donaldson and Preston 1995;
Thornton and Ocasio 1999,
2008). Similarly,
Herremans and Nazari (
2016) and
Thornton and Ocasio (
1999,
2008) explain organizational influences based on organizational logic, stating that these operate rather together than separately. Therefore, organizations perceive messages in their own way, and respond differently to pressure due to differences in values and beliefs (
Herremans and Nazari 2016;
Thornton and Ocasio 1999,
2008;
Friedland and Alford 1991;
Herremans et al. 2009;
Jackall 1988;
Suddaby and Greenwood 2005).
The theory of planned behaviour was developed by
Ajzen (
1985,
1991) and
Heinsman et al. (
2006), being viewed as the successor of the theory of reasoned action (
Heinsman et al. 2006;
Fishbein and Icek 1975). According to the theory of reasoned action, human behaviour is influenced by the intention of people. These intentions are influenced by the attitudes towards that behaviour, and by the perceived social pressure. Starting from the ideology of the planned behaviour theory, understanding behaviour through control, easiness or perception, or difficulty to model behaviour, are the three determining factors of human behaviour (
Heinsman et al. 2006;
Ajzen and Fishbein 1980). Finally, the actual estimation of managerial skills should be made considering the following three elements (
Heinsman et al. 2006):
Positive or negative result of managerial skills appraisal (attitude);
perception of social pressure in the use of managerial skills at the workplace (subjective norm);
trust of the employee in his ability to use managerial skills (behaviour control). These together influence the actual foreseeing of managerial skills.
According to Hambrick and
Mason (
1984), the upper echelon theory is based on the fact that top management creates cognitive structures depending on their previous experience. These are of course based on limited rationality of
Hofstede and Mason (
1986),
Seaton and Boyd (
2007), being seen as the “software of the mind”. This theory appeared against a background of problems generated by managers in the area of strategic decision-making. For example, executive directors were often selected due to their tough personality for the implementation of strategic aims, different to the aims of the board of directors. Moreover, the financial director was selected by the executive director to save money and make the company more efficient. These decisions are not accidental, and are based on well-structured strategic aims.
In the last two decades, new features have been added to company control due to provisions of
SOX Law (
2002), and the Committee of Sponsoring Organizations of the Treadway Commission (COSO) (
McNally 2013). These require top management to write a report on the efficiency of control procedures, designed and implemented, taking into account the level of inherent risk. At the same time,
Pfister and Hartmann (
2009) and
Simons (
1994) show the system position of control on two levels. The first level refers to the decision-making process that includes the strategic and the managerial control system, with the focus on the company’s external and internal environment, respectively. The second level plays a generalising role, called the internal control system, and it aims to ensure the quality of information in annual reports, and to protect company assets. As it may be observed, the systemic perspective is used for dealing with managerial control, seen as an element of internal control. So, recent studies link internal control to financial reporting and the culture of countries in which a company operates (
Caban-Garcia et al. 2017), while managerial control is seen through the same systemic perspective, when it comes to budgets made from a creative perspective (
Chen 2017).
In this study, views of different scholars have been combined with provisions of regulations by assessing the systemic value of control by means of such elements as control environment, managerial strategy, operational control and performance appraisal system.
3. Research Methodology
According to the “principle of doubt” of Descartes, there is a specific scepticism in science towards what is new or different from what is known. In this sense, the theoretical framework of the literature review was tested by means of quantitative methods by applying a statistical questionnaire. The studied sample includes top managers of companies listed on the regulated market and AeRO of the Bucharest Stock Exchange in 2017. Hypotheses were used to evaluate empirically the relations between management control and company control environment, managerial strategies and the budgetary system, and the operational control and the performance appraisal system. The questionnaire was applied to executive and financial directors, chief accountants and chartered accountants. A total 154 responses were obtained. Responses by each group have not been specified as no significant differences were recorded from one group to another.
For this purpose, we have formulated the following research hypotheses:
Hypotheses 1 (H1). Company control environment exercises a significant influence on the structure of management control processes.
Hypotheses 2 (H2). Correspondence ratio between managerial strategies and the budgetary system has a significant impact on the efficiency of management control processes.
Hypotheses 3 (H3). In management control, the efficiency of operational control is estimated using the relation between the financial-accounting information and decision-making processes.
Hypotheses 4 (H4). Utility of performance appraisal system has a significant impact on the efficiency of management control processes.
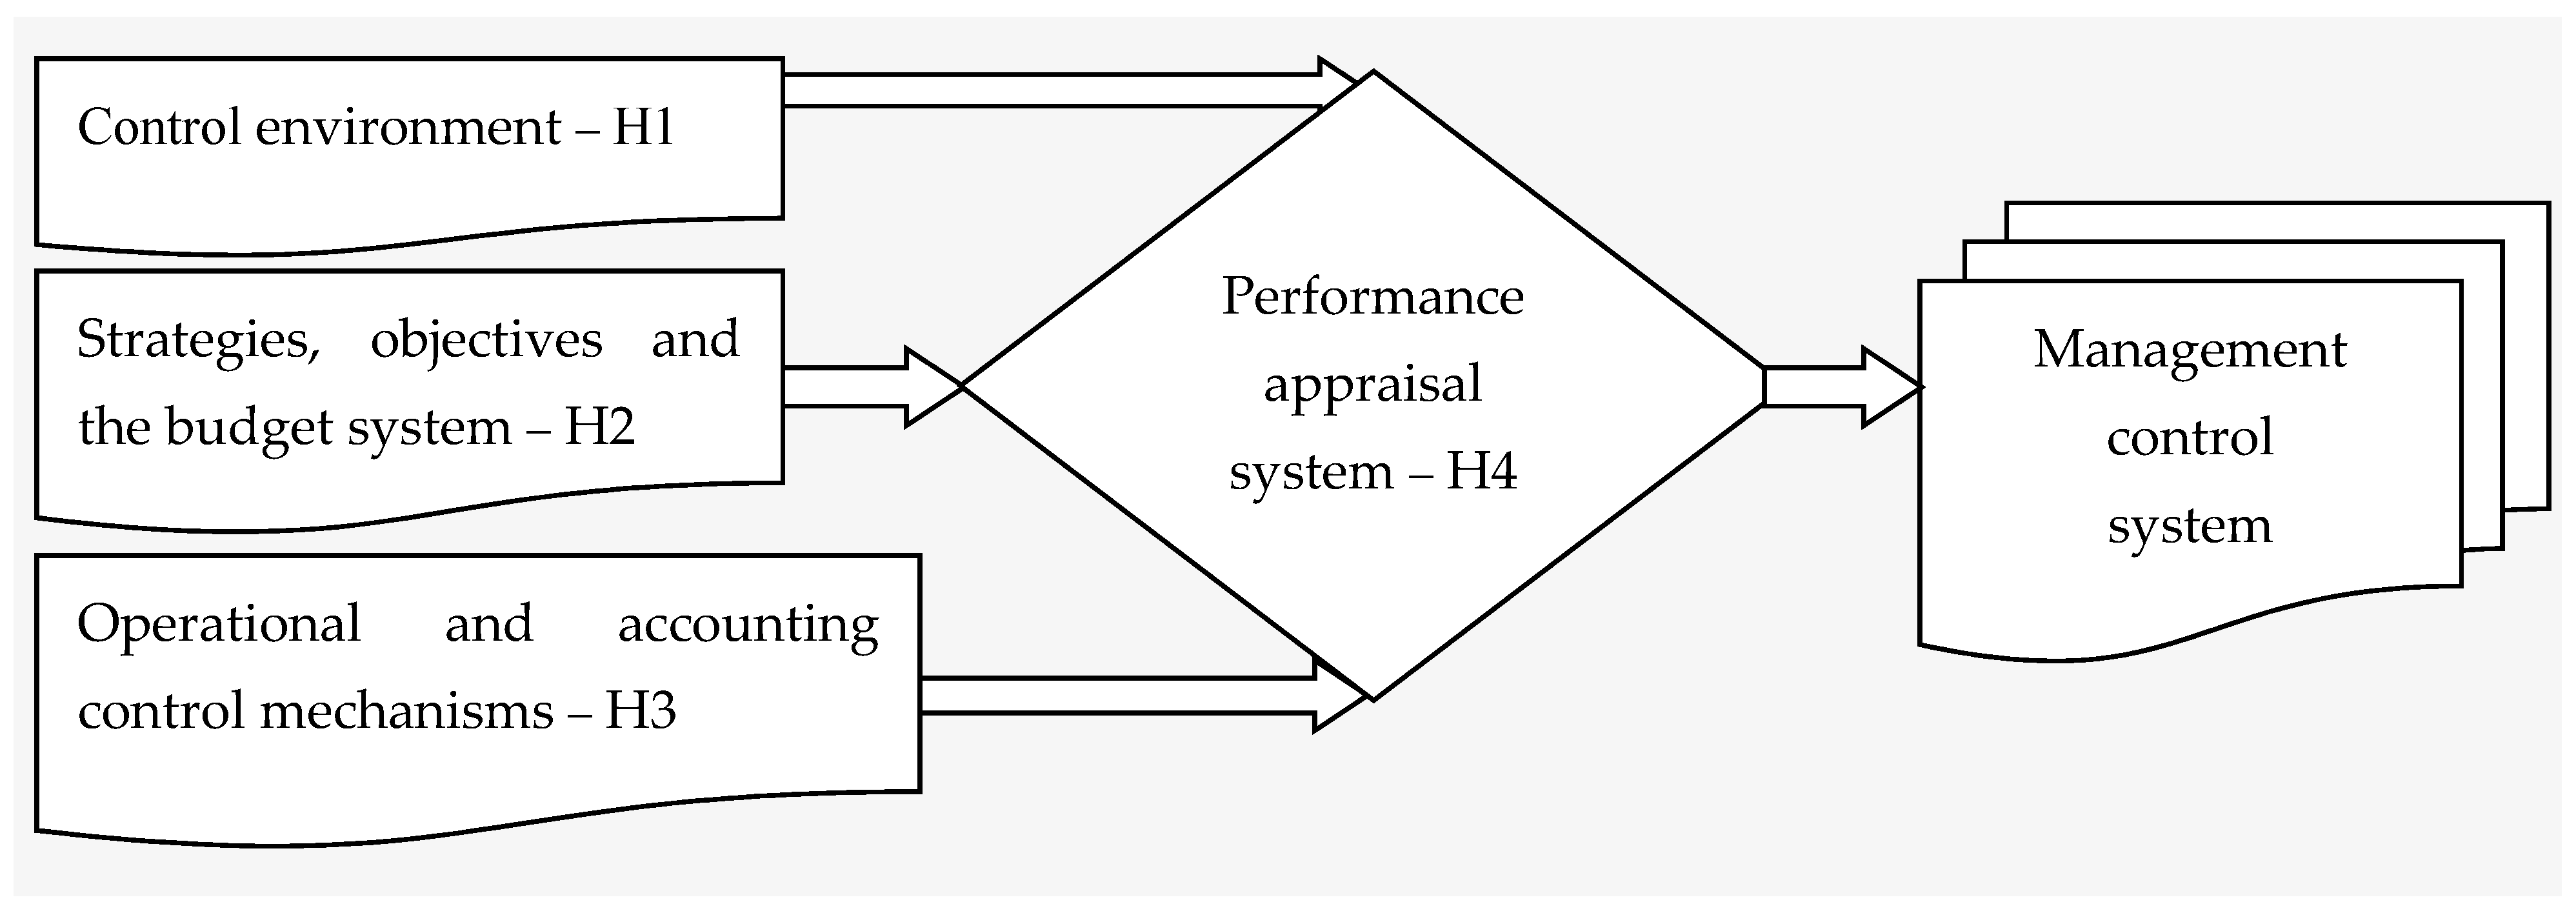
Testing and validation of research hypotheses were carried out using the answers of respondents collected in a questionnaire and processed by means of econometric modelling. The relations between the hypotheses are shown in
Figure 1.
According to relations in
Figure 1, the following independent variables (
X) exercise influence on the management control system as a dependent variable (
Y): Control environment (H1), strategies, objectives and the budgetary system (H2), operational and accounting control (H3), and performance appraisal system (H4). It is important to mention that the association between performance assessment and other variables has special features. So, performance appraisal in management control starts with company strategies and budgetary system, and ends with checking current operations specific to operational control.
The confidence analysis of answers was conducted by assessing the internal consistency or the consistency of results. For this purpose, the Cronbach’s Alpha is the most well-known indicator for measuring the internal consistency of a scale.
Most questions in the questionnaire were established using a 5-point Likert scale. As the sets of analysed questions measure different questions, we carried out separate confidence analyses and calculated the value of Cronbach’s Alpha coefficient separately for each set. The results of confidence analysis are presented in
Table 1. Cronbach’s Alpha coefficient indicates the six features in measuring each item. The variation limits of this coefficient are between 0 and 1. The higher the value of the coefficient, the more reliable the used scale is, or it is considered to be more consistent. If the Cronbach’s Alpha coefficient is over 0.7, then the set of items measure the same concept, and therefore, the consistency of the measuring scale is good.
Regression analysis was used to measure the effects of explanatory variables (independent variables) on management control (dependent variable). We applied a method for selecting independent variables with significant influence using Stepwise in SPSS 20.0. By estimating the four regression models, we obtained the regression coefficients between management control and the sets of items viewed as influence factors.
4. Analysis and Interpretation of Results
Correlation and regression coefficients were used to analyse statistically the relations between variables. Pearson correlation coefficient measures the intensity of the relation between the two quantitative and continuous normally distributed variables. The regressions reflect the degree of influence of factors or the identification of dominant factors by prediction of variable (Y) depending on other variables (X).
Pearson correlation coefficient was used to test the significance of the intensity of the relations between the dependent variable in your opinion, management control is an instrument of executive management for optimizing company performance and other questions viewed as independent variables. The answers to the main question mentioned above are presented in
Table 2.
After the analysis of frequency distribution of answers in
Table 2, we may observe that of the predominant favourable answers to the statements included in the questionnaire, 82.5 % of answers were “Agree” and “Totally agree”.
Information from
Table 3 shows statistically significant correlations for a significance threshold of 1%, between the variable system of management control and all items included into the set of questions of the statistical questionnaire.
Values of linear Pearson correlation coefficient in
Table 3 show whether there is or not an association between management control and each element of the control environment. The working hypotheses H
0: ρ = 0 and H
1: ρ ≠ 0 were verified. Taking into account that this coefficient has values between [−1; 1], the positive bold values in
Table 3 mean the rejection of hypothesis H
0, and a direct proportional association between these variables.
The estimations of regression model coefficients, and the determination ratio are synthetically presented in
Table 4. From the set of independent variables defining the internal control environment of the company presented in
Table 3, we maintained in the model only those with significant statistical influence. In hierarchical order by values of standardized coefficients, factors with a positive impact on management control are presented below:
1.6. Leadership has a positive influence on the control environment of the company: b = 0.247, tcalculated = 3.772, Sig = 0.000;
1.2. A favourable control environment shows commitment to ethical values and integrity: b = 0.217, tcalculted = 2.891, Sig = 0.004;
1.3. In a favourable control environment, management has overseeing responsibilities, and employees develop a sense of responsibility: b = 0.181, tcalculted = 2.297, Sig = 0.023.
Testing the parameters of the regression model was made using a Student’s (
t) test to find out the likelihood of each parameter to be null. Based on the data from
Table 4, the working hypotheses H
0: β = 0 and H
1: β 0 were verified. In this sense, Sig. value less than 0.05 show that the slope of the regression line (β) is significant. The significant link between variables is shown through the following calculation formula:
1.2: H
0: β
1 = 0, H
1: β
1 ≠ 0;
1.3: H
0: β
2 = 0, H
1: β
2 ≠ 0;
1.6: H
0: β
3 = 0, H
1: β
3 ≠ 0;
Determination ratio R Square (R2) may have values between [0; 1]: if R2 = 0, or a very small value, then the chosen regression model does not explain the link between variables, and if R2 = 1, then all observations fall on the regression line, and the model explains perfectly the link between variables. So, this coefficient is used to verify if the model is specified correctly or not. The determination coefficient equals to 0.260, which means that 26% of the management control is due to the control environment.
Questions 2 and 3 in the questionnaire were used to verify the relationship between the management control system as a dependent variable, and management strategies, objectives and the budgetary system as independent variables. Information form
Table 5 shows strong statistically significant links between the variable of the management control system and all other questions included in set no. 2 of the statistical questionnaire.
The values of the linear Pearson correlation coefficient in
Table 5 prove the intensity of correlation between these variables. The statistical hypotheses H
0: ρ = 0 and H
1: ρ ≠ 0 were verified, and the coefficients marked in bold in the table show positive values for questions 2.1, 2.2, 2.3, 2.5, 2.6, 2.7, and values differing from null for rejection of H
0 hypothesis.
In the regression model, there are only four significant factors defining the role of strategies and objectives in a company. The level of significance in testing regression coefficients is less than the threshold of 1% and 5%, respectively. The most important factor in question 2.3.—Are the biggest investments made in new technology?—has a positive effect on management control that is also valid for questions 2.2, 2.3 and 2.7, while question 2.4 has a negative effect (b = −0.204).
Values of correlation coefficient (R) is 0.488 in
Table 6, which shows a link between management control, strategies and company objectives. Determination coefficient R Square (R
2) of 0.238 shows that 23.8% of management control variance is influenced by simultaneous variance of strategies and objectives.
Pearson coefficient measures the intensity of correlation between management control and items related to the budgetary system presented in
Table 7.
Information in
Table 7 shows that the budgetary system belongs to management control due to the following features: key instrument for performance control, feature of corporate governance, centres of responsibility, analysis of resource-intensive activities, and management control efficiency. We may note insignificant correlations between management control and decisions based on instinct (question 3.6), and the results of answers to question 3.7 show that ABC, ABB/ABM methods are less known to managers.
Table 8 presents estimated values of regression coefficients, standard errors, and significance levels of the Student’s test. Only items 3.1 and 3.4 were kept in the model from the set of items defining the role of budget in strategy implementation, the inclusion of plans into figures and the verification of control procedures quality. The two factors have a positive influence on management control due to statistically significant influence, and Sig values less than the assumed risk of 1%.
The value of correlation coefficient (R) de 0.488 in table no. 8 shows a link between management control and the budgetary system. Determination ratio R Square (R2) is 0.201 and shows that 20% of the management control variance is influenced by simultaneous variance of the budgetary system.
Testing the parameters of the regression model were made using a Student’s (t) test to find out the likelihood of each parameter to be null. Based on data from table no. 6 and 8, the working hypotheses H0: β = 0 and H1: β 0 were verified. In this sense, Sig = 0 Sig. should be less than 0.05 showing that the slope of the regression line (β) shows a significant link between variables, being verified for each question of the questionnaire:
2.2: H
0: β
1 = 0, H
1: β
1 ≠ 0;
2.3: H
0: β
2 = 0, H
1: β
2 ≠ 0;
2.4: H
0: β
3 = 0, H
1: β
3 ≠ 0;
2.7: H
0: β
4 = 0, H
1: β
4 ≠ 0;
3.1: H
0: β
1 = 0, H
1: β
1 ≠ 0;
3.4: H
0: β
2 = 0, H
1: β
2 ≠ 0;
Verification of relationships between the management control system as a dependent variable, and costs needed for decision-making as independent variables, were tested by questions from item 4 of the questionnaire. The presentation in
Table 9 of answers for each question aims to show the results of the statistical questionnaire.
Table 9 shows positive and significant correlations between management control and profit centres (question 4.1), standard-cost method (question 4.2), and relevant costs (question 4.7); their correlation indicators appear in bold. The other factors have an insignificant influence on the management control system, while for questions 4.1, 4.2 and 4.7, the statistical hypothesis H
0: ρ = 0 was rejected, and H
1: ρ ≠ 0 was accepted.
As calculations using the Pearson linear correlation regression show an association of three out of seven questions of item 4 of the questionnaire, we included in the model only items 4.1 and 4.2 from
Table 9 with a significant influence on the management control system from the set of factors defining the importance of costs in taking management and management control decisions.
Data in
Table 10 are used to verify working hypotheses H
0: β = 0 and H
1: β 0. In this sense, = 0.000 means that the slope of the regression line (β) shows a significant link between the variables. The hypotheses were verified for each question based on answers to questions 4.1 and 4.2:
4.1: H
0: β
1 = 0, H
1: β
1 ≠ 0;
4.2: H
0: β
2 = 0, H
1: β
2 ≠ 0;
Correlation ratio (R) of 0.417 in table no. 10 shows a link between management and operational control, including accounting control. Determination ratio R Square (R2) of 0.147 shows that 14.7% of management control variance is explained by simultaneous variance of costs.
Overall, in questions related to the role of performance assessment system for management control, we observe that the highest share belongs to non-financial indicators in question 5.7—to which degree your company has been using its ability to respond immediately to client’s demands as a non-financial instrument for assessing performance?
Correlation coefficients marked in bold in
Table 11 show statistically significant associations (significance threshold of 1%) between the management control variable and all items defining performance assessment. The values of coefficients make us observe an association with all items of point 5 of the questionnaire, reject the working hypothesis H
0: ρ = 0, and accept hypothesis H
1: ρ ≠ 0.
The estimations of regression model coefficients, and the determination ratio are synthetically presented in
Table 12. From the set of independent variables defining the role of performance in management control, we kept in the model only those with significant statistical influence. All three factors have a positive impact on management control. In order of importance (hierarchy by standardized coefficients values), the influence factors are as follows:
5.1. How often the company uses cash flow to assess performance and projects? (ROI, RI)? (b = 0.238, tcalculated = 3.229, Sig = 0.002);
5.6. Company’s ability to react immediately to client demands? (b = 0.186, tcalculated = 2.512, Sig = 0.013);
5.7. To which degree your company takes into account non-financial factors (product quality, market share, client satisfaction, etc) for assessing performance? (b = 0.173, tcalculated = 2.213, Sig = 0.029).
Based on the data of
Table 12, working hypotheses H
0: β = 0 and H
1: β 0 were verified, with Sig = 0.000, and the significant links between variables were verified for each question of item 3 in the questionnaire by using the following calculation formula:
5.3: H
0: β
1 = 0, H
1: β
1 ≠ 0;
5.6: H
0: β
2 = 0, H
1: β
2 ≠ 0;
5.7: H
0: β
3 = 0, H
1: β
3 ≠ 0;
Correlation ratio (R) of 0.496 in
Table 12 shows a link between management control and performance assessment. Determination ratio R Square (R
2) de 0.23 shows that 23% management control variance is influenced by performance variance.
5. Conclusions
In conclusion, theoretical and practical approaches to management control have been continuously developed. If in antiquity and in feudalism these were mainly practical, capitalism imposed new rigour. Diversity of traditional and modern theories on management control show how deep this matter has been researched. Also, it is a limitless source of inspiration for future generations of specialists in the field.
New approaches showed its status as a system and proved the difference between management control and accounting management. From this perspective, it was proven that accounting information does not include only past data but also data of prescriptive nature needed for benefitting from the company’s strategic future. Management control has broadened its scope. To design its processes, it is important to take into account both the ratio between consumed resources and outcomes, its impact at the micro and macro levels, and also the human behaviour psychology of its main actors.
The empirical analysis of factors influencing the processes of management control showed that the company control environment depends on the attitude towards cultural and ethical values, and the development of a spirit of responsibility and leadership. Management strategies have been noted for investments in new technologies, growth of product profitability, and control decentralization. While budgetary control contributes to increasing performance control by means of the summary of resource-intensive activities for each centre of responsibility, the operational-accounting control uses standard-cost method and rational costs in managerial decision-making. Performance assessment is needed in each stage of control, and it should combine financial and non-financial performance.
As a result, managers make sure that their strategic and operational objectives are reached by using this type of control; public institutions accumulate and monitor financial means; and the population have a balanced and quiet daily life. Control penetrates into the essence of processes and facts, guides managers, provides opportunities to discover shortcomings, and helps prevent causes of their appearance.
We believe the research has the following limitations:
theoretical approaches were studied using international literature, but the empirical analysis covers only national data;
relationships with corporate governance have not been researched;
factors at the macroeconomic level have not been considered.
Future lines of research will be focused on:
Unification of internal and management control by creating a system of company control;
inclusion in the study of internal and financial audit;
influence of management control on the economy of a country using the concept of sustainable corporate governance.


