

Weakly Supervised Object Detection for Remote Sensing Images: A Survey


Abstract
1. Introduction
- Annotation effort: the process of producing Bounding Box (BB) annotations, i.e., of delineating the object boundaries to provide the metadata necessary for the full supervision, is very time-consuming and non-trivial.
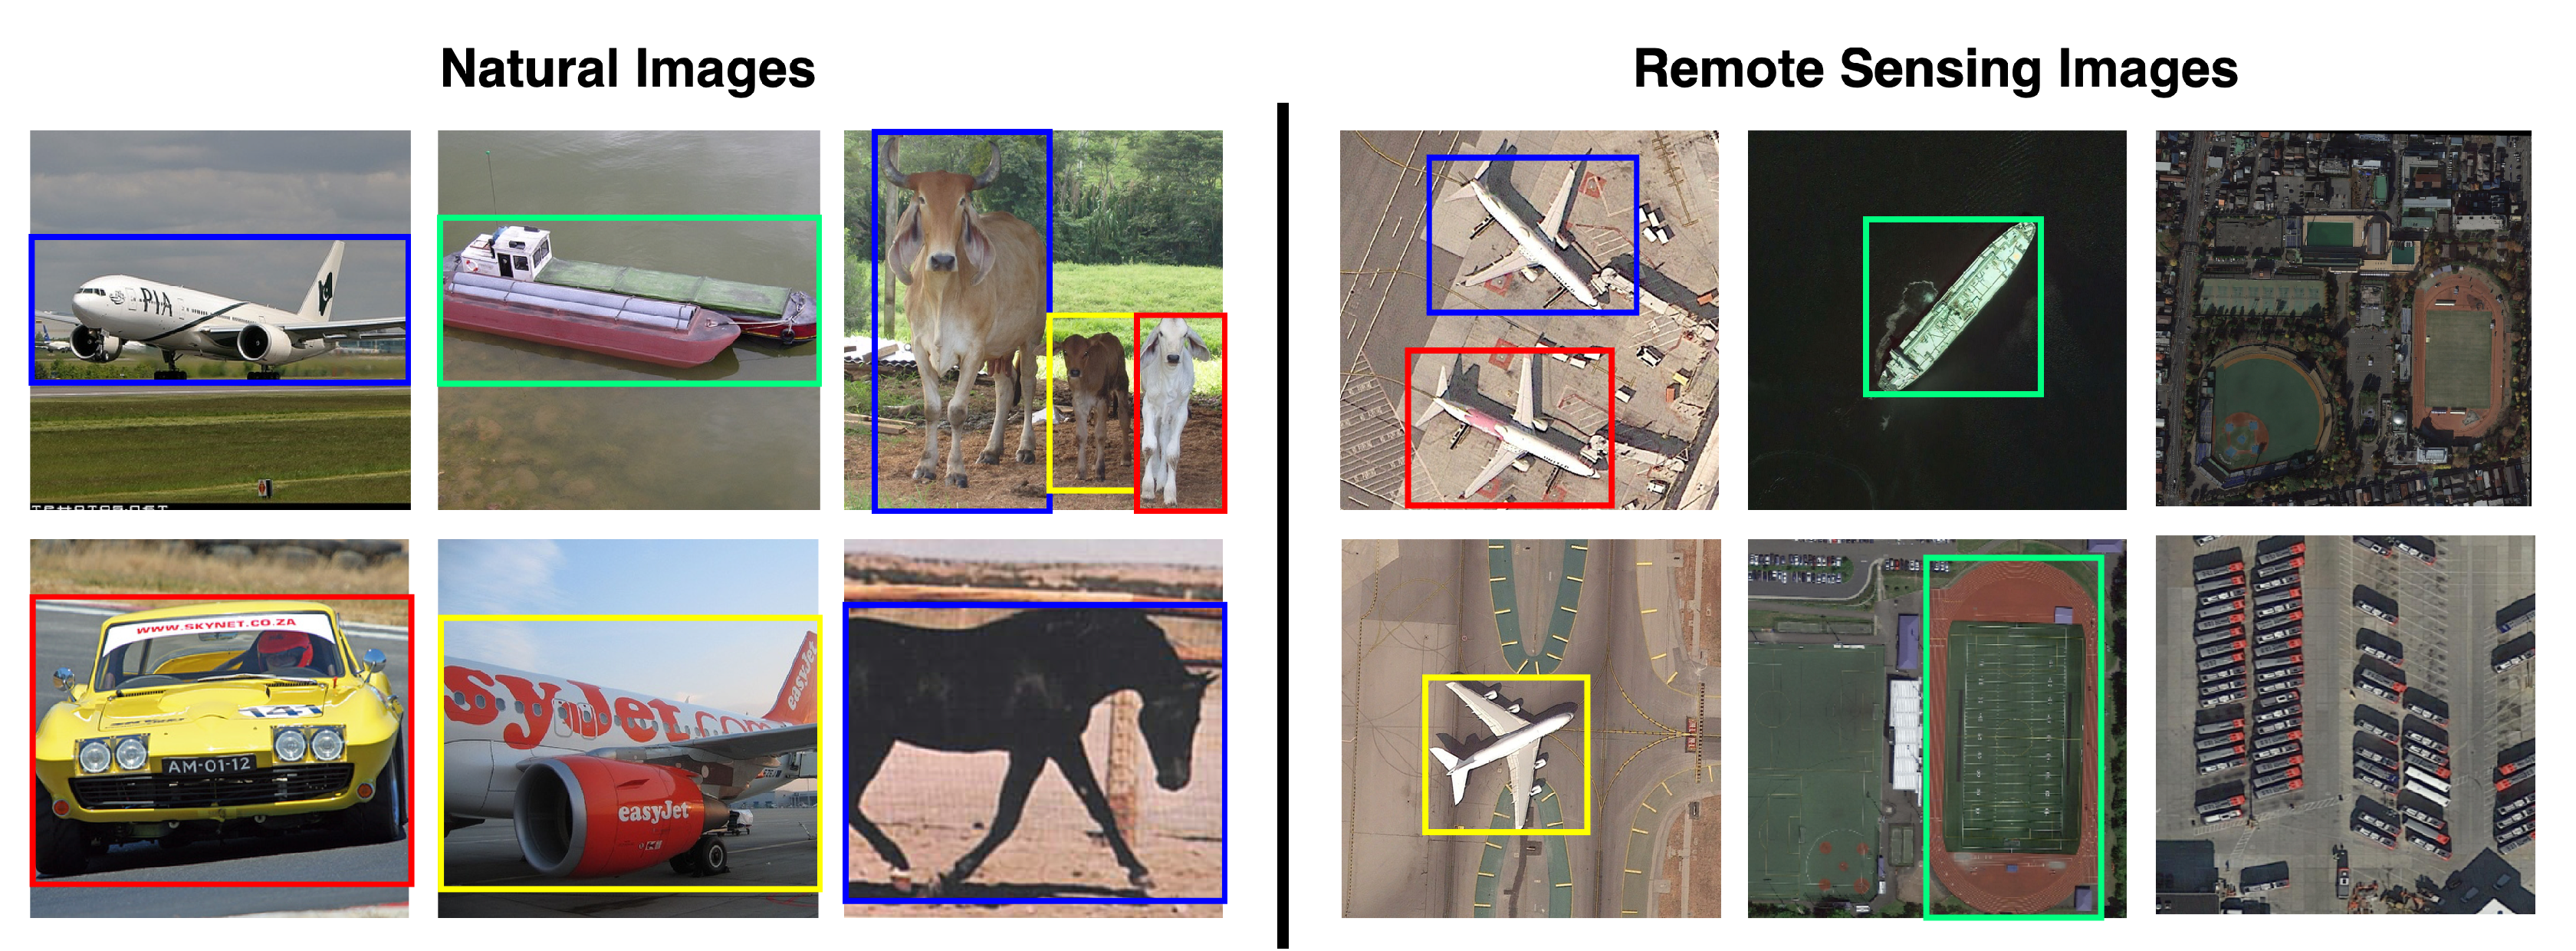
- Domain generalizability: most detectors have been developed to deal with natural images, i.e., images that portray one or more instances of common objects. However, other types of images (such as medical and aerial images) have more complex content, are less easy to collect and annotate, and may induce a drop in performance if domain-specific issues are not addressed (e.g., class imbalance, label noise, heterogeneous organs, and lesion appearance) [4,5].
- Objects normally occupy a small portion of the image, while in natural images few large objects are usually present.
- The background is complex and cluttered and multiple target objects coexist.
- Some target objects (e.g., ships and vehicles) can be extremely small and dense, while some other targets (e.g., ground track fields) can cover a large area.
- The target objects can have arbitrary orientations, whereas they often appear with horizontal orientation in natural images.
- The target objects are seen from an aerial viewpoint, whereas in natural images their profile is visible.
- The target objects may have high intra-class diversity (e.g., vehicles or aircraft of different shape, size, etc.) and inter-class similarity (e.g., a landfill vs. a quarry).


1.1. Focus of the Survey
1.2. Methodology
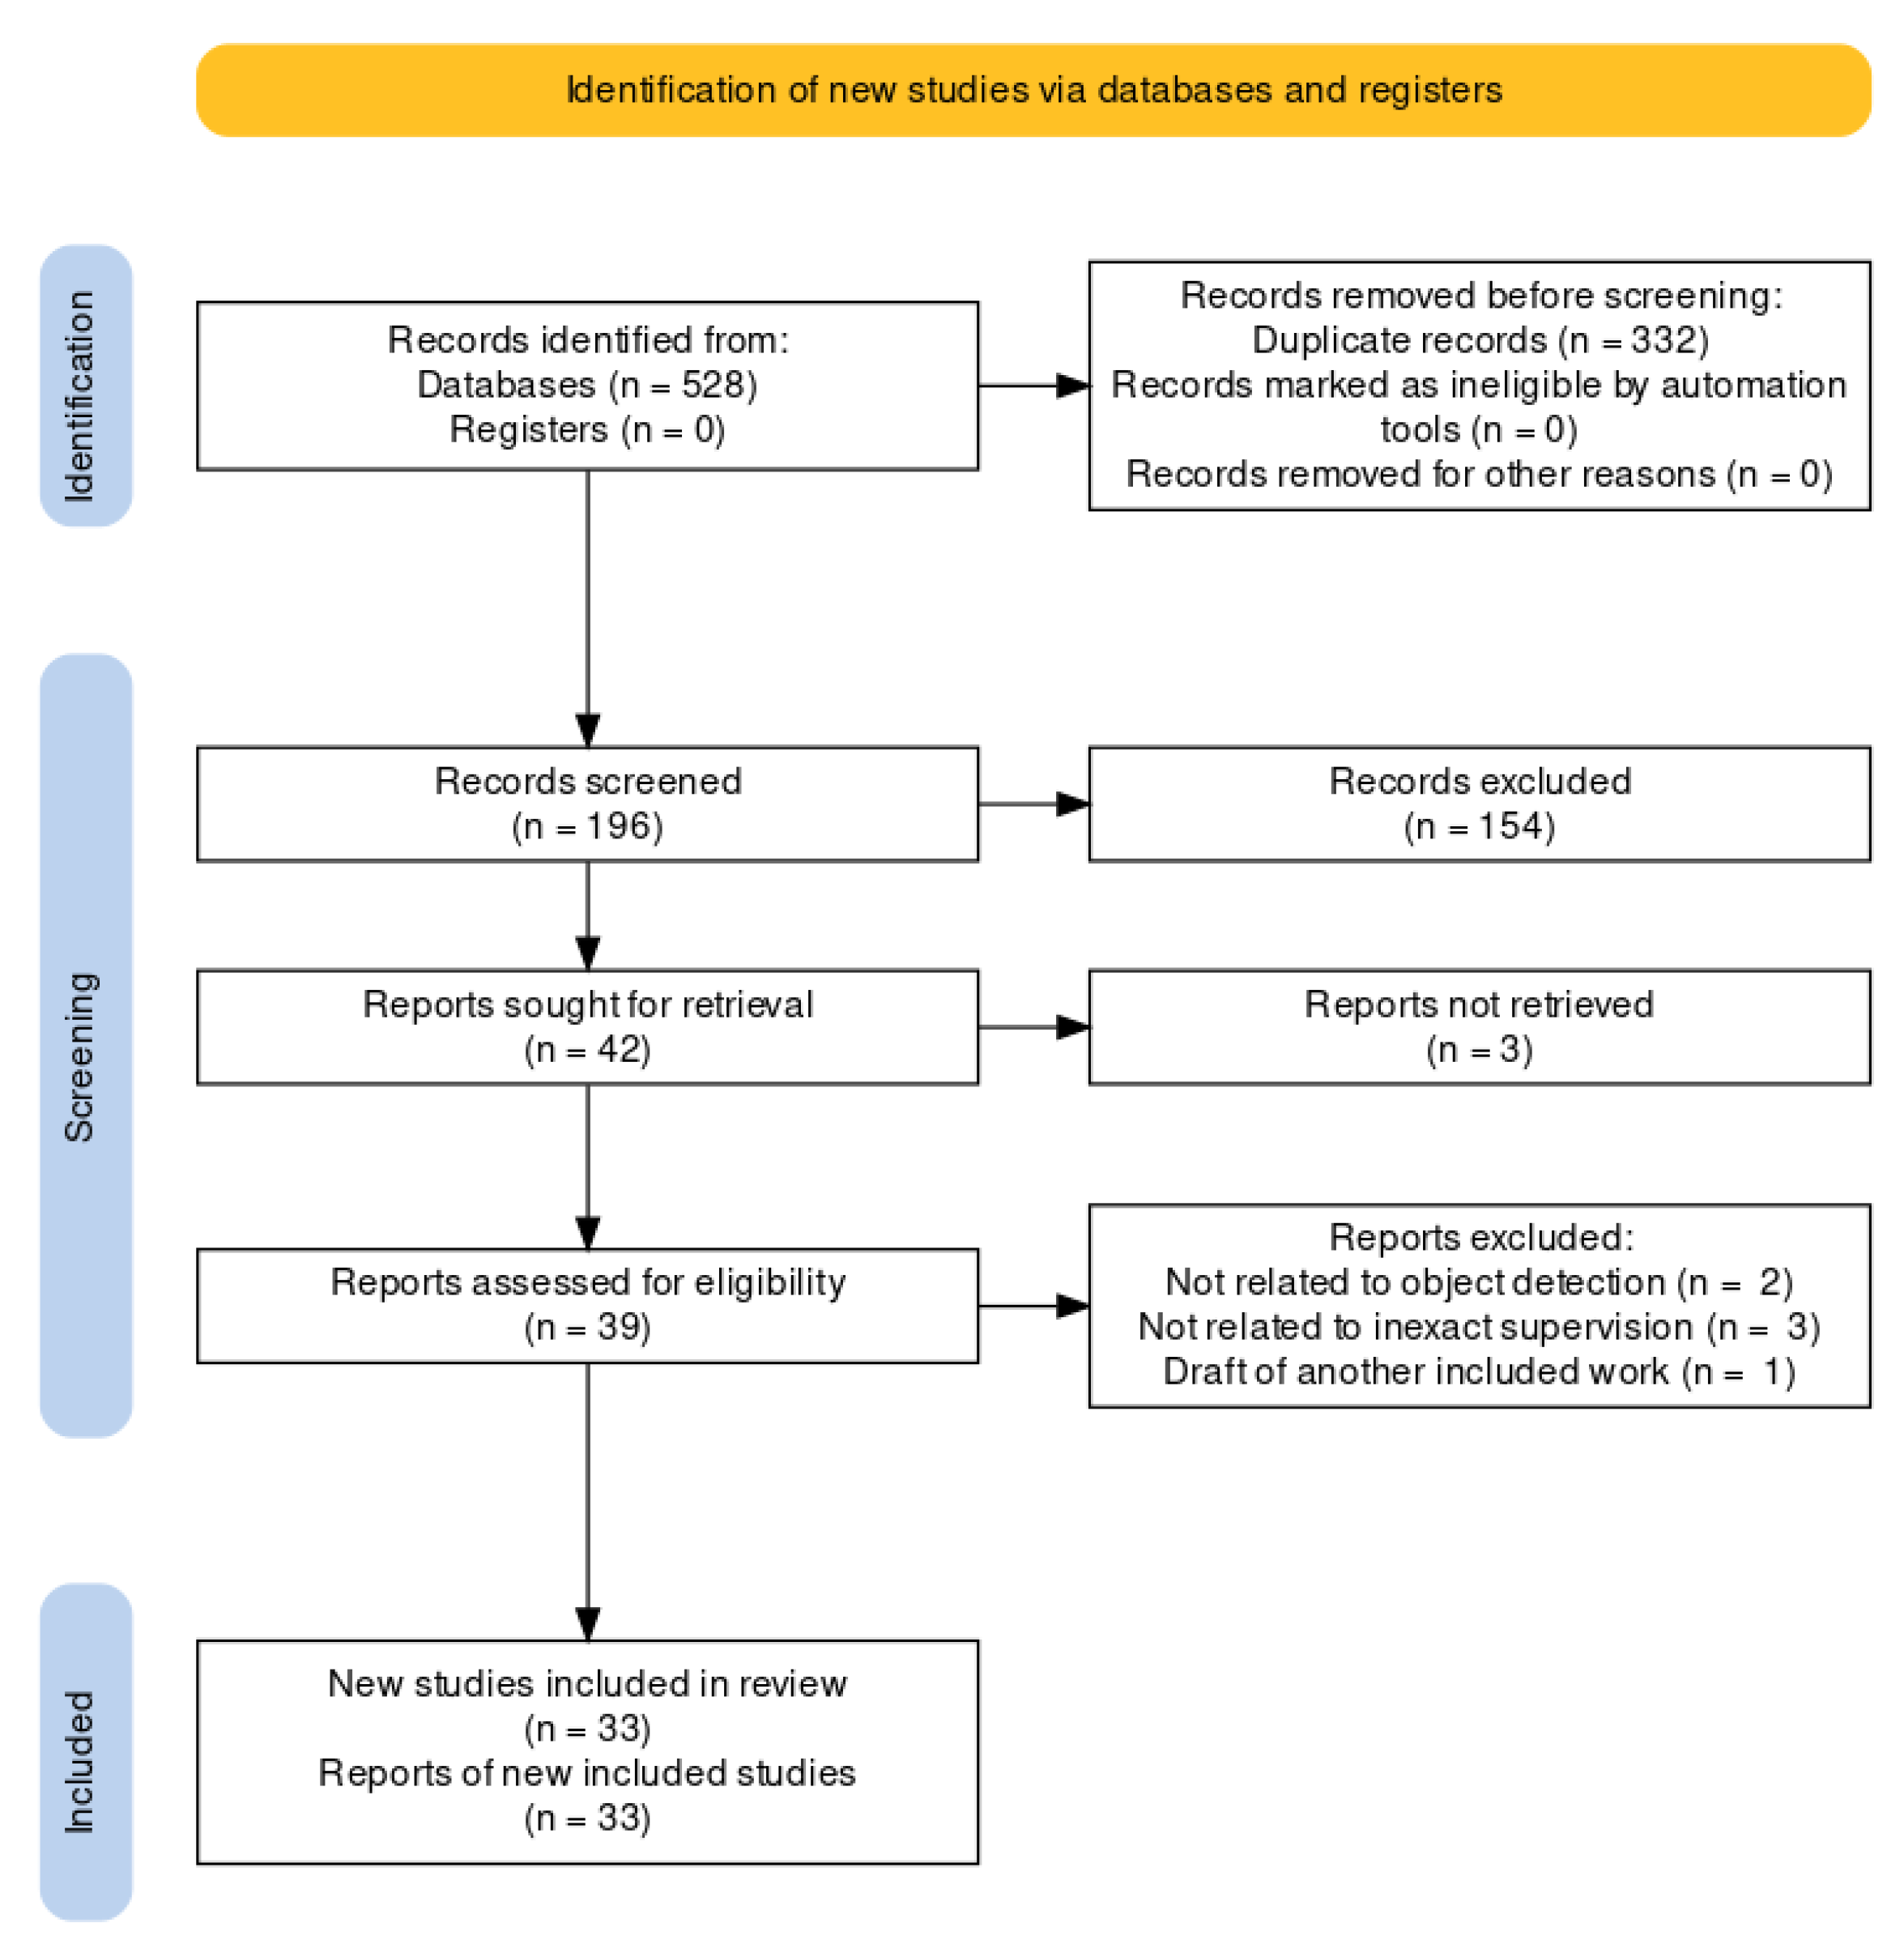
- The search was conducted on the Scopus database since it has been demonstrated to support bibliographic analysis better than other repositories [28]. The search phrases were composed as follows:<search> :- <task> AND <domain><task> :- weak supervision | inexact supervision |weakly supervised | weakly supervised learning |weakly supervised deep learning |weakly supervised object detection<domain> :- remote sensing | remote sensing images |earth observations | aerial images |synthetic aperture radar images |satellite images | multispectral images |hyperspectral imagesThe search results were filtered to retain only contributions in journals, conferences, and workshops.
- The initial corpus, composed of 528 works, was reduced by removing duplicates: 196 works were kept. Next, we identified and eliminated the studies unrelated to RSWSOD by checking each contribution’s title, keywords, and abstract. The reduced corpus contained 42 contributions.
- In the remaining corpus, the full text of 3 articles was unavailable. Thus, the corpus was reduced to 39 contributions.
- A final eligibility filter was applied and the full text of the remaining articles was read. In particular, 2 articles were removed because the task was not OD, 3 articles were removed because they were not related to inexact supervision, and 1 article was excluded because it was a draft of another already considered work. This final step yielded the 33 works considered in this survey.
1.3. Contributions
- A total of 33 RSWSOD methods are identified from an initial corpus of 528 papers resulting from a keyword search.
- The most suitable dimensions for analyzing the methods are identified and described (year, approach, annotation type, proposal generation method, addressed challenges, and use case). The techniques are described and compared based on these dimensions.
- A list of the most used datasets for RSWSOD is provided and the methods are compared based on their performance.
- A list of open issues in the RSWSOD field and possible future research directions are identified and discussed.

2. Remote Sensing Weakly Supervised Object Detection
2.1. Coarse-Grained Annotations
2.2. Main Challenges
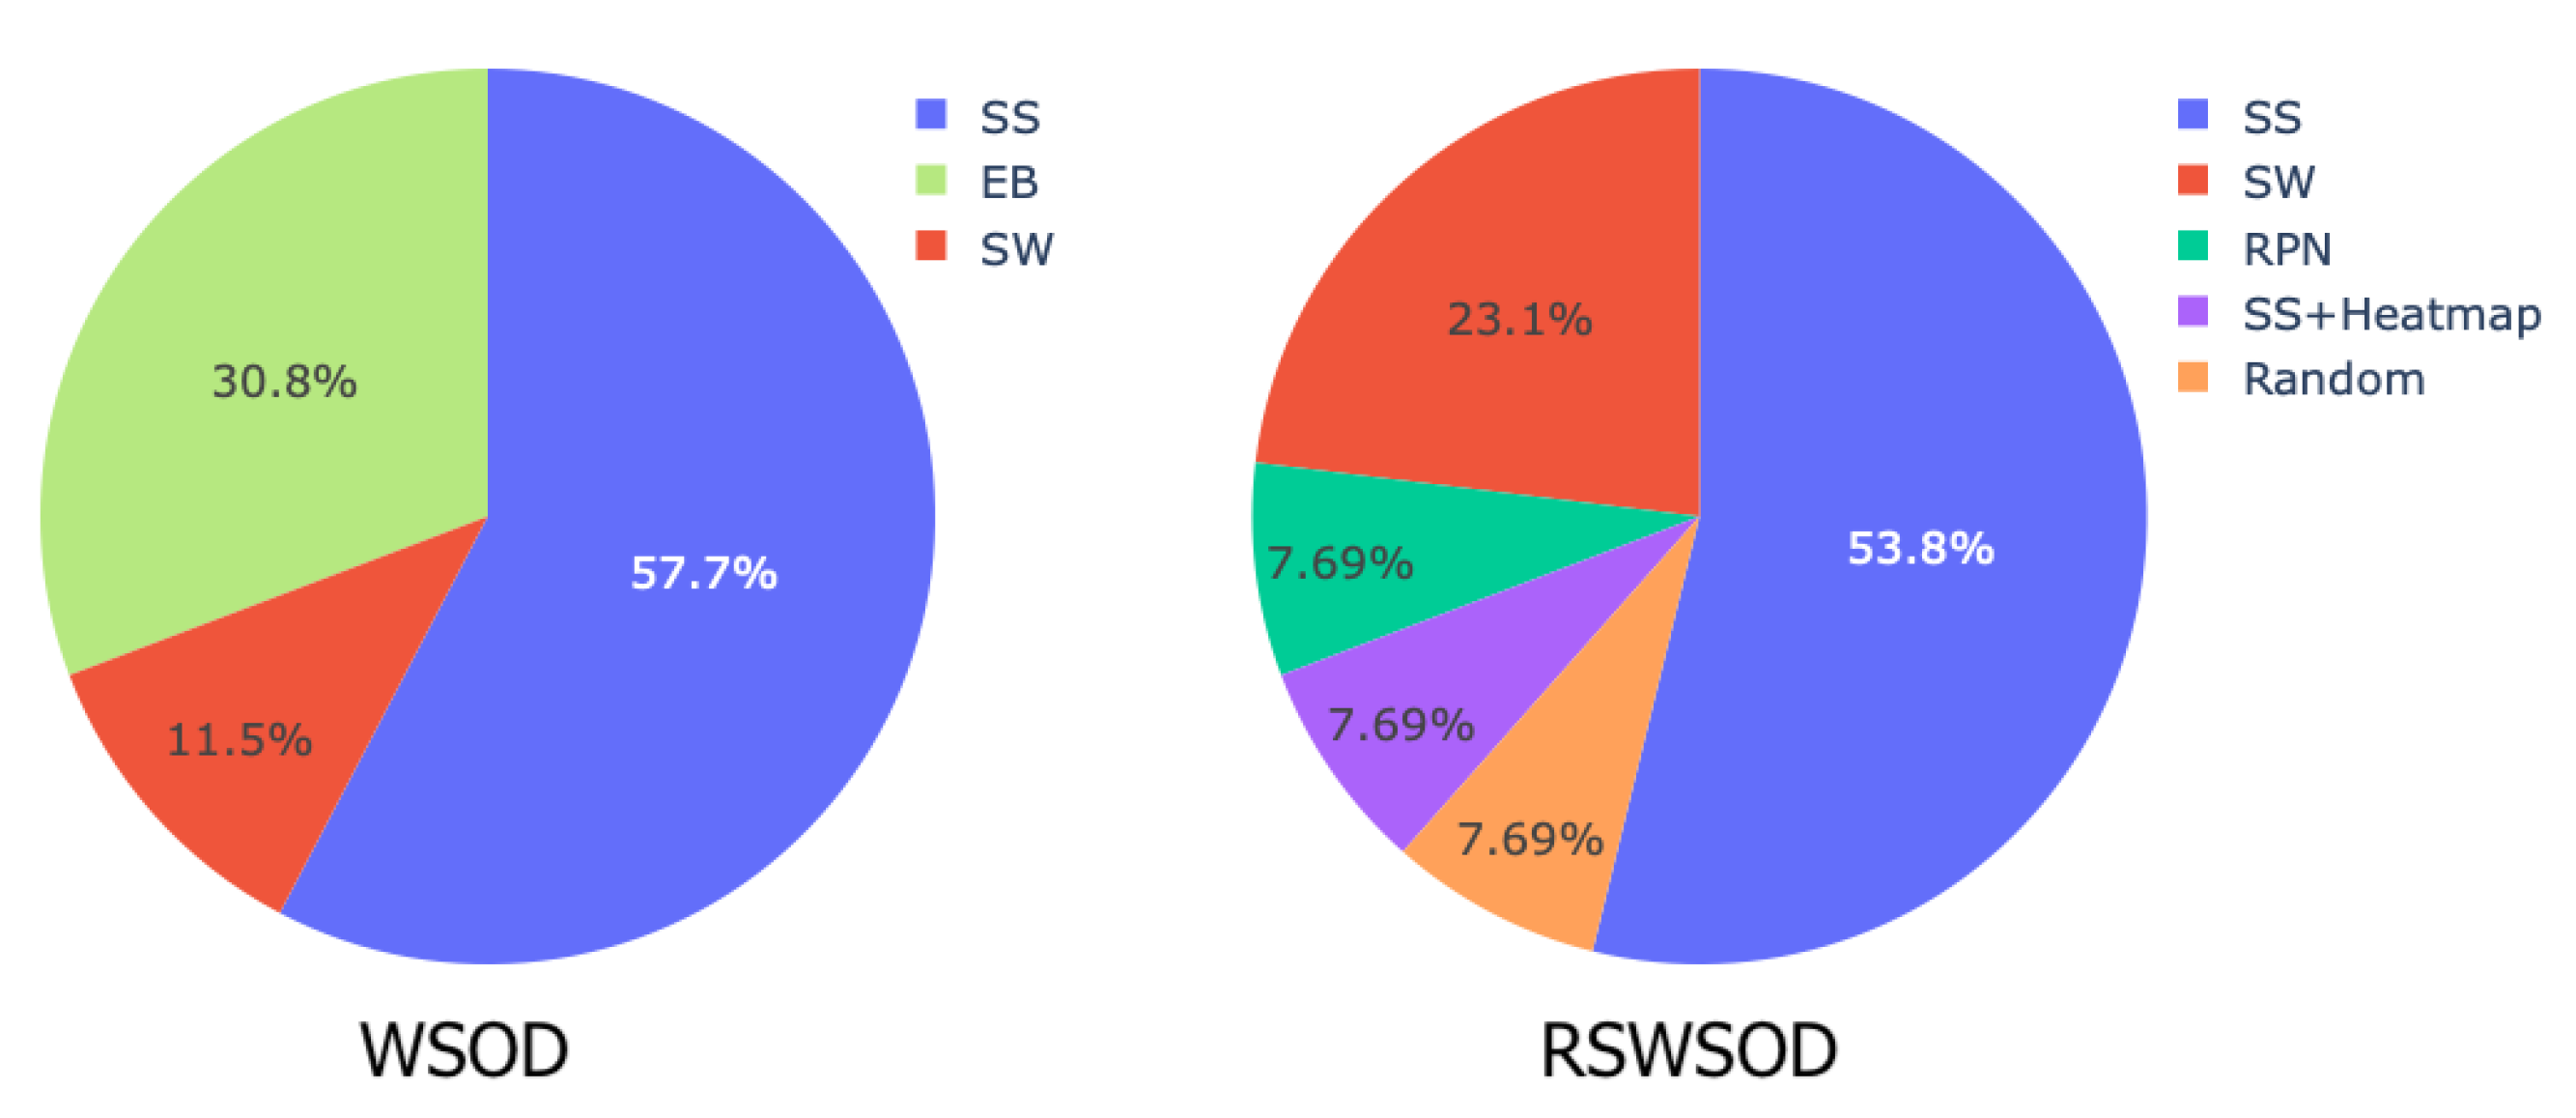
- Partial coverage problem: This may arise from the fact that the object detection proposals computed by the WSOD method with the highest confidence score are those that surround the most discriminative part of an instance. If proposals are selected solely based on the highest score, the detector will learn to focus only on the most discriminative parts and not on the entire extent of an object (discriminative region problem). Another problem may derive from proposal generation methods such as Selective Search [52] and Edge Boxes [53], which output proposals that may not cover the entire targets well, reducing the performances of the detector (low-quality proposal problem).
- Density problem: Images often contain dense groups of instances belonging to the same class. Models usually have difficulties in accurately detecting and distinguishing all the instances in such densely populated regions.
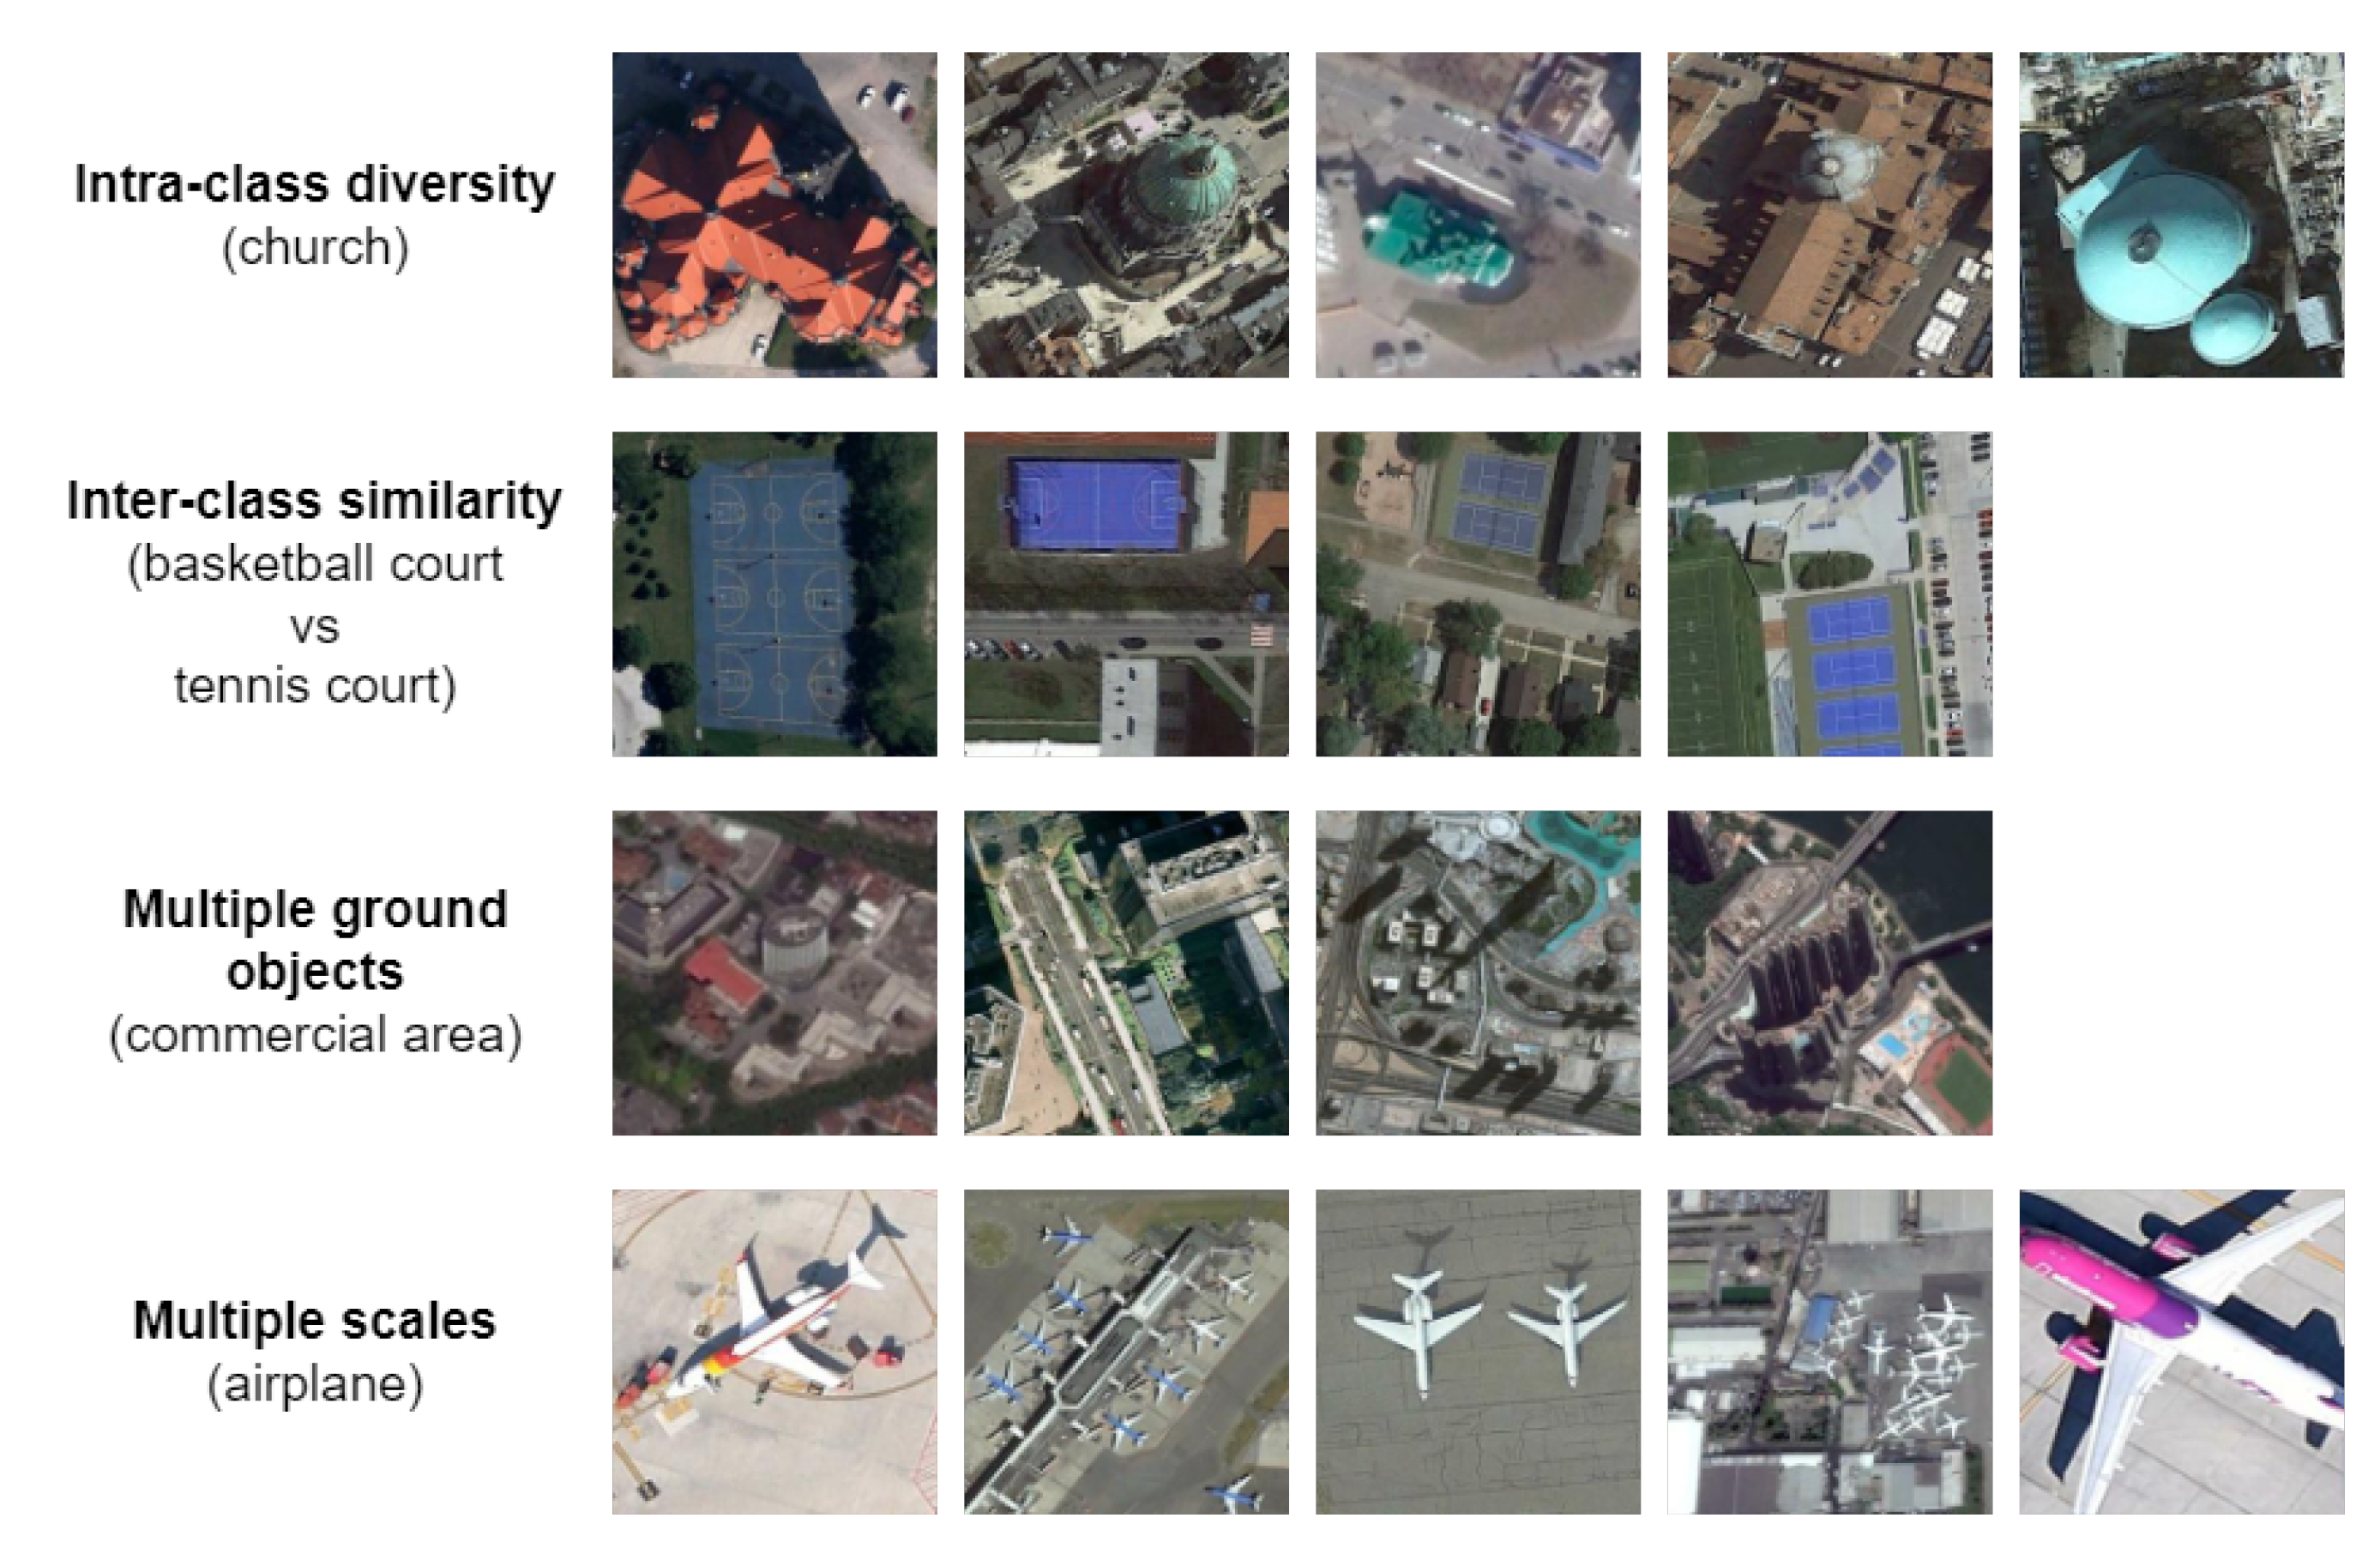
- Generalization problem: The high intra-class diversity in RSIs induces generalization problems mainly due to three factors:
- -
- Multi-scale: Objects may have varying sizes, and their representation strongly depends on the image resolution and ground sample distance (GSD).
- -
- Orientation variation: Instances present arbitrary orientations and may require the use of methods generating Oriented bounding boxes (OBB) instead of the classical horizontal bounding boxes (HBB).
- -
- Spatial complexity: In general, RSIs show varying degrees of complexity in the spatial arrangement of the objects.
2.3. Weakly Supervised Object Detection Approaches
- TSI + TDL-based: These approaches are based on a simple framework that consists of two stages: training set initialization (TSI) and target detector learning (TDL).
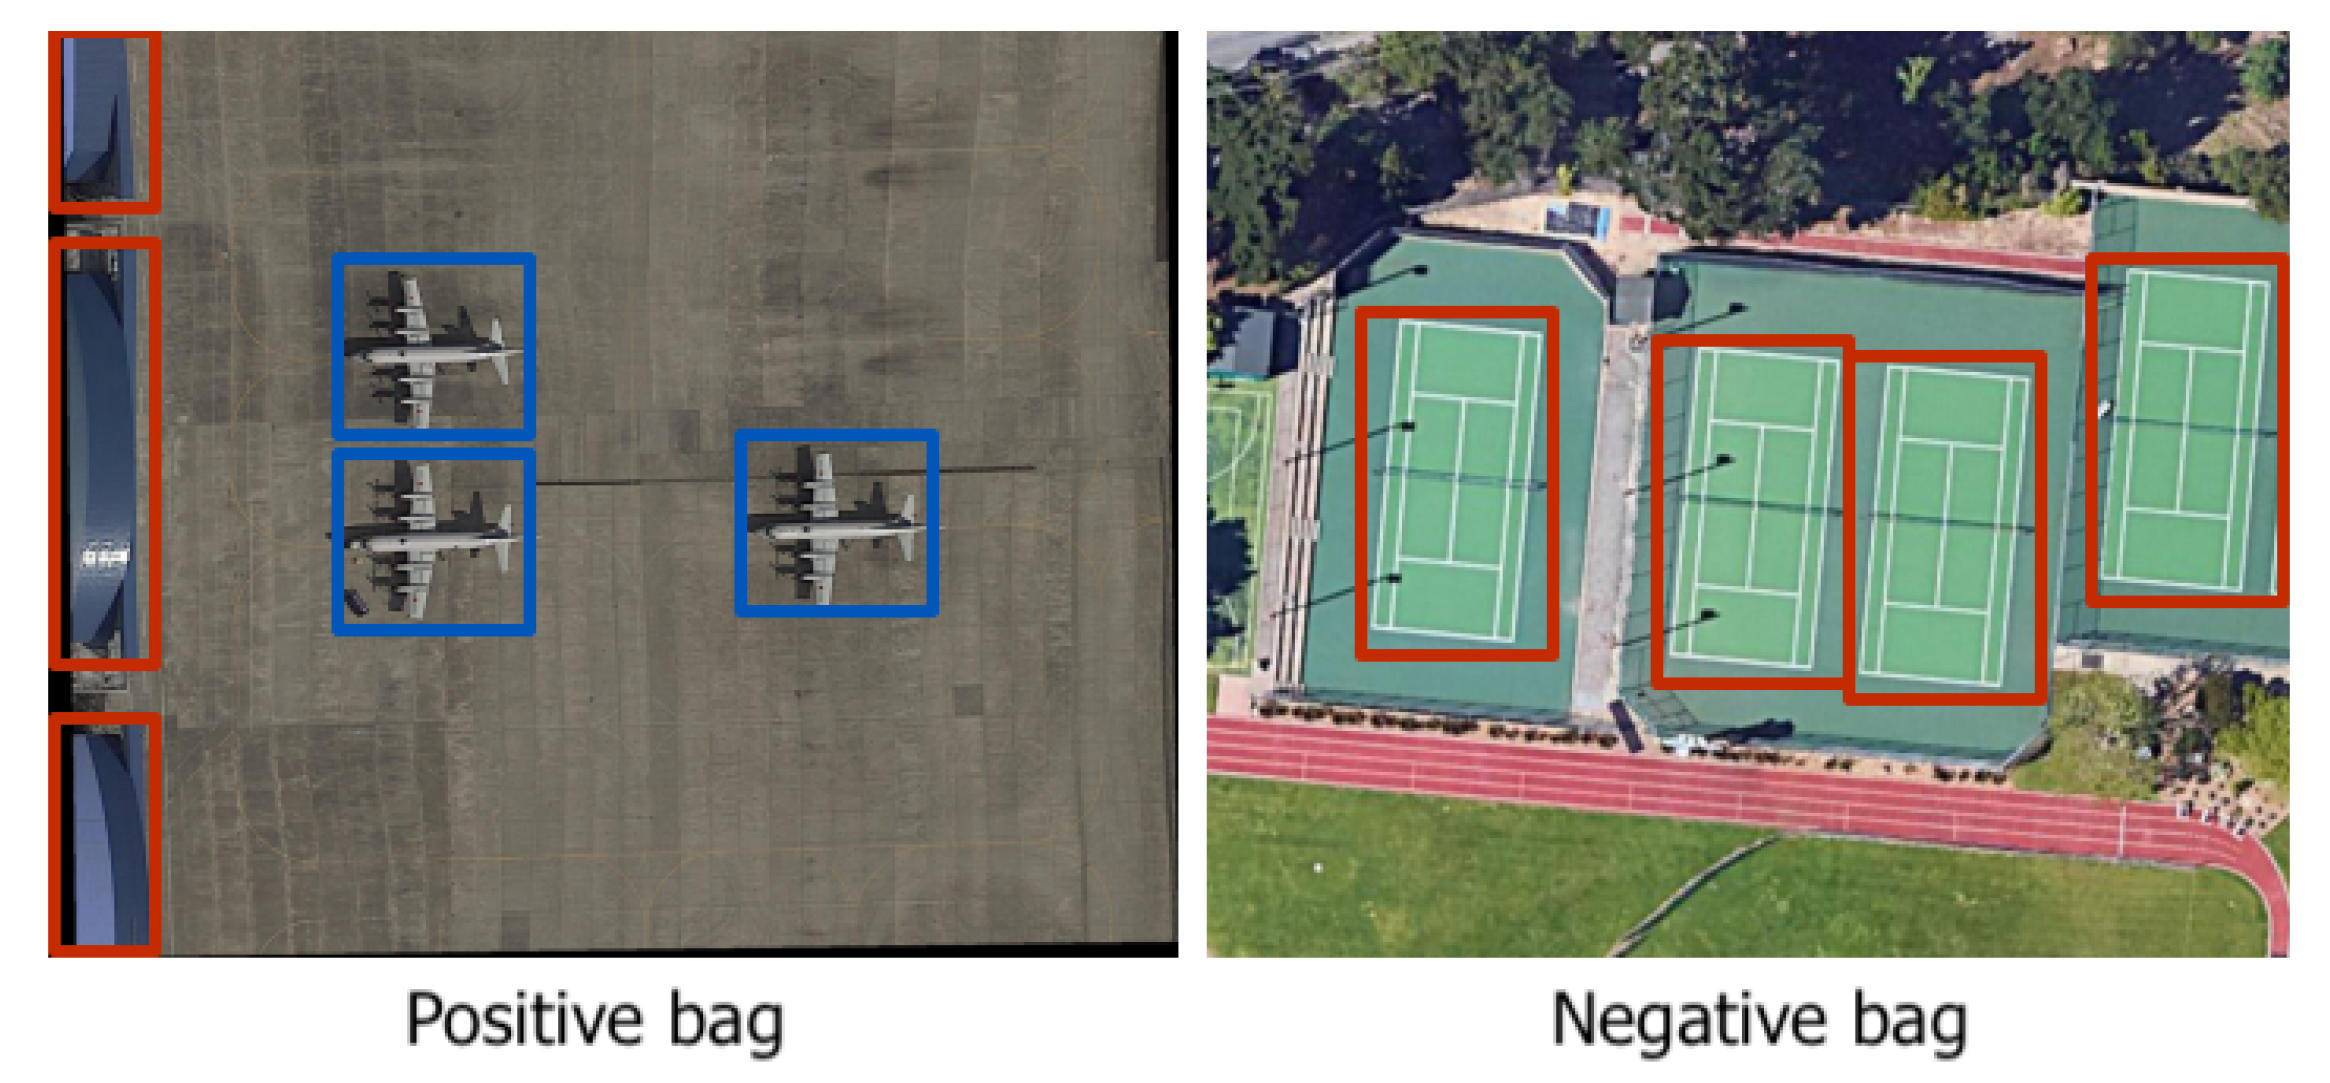
- MIL-based: These approaches are based on the Multiple Instance Learning (MIL) framework.
- CAM-based: These approaches are based on Class Activation Maps (CAMs), a well-known explainability technique.
- Other DL-based: Few methods reformulate the RSWSOD problem starting from the implicit results of other tasks, e.g., Anomaly Detection (AD).
2.3.1. TSI + TDL-Based
2.3.2. MIL-Based
2.3.3. CAM-Based
2.3.4. Other DL-Based
3. Benchmarking
3.1. RSI Datasets
3.2. Evaluation

| Name | Approach | Year | Google Earth | NWPU VHR-10.v2 | DIOR | ||
|---|---|---|---|---|---|---|---|
| AP | mAP | CorLoc | mAP | CorLoc | |||
| Zhang et al. [29] | TSI + TDL | 2014 | 54.18% | - | - | - | - |
| Han et al. [31] | TSI + TDL | 2014 | 60.16% | - | - | - | - |
| Zhang et al. [30] | TSI + TDL | 2014 | 66.42% | - | - | - | - |
| Zhou et al. [33] | TSI + TDL | 2015 | 75.58% | - | - | - | - |
| Zhou et al. [34] | TSI + TDL | 2016 | 76.26% | - | - | - | - |
| FCC-Net [40] | MIL | 2020 | - | - | 18.30% | 41.70% | - |
| DCL [41] | MIL | 2020 | - | 52.11% | 69.65% | 20.19% | 42.23% |
| PCIR [15] | MIL | 2020 | - | 54.97% | 71.87% | 24.92% | 46.12% |
| AlexNet-WSL [42] | CAM | 2020 | - | - | - | 18.78% | - |
| TCANet [16] | MIL | 2020 | - | 58.82% | 72.76% | 25.82% | 48.41% |
| Wang et al. [45] | MIL + CAM | 2021 | - | 53.60% | 61.50% | - | - |
| SDA-RSOD [17] | CAM | 2022 | - | - | - | 24.11% | - |
| MIGL [47] | MIL | 2021 | - | 55.95% | 70.16% | 25.11% | 46.80% |
| SAENet [49] | MIL | 2021 | - | 60.72% | 73.46% | 27.10% | 49.42% |
| SPG + MELM [51] | MIL | 2022 | - | 62.80% | 73.41% | 25.77% | 48.30% |
| Qian et al. [18] | MIL | 2022 | - | 61.49% | 73.68% | 27.52% | 49.92% |
3.2.1. Google Earth Dataset
| Name | Type | Year | AP |
|---|---|---|---|
| BOV [90] | FSOD | 2010 | 52.75% |
| Han et al. [91] | FSOD | 2014 | 54.21% |
| Zhang et al. [30] | FSOD | 2014 | 59.67% |
| Zhang et al. [29] | RSWSOD | 2014 | 54.18% |
| Zhang et al. [30] | RSWSOD | 2014 | 66.42% |
| Han et al. [31] | RSWSOD | 2014 | 60.16% |
| Zhou et al. [33] | RSWSOD | 2015 | 75.58% |
| Zhou et al. [34] | RSWSOD | 2016 | 76.26% |
3.2.2. DIOR Dataset
| Name | Type | Year | Airplane | Airport | Baseb. Field | Basketb. Court | Bridge | Chimney | Dam | Expr. Service Area | Expr. Toll Station | Golf Field | Ground Track Field | Harbor | Overp. | Ship | Stadium | Storage Tank | Tennis Court | Train Station | Vehicle | Windm. | mAP | CorLoc |
|---|---|---|---|---|---|---|---|---|---|---|---|---|---|---|---|---|---|---|---|---|---|---|---|---|
| Fast RCNN [94] | FSOD | 2015 | 44.17% | 66.79% | 66.96% | 60.49% | 15.56% | 72.28% | 51.95% | 65.87% | 44.76% | 72.11% | 62.93% | 46.18% | 38.03% | 32.13% | 70.98% | 35.04% | 58.27% | 37.91% | 19.20% | 38.10% | 49.98% | - |
| Faster RCNN [62] | FSOD | 2015 | 50.28% | 62.60% | 66.04% | 80.88% | 28.80% | 68.17% | 47.26% | 58.51% | 48.06% | 60.44% | 67.00% | 43.86% | 46.87% | 58.48% | 52.37% | 42.53% | 79.52% | 48.02% | 34.77% | 65.44% | 55.48% | - |
| WSDDN [13] | WSOD | 2016 | 9.06% | 39.68% | 37.81% | 20.16% | 0.25% | 12.18% | 0.57% | 0.65% | 11.88% | 4.90% | 42.35% | 4.66% | 1.06% | 0.70% | 63.03% | 3.95% | 6.06% | 0.51% | 4.55% | 1.14% | 13.26% | 32.40% |
| CAM [72] | WSOD | 2016 | 2.66% | 34.63% | 16.87% | 16.70% | 10.59% | 25.43% | 17.66% | 25.40% | 25.87% | 56.23% | 17.68% | 12.86% | 25.32% | 0.11% | 9.27% | 0.84% | 6.64% | 46.00% | 1.48% | 9.08% | 18.07% | - |
| OICR [14] | WSOD | 2017 | 8.70% | 28.26% | 44.05% | 18.22% | 1.30% | 20.15% | 0.09% | 0.65% | 29.89% | 13.80% | 57.39% | 10.66% | 11.06% | 9.09% | 59.29% | 7.10% | 0.68% | 0.14% | 9.09% | 0.41% | 16.50% | 34.80% |
| PCL [63] | WSOD | 2018 | 21.52% | 35.19% | 59.80% | 23.49% | 2.95% | 43.71% | 0.12% | 0.90% | 1.49% | 2.88% | 56.36% | 16.76% | 11.05% | 9.09% | 57.62% | 9.09% | 2.47% | 0.12% | 4.55% | 4.55% | 18.19% | 41.52% |
| MELM [67] | WSOD | 2018 | 28.14% | 3.23% | 62.51% | 28.72% | 0.06% | 62.51% | 0.21% | 13.09% | 28.39% | 15.15% | 41.05% | 26.12% | 0.43% | 9.09% | 8.58% | 15.02% | 20.57% | 9.81% | 0.04% | 0.53% | 18.66% | - |
| ACol [95] | WSOD | 2018 | 0.15% | 7.62% | 2.38% | 0.00% | 0.00% | 0.04% | 6.10% | 7.82% | 0.78% | 27.72% | 13.18% | 9.43% | 20.56% | 0.13% | 0.00% | 0.63% | 2.27% | 18.68% | 0.17% | 0.27% | 5.89% | - |
| DaNet [75] | WSOD | 2019 | 1.33% | 33.41% | 13.46% | 17.95% | 12.99% | 21.60% | 17.20% | 25.84% | 19.68% | 53.98% | 19.86% | 12.63% | 24.31% | 0.43% | 12.37% | 0.56% | 5.85% | 49.57% | 1.11% | 3.08% | 17.37% | - |
| MIST [69] | WSOD | 2020 | 32.01% | 39.87% | 62.71% | 28.97% | 7.46% | 12.87% | 0.31% | 5.14% | 17.38% | 51.02% | 49.48% | 5.36% | 12.24% | 29.43% | 35.53% | 25.36% | 0.81% | 4.59% | 22.22% | 0.80% | 22.18% | 43.57% |
| AlexNet-WSL [42] | RSWSOD | 2020 | 2.94% | 35.58% | 17.92% | 18.20% | 12.10% | 25.91% | 18.71% | 26.44% | 25.46% | 56.56% | 19.24% | 12.91% | 25.83% | 0.64% | 10.39% | 1.19% | 7.05% | 47.07% | 1.74% | 9.78% | 18.78% | - |
| PCIR [15] | RSWSOD | 2020 | 30.37% | 36.06% | 54.22% | 26.60% | 9.09% | 58.59% | 0.22% | 9.65% | 36.18% | 32.59% | 58.51% | 8.60% | 21.63% | 12.09% | 64.28% | 9.09% | 13.62% | 0.30% | 9.09% | 7.52% | 24.92% | 46.12% |
| DCL [41] | RSWSOD | 2020 | 20.89% | 22.70% | 54.12% | 11.50% | 6.03% | 61.01% | 0.09% | 1.07% | 31.01% | 30.87% | 56.45% | 5.05% | 2.65% | 9.09% | 63.65% | 9.09% | 10.36% | 0.02% | 7.27% | 0.79% | 20.19% | 42.23% |
| FCC-Net [40] | RSWSOD | 2020 | 20.10% | 38.80% | 52.00% | 23.40% | 1.80% | 22.30% | 0.20% | 0.60% | 28.70% | 14.10% | 56.00% | 11.10% | 10.90% | 10.00% | 57.50% | 9.10% | 3.60% | 0.10% | 5.90% | 0.70% | 18.30% | 41.70% |
| TCANet [16] | RSWSOD | 2020 | 25.13% | 30.84% | 62.92% | 40.00% | 4.13% | 67.78% | 8.07% | 23.80% | 29.89% | 22.34% | 53.85% | 24.84% | 11.06% | 9.09% | 46.40% | 13.74% | 30.98% | 1.47% | 9.09% | 1.00% | 25.82% | 48.41% |
| MIGL [47] | RSWSOD | 2021 | 22.20% | 52.57% | 62.76% | 25.78% | 8.47% | 67.42% | 0.66% | 8.85% | 28.71% | 57.28% | 47.73% | 23.77% | 0.77% | 6.42% | 54.13% | 13.15% | 4.12% | 14.76% | 0.23% | 2.43% | 25.11% | 46.80% |
| SAENet [49] | RSWSOD | 2021 | 20.57% | 62.41% | 62.65% | 23.54% | 7.59% | 64.62% | 0.20% | 34.52% | 30.62% | 55.38% | 52.70% | 17.57% | 6.85% | 9.09% | 51.59% | 15.43% | 1.69% | 14.41% | 1.41% | 9.16% | 27.10% | 49.42% |
| SDA-RSOD [17] | RSWSOD | 2022 | 19.51% | 38.86% | 26.40% | 23.56% | 13.30% | 26.84% | 25.33% | 27.09% | 27.17% | 61.04% | 20.89% | 16.78% | 25.57% | 8.28% | 10.34% | 7.53% | 26.52% | 48.81% | 9.28% | 19.16% | 24.11% | - |
| SPG + MELM [51] | RSWSOD | 2022 | 31.32% | 36.66% | 62.79% | 29.10% | 6.08% | 62.66% | 0.31% | 15.00% | 30.10% | 35.00% | 48.02% | 27.11% | 12.00% | 10.02% | 60.04% | 15.10% | 21.00% | 9.92% | 3.15% | 0.06% | 25.77% | 48.30% |
| Qian et al. [18] | RSWSOD | 2022 | 41.10% | 48.62% | 67.48% | 33.92% | 4.32% | 34.71% | 0.74% | 12.29% | 24.33% | 56.74% | 63.55% | 5.36% | 23.11% | 21.34% | 57.44% | 24.66% | 0.85% | 9.97% | 18.34% | 1.54% | 27.52% | 49.92% |
3.2.3. NWPU VHR-10.v2 Dataset
3.2.4. Other Performances

| Name | Type | Year | Airplane | Ship | Storage Tank | Basketball Court | Tennis Court | Basketball Court | Ground Truck Field | Harbor | Bridge | Vehicle | mAP | CorLoc |
|---|---|---|---|---|---|---|---|---|---|---|---|---|---|---|
| Fast RCNN [94] | FSOD | 2015 | 90.91% | 90.60% | 89.29% | 47.32% | 100.00% | 85.85% | 84.86% | 88.22% | 80.29% | 69.84% | 82.71% | - |
| Faster RCNN [62] | FSOD | 2015 | 90.90% | 86.30% | 90.53% | 98.24% | 89.72% | 80.13% | 90.81% | 80.29% | 68.53% | 87.14% | 84.52% | - |
| RICO [86] | FSOD | 2017 | 99.70% | 90.80% | 90.61% | 92.91% | 90.29% | 80.13% | 90.81% | 80.29% | 68.53% | 87.21% | 87.12% | - |
| WSDDN [13] | WSOD | 2016 | 30.08% | 41.72% | 34.98% | 88.90% | 12.86% | 23.85% | 99.43% | 13.94% | 1.92% | 3.60% | 35.12% | 35.24% |
| OICR [14] | WSOD | 2017 | 13.66% | 67.35% | 57.16% | 55.16% | 13.64% | 39.66% | 92.80% | 0.23% | 1.84% | 3.73% | 34.52% | 40.01% |
| PCL [63] | WSOD | 2018 | 26.00% | 63.76% | 2.50% | 89.80% | 64.45% | 76.07% | 77.94% | 0.00% | 1.30% | 15.67% | 39.41% | 45.06% |
| MELM [67] | WSOD | 2018 | 80.86% | 69.30% | 10.48% | 90.17% | 12.84% | 20.14% | 99.17% | 17.10% | 14.17% | 8.68% | 42.29% | 49.87% |
| MIST [69] | WSOD | 2020 | 69.68% | 49.16% | 48.55% | 80.91% | 27.08% | 79.85% | 91.34% | 46.99% | 8.29% | 13.36% | 51.52% | 70.34% |
| PCIR [15] | RSWSOD | 2020 | 90.97% | 78.81% | 36.40% | 90.80% | 22.64% | 52.16% | 88.51% | 42.36% | 11.74% | 35.49% | 54.97% | 71.87% |
| DCL [41] | RSWSOD | 2020 | 72.70% | 74.25% | 37.05% | 82.64% | 36.88% | 42.27% | 83.95% | 39.57% | 16.82% | 35.00% | 52.11% | 69.65% |
| TCANet [16] | RSWSOD | 2020 | 89.43% | 78.18% | 78.42% | 90.80% | 35.27% | 50.36% | 90.91% | 42.44% | 4.11% | 28.30% | 58.82% | 72.76% |
| Wang et al. [45] | RSWSOD | 2021 | 80.90% | 78.30% | 10.50% | 90.10% | 64.40% | 69.10% | 80.20% | 39.60% | 14.00% | 8.70% | 53.60% | 61.50% |
| MIGL [47] | RSWSOD | 2021 | 88.69% | 71.61% | 75.17% | 94.19% | 37.45% | 47.68% | 100.00% | 27.27% | 8.33% | 9.06% | 55.95% | 70.16% |
| SAENet [49] | RSWSOD | 2021 | 82.91% | 74.47% | 50.20% | 96.74% | 55.66% | 72.94% | 100.00% | 36.46% | 6.33% | 31.89% | 60.72% | 73.46% |
| SPG + MELM [51] | RSWSOD | 2022 | 90.42% | 81.00% | 59.53% | 92.31% | 35.64% | 51.44% | 99.92% | 58.71% | 16.99% | 42.99% | 62.80% | 73.41% |
| Qian et al. [18] | RSWSOD | 2022 | 81.64% | 68.33% | 65.31% | 93.44% | 36.43% | 81.54% | 98.67% | 53.77% | 9.86% | 25.87% | 61.49% | 73.68% |
| Name | Year | Dataset | Classes | Performance |
|---|---|---|---|---|
| Cheng et al. [32] | 2014 | Custom Google Earth | 3 | n/d (PR Curve) |
| Cao et al. [36] | 2017 | Custom Google Earth | 1 (vehicles) | n/d (PR Curve) |
| MIRN [37] | 2018 | Custom Google Earth | 1 (vehicles) | n/d (PR Curve) |
| Tokyo Airport | 1 (aircraft) | 98.46% Acc. | ||
| Sidney Airport | 1 (aircraft) | 89.13% Acc. | ||
| LocNet [35] | 2016 | Berlin Airport | 1 (aircraft) | 96.77% Acc. |
| Tokyo Airport | 1 (aircraft) | 96.92% Acc. | ||
| WSA [39] | 2019 | Sidney Airport | 1 (aircraft) | 95.65% Acc. |
| SLS [38] | 2018 | NWPU VHR-9 | 9 (no vehicles) | 11% mAP |
| 18 (trees) | 60.60% Acc. | |||
| Aygunes et al. [25] | 2019 | Custom 8-b MS WV-2 | 40 (trees) | 42.50% Acc. |
| Custom Seattle Trees, 8-b MS WV-2 | 40 (trees) | 51.70% Acc. | ||
| Aygunes et al. [26] | 2021 | Custom Seattle Trees, 8-b MS WV-2, LiDar DSM | 40 (trees) | 53.00% Acc. |
| NWPU VHR-10 | 10 | 94.57% mAP | ||
| LEVIR | 3 | 86.73% mAP | ||
| MPFP-Net [43] | 2021 | DOTA (HBB) | 15 | 84.43% mAP |
| Sun et al. [44] | 2021 | DOTA (OBB) | 15 | 38.6% mAP |
| Du et al. [20] | 2019 | miniSAR | 1 (vehicles) | 84.85% F1 |
| FIN | 4 | 90% mAP | ||
| Shi et al. [23] | 2020 | GCAP | 2 | 93% mAP |
| Li et al. [46] | 2021 | Custom NWPU VHR-10 | 4 | 92.40% mAP |
| Li et al. [48] | 2021 | Custom Mars craters | 1 | 80.00% mAP |
| Semmacape | 8 | 53.00% F1 | ||
| Berg et al. [22] | 2022 | Custom Kelonia | 2 | 56.80% F1 |
| Long et al. [50] | 2022 | Custom World Map, Google Maps | 2 | 89% F1 |
| GF1-LRSD | 1 | 81.25% mAP | ||
| PistonNet [21] | 2022 | NWPU VHR-10 | 10 | 83.19% mAP |
4. Issues and Research Directions
- Coarser annotations: This survey highlighted the fact that almost all RSWSOD approaches are based on image-level labels. Even though this type of annotation is the easiest to obtain, it does not provide any clue regarding the localization of the object. Li et al. [46] recently showed that exploiting other types of labels, e.g., point-based, which are still cheaper than manual BBs, allows performances that are comparable to FS approaches to be obtained. Thus, more research in this direction should be carried out, considering a trade-off between annotation cost and overall model performance.
- Interactive annotations: given the difficulty in correctly detecting some classes, a viable option could be to learn a WS detector and then use human verification to check the correctness of the output BBs and refine them [97]. This could reduce the annotation time and produce high-quality annotations while decreasing the gap with fully supervised settings.
- Hybrid architectures: As reported in the survey, two major categories of approaches are currently leading the research in RSWSOD: MIL-based and CAM-based methods. MIL-based approaches usually provide better overall performances but the performance of each class is highly varied. On the other hand, CAM-based approaches are less widespread and effective than MIL-based approaches but they tend to be more stable in terms of performance over the classes. For this reason, it could be interesting to build hybrid approaches that exploit the advantages of both methods. A first approach was proposed by Wang et al. [45] and exploit CAMs to guide the selection of proposals that are then fed to a MIL-based detector. Still, there is a large room for improvement.
- Transformer-based architectures: Transformers were born to tackle natural language processing (NLP) problems, but their usage has gained much attention in the CV field due to their powerful capabilities. PistonNet [21] showed interesting results with the use of image transformers [82] and provided good generalization capabilities, despite being developed for the specific use-case of ship detection. This powerful family of architectures could be extended to general-purpose RSWSOD.
- Better initial proposals: As shown by Cheng et al. [51], proposal generation is a very critical step because the performance of an MIL-based method is strongly dependent on the quality of the initial proposal. For this reason, developing novel proposal generation methods is fundamental, especially when specific use-cases are addressed, and could boost the performance of WS approaches.
- Transformation consistency and sample difficulty: Recently, Feng et al. [49] brought to the attention of the remote sensing community that previous methods did not take into consideration the consistency across different spatial transformations of the same image, with different augmentations of the same image potentially being labeled differently. At the same time, Qian et al. [18] showed the importance of considering the samples’ difficulty when training the detector. These factors should be carefully taken into consideration when developing future works.
- Learn better representations of the data: Self-supervised learning (SSL) [98] has recently gained much attention in the remote sensing field [99] since it allows better representations of the data to be learned. Instead of pre-training networks on huge datasets of natural images (e.g., ImageNet [7]), it could be interesting to combine self-supervised feature learning in RSIs and weak supervision. This could potentially help improve the performance of WS approaches. For instance, it could be especially useful for those classes that are easily misclassified, such as Bridges and Windmills.
- Benchmark definition: As highlighted in this survey, almost half of the analyzed methods rely on the use of custom datasets. However, this makes it extremely difficult to compare methods with each other. A step in this direction was achieved with the introduction of DIOR [9] and NWPU VHR-10.v2 [86]. However, this is still insufficient for all single-object detection methods. A possibility could be to assess the performance of these methods on single-object images extracted from these datasets. For instance, the performance of airplane detection on the images belonging to the Airplane class of DIOR could be assessed.
5. Conclusions
Author Contributions
Funding
Data Availability Statement
Conflicts of Interest
Abbreviations
| AD | Anomaly Detection |
| AP | Average Precision |
| BB | Bounding Box |
| CAM | Class Activation Map |
| CFAR | Constant False Alarm Rate |
| CNN | Convolutional Neural Network |
| COPD | Collection of Part Detector |
| CV | Computer Vision |
| DBM | Deep Boltzmann Machine |
| DL | Deep Learning |
| EB | Edge Boxes |
| FSOD | Fully Supervised Object Detection |
| GSD | Ground Sample Distance |
| GT | Ground Truth |
| HBB | Horizontal Bounding Boxes |
| mAP | Mean Average Precision |
| MIL | Multiple Instance Learning |
| OBB | Oriented Bounding Boxes |
| OD | Object Detection |
| PLG | Pseudo-label Generator |
| PR | Precision Recall |
| RPN | Region Proposal Network |
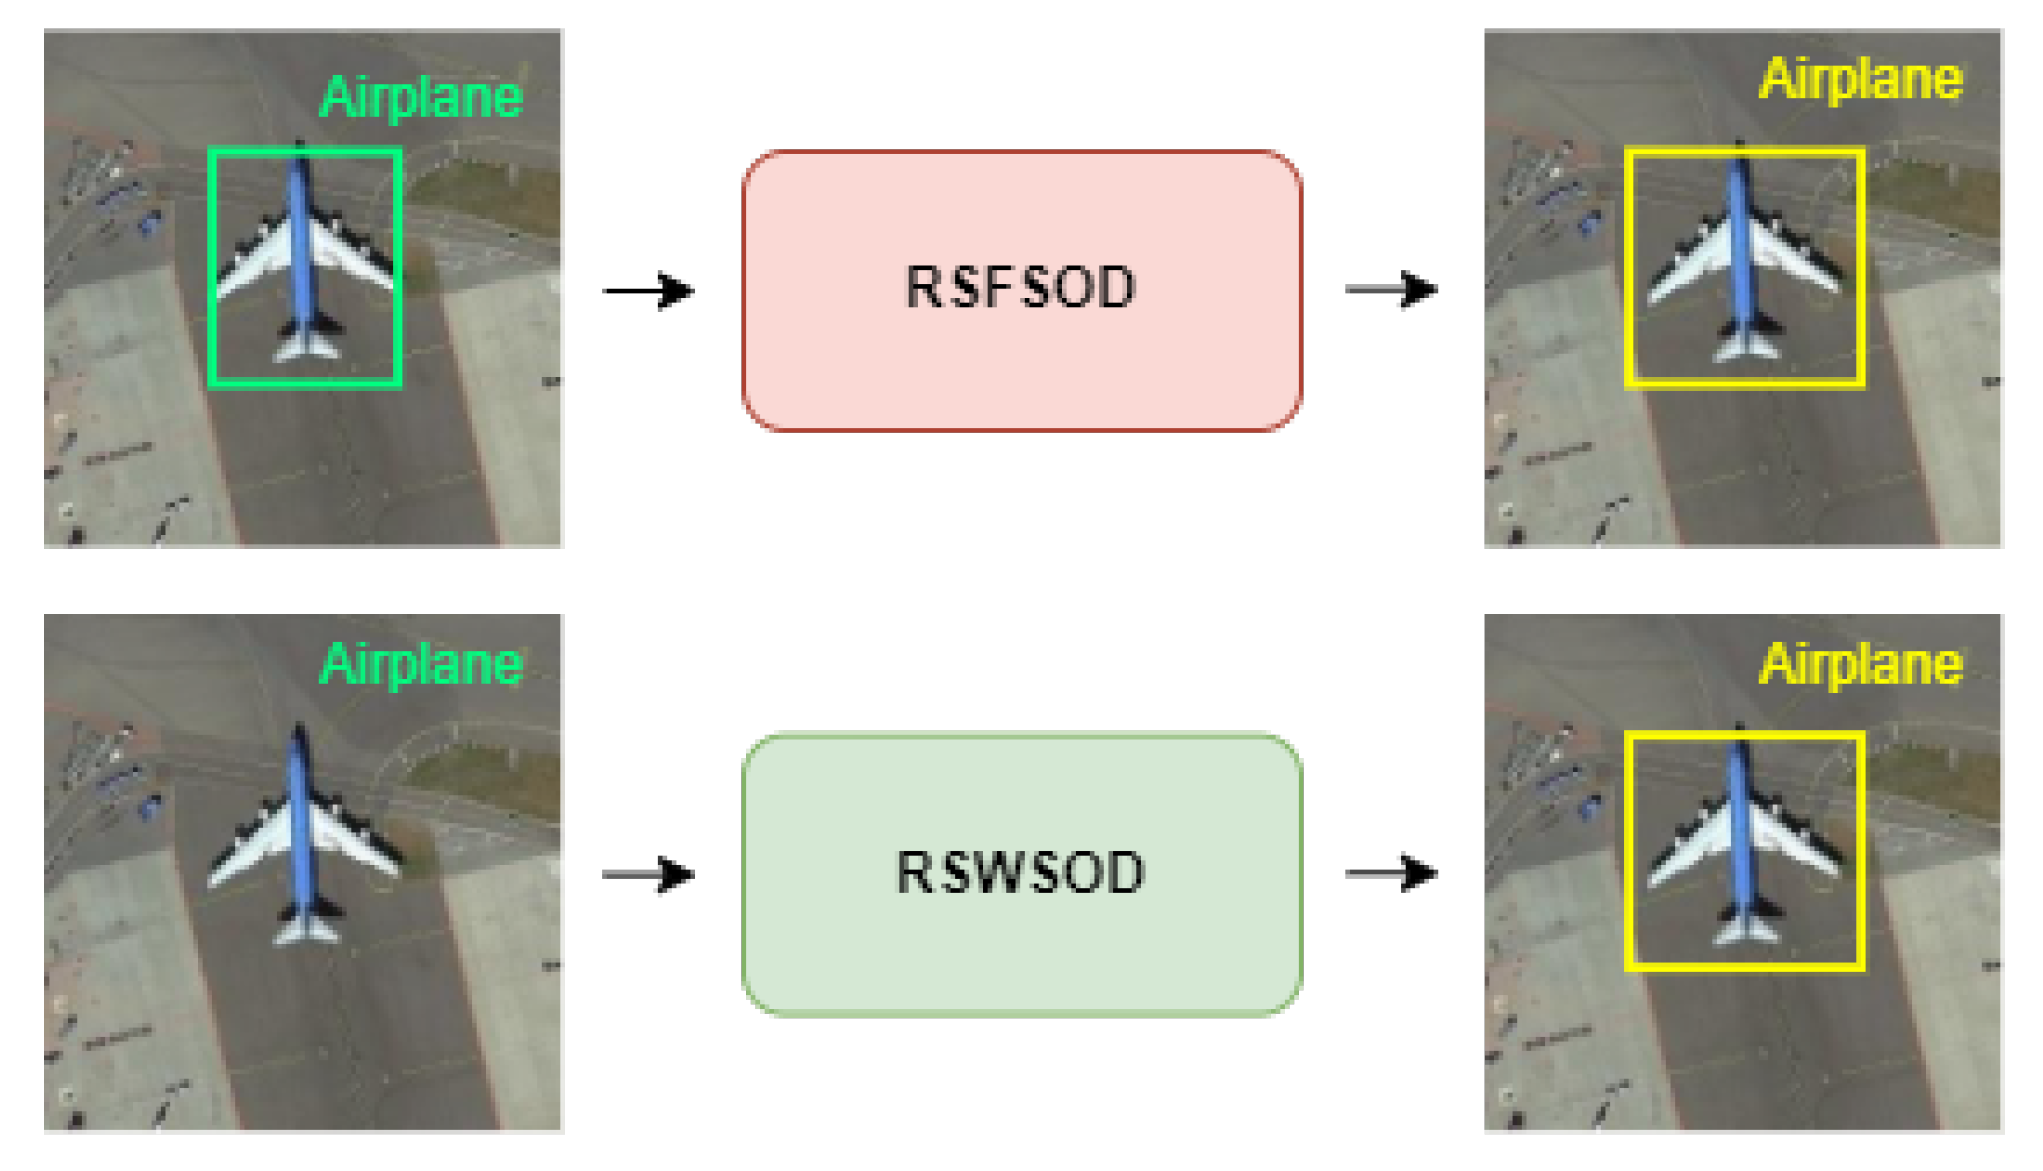
| RSFSOD | Remote Sensing Fully Supervised Object Detection |
| RSI | Remote Sensing Image |
| RSWSOD | Remote Sensing Weakly Supervised Object Detection |
| SAR | Synthetic Aperture Radar |
| Sb-SaS | Saliency-based Self-adaptive Segmentation |
| SOTA | State-of-the-art |
| SS | Selective Search |
| SSL | Self-supervised Learning |
| SVM | Support Vector Machine |
| SW | Sliding Window |
| TDL | Target Detector Learning |
| TSI | Training Set Initialization |
| WS | Weak Supervision |
| WSDDN | Weakly Supervised Deep Detection Network |
| WSOD | Weakly Supervised Object Detection |
| WSOL | Weakly Supervised Object Localization |
References
- He, Z. Deep Learning in Image Classification: A Survey Report. In Proceedings of the 2020 2nd International Conference on Information Technology and Computer Application (ITCA), Guangzhou, China, 18–20 December 2020; pp. 174–177. [Google Scholar] [CrossRef]
- Zaidi, S.S.A.; Ansari, M.S.; Aslam, A.; Kanwal, N.; Asghar, M.; Lee, B. A survey of modern deep learning based object detection models. Digit. Signal Process. 2022, 126, 103514. [Google Scholar] [CrossRef]
- Hafiz, A.M.; Bhat, G.M. A survey on instance segmentation: State of the art. Int. J. Multimed. Inf. Retr. 2020, 9, 171–189. [Google Scholar] [CrossRef]
- Litjens, G.; Kooi, T.; Bejnordi, B.E.; Setio, A.A.A.; Ciompi, F.; Ghafoorian, M.; van der Laak, J.A.; van Ginneken, B.; Sánchez, C.I. A survey on deep learning in medical image analysis. Med. Image Anal. 2017, 42, 60–88. [Google Scholar] [CrossRef] [PubMed]
- Aljabri, M.; AlGhamdi, M. A Review on the Use of Deep Learning for Medical Images Segmentation. Neurocomputing 2022, 506, 311–335. [Google Scholar] [CrossRef]
- Torres, R.N.; Fraternali, P. Learning to identify illegal landfills through scene classification in aerial images. Remote Sens. 2021, 13, 4520. [Google Scholar] [CrossRef]
- Deng, J.; Dong, W.; Socher, R.; Li, L.-J.; Li, K.; Li, F.-F. ImageNet: A large-scale hierarchical image database. In Proceedings of the 2009 IEEE Conference on Computer Vision and Pattern Recognition, Miami, FL, USA, 20–25 June 2009; pp. 248–255. [Google Scholar] [CrossRef]
- Everingham, M.; Eslami, S.; Van Gool, L.; Williams, C.; Winn, J.; Zisserman, A. The Pascal Visual Object Classes Challenge: A Retrospective. Int. J. Comput. Vis. 2014, 111, 98–136. [Google Scholar] [CrossRef]
- Li, K.; Wan, G.; Cheng, G.; Meng, L.; Han, J. Object detection in optical remote sensing images: A survey and a new benchmark. ISPRS J. Photogramm. Remote Sens. 2020, 159, 296–307. [Google Scholar] [CrossRef]
- Xia, G.S.; Bai, X.; Ding, J.; Zhu, Z.; Belongie, S.; Luo, J.; Datcu, M.; Pelillo, M.; Zhang, L. DOTA: A large-scale dataset for object detection in aerial images. In Proceedings of the 2018 IEEE/CVF Conference on Computer Vision and Pattern Recognition, Salt Lake City, UT, USA, 18–23 June 2018; pp. 3974–3983. [Google Scholar]
- Cheng, G.; Han, J.; Lu, X. Remote Sensing Image Scene Classification: Benchmark and State of the Art. Proc. IEEE 2017, 105, 1865–1883. [Google Scholar] [CrossRef]
- Shao, F.; Chen, L.; Shao, J.; Ji, W.; Xiao, S.; Ye, L.; Zhuang, Y.; Xiao, J. Deep Learning for Weakly-Supervised Object Detection and Localization: A Survey. Neurocomputing 2022, 496, 192–207. [Google Scholar] [CrossRef]
- Bilen, H.; Vedaldi, A. Weakly Supervised Deep Detection Networks. In Proceedings of the 2016 IEEE Conference on Computer Vision and Pattern Recognition (CVPR), Las Vegas, NV, USA, 27–30 June 2016; pp. 2846–2854. [Google Scholar] [CrossRef]
- Tang, P.; Wang, X.; Bai, X.; Liu, W. Multiple Instance Detection Network with Online Instance Classifier Refinement. In Proceedings of the 2017 IEEE Conference on Computer Vision and Pattern Recognition (CVPR), Honolulu, HI, USA, 21–26 July 2017; pp. 3059–3067. [Google Scholar] [CrossRef]
- Feng, X.; Han, J.; Yao, X.; Cheng, G. Progressive contextual instance refinement for weakly supervised object detection in remote sensing images. IEEE Trans. Geosci. Remote Sens. 2020, 58, 8002–8012. [Google Scholar] [CrossRef]
- Feng, X.; Han, J.; Yao, X.; Cheng, G. TCANet: Triple context-aware network for weakly supervised object detection in remote sensing images. IEEE Trans. Geosci. Remote Sens. 2020, 59, 6946–6955. [Google Scholar] [CrossRef]
- Wu, Z.Z.; Xu, J.; Wang, Y.; Sun, F.; Tan, M.; Weise, T. Hierarchical fusion and divergent activation based weakly supervised learning for object detection from remote sensing images. Inf. Fusion 2022, 80, 23–43. [Google Scholar] [CrossRef]
- Qian, X.; Huo, Y.; Cheng, G.; Yao, X.; Li, K.; Ren, H.; Wang, W. Incorporating the Completeness and Difficulty of Proposals Into Weakly Supervised Object Detection in Remote Sensing Images. IEEE J. Sel. Top. Appl. Earth Obs. Remote Sens. 2022, 15, 1902–1911. [Google Scholar] [CrossRef]
- Cheng, G.; Han, J.; Zhou, P.; Guo, L. Multi-class geospatial object detection and geographic image classification based on collection of part detectors. ISPRS J. Photogramm. Remote Sens. 2014, 98, 119–132. [Google Scholar] [CrossRef]
- Du, L.; Dai, H.; Wang, Y.; Xie, W.; Wang, Z. Target discrimination based on weakly supervised learning for high-resolution SAR images in complex scenes. IEEE Trans. Geosci. Remote Sens. 2019, 58, 461–472. [Google Scholar] [CrossRef]
- Yang, Y.; Pan, Z.; Hu, Y.; Ding, C. PistonNet: Object Separating From Background by Attention for Weakly Supervised Ship Detection. IEEE J. Sel. Top. Appl. Earth Obs. Remote Sens. 2022, 15, 5190–5202. [Google Scholar] [CrossRef]
- Berg, P.; Santana Maia, D.; Pham, M.T.; Lefèvre, S. Weakly Supervised Detection of Marine Animals in High Resolution Aerial Images. Remote Sens. 2022, 14, 339. [Google Scholar] [CrossRef]
- Shi, C.; Huang, Y. Cap-count guided weakly supervised insulator cap missing detection in aerial images. IEEE Sens. J. 2020, 21, 685–691. [Google Scholar] [CrossRef]
- Yue, J.; Fang, L.; Ghamisi, P.; Xie, W.; Li, J.; Chanussot, J.; Plaza, A. Optical remote sensing image understanding with weak supervision: Concepts, methods, and perspectives. IEEE Geosci. Remote Sens. Mag. 2022, 10, 250–269. [Google Scholar] [CrossRef]
- Aygüneş, B.; Aksoy, S.; Cinbiş, R.G. Weakly supervised deep convolutional networks for fine-grained object recognition in multispectral images. In Proceedings of the IGARSS 2019—2019 IEEE International Geoscience and Remote Sensing Symposium, Yokohama, Japan, 28 July–2 August 2019; pp. 1478–1481. [Google Scholar]
- Aygunes, B.; Cinbis, R.G.; Aksoy, S. Weakly supervised instance attention for multisource fine-grained object recognition with an application to tree species classification. ISPRS J. Photogramm. Remote Sens. 2021, 176, 262–274. [Google Scholar] [CrossRef]
- Page, M.J.; McKenzie, J.E.; Bossuyt, P.M.; Boutron, I.; Hoffmann, T.C.; Mulrow, C.D.; Shamseer, L.; Tetzlaff, J.M.; Akl, E.A.; Brennan, S.E.; et al. The PRISMA 2020 statement: An updated guideline for reporting systematic reviews. Int. J. Surg. 2021, 88, 105906. [Google Scholar] [CrossRef]
- Falagas, M.E.; Pitsouni, E.I.; Malietzis, G.A.; Pappas, G. Comparison of PubMed, Scopus, web of science, and Google scholar: Strengths and weaknesses. FASEB J. 2008, 22, 338–342. [Google Scholar] [CrossRef] [PubMed]
- Zhang, D.; Han, J.; Yu, D.; Han, J. Weakly supervised learning for airplane detection in remote sensing images. In Proceedings of the Second International Conference on Communications, Signal Processing, and Systems; Springer: Cham, Switzerland, 2014; pp. 155–163. [Google Scholar]
- Zhang, D.; Han, J.; Cheng, G.; Liu, Z.; Bu, S.; Guo, L. Weakly supervised learning for target detection in remote sensing images. IEEE Geosci. Remote Sens. Lett. 2014, 12, 701–705. [Google Scholar] [CrossRef]
- Han, J.; Zhang, D.; Cheng, G.; Guo, L.; Ren, J. Object detection in optical remote sensing images based on weakly supervised learning and high-level feature learning. IEEE Trans. Geosci. Remote Sens. 2014, 53, 3325–3337. [Google Scholar] [CrossRef]
- Cheng, G.; Han, J.; Zhou, P.; Guo, L. Scalable multi-class geospatial object detection in high-spatial-resolution remote sensing images. In Proceedings of the 2014 IEEE Geoscience and Remote Sensing Symposium, Quebec City, QC, Canada, 13–18 July 2014; pp. 2479–2482. [Google Scholar]
- Zhou, P.; Zhang, D.; Cheng, G.; Han, J. Negative bootstrapping for weakly supervised target detection in remote sensing images. In Proceedings of the 2015 IEEE International Conference on Multimedia Big Data, Beijing, China, 20–22 April 2015; pp. 318–323. [Google Scholar]
- Zhou, P.; Cheng, G.; Liu, Z.; Bu, S.; Hu, X. Weakly supervised target detection in remote sensing images based on transferred deep features and negative bootstrapping. Multidimens. Syst. Signal Process. 2016, 27, 925–944. [Google Scholar] [CrossRef]
- Zhang, F.; Du, B.; Zhang, L.; Xu, M. Weakly supervised learning based on coupled convolutional neural networks for aircraft detection. IEEE Trans. Geosci. Remote Sens. 2016, 54, 5553–5563. [Google Scholar] [CrossRef]
- Cao, L.; Luo, F.; Chen, L.; Sheng, Y.; Wang, H.; Wang, C.; Ji, R. Weakly supervised vehicle detection in satellite images via multi-instance discriminative learning. Pattern Recognit. 2017, 64, 417–424. [Google Scholar] [CrossRef]
- Sheng, Y.; Cao, L.; Wang, C.; Li, J. Weakly Supervised Vehicle Detection in Satellite Images via Multiple Instance Ranking. In Proceedings of the 2018 24th International Conference on Pattern Recognition (ICPR), Beijing, China, 20–24 August 2018; pp. 2765–2770. [Google Scholar]
- Li, Y.; Zhang, Y.; Huang, X.; Yuille, A.L. Deep networks under scene-level supervision for multi-class geospatial object detection from remote sensing images. ISPRS J. Photogramm. Remote Sens. 2018, 146, 182–196. [Google Scholar] [CrossRef]
- Ji, J.; Zhang, T.; Yang, Z.; Jiang, L.; Zhong, W.; Xiong, H. Aircraft detection from remote sensing image based on a weakly supervised attention model. In Proceedings of the IGARSS 2019-2019 IEEE International Geoscience and Remote Sensing Symposium, Yokohama, Japan, 28 July–2 August 2019; pp. 322–325. [Google Scholar]
- Chen, S.; Shao, D.; Shu, X.; Zhang, C.; Wang, J. FCC-Net: A full-coverage collaborative network for weakly supervised remote sensing object detection. Electronics 2020, 9, 1356. [Google Scholar] [CrossRef]
- Yao, X.; Feng, X.; Han, J.; Cheng, G.; Guo, L. Automatic weakly supervised object detection from high spatial resolution remote sensing images via dynamic curriculum learning. IEEE Trans. Geosci. Remote Sens. 2020, 59, 675–685. [Google Scholar] [CrossRef]
- Wu, Z.Z.; Weise, T.; Wang, Y.; Wang, Y. Convolutional neural network based weakly supervised learning for aircraft detection from remote sensing image. IEEE Access 2020, 8, 158097–158106. [Google Scholar] [CrossRef]
- Shamsolmoali, P.; Chanussot, J.; Zareapoor, M.; Zhou, H.; Yang, J. Multipatch feature pyramid network for weakly supervised object detection in optical remote sensing images. IEEE Trans. Geosci. Remote Sens. 2021, 60, 5610113. [Google Scholar] [CrossRef]
- Sun, Y.; Ran, J.; Yang, F.; Gao, C.; Kurozumi, T.; Kimata, H.; Ye, Z. Oriented Object Detection For Remote Sensing Images Based On Weakly Supervised Learning. In Proceedings of the 2021 IEEE International Conference on Multimedia & Expo Workshops (ICMEW), Shenzhen, China, 5–9 July 2021; pp. 1–6. [Google Scholar]
- Wang, H.; Li, H.; Qian, W.; Diao, W.; Zhao, L.; Zhang, J.; Zhang, D. Dynamic pseudo-label generation for weakly supervised object detection in remote sensing images. Remote Sens. 2021, 13, 1461. [Google Scholar] [CrossRef]
- Li, Y.; He, B.; Melgani, F.; Long, T. Point-based weakly supervised learning for object detection in high spatial resolution remote sensing images. IEEE J. Sel. Top. Appl. Earth Obs. Remote Sens. 2021, 14, 5361–5371. [Google Scholar] [CrossRef]
- Wang, B.; Zhao, Y.; Li, X. Multiple instance graph learning for weakly supervised remote sensing object detection. IEEE Trans. Geosci. Remote Sens. 2021, 60, 5613112. [Google Scholar] [CrossRef]
- Li, W.; Hsu, C.Y.; Hu, M. Tobler’s First Law in GeoAI: A spatially explicit deep learning model for terrain feature detection under weak supervision. Ann. Am. Assoc. Geogr. 2021, 111, 1887–1905. [Google Scholar] [CrossRef]
- Feng, X.; Yao, X.; Cheng, G.; Han, J.; Han, J. Saenet: Self-supervised adversarial and equivariant network for weakly supervised object detection in remote sensing images. IEEE Trans. Geosci. Remote Sens. 2021, 60, 5610411. [Google Scholar] [CrossRef]
- Long, Y.; Zhai, X.; Wan, Q.; Tan, X. Object Localization in Weakly Labeled Remote Sensing Images Based on Deep Convolutional Features. Remote Sens. 2022, 14, 3230. [Google Scholar] [CrossRef]
- Cheng, G.; Xie, X.; Chen, W.; Feng, X.; Yao, X.; Han, J. Self-guided Proposal Generation for Weakly Supervised Object Detection. IEEE Trans. Geosci. Remote Sens. 2022, 60, 5625311. [Google Scholar] [CrossRef]
- Uijlings, J.R.R.; van de Sande, K.E.A.; Gevers, T.; Smeulders, A.W.M. Selective Search for Object Recognition. Int. J. Comput. Vis. 2013, 104, 154–171. [Google Scholar] [CrossRef]
- Zitnick, C.L.; Dollár, P. Edge Boxes: Locating Object Proposals from Edges. In Computer Vision—ECCV 2014, Proceedings of the 13th European Conference, Zurich, Switzerland, 6–12 September 2014; Fleet, D., Pajdla, T., Schiele, B., Tuytelaars, T., Eds.; Springer International Publishing: Cham, Switzerland, 2014; pp. 391–405. [Google Scholar]
- Zou, Z.; Shi, Z.; Guo, Y.; Ye, J. Object detection in 20 years: A survey. arXiv 2019, arXiv:1905.05055. [Google Scholar]
- Dietterich, T.G.; Lathrop, R.H.; Lozano-Pérez, T. Solving the multiple instance problem with axis-parallel rectangles. Artif. Intell. 1997, 89, 31–71. [Google Scholar] [CrossRef]
- Andrews, S.; Tsochantaridis, I.; Hofmann, T. Support vector machines for multiple-instance learning. Adv. Neural Inf. Process. Syst. 2002, 15, 561–568. [Google Scholar]
- Lowe, D.G. Distinctive image features from scale-invariant keypoints. Int. J. Comput. Vis. 2004, 60, 91–110. [Google Scholar] [CrossRef]
- Dalal, N.; Triggs, B. Histograms of oriented gradients for human detection. In Proceedings of the 2005 IEEE Computer Society Conference on Computer Vision and Pattern Recognition (CVPR’05), San Diego, CA, USA, 20–25 June 2005; Volume 1, pp. 886–893. [Google Scholar]
- Webb, G.I. Bayes’ Rule. In Encyclopedia of Machine Learning and Data Mining; Sammut, C., Webb, G.I., Eds.; Springer: Boston, MA, USA, 2017; p. 99. [Google Scholar] [CrossRef]
- Salakhutdinov, R.; Hinton, G. Deep Boltzmann Machines. In Proceedings of the Twelth International Conference on Artificial Intelligence and Statistics; van Dyk, D., Welling, M., Eds.; PMLR: Clearwater Beach, FL, USA, 2009; Volume 5, pp. 448–455. [Google Scholar]
- Krizhevsky, A.; Sutskever, I.; Hinton, G. ImageNet Classification with Deep Convolutional Neural Networks. Commun. ACM 2017, 60, 84–90. [Google Scholar] [CrossRef]
- Ren, S.; He, K.; Girshick, R.; Sun, J. Faster R-CNN: Towards Real-Time Object Detection with Region Proposal Networks. arXiv 2015, arXiv:1506.01497. [Google Scholar] [CrossRef]
- Tang, P.; Wang, X.; Bai, S.; Shen, W.; Bai, X.; Liu, W.; Yuille, A. PCL: Proposal Cluster Learning for Weakly Supervised Object Detection. IEEE Trans. Pattern Anal. Mach. Intell. 2018, 42, 176–191. [Google Scholar] [CrossRef]
- Bengio, Y.; Louradour, J.; Collobert, R.; Weston, J. Curriculum learning. In Proceedings of the 26th Annual International Conference on Machine Learning, Montreal, QC, Canada, 14–18 June 2009; pp. 41–48. [Google Scholar]
- Sangineto, E.; Nabi, M.; Culibrk, D.; Sebe, N. Self paced deep learning for weakly supervised object detection. IEEE Trans. Pattern Anal. Mach. Intell. 2018, 41, 712–725. [Google Scholar] [CrossRef]
- Zhang, D.; Han, J.; Zhao, L.; Meng, D. Leveraging prior-knowledge for weakly supervised object detection under a collaborative self-paced curriculum learning framework. Int. J. Comput. Vis. 2019, 127, 363–380. [Google Scholar] [CrossRef]
- Wan, F.; Wei, P.; Jiao, J.; Han, Z.; Ye, Q. Min-Entropy Latent Model for Weakly Supervised Object Detection. In Proceedings of the 2018 IEEE/CVF Conference on Computer Vision and Pattern Recognition, Salt Lake City, UT, USA, 18–23 June 2018; pp. 1297–1306. [Google Scholar] [CrossRef]
- Ahn, J.; Cho, S.; Kwak, S. Weakly Supervised Learning of Instance Segmentation with Inter-Pixel Relations. In Proceedings of the 2019 IEEE/CVF Conference on Computer Vision and Pattern Recognition (CVPR), Long Beach, CA, USA, 15–20 June 2019; pp. 2204–2213. [Google Scholar] [CrossRef]
- Ren, Z.; Yu, Z.; Yang, X.; Liu, M.Y.; Lee, Y.J.; Schwing, A.G.; Kautz, J. Instance-aware, context-focused, and memory-efficient weakly supervised object detection. In Proceedings of the IEEE/CVF Conference on Computer Vision and Pattern Recognition, Seattle, WA, USA, 13–19 June 2020; pp. 10598–10607. [Google Scholar]
- Zhou, B.; Khosla, A.; Lapedriza, A.; Oliva, A.; Torralba, A. Object Detectors Emerge in Deep Scene CNNs. arXiv 2014, arXiv:1412.6856. [Google Scholar]
- Oquab, M.; Bottou, L.; Laptev, I.; Sivic, J. Is object localization for free? Weakly-supervised learning with convolutional neural networks. In Proceedings of the 2015 IEEE Conference on Computer Vision and Pattern Recognition (CVPR), Boston, MA, USA, 7–12 June 2015; pp. 685–694. [Google Scholar] [CrossRef]
- Zhou, B.; Khosla, A.; Lapedriza, A.; Oliva, A.; Torralba, A. Learning deep features for discriminative localization. In Proceedings of the IEEE Conference on Computer Vision and Pattern Recognition, Las Vegas, NV, USA, 27–30 June 2016; pp. 2921–2929. [Google Scholar]
- Wei, J.; Wang, Q.; Li, Z.; Wang, S.; Zhou, S.K.; Cui, S. Shallow feature matters for weakly supervised object localization. In Proceedings of the IEEE/CVF Conference on Computer Vision and Pattern Recognition, Nashville, TN, USA, 20–25 June 2021; pp. 5993–6001. [Google Scholar]
- Yang, S.; Kim, Y.; Kim, Y.; Kim, C. Combinational Class Activation Maps for Weakly Supervised Object Localization. arXiv 2019, arXiv:1910.05518. [Google Scholar]
- Xue, H.; Liu, C.; Wan, F.; Jiao, J.; Ji, X.; Ye, Q. DANet: Divergent Activation for Weakly Supervised Object Localization. In Proceedings of the 2019 IEEE/CVF International Conference on Computer Vision (ICCV), Seoul, Korea, 27 October–2 November 2019; pp. 6588–6597. [Google Scholar] [CrossRef]
- Mai, J.; Yang, M.; Luo, W. Erasing Integrated Learning: A Simple Yet Effective Approach for Weakly Supervised Object Localization. In Proceedings of the IEEE/CVF Conference on Computer Vision and Pattern Recognition (CVPR), Seattle, WA, USA, 13–19 June 2020. [Google Scholar]
- Wang, K.; Oramas, J.; Tuytelaars, T. MinMaxCAM: Improving object coverage for CAM-basedWeakly Supervised Object Localization. arXiv 2021, arXiv:2104.14375. [Google Scholar]
- Hou, L.; Lu, K.; Xue, J. Refined One-Stage Oriented Object Detection Method for Remote Sensing Images. IEEE Trans. Image Process. 2022, 31, 1545–1558. [Google Scholar] [CrossRef]
- Dong, Z.; Wang, M.; Wang, Y.; Liu, Y.; Feng, Y.; Xu, W. Multi-Oriented Object Detection in High-Resolution Remote Sensing Imagery Based on Convolutional Neural Networks with Adaptive Object Orientation Features. Remote Sens. 2022, 14, 950. [Google Scholar] [CrossRef]
- Blei, D.M.; Ng, A.Y.; Jordan, M.I. Latent dirichlet allocation. J. Mach. Learn. Res. 2003, 3, 993–1022. [Google Scholar]
- Gao, G.; Liu, L.; Zhao, L.; Shi, G.; Kuang, G. An adaptive and fast CFAR algorithm based on automatic censoring for target detection in high-resolution SAR images. IEEE Trans. Geosci. Remote Sens. 2008, 47, 1685–1697. [Google Scholar] [CrossRef]
- Vaswani, A.; Shazeer, N.; Parmar, N.; Uszkoreit, J.; Jones, L.; Gomez, A.N.; Kaiser, Ł.; Polosukhin, I. Attention is all you need. Adv. Neural Inf. Process. Syst. 2017, 30, 6000–6010. [Google Scholar]
- Defard, T.; Setkov, A.; Loesch, A.; Audigier, R. Padim: A patch distribution modeling framework for anomaly detection and localization. In Proceedings of the International Conference on Pattern Recognition, Virtual, 10–15 January 2021; Springer: Cham, Switzerland, 2021; pp. 475–489. [Google Scholar]
- Redmon, J.; Farhadi, A. YOLOv3: An Incremental Improvement. arXiv 2018, arXiv:1804.02767. [Google Scholar]
- Cramer, M. The DGPF-Test on Digital Airborne Camera Evaluation Overview and Test Design. Photogramm.-Fernerkund.-Geoinf. 2010, 2010, 73–82. [Google Scholar] [CrossRef]
- Li, K.; Cheng, G.; Bu, S.; You, X. Rotation-insensitive and context-augmented object detection in remote sensing images. IEEE Trans. Geosci. Remote Sens. 2017, 56, 2337–2348. [Google Scholar] [CrossRef]
- Zou, Z.; Shi, Z. Random Access Memories: A New Paradigm for Target Detection in High Resolution Aerial Remote Sensing Images. IEEE Trans. Image Process. 2018, 27, 1100–1111. [Google Scholar] [CrossRef] [PubMed]
- Chen, H.; Shi, Z. A Spatial-Temporal Attention-Based Method and a New Dataset for Remote Sensing Image Change Detection. Remote Sens. 2020, 12, 1662. [Google Scholar] [CrossRef]
- Deselaers, T.; Alexe, B.; Ferrari, V. Weakly supervised localization and learning with generic knowledge. Int. J. Comput. Vis. 2012, 100, 275–293. [Google Scholar] [CrossRef]
- Xu, S.; Fang, T.; Li, D.; Wang, S. Object Classification of Aerial Images with Bag-of-Visual Words. IEEE Geosci. Remote Sens. Lett. 2010, 7, 366–370. [Google Scholar] [CrossRef]
- Han, J.; Zhou, P.; Zhang, D.; Cheng, G.; Guo, L.; Liu, Z.; Bu, S.; Wu, J. Efficient, simultaneous detection of multi-class geospatial targets based on visual saliency modeling and discriminative learning of sparse coding. ISPRS J. Photogramm. Remote Sens. 2014, 89, 37–48. [Google Scholar] [CrossRef]
- Wang, J.; Yang, J.; Yu, K.; Lv, F.; Huang, T.; Gong, Y. Locality-constrained linear coding for image classification. In Proceedings of the 2010 IEEE Computer Society Conference on Computer Vision and Pattern Recognition, San Francisco, CA, USA, 13–18 June 2010; pp. 3360–3367. [Google Scholar]
- Sun, H.; Sun, X.; Wang, H.; Li, Y.; Li, X. Automatic Target Detection in High-Resolution Remote Sensing Images Using Spatial Sparse Coding Bag-of-Words Model. IEEE Geosci. Remote Sens. Lett. 2012, 9, 109–113. [Google Scholar] [CrossRef]
- Girshick, R. Fast R-CNN. In Proceedings of the IEEE International Conference on Computer Vision (ICCV), Santiago, Chile, 7–13 December 2015. [Google Scholar]
- Zhang, X.; Wei, Y.; Feng, J.; Yang, Y.; Huang, T.S. Adversarial complementary learning for weakly supervised object localization. In Proceedings of the IEEE Conference on Computer Vision and Pattern Recognition, Salt Lake City, UT, USA, 18–23 June 2018; pp. 1325–1334. [Google Scholar]
- Xie, X.; Cheng, G.; Wang, J.; Yao, X.; Han, J. Oriented R-CNN for Object Detection. arXiv 2021, arXiv:2108.05699. [Google Scholar]
- Papadopoulos, D.P.; Uijlings, J.R.; Keller, F.; Ferrari, V. We Don’t Need No Bounding-Boxes: Training Object Class Detectors Using Only Human Verification. In Proceedings of the 2016 IEEE Conference on Computer Vision and Pattern Recognition (CVPR), Las Vegas, NV, USA, 27–30 June 2016; IEEE Computer Society: Los Alamitos, CA, USA, 2016; pp. 854–863. [Google Scholar] [CrossRef]
- Albelwi, S. Survey on Self-Supervised Learning: Auxiliary Pretext Tasks and Contrastive Learning Methods in Imaging. Entropy 2022, 24, 551. [Google Scholar] [CrossRef]
- Wang, Y.; Albrecht, C.M.; Braham, N.A.A.; Mou, L.; Zhu, X.X. Self-supervised Learning in Remote Sensing: A Review. arXiv 2022, arXiv:2206.13188. [Google Scholar] [CrossRef]


| Name | Year | Annotation Type | Approach | Proposals | Use Case- Specific | Partial Coverage | Multiple- Instance | Density | Speed | Generalizability |
|---|---|---|---|---|---|---|---|---|---|---|
| Zhang et al. [29] | 2014 | Image | TSI + TDL | Sb-SaS | Aircraft Detection | |||||
| Zhang et al. [30] | 2014 | Image | TSI + TDL | Sb-SaS | Generic | |||||
| Han et al. [31] | 2014 | Image | TSI + TDL | SW | Generic | |||||
| Cheng et al. [32] | 2014 | Image | TSI + TDL | SW | Generic | |||||
| Zhou et al. [33] | 2015 | Image | TSI + TDL | Sb-SaS | Generic | |||||
| Zhou et al. [34] | 2016 | Image | TSI + TDL | Sb-SaS | Generic | |||||
| LocNet [35] | 2016 | Image | TSI + TDL | RPN | Aircraft Detection | ✓ | ||||
| Cao et al. [36] | 2017 | Region | MIL | SW | Vehicle Detection | |||||
| MIRN [37] | 2018 | Region | MIL | n/d | Vehicle Detection | ✓ | ||||
| SLS [38] | 2018 | Scene | CAM | Heatmap | Generic | ✓ | ✓ | |||
| Du et al. [20] | 2019 | Image | TSI + TDL | CFAR | Generic | |||||
| WSA [39] | 2019 | Image | CAM | Heatmap | Aircraft Detection | ✓ | ✓ | |||
| Aygunes et al. [25] | 2019 | Image | MIL | SW | Tree-species classification | |||||
| FCC-Net [40] | 2020 | Image | MIL | SS | Generic | ✓ | ||||
| DCL [41] | 2020 | Image | MIL | SS | Generic | ✓ | ||||
| PCIR [15] | 2020 | Image | MIL | SS | Generic | ✓ | ✓ | ✓ | ||
| AlexNet-WSL [42] | 2020 | Image | CAM | Heatmap | Aircraft Detection | ✓ | ||||
| Shi et al. [23] | 2020 | Coarse BB, Count | Other | RPN | Cap Missing Detection | ✓ | ||||
| TCANet [16] | 2020 | Image | MIL | SS | Generic | ✓ | ✓ | ✓ | ||
| MPFP-Net [43] | 2021 | Image | MIL | Random | Generic | ✓ | ✓ | |||
| Aygunes et al. [26] | 2021 | Image | MIL | SW | Tree-species classification | |||||
| Sun et al. [44] | 2021 | HBB | Other | RPN | Generic | ✓ | ✓ | |||
| Wang et al. [45] | 2021 | Image | MIL + CAM | SS, Heatmap | Generic | ✓ | ||||
| Li et al. [46] | 2021 | Point | Other | SS | Generic | ✓ | ✓ | |||
| MIGL [47] | 2021 | Image | MIL | SS | Generic | ✓ | ✓ | |||
| Li et al. [48] | 2021 | Image, Count | Other | RPN | Terrain Feature Detection | ✓ | ||||
| SAENet [49] | 2021 | Image | MIL | SS | Generic | ✓ | ||||
| Berg et al. [22] | 2022 | Image | Other | Heatmap | Marine Animals Detection | ✓ | ||||
| Long et al. [50] | 2022 | Image | CAM | Heatmap | Generic | ✓ | ✓ | |||
| PistonNet [21] | 2022 | Image | Other | Heatmap | Ship Detection | ✓ | ||||
| SDA-RSOD [17] | 2022 | Image | CAM | Heatmap | Generic | ✓ | ✓ | ✓ | ||
| SPG + MELM [51] | 2022 | Image | MIL | RPN | Generic | ✓ | ✓ | |||
| Qian et al. [18] | 2022 | Image | MIL | SS | Generic | ✓ | ✓ |
| Name | Year | Annotation Type | # Images | # BB Annotations | # Positive Training Images | # Classes | Dimension (Pixels) | Spatial Resolution | Target Area (Pixels) | # Evaluated |
|---|---|---|---|---|---|---|---|---|---|---|
| ISPRS [85] | 2010 | BB | 100 | - | - | 1 (Vehicle) | ≈900 × 700 | 8–15 cm | 1150∼11,976 | 3 |
| Google Earth [29] | 2013 | BB | 120 | - | 50 | 1 (Airplane) | ≈1000 × 800 | ≈0.5 m | 700∼25,488 | 5 |
| Landsat-7 ETM+ [30] | 2014 | BB | 180 | - | - | 1 (Airport) | 400 × 400 | 30 m | 1760∼15,570 | 3 |
| NWPU-VHR-10 [19] | 2014 | BB, pixel | 800 | 3896 | 150 | 10 | 533 × 597∼ 1728 × 1028 | 0.08–2 m | 1122∼174,724 | 4 |
| NWPU-VHR-10.v2 [86] | 2017 | BB, Pixel | 1172 | - | - | 10 | 400 × 400 | - | - | 8 |
| DOTA [10] | 2018 | Oriented BB | 2806 | 188,282 | 1411 | 15 | ≈4000 × 4000 | - | - | 2 |
| LEVIR [87] | 2018 | BB | 21,952 | 11,028 | 400 | 3 | 600 × 800 | 0.2–1 m | 10∼600 | 2 |
| WSADD [42] | 2020 | BB | 700 | - | 300 | 1 (Airplane) | 768 × 768 | 0.3–2 m | - | 2 |
| DIOR [9] | 2020 | BB | 23,463 | 192,472 | 5862 | 20 | 800 × 800 | 0.5–30 m | - | 10 |
Publisher’s Note: MDPI stays neutral with regard to jurisdictional claims in published maps and institutional affiliations. |
© 2022 by the authors. Licensee MDPI, Basel, Switzerland. This article is an open access article distributed under the terms and conditions of the Creative Commons Attribution (CC BY) license (https://creativecommons.org/licenses/by/4.0/).
Share and Cite
Fasana, C.; Pasini, S.; Milani, F.; Fraternali, P. Weakly Supervised Object Detection for Remote Sensing Images: A Survey. Remote Sens. 2022, 14, 5362. https://doi.org/10.3390/rs14215362
Fasana C, Pasini S, Milani F, Fraternali P. Weakly Supervised Object Detection for Remote Sensing Images: A Survey. Remote Sensing. 2022; 14(21):5362. https://doi.org/10.3390/rs14215362
Chicago/Turabian StyleFasana, Corrado, Samuele Pasini, Federico Milani, and Piero Fraternali. 2022. "Weakly Supervised Object Detection for Remote Sensing Images: A Survey" Remote Sensing 14, no. 21: 5362. https://doi.org/10.3390/rs14215362
APA StyleFasana, C., Pasini, S., Milani, F., & Fraternali, P. (2022). Weakly Supervised Object Detection for Remote Sensing Images: A Survey. Remote Sensing, 14(21), 5362. https://doi.org/10.3390/rs14215362