Abstract
The continued interest in this research topic can be justified by the fact that a direct correlation between financial performance and managerial performance has not yet been reached at the level of an entity in general and implicitly at the level of an energy entity. The assumed objective of the research was to make a theoretical, methodological, and empirical evaluation of the cause-effect relationships between financial performance and managerial performance. Regarding the working instruments for data collection and interpretation, the most commonly used research method was the comparative method used both in the approach of theoretical aspects and during the empirical research carried out. In addition, longitudinal methods were used both by presenting the evolution in time of the concepts debated in the work, as well as by the evolution in time of the performance indicators. At the end of the work, the observation method was used to draw partial conclusions. The results of the research confirm the hypothesis according to which the decision to implement the organizational change at the level of the entity has a significant contribution to the efficiency of the activity, as can be seen from the evolution of the net result.
1. Introduction
The modernization of existing technologies is widely recognized as critical to improving the productivity, sustainability, and resilience of organizations of all kinds. The generation, testing, and dissemination of technologies are at the heart of development-oriented industrial research. In the context of modernizing existing systems, how should energy professionals understand technological change, and how can it be most meaningfully and effectively documented, measured, and evaluated? Understanding the process of technological change and assessing its consequences is a major challenge for individuals and organizations involved in development-oriented energy research. The dominant concepts of technological adoption do not provide a solid foundation for understanding the process and consequences of technological change. We review various studies that introduce more challenging frameworks for understanding technology and technological developments. The current paper refers to financial performance as a consequence of implementing a decision for an organizational change through the rehabilitation/modernization of an energy generator block with a capacity of 330 MW at the Rovinari power station.
The importance of the research work emerges from the actuality of the treated theme, given that the Energy Industry in Romania represents a true vehicle for the national economy and a viable solution for the energy problem in the European space. An additional argument that justifies the timeliness and importance of the research theme is offered by well-known authors in the field of finance and performance management, who have pointed out that, during crises, many organizations reduce or even abandon performance management—especially due to difficulties in measuring performance.
The present work tries to treat and analyze the topic of financial performance under the impact of managerial performance following the decision to implement organizational change at the level of an economic entity because performance must not only be measured but must also be managed.
The general objective of the paper is to calculate the financial performance of the decision to refurbish/modernize the energy group within the main coal-based electricity producer in Romania.
Today, a fundamental role is played by the performance of economic entities in a context where the competition for each market segment has become ever closer, and the mechanisms of globalization are sweeping the weakest. Financial performance is a firm goal in the management of entities in general and in the Romanian energy industry in particular. Thus, the chance to survive in this competition increases considerably for those economic entities that discover and reduce their vulnerabilities very quickly and, moreover, implement performant management tools that facilitate their detection, explanation, and resolution of various management gaps.
Among the research methods used are the analysis of documents, the comparative method, as well as the interpretative method. The analysis of the documents consists in going through the specialized literature related to the approached theme, extracting from it the most important aspects for our analysis. The information sources used include books, scientific articles published in various journals and specialized journals in the economic field, and legislative acts and regulations of national and international organizations working in the financial field.
The main objective of the presented research is the analysis of the financial performance of the company from the perspective of the capacity to streamline the activity following the decision to implement the organizational change, which results in the economic and financial indicators calculated, in the difficult economic context, doubled by the increased economic requirements, which the Romanian companies have to face as a result of the integration into the Structures of the European Union.
The secondary objectives, arising from the main objective, take into account: the analysis of the elements underlying the achievement of the gross result, the net result, as well as the identification of the financial flow at the level of the company.
The results characterize the overall financial performance of the activity as a result of a decision to implement an organizational change.
The analysis carried out in this work is based on the importance of the energy produced by coal, in the current context of the energy crisis. Although they campaign to increase the share of renewable energy, the electricity produced from coal still plays an important role in the market.
The energy sector is going through a global metamorphosis. The main trends of the metamorphosis are the pursuit of sustainability [1], the frequency of renewable technologies [2], the length of decentralized solutions [3], the increased use of digital devices [4], and the focus on energy efficiency and security [5]. Grounded on the foundations of the contingency theory [6], this changing environment means pressure for companies in the energy sector to adapt and renew technologies. Renewal needs innovation, but the innovation-focused change management is difficult because of strategic [7,8,9], structural [10], capability-based [11,12], and managerial [12] dilemmas. This complexity is multiplied by two further factors. First of all, even though disruptive technologies with new value creation can change the dynamics of an industry, they are less attractive for (large) companies for investments because of their prior inferior performance compared with well-known technologies [13]. Second, in the global energy sector, renewal is impeded by several internal and external factors: (a) strict external regulation, which is mainly due to the energy supplying activity (previously) critical on the nation-state level and occasionally due to state ownership [14,15]; (b) large organization size and bureaucracy, which causes difficulties in the decision making concerning innovation [5]; (c) the dominance of current technology and resources, which makes it difficult to focus on new technologies [16,17].
Rovinari power station is a part of Oltenia Energy Complex Corporation—Rovinari power station branch. Rovinari power station was designed and built to deliver electric power to the National Energy Grid using lignite coal. The power station is placed near the mine, which provides the possibility of direct use of large quantities of coal from the carboniferous area ensuring a short transport distance for coal.
The energy power block at this time has registered 87,734 working hours since the last capital revision done in the year 1999. The last high-end revision at boiler no. 5 was done in the period 24 June 1994–9 April 1998, the volume for the replaced parts being minimal. After the revision, there were no more interventions as the system was functional and under pressure. The number of functioning hours between two revisions is 24,000 h, which at this time for this block is way overdue.
The high number of working hours and start/stop cycles of the block have brought repercussions on usage safety, technical and economic performance, and the necessity of fitting into European environmental conditions imposed the urgent rehabilitation/modernization of the block.
Regarding the actual state of equipment and installations, the following considerations can be stated:
- –
- Equipment and installations are in working condition, with some components showing high physical and moral wear and tear;
- –
- Operation of the energy production unit is possible on the one hand due to the repairs and modernizing (few in number) done over the years and on the other hand due to the experience and high technical qualification of the exploitation personnel;
- –
- There is a high exploitation risk due to conception and old technology used in the production of certain components (in this case, medium and low power stations, automation installation);
- –
- Due to the time since the electrical equipment was commissioned, there are serious issues in procuring spare parts—certain equipment being out of production.
Technical characteristics of current electrical equipment do not ensure compliance with stipulations of the National Authority for Regulations in the Energy Domain (ANRE) and do not meet the technical conditions for interconnecting in the UCTE (Union for the Coordination of the Transmission of Electricity).
The 330 MW energy power block requires rehabilitation/modernization in order to continue functioning with technical and economic efficiency and other much-needed work in order to meet environmental requests.
The main consequences for the rehabilitation/modernization will be:
- –
- Reduced specific consumption of fuel and energy;
- –
- Increased efficiency for the installations and equipment;
- –
- Reduced costs for exploitation, maintenance, and repairs;
- –
- Reduced environmental impact and compliance with the environmental legislation due to reduced emissions of SO2 and NOx within the limits specified in the Industrial Emissions Directive.
The decision for the technological change was adopted in view of improved performance, efficient, safe, competitive functioning, and reduced environmental impact of the energy block.
Specific objectives:
- –
- Assessing the investment works needed for rehabilitation/modernization and what is to be done, highlighting eligible spending in order to obtain the grant;
- –
- Establishing technical performance indicators that need to be obtained after the rehabilitation/modernization;
- –
- Improving reliability and safety for equipment and installations;
- –
- Increased time and energy availability;
- –
- Prolonged life expectancy with another 15 years;
- –
- Improving technical and economic parameters.
The study was based on the premise that investments at the level of a company that has as its object of activity one of the priority areas of the national economy, namely the production of electricity, play a key role in improving financial performance, a fact resulting from the calculated indicators. Such a decision at the level of the analyzed company to refurbish/modernize a group generates, in addition to improving the company’s financial performance, a series of other secondary results with direct economic-financial implications, namely: increasing the availability of time and energy, extending the duration of operation of the block with another 15 years, the introduction of modern automation, regulation and control systems.
In order to confirm the research hypothesis, hypotheses were formulated in the paper that provides the directions of the approach of the study, namely:
Hypothesis 1.
Investments at the level of a company play a key role in achieving the financial performance of a company and in its growth.
Hypothesis 2.
There is a strong correlation between the investments made at the level of a company whose main objective is electricity.
The study carried out in the present scientific paper highlights the financial performance of the company through the indicators presented in the paper as a result of the managerial decision to rehabilitate/modernize the energy block.
The research work brings value to the specialized empirical literature by identifying and calculating the indicators that are the basis for determining the financial performance brought when organizational changes are imposed at the microeconomic level for the taxation of technical and, finally, financial performances because any company, regardless of the field of activity has as its final objective the maximization of profit.
The approach from a scientific point of view in the present study is different from other studies because it aims at the investment decision based on a series of indicators. This decision has an impact at the organizational level in a company whose main object of activity is the production of energy, a field of national strategy in an international context. Following the EU’s accession to the Paris Agreement and the publication of the Energy Union Strategy, the Union has assumed an important role in combating climate change. Among the five main dimensions assumed within the strategy, three of them concern energy, specifically: energy security, decarbonization, and energy efficiency [18].
The concern of this study is based on the main objectives in the field of energy assumed by the EU’s accession to the Paris Agreement.
Thus, each EU member state was obliged to submit to the European Commission a Project of the Integrated National Plan in the field of Energy and Climate Change (PNIESC) for the period 2021–2030.
The economic and financial crisis, as well as the resource policy in the field of energy, were the basis of the analyzes carried out from a financial point of view at the level of the company for the adoption of the decision to refurbish/modernize the existing energy group.
In addition, the present study was carried out on the basis of some economic-financial indicators to quantify the financial performance as a result of the refurbishment/modernization decision that comes as a response to the measures that Romania has undertaken in the field of energy. Among these measures is the adoption of the decarbonization plan proposed by Complexul Energetic Oltenia, the main producer of coal-based electricity—with the aim of ensuring a sustainable transition towards electricity production with low carbon emissions.
This means that the analyzed company will adopt only those investments that can generate future profits, and these decisions can only be adopted based on the analysis of some economic-financial indicators, as was also done in this paper.
This paper answers the question, “Is it opportune or not to make the investment decision that has as its object the rehabilitation/modernization of the energy block within the company, which for Romania is the main producer of coal-based electricity?”. To answer this question, a series of indicators were taken into account to determine financial performance, namely: net profit, gross profit, cash flow, Updated Net Financial Value of Capital (UNFV/K), Internal Rate of Financial Return on Capital (IRFN/K), Cost Benefit Report (B/C-K).
This question arises with the increasing importance of the quality of electricity in modern electricity supply systems, thus increasing the demands on the equipment that produces the electricity and that can measure both the quality and the level of the energy used. Hence, analyzing the financial performance generated by the refurbishment/modernization of the energy group through the indicators mentioned in the present research paper, the benefits of adopting this refurbishment /modernization decision can be observed.
The approach from a scientific point of view in this study is different from other studies because it aims at the investment decision based on a series of indicators. This decision has an impact at the organizational level in a company whose main object of activity is the production of energy, a field of national strategy in an international context. Following the EU’s accession to the Paris Agreement and the publication of the Energy Union Strategy, the Union has assumed an important role in combating climate change.
Among the five main dimensions assumed within the strategy, three of them concern energy specifically: energy security, decarbonization, and energy efficiency [18].
The concern of this study is based on the main objectives in the field of energy assumed by the EU’s accession to the Paris Agreement. Thus, each EU member state was obliged to submit to the European Commission a Project of the Integrated National Plan in the field of Energy and Climate Change (PNIESC) for the period 2021–2030.
The paper is structured as follows: the next section (Section 2) includes a review of the specialized literature in relation to the research carried out, Section 2.3 presents the research methodology, Section 3 highlights the results obtained from the analyzes carried out reflecting a series of indicators to quantify financial performance, Section 4 is devoted to discussions, and the last, Section 5, provides the end of the research through a series of conclusions.
2. Materials and Methods
2.1. Literature Review
Transitioning from a centralized monopoly economy based on tense relationship structures (mainly one-way linkages with no alternatives) to a competitive economy based on market mechanisms, on the actions of supply and demand, certainly represents one of the most severe challenges of the current period [19]. The complex processes—of privatization, restructuring, liberalization of prices, and eliminations of subventions—that accompany the economic reform, as well as the institutional and legislative transformations, the profound modifications in the mechanisms of coordination at different levels and the model of external markets, in the context of economic internationalization and the integration in the European Union, represent fundamental changes, significant and ample mutations that characterize the organizational environment [19].
Energy transformation in the European Union countries is progressing. Its scope is defined by formal and legal regulations, and its effectiveness by the position of decision-makers legitimized by public support for a particular type of challenge [20].
The shape of business models is influenced by technological progress. It often results in changes to existing business models. Technological change stimulates the creation of new solutions, new products, or a different perspective on the process of satisfying customer needs [21].
The use of the management of change and appropriate economic strategies must be based on the new domestic and international conditions in which enterprises operate in order to thus define the viable economy, which will guide the management of the enterprise to achieve the set objectives and profits [19].
In line with this, when discussing organizational change and change management, the integration can be important not only on a scientific level but concerning the counterpoints found in the change management literature as well (for example, realizing change with a top-down and bottom-up approach).
Decades ago, several studies proved that organizations that adapt to their environment can survive [6,22,23]. However, adaptation to a changing environment is not a simple task since every organization is striving for some kind of stability. Thus, change management has to be realized against organizational inertia. Therefore, adaptation to the environment, which has three types, requires organizational change (Table 1).

Table 1.
Types of adaptation Source: based on Dobák, 2002 [24].
Several kinds of change could happen simultaneously in the organization [24]. Since Burnes (2014) points out that “change management is not a distinct discipline with rigid and clearly defined boundaries” [25], it is important to explicitly articulate our own definition before discussing change management more profoundly. According to our current interpretation, change management means leading those organizational changes that are needed for environmental adaptation and organizational renewal. It is important to emphasize that change management is necessary not only because of changing external factors but because internal factors can generate change within the organization as well. Consequently: Change management is a managerial activity that has as its goal the identification, preparation, planning, implementation, and maintenance of the changes needed for environmental adaptation and organizational renewal. Due to the internal factors, in our definition of change management, organizational renewal denoting internal factors appears alongside environmental adaptation.
Based on Dobák (2002) interpretation regarding organizational change, we can talk about changes observed in the substantial characteristics of the organization, which can be interpreted in the given environmental and organizational situation. These can change simultaneously with different intensities. Moreover, they can have a considerable effect on each other.
The significant characteristics can be the following [24]:
- (1)
- Strategy;
- (2)
- Structure;
- (3)
- Culture;
- (4)
- Behavior;
- (5)
- Technology;
- (6)
- Operational processes;
- (7)
- Outputs;
- (8)
- Power relations.
Based on interpreting the organization as an open system—according to which the organization is in a constant relationship with the external environment [24], organizational change can be caused by external and internal factors alike. The external forces that make the change necessary can be defined with the toolkit of strategic management (for example, PESTEL, Porter’s five forces analysis). Such change-generating factors can be the following:
- (a)
- Global trends (for example, digitalization and pursuit of sustainability);
- (b)
- Progression in the industry’s life cycle;
- (c)
- Change in the competition within the industry (either because of the change of macro trends, industry actors, strategic actions, or the regulating environment);
- (d)
- Progression of the product’s life cycle;
- (e)
- New inventions and innovations [26].
Currently, the pace of change has increased, exceeding the ability of most organizations to react, the psychological contract between employees and employers has disappeared, and some of the most respected private and public institutions have reached the edge of the abyss. In order to cope with the change, most of the time, it is necessary to “reinvent” the organization, which implies simultaneous changes in different elements of the organization. Processes will be redesigned, new opportunities and strategies will appear, organizational structures and relationships will change, both inside and outside the organization, new infrastructures and information technology will be needed, modernization of the work of managers will change, and there will be necessary new behavioral typologies. All this will make the work of managers more difficult, especially since shareholders and customers will demand that the change happen quickly.
The achievement of the objectives assumed by the management of each economic unit, under the conditions of emphasizing the limited character of an increasing number of production factors, the improvement of technologies, the diversification and integration of production activity, the increasing dependence of economic results on the influence of environmental factors, are just a few elements that increase the qualitative requirements of the entire decision-making process.
The increase in global competitiveness has forced many companies to become calculated. Technological changes are those that affect the process of transforming inputs into outputs—for example, changing equipment, changing the work process, changing the degree of automation, and using new technologies that influence the subsystems of the organization. Technological discoveries in the field of computers have revolutionized the design, development, and manufacture of products.
However, the change can also be generated by a variety of forces within the organization. An organization is made up of subsystems in continuous and dynamic interaction. The factors that influence the relationships between different subsystems in the context of an organization are technological, internal policies, and dominant groups.
Organizational changes are of three types:
- (i).
- Technological, made possible by breakthroughs in technologies;
- (ii).
- Structural, i.e., change the organizational design by reorganizing product groups into different areas;
- (iii).
- Human, i.e., transforming people in an organization by improving the management skills of senior leaders.
Technological or Process-Oriented Change. These types of organizational changes refer to changes in the technology a company uses or the processes it follows. This can be the introduction of new software or a new system. Businesses can redesign processes to streamline workflow and increase productivity.
2.1.1. Technological Change
Nowadays, there is considerable and growing interest in research on technological change, particularly in some of the problems that this research has generated. Interest in technological change, however, has not been constant throughout history, and perceptions of technological change have undergone very considerable variations in the course of time.
These fluctuations may be related to the changing role of technological change in socioeconomic development. Technological change has always been an important part of the progress of human society: since the invention of the wheel and the discovery of fire, and more recently, with the development of windmills and waterwheels. However, the scale and pervasiveness of the role of technological change have changed qualitatively since the Industrial Revolution. At the time, observers and students of socioeconomic development were aware of this rapidly increasing role of technological change, but not as we see it today. 19th-century economic historians, for example. Some consequences of technological change cannot be ignored.
They watched the new machine, such as Kai’s shuttle, steam engine, and mule. However, they argued that technological advances (or some of them) were at the root of the acceleration in economic growth that was taking place at the time. Paradoxically, there is no attempt to explain how these machines actually contribute to this economic growth [27]. Among economists of the eighteenth and nineteenth centuries, Karl Marx and Adam Smith were outstanding. Their work [28,29] combines (in different ways) an interest in the fundamental workings of capitalist society with an analysis of how technological change itself takes place. Apart from these exceptions, the dominant approach recognizes the fundamental importance of new machines as a cause of economic growth. However, this can be taken for granted and needs no explanation [27].
Although this point of view appears nowadays too narrow, it has been very persistent among economists and economic historians. Related to this point of view are several ideas and concepts which, for a long time, have been underlying economic treatments of technological change. Thus, for example, technology has been regarded as exogenous to the economic system. On this assumption, the generation of new technologies is seen as independent of economic factors. On the other hand, the economic effects of technology, for example, its contribution to economic growth, can be considerable, resulting from continuous decreases in unit costs and the opening up of markets for new products.
The literature on the economics of technological change is extensive and diverse. Major sub-areas (with references to surveys related to those areas) include the theory of incentives for research and development [30,31]; the measurement of innovative inputs and outputs [32,33]; analysis and measurement of externalities resulting from the research process [34,35]; the measurement and analysis of productivity growth [36,37]; diffusion of new technology [38,39]; the economic effects of publicly funded research [40]; and the role of technological change in endogenous macroeconomic growth [41]. In this section, we present a selective overview designed to provide entry points into this large literature.
Modern theories of technological change processes [42] can be traced back to the ideas of Josef Schumpeter (1942), who saw innovation as a hallmark of the modern capitalist system [43]. Entrepreneurs, attracted by the vision of the temporary market power that a successful new product or process might provide, keep launching such products [44].
They may enjoy excess profits for some period of time until they are displaced by subsequent successful innovators, in a continuing process that Schumpeter called “creative destruction” [43].
Schumpeter distinguishes three steps or stages in the process of bringing new technology to market. An invention is the first development of a new scientific or technological product or process. Inventions can be patented, but many are not. However, most inventions never actually develop into innovations and only happen when a new product or process is commercialized (i.e., placed on the market). If a company discovers a pre-existing technological idea that has never been commercialized and commercializes a product or process based on that idea, it can innovate without inventing anything. The invention and innovation phases are primarily carried out in private companies through a process commonly referred to as “research and development” (R&D) [44]. Ultimately, through corporate or individual adoption, a process called diffusion, successful innovations gradually become widely available in relevant applications [43]. The cumulative economic or environmental impact of new technology results from all three of these stages, which we refer to collectively as the process of technological change.
Jaffe, Adam B.; Newell, Richard G.; Stavins, R. N analyze the measurement of the rate and direction of technological change rests fundamentally on the concept of the transformation function [44].
where Y represents a vector of outputs, I represents a vector of inputs, and t is time. Equation (1) describes a production possibility frontier, that is, a set of combinations of inputs and outputs that are technically feasible at a point in time. Technological change is represented by the movement of this frontier that makes it possible over time to use given o produce output vectors that were not previously feasible.
T(Y,I,t) ≤ 0
In most applications, the separability and aggregation assumptions are made, allowing an economical production technique to be represented by the production function,
where Y is now a scalar quantity of the total Metric output (for example, gross domestic product), and the list of inputs on the right-hand side of the production function can be made arbitrarily long.
Y = f(K,L,E;t)
For illustrative purposes, they conceive of output as being made from a single composite of capital goods, K, a single composite of labor inputs, L, and a single composite of environmental inputs, E (for example, waste assimilation) [44]. Again, technological change means that the relationship between these inputs and possible output levels changes over time. Logarithmic differentiation of Equation (2) with respect to time yields
in which lower case letters represent the percentage growth rates of the corresponding upper-case variable; the βs represent the corresponding logarithmic partial derivatives from Equation (2); and the t indicates that all quantities and parameters may change over time.,(This formulation can be considered a first-order approximation to an arbitrary functional form for Equation (2). Higher-order approximations can also be implemented) [44].
yt = At + βLt lt + βKtkt + βEt et
The term At corresponds to “neutral” technological change in the sense that it represents the rate of growth of output if the growth rates of all inputs were zero. However, the possibility that the βs can change over time allows for “biased” technological change, that is, changes over time in the relative productivity of the various inputs [44].
Equations (2) and (3) are most easily interpreted in the case of process innovation, in which firms figure out more efficient ways to make existing products, allowing output to grow at a rate faster than inputs are growing. In principle, these equations also apply to product innovation [44]. Y is a composite or aggregate output measure in which the distinct outputs of the economy are each weighted by their relative value, as measured by their market price. Improved products are often sold at higher prices than lower-quality products, which means that their introduction increases measured output even if the physical quantities of new products do not exceed those of the old products they replace. In practice, however, product improvement will be included in measured productivity only to the extent that the price indices used to convert nominal GDP or other nominal output measures to real output measures are purged of the effects of product innovation. In general, official price indices and the corresponding real output measures achieve this objective only to a limited extent [44].
At first glance, Equation (3) does not account for the source of productivity gains associated with the neutral concept of technological change, At. However, if all inputs and outputs are properly weighed, and inputs (including R&D) generate only normal returns on investment. All endogenous contributions to outputs should be reflected by returns on inputs, weighted between. There should be no “residual” differences in the growth rates of inputs and outputs. Thus, observations with generally positive residuals are interpreted as indicating a source of exogenous technological change [44].
There is now an extensive literature on measuring and interpreting residual productivity.
The “econometric” method estimates the parameters of Equation (3) from time series data and derives the magnitude of At as the econometric residual after considering the estimated impact of all measurable inputs on the output [38,45]. In both approaches, great attention is paid to the difficulty of adequately measuring the input and output [45]. This problem is particularly problematic when measuring natural capital stocks, which, if ignored or incorrectly measured, can lead to distortions in productivity residuals [46].
In many cases, it is difficult to distinguish the impact of innovation and diffusion. We observe improvements in productivity (or other measures of performance). We do not have the underlying information necessary to separate these improvements into movements at the production front and those of existing firms at the front.
A related issue often associated with environmental technological change is that innovation can come from manufacturers or users of industrial equipment. In the former case, innovation often needs to be embodied in new capital goods, which then need to be disseminated through the purchase of these goods by groups of users to affect productivity or environmental performance. In the latter case, innovation can take the form of changing practices implemented by existing equipment. Alternatively, companies can develop new devices for their own use, which may or may not then be sold to other companies.
The fact that the sites of activity that generate environmental technological change can be supplying companies, consuming companies, or both has important implications for simulating the interaction of technological change and environmental policy [46]. The manifestation of new technologies in new capital goods creates ambiguity about the role of technological diffusion in Equations (2) and (3) [44]. One explanation is that these equations represent “best practice,” what the economy would produce if all innovations to date were sufficiently diffused. According to this interpretation, innovation will drive technological change in Equation (3); diffusion problems will arise in the form of firms producing at points within the production possibilities frontier. Boundary estimation techniques are needed to measure the extent to which this sub-boundary behavior occurs [45]. Alternatively, it can be assumed that users of older equipment are making optimal, informed decisions about when to retire old machines and buy new ones with better technology. In this formula, the observed frontier movement—measured technological change—includes the combined effects of the invention, innovation, and diffusion processes. The importance of technological change to economic growth and development has long been recognized; finding new knowledge and introducing it into the economic development process becomes a professional activity. At the same time, technological change can provide the basis for new industries and the rejuvenation or modernization of older sectors. New products and services tend to substitute for old ones and also tend to erode markets held by those producing or supplying under old technological regimes. New processes can give cost, quality, delivery, and reliability advantages over non-adopters [47].
2.1.2. Financial Performance
At the theoretical level, the aspects related to financial performance are materialized in a very extensive bibliography, national, international, printed, or electronic. In order to synthesize the main concepts, models of calculation, and approaches to financial performance, in writing the present work, we took into account some of these benchmarks, considered relevant, which constituted the theoretical and methodological basis. The study of the most recent research in the field, published in the specialized journals, has contributed to the updating of the knowledge stage, providing a starting point for the present work, identifying possibilities to extend the research carried out, aspects that were not captured in the previous studies. Bibliographical elements that constituted the theoretical support of the present work are presented in the bibliography section presented at the end of the paper.
Financial performance is a widely developed topic at all academic levels and in a specialized practice. The interest in this issue was present in the concerns of the Romanian and foreign authors, specialists in finance, accounting, financial management, financial management, financial management, evaluation, general management, and value management. The chosen subject is, therefore, a very complex, versatile, multivalent, inter and transdisciplinary one.
The concept of performance has its origin in the Latin word “perficiere,“ which means “to complete a proposed action” [48]. The performance incorporates complex phenomena and results that characterize an organization in all the actions it performs throughout its existence [49]. Authors such as Tannenbaum and Shimdt (2009) state that performance signifies “the ability of an organization or an individual to achieve its goals” [50].
“Performance is the set of elementary logical steps of the action, from intent to result” [51]. However, we cannot separate the result; namely, the performance achieved, from the means and activities by which it was achieved, from the objectives set to be achieved because a result is nothing if it is analyzed on its own. Moreover, “If you can’t measure, you can’t control it. If you can’t control, you can’t manage. If you can’t manage, you can’t improve, and you can’t be performing” [52].
2.2. Data and Methodology
In order to quantify the financial performance of the decision to re-engineer/modernize the group at the level of the analyzed company, the cost-benefit analysis (CBA) was used. It represents an economic-mathematical tool intended to facilitate the making of financing decisions and implicitly the allocation of economic resources currently, in the hope of obtaining future economic benefits, in the context of the uncertainties associated with a long time horizon.
The stages of carrying out the cost-benefit analysis method are closely related to the legislative framework at the European and national levels. The regulatory framework of the cost-benefit analysis method means:
- (1)
- Legal documents issued at the level of the European Union and any other type of document issued by an institution of the European Union, with mandatory provisions for the Member States;
- (2)
- The legal documents issued by the Romanian Parliament and the Romanian Government, which impose mandatory requirements regarding the field of electricity at the national level.
The cost-benefit analysis method is an analytical tool used to estimate, from the point of view of benefits and costs, the financial impact due to the implementation of certain projects. In the present case, a refurbishment/modernization project of an energy group within the company is presented.
From the point of view of the particularities of the cost-benefit analysis method, it differs from a simple financial evaluation because all gains and losses are taken into account.
The general methodological framework of the research carried out is based on the revision of the literature specific to the research problem that allowed the clarification of some aspects regarding the key concepts of the work.
Very important sources of information in bibliographic documentation were represented by the current scientific papers published in national and international specialized journals and by the studies carried out at the level of the energetic society.
Combining qualitative and quantitative methods in research involves a triangulation process that minimizes the specific inconveniences of each research method, helping the researcher to obtain the desired information through several ways [53].
The main arguments that formed the basis for choosing the research topic were:
- (a)
- Concern for the development of previously approached research ideas;
- (b)
- The concern to carry out inter- and transdisciplinary research (finance and management) that offers new theoretical and practical perspectives;
- (c)
- The concern to make contributions on three levels: scientific, by assessing the state of knowledge in the field; methodologically, by applying its own methodologies for evaluating the effects of financing the modernization of the energetic group on the financial performance and practical, so that the research can serve as a guide to decision-makers concerned with increasing the performance of a company through refurbishment decisions.
Regarding the working instruments for data collection and interpretation, the most commonly used research method was the comparative method used both in the approach of theoretical aspects and during the empirical research carried out. In addition, longitudinal methods were used both by presenting the evolution in time of the concepts debated in the work, as well as by the evolution in time of the performance indicators, and at the end of the work, it was applied to the method of observation by drawing partial conclusions.
The financial analysis of the project is carried out on the outline of the energy block by the cost-benefit method, taking into account the updating technique. The methodology used in the development of the financial analysis is that of “discounted net cash flow.” Thus, only cash flows will be taken into account, each flow is recorded in the year in which it is generated; non-monetary flows, such as depreciation and provisions, will not be included in the calculation of financial performance indicators.
The analysis is carried out from the point of view of the beneficiary (owner) of the project, with the main objective of determining the profitability of the investment by calculating the financial performance indicators. The financial analysis is carried out from the point of view of the own capital invested in the project.
The financial analysis includes the following stages:
- (1)
- Determination of the Flow of Income and Expenses during the analysis period;
- (2)
- Determination of the Financial Flow of the Business (Financial Flow of the capital) during the analysis period
- (3)
- Calculation of efficiency indicators:
- –
- Updated Net Financial Value related to equity (VNAF/K); expresses the updated cumulative surplus of the financial flow during the analysis period; represents the difference between the total updated Revenues and the total updated Expenses; shows the ability of net income to support the recovery of the invested equity;
- –
- Internal Rate of Return on equity (RIR/K); measures the project’s ability to ensure an adequate return on the invested capital;
- –
- Benefit/cost ratio (B/C).
- –
- The duration of recovery of the invested equity.
The financial flow of their own capital shows the investor the degree of profitability that his investment entails and gives him an image of the opportunity of investing in the present project compared with another use of his own funds (bank deposits, purchase of shares, other capital investments). The financial flow of equity shows the financing institution (bank) how the project beneficiary pays its financial obligations (interest payment and loan repayment) without jeopardizing the operational activity of the investment objective. The efficiency indicators mentioned above are calculated taking into account all sources of financing the project and the beneficiary’s financial obligations.
As a principle of financial analysis, sources of financing are considered at the time when they are actually paid (e.g., in the case of a loan, at the time of repayment).
The project is considered profitable for positive VNAF/K and RIRF/K higher than the calculated discount rate.
Energy premises of the analysis.
The technical-economic analysis is carried out on the basis of the estimated technical performances for the prospective operation of the energy block after the completion of the works foreseen for the period 2015–2020.
The technical data of the energy block estimated to be obtained after the completion of the rehabilitation and modernization works are presented in Table 2.
Table 2.
The technical data of the energy block estimated to be obtained after the completion of the rehabilitation and modernization works.
2.3. Economic Premises of the Analysis
The financial analysis is carried out on the basis of the following premises:
- –
- The analysis is carried out in RON on the outline of the energy block;
- –
- The period of the analysis is 21 years, of which the duration of commercial exploitation is 15 years;
- –
- The discount rate taken into account in the present analysis is 5%;
- –
- The total investment value, in prices valid on 31 December 2017.
Total investment value (with VAT and credit cost), 768,734.98 thousand RON.
Total investment value (without VAT and with credit cost), 650,053.33 thousand RON.
Total investment value (without VAT and without credit cost), 620,000 thousand RON.
The breakdown of the rehabilitation and modernization investment (without VAT) is presented in Table 3 and Table 4.
Table 3.
The installment of the investment without VAT but with credit cost.
Table 4.
The installment of the investment without VAT and without credit cost.
The investment value related to IDG is 180,000 thousand RON. The breakdown by year of the IDG-related investment is presented in Table 5.
Table 5.
The breakdown by year of the IDG related.
The profit tax considered for the evaluation of the net profit is 10%, according to the latest legislative amendments in force (OG No. 79/2017 for the amendment and completion of Law no. 227/2015 on the Fiscal Code).
The evolution of prices
The prices taken into account in the financial analysis were communicated by the beneficiary and have the following values for the analyzed period:
- –
- The price of lignite—50 ron/ton, constant value throughout the analyzed period;
- –
- The price of natural gas (at PCi)—started with a value of 1770 RON/1000 m3 in 2020 and reached a value of 2012 RON/1000 m3 in 2035.
The evolution of the price of natural gas is also presented in Figure 1.
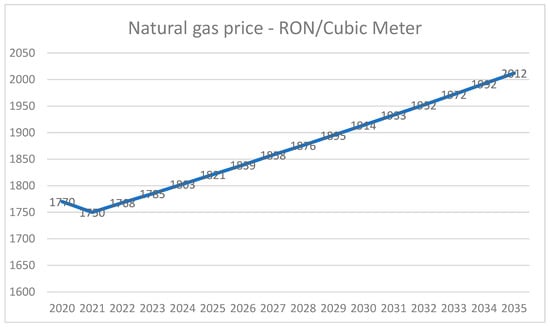
Figure 1.
The evolution of the price of natural gas.
The price of heavy fuel oil—started with a value of 1550 RON/1000 m3 in 2020 and reached a value of 1775 RON/1000 m3 in 2035.
The evolution of the heavy fuel oil price is also presented in Figure 2.
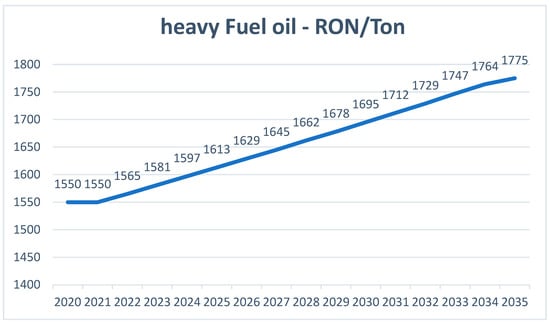
Figure 2.
The evolution of the fuel price.
The selling price of electricity—started with a value of 200 RON/MWh in 2020 and reached a value of 232.2 RON/MWh in 2035.
The evolution of the electricity price is also presented in the Figure 3.
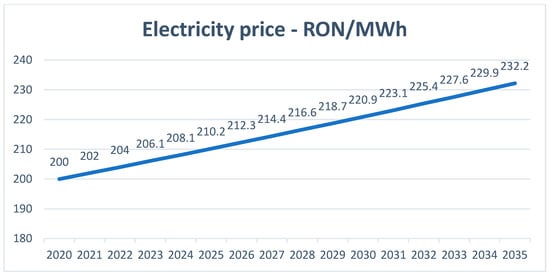
Figure 3.
The evolution of the electricity price.
The price of electricity purchased from NES—started with a value of 282 RON/MWh in 2020 and reached a value of 324.2 RON/MWh in 2035.
The evolution of the price of electricity purchased from NES is also presented in Figure 4.
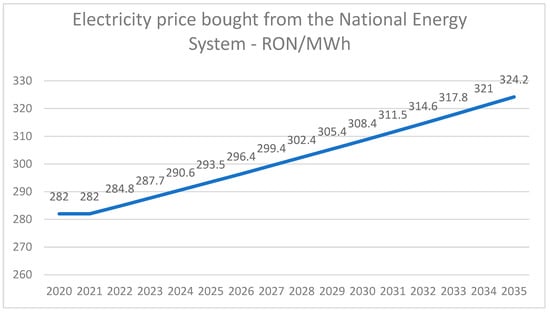
Figure 4.
The evolution of the price of electricity purchased from NES.
The price of CO2 emission certificates started with a value of 42.3 RON/t in 2020 and reached a value of 87.9 RON/t in 2035. The evolution of the price of CO2 emission certificates is also presented in Figure 5.
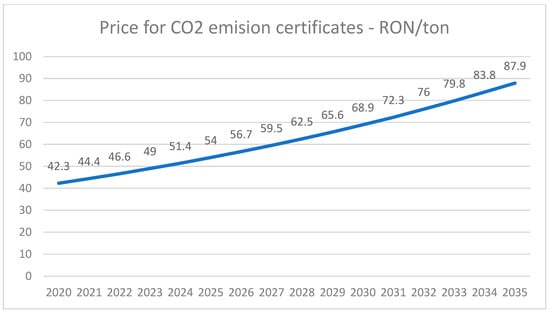
Figure 5.
The evolution of the price of CO2 emission certificates.
The price of limestone—started with a value of 127.7 RON/t in 2020 and reached a value of 136.8 RON/t in 2035.
In order to establish the financial performance of the refurbishment/modernization decision for an energy group based on the cost-benefit analysis, the expenditure flows over the analysis time period were also determined. As a result, in the evolution of the prices taken into account for the quantification of expenses (Figure 1, Figure 2, Figure 3, Figure 4 and Figure 5), it was predicted that they would register a constant linear increase. This forecast was made because the financial investment decision for the rehabilitation/modernization of the power group based on the cost-benefit analysis targets the financial forecasts for both cash inflows and cash outflows, which are affected by the time factor in the opposite direction.
The evolution of the limestone price is also presented in Figure 6.
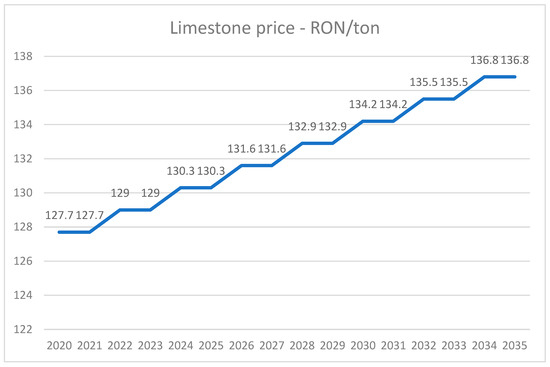
Figure 6.
The evolution of the limestone price.
Salary cost—the information related to the salary expense (ron/person/month) was made available by the beneficiary. It started with a value of 5637 ron/person/month in 2020 and reached a value of 6480 ron/person/year in 2035.
The salary evolution is also presented in the Figure 7.
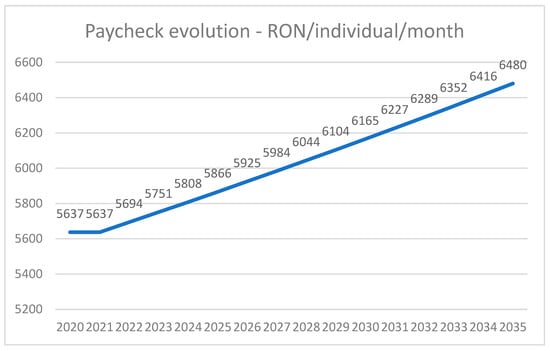
Figure 7.
The salary evolution.
Annual income
The annual revenues obtained from the exploitation activity of the energy block are made up of the following:
- –
- Revenues from the sale of delivered electricity—determined on the basis of the annual quantities of delivered electricity and its sale prices
- –
- Income from system services—evaluated based on the exploitation activity of the beneficiary
The annual operating expenses of the energy block include the following elements:
- 1.
- Variable expenses:
- –
- Technological fuel (lignite, fuel oil, natural gas);
- –
- Electricity from NES;
- –
- Technological water;
- –
- CO2 certificates;
- –
- Limestone.
- 2.
- Fixed expenses:
- –
- Wages and similar;
- –
- Repairs and maintenance;
- –
- Non-technological fuel;
- –
- Environmental fund;
- –
- Other expenses.
- 3.
- Depreciation of new investments:
- –
- Depreciation of the rehabilitation and modernization investment of block no. 5;
- –
- Amortization of IDG.
3. Results
3.1. The Flow of Income and Expenses
The flow of Income and Expenses, on the basis of which the Gross Operating Profit and the Net Profit for the exercise are determined year by year, was determined based on the following calculation elements:
- –
- Annual revenue;
- –
- Annual operating expenses;
- –
- Depreciation;
- –
- Financial expenses related to the loan contracted to finance the rehabilitation and modernization investment of the energy block.
The evolution of gross operating profit has the following evolution during the analyzed period (Figure 8).
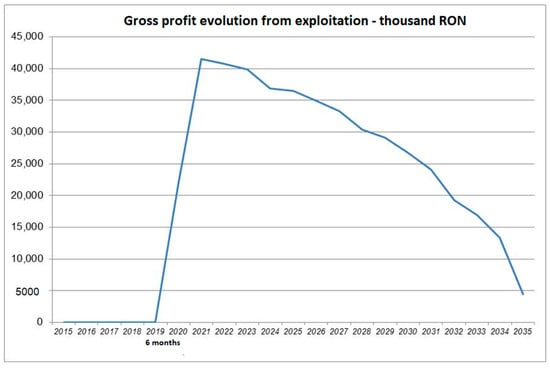
Figure 8.
The evolution of the gross operating profit.
From the graph presented, it can be seen that a positive result (profit) is obtained from the operational activity throughout the analysis period; the revenues from the sale of electricity and the activity of technological system services fully cover the annual operating expenses and lead to profit.
As can be seen on the graph, the gross profit expected to be recorded throughout the analysis period, as a result of the financial decision to re-engineer/modernize the energy group at the level of the analyzed company, is a positive one, which means that the income from the sale of energy electricity is higher than the total annual expenses generated by this activity. The evolution of gross profit over the analyzed period is not linear or exponential because the time factor generates additional costs, which implies an increase in operating expenses and implicitly a decrease in gross profit over time, even if this indicator continues to register positive values.
The evolution of the net profit during the analyzed period has the following evolution (Figure 9).
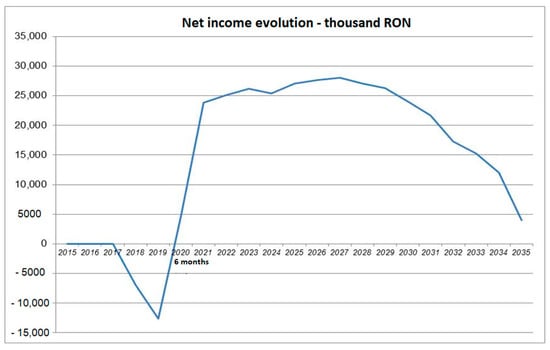
Figure 9.
The evolution of the net profit.
From the graph presented, it can be seen that during the execution period of the investment works, a negative result is obtained generated by the financial expenses that are paid during this period (interest and bank charges). After the commissioning of the rehabilitated and modernized energy block, the revenues from the sale of electricity and from the activity of technological system services fully cover both operating expenses and financial expenses (interest and commissions) and lead to profit.
3.2. Financial Flow of the Business (Financial Flow of Capital)
In calculating the financial flow of the business, the financing sources of the investment are taken into account (bank credit and the beneficiary’s own sources). The flow was determined based on the following elements:
- –
- Net income
- –
- Depreciation
- –
- Financial expenses paid during the execution period (interest and bank charges)
- –
- Loan repayment
- –
- Own sources for the payment of financial expenses during the execution period
- –
- Own sources for the rehabilitation and modernization investment of block no. 5
- –
- Own sources for the investment regarding IDG
The evolution of the financial flow of the business during the analysis period is presented in Figure 10.
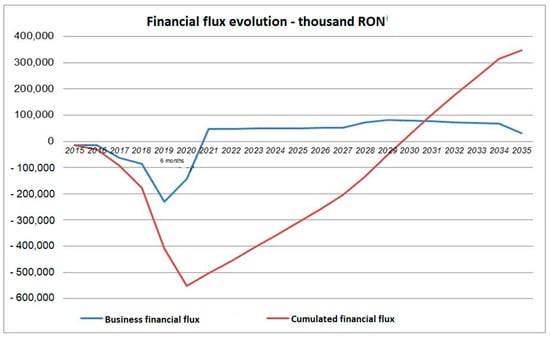
Figure 10.
The evolution of the financial flow of the business.
The financial flow of the Business is positive during the period of operation of the rehabilitated and modernized energy block.
The cumulative financial flow of the Business is positive starting from 2030 (the tenth year of operation), which means that the recovery of the equity invested in this project takes place after approx. nine years from the implementation of the investment objective.
3.3. Results of the Financial Analysis
Based on the financial flow of the business, the following results were obtained (Table 6).
Table 6.
Results of the financial analysis.
The indicators obtained highlight the profitability of the investment project under the conditions of financing the investment from bank credit and the beneficiary’s own sources(UNFV/K > 0, IRFN/K higher than the calculated discount rate and the report B/C > 1).
The results of the research confirm the hypothesis that the decision to implement the organizational change at the level of the company has a significant contribution to the efficiency of the activity, as can be seen from the evolution of the net result.
The research results are presented in the paper through the appropriate rates of return, namely: Updated Net Financial Value of Capital (VNAF/K), Internal Rate of Financial Return on Capital (RIRF/K), Benefit Costs Ratio (B/C-K), Recovery period of invested equity (DR-K).
4. Discussion
The objectives pursued in this article were: reviewing the literature on performance, performance management, and performance measurement indicators; highlighting the progress made in terms of financial performance as a result of the decisions taken by the organization. Another objective relates to the substantiation of indicators on the measurement of the overall performance of the company. Starting from the quantitative and qualitative analysis of the indicators, there were indicators that evaluate aspects such as annual incomes and expenses of the entity under the impact of adopting the decision to modernize an energy group, as well as the cash flow under the same decision-making conditions. The importance of financial indicators within the entity is already known, and if non-financial indicators are taken into account, the level of performance of an entity is obtained.
The pointing out of the directions of research development on the line of financial performance was doubled by highlighting the role of measurement and evaluation in management. From this perspective, it has been shown that the correct measurement of performance ensures the achievement of objectives, facilitates the management of changes, and allows the adoption of long-term perspectives and the adequacy of organizational behavior.
After studying the specialized literature, financial performance was identified as the most common modality used both by managers and analysts, but also by investors in determining the financial stability of the company and the efficiency with which assets are used to generate income in a certain period. Often, financial statements—the balance sheet, the statement of income and expenses, and the statement of cash flows are used to measure the financial performance of an entity. Moreover, based on the financial analysis, the set of indicators and the financial statements of the presented company were evaluated to determine the past and current financial performance, but also the design of the future one.
It follows from the study carried out that it is important to calculate a system of indicators that can express the financial position of an entity at a given time. It is noted that the financial performance of an entity is important when the entity applies for credit, but it is also important from the point of view of the banking company that has to give those loans.
In Romania, the studies carried out on this research topic are in their infancy because the amounts allocated for refurbishment were insufficient. Thus, the analysis of the performance of investment expenses for the development of coal-fired energy-producing companies was not the subject of previous research. This study is justified considering the need to increase the financial performance of the main coal-fired energy producer in Romania in the context of increasing competitiveness between coal-fired energy producers and those from renewable sources. In the future, energy producers will be analyzed as part of other studies in order to contribute to the efficiency of energy production and the reduction of their pollution capacity.
It follows from the study carried out that it is important to calculate a system of indicators that can express the financial position of an entity at a given time. It is noted that the financial performance of an entity is important when the entity applies for credit, but it is also important from the point of view of the banking company that has to give those loans.
The present research can be continued in order to present the negative repercussions generated by not adopting the decision to modernize/renovate the energy group, taking into consideration that the company Complexul Energetic Oltenia is the main producer of coal-based electricity in Romania. Non-investment decisions at the level of society generate negative effects regarding the measures undertaken by Romania, as an EU member state, in the field of energy.
Another direction in which this work can be continued is that of analyzing the profitability of the group’s refurbishment/modernization decision, taking into account external sources, which generate interest and other additional costs, and not the company’s own sources.
This study is necessary in the adoption of the refurbishment/modernization decision because, at the moment, like any investment decision, it requires the allocation of some financial resources. For this reason, if positive values were not recorded in the results of the analysis, then the decision to upgrade would not have been adopted at the company level.
The limits of the research derive from the limits imposed by the strategy at the national level in the field of energy, Romania being involved in the European process of integration of energy markets in the context of achieving the Single Day-Ahead Coupling of electricity markets (SDAC, Single Day-Ahead Coupling) and the Single Intra-Day Coupling of electricity markets (SIDC), involving the related contractual framework (energy.ec.europa.eu). To these limits can be added the limitations of financial resources for carrying out new investments or those for refurbishment/modernization (as is the performance analysis in this article), the limits imposed by environmental legislation, or the limits imposed by the increase in costs for restoring the environment affected by mining activity.
5. Conclusions
It is clear, as a general conclusion, that the system of indicators calculated must be analyzed and interpreted as a correlated system that each expresses a position of the entity. The study shows that there are an important number of indicators that lead, in the end, to a conclusion about the financial performance of the entity subjected to study through the managerial decision to rehabilitate an energy group.
By presenting the results obtained in this work, but also by highlighting at the same time their own contributions, it was pursued, in turn, the degree of achievement of the goal and objectives initially set and also the contribution to a better understanding of the field.
The starting point in determining the dimensions of financial performance was the acceptance of the financial result as its size. In the transdisciplinary approach, profit can be considered the embodiment of the financial performance of an entity. In these conditions, the appreciation of the financial result represents the first stage in the process of assessing financial performance.
Cash flow, another dimension of financial performance, provides relevant information on the sources of origin and use of the entity’s financial capital. Cash flow indicators allow the assessment of the enterprise’s ability to generate future cash flows within the entity’s activity. Because cash flow provides investors with information complementary to the result, its indicators are good estimators of financial performance. At the same time, it can be mentioned that cash flow has a significant utility not only for investors who are trying to secure their future dividend income but also for managers who invest time and energy in planning processes, processes that have the effect of increasing the financial performance of the entity.
The fact that cash flow provides investors with information complementary to the result, its indicators are good estimators of financial performance. At the same time, it can be mentioned that cash flow has a significant utility not only for investors who are trying to secure their future dividend income but also for managers who invest time and energy in planning processes, processes that have the effect of increasing the financial performance of the entity.
Performance and value creation are the cornerstones of an entity which, managed within a management system, are of vital importance for the economic health of all entities.
Author Contributions
Conceptualization, M.-F.C., O.-R.A. and A.P.; methodology, M.-F.C., O.-R.A. and A.P.; validation, M.-F.C., O.-R.A. and A.P.; formal analysis, M.-F.C., O.-R.A. and A.P.; investigation, M.-F.C., O.-R.A. and A.P.; resources, M.-F.C., O.-R.A. and A.P.; data curation, M.-F.C., O.-R.A. and A.P.; writing—M.-F.C., O.-R.A. and A.P.; writing—review and editing, M.-F.C., O.-R.A. and A.P.; visualization, M.-F.C., O.-R.A. and A.P.; supervision, M.-F.C., O.-R.A. and A.P.; project administration, M.-F.C., O.-R.A. and A.P.; funding acquisition, M.-F.C., O.-R.A. and A.P. All authors have read and agreed to the published version of the manuscript.
Funding
This research received no external funding.
Institutional Review Board Statement
Not applicable.
Informed Consent Statement
Not applicable.
Data Availability Statement
Not applicable.
Conflicts of Interest
The authors declare no conflict of interest.
References
- Ergüden, E.; Çatlioglu, E. Sustainability Reporting Practiceses in Energy Companies with Topsis Method. J. Account. Financ. 2016, 201–221. Available online: http://journal.mufad.org.tr/index.php?option=com_content&view=article&id=849%3Asustainability-reporting-practiceses-in-energy-companies-with-topsis-method-&catid=953%3Asayi-71-temmuz-2016&Itemid=55&lang=en (accessed on 23 October 2022).
- Bollino, C.A.; Madlener, R. Foreword to the Special Issue on “High Shares of Renewable Energy Sources and Electricity Market Reform”. Energy J. 2016, 37, 1–4. [Google Scholar]
- Adil, A.M.; Ko, Y. Socio-technical evolution of Decentralized Energy Systems: A critical review and implications for urban planning and policy. Renew. Sustain. Energy Rev. 2016, 57, 1025–1037. [Google Scholar] [CrossRef]
- Alagoz, B.B.; Kaygusuz, A. Dynamic energy pricing by closed-loop fractional-order PI control system and energy balancing in smart grid energy markets. Trans. Inst. Meas. Control 2015, 38, 565–578. [Google Scholar] [CrossRef]
- Costa-Campi, M.; Duch-Brown, N.; García-Quevedo, J. R&D drivers and obstacles to innovation in the energy industry. Energy Econ. 2014, 46, 20–30. [Google Scholar] [CrossRef]
- Burns, T.; Stalker, G. The Management of Innovation; Oxford University Press: Oxford, UK, 1961. [Google Scholar]
- March, J.G. Exploration and exploitation in organizational learning. Organ. Sci. 1991, 2, 71–87. [Google Scholar] [CrossRef]
- Zavarkó, M. Change Management Models Induced by Disruptive Energy Technology Development. Ph.D. Thesis, Corvinus University of Budapest, Budapest, Hungary, 2021. [Google Scholar]
- Burgelman, R.A. Intraorganizational Ecology of Strategy Making and Organizational Adaptation: Theory and Field Research. Organ. Sci. 1991, 2, 239–262. [Google Scholar] [CrossRef]
- Bartlett, C.; Goshal, S. Managing Across Borders: The Transnational Solution; Harvard Business School Press: Boston, MA, USA, 2002. [Google Scholar]
- Grant, R.M. Prospering in Dynamically-Competitive Environments: Organizational Capability as Knowledge Integration. Organ. Sci. 1996, 7, 375–387. [Google Scholar] [CrossRef]
- Beer, M.; Nohria, N. Cracking the code of change. Harv. Bus. Rev. 2000, 78, 133–141. [Google Scholar]
- Christensen, C.M.; Raynor, M.E.; McDonald, R. What Is Disruptive Innovation? Harv. Bus. Rev. 2015, 12, 44–53. [Google Scholar]
- Nisar, A.; Palacios, M.; Grijalvo, M. Open organizational structures: A new framework for the energy industry. J. Bus. Res. 2016, 69, 5175–5179. [Google Scholar] [CrossRef]
- Cullmann, A.; Nieswand, M.; Seifert, S.S. No differences in efficiency between public and private utilities. DIW Econ. Bull. 2016, 6, 233–238. [Google Scholar]
- OECD Fostering Innovation for Green Growth. Organisation for Economic Co-Operation and Development; Fostering Innovation for Green Growth—OECD: Paris, France, 2011. [Google Scholar]
- Salies, E. A test of the Schumpeterian hypothesis in a panel of European electric utilities. In Innovation, Economic Growth and the Firm; Gaffard, J.L., Salies, E., Eds.; Edward Elgar Publishing: New York, NY, USA, 2010. [Google Scholar]
- Available online: www.energy.ec.europa.eu/ (accessed on 17 October 2022).
- Popescu, O.R. Changing Leaders in the Context of Organizational Change; ”Petru Maior” University Press: Tîrgu-Mureş, Romania, 2014; Volume 3, pp. 743–747. [Google Scholar]
- Chomać-Pierzecka, E.; Sobczak, A.; Urbańczyk, E. RES Market Development and Public Awareness of the Economic and Environmental Dimension of the Energy Transformation in Poland and Lithuania. Energies 2022, 15, 5461. [Google Scholar] [CrossRef]
- Samborski, A. The Energy Company Business Model and the European Green Deal. Energies 2022, 15, 4059. [Google Scholar] [CrossRef]
- Forrest, J.Y.-L.; Lin, C.; Mondal, S.; Tucker, R. Environmental Forces underneath the Innovativeness of Manufacturing Firms. Theor. Econ. Lett. 2019, 9, 1353–1382. [Google Scholar] [CrossRef]
- Teece, D.J. Explicating dynamic capabilities: The nature and microfoundations of (sustainable) enterprise performance. Strat. Manag. J. 2007, 28, 1319–1350. [Google Scholar] [CrossRef]
- Dobák, M. Szervezeti formák és vezetés; Aula Kiadó: Budapest, Hungary, 2002. [Google Scholar]
- Burnes, B. Managing Change: Managing Change: A Strategic Approach to Organisational Dynamics; Prentice Hall: Hoboken, NJ, USA, 2014; p. 8. [Google Scholar]
- Cummings, T.G.; Worley, C.G. Essentials of Organization Development and Change; Cengage South-Western: Cincinnati, OH, USA, 2001. [Google Scholar]
- Mathias, P.M.; Boston, J.F.; Watanasiri, S. Effective utilization of equations of state for thermodynamic properties in process simulation. AIChE J. 1984, 30, 182–186. [Google Scholar] [CrossRef]
- Marx, K.; Engels, F.; Aveling, E.; Moore, S. Capital: A Critical Analysis of Capitalist Production; Swan Sonnenschein, Lowrey: London, UK, 1887. [Google Scholar]
- Rod, C.; Saviotti, P.; Walsh, V. Economics and Technological Change; Rowman & Littlefield: Totowa, NJ, USA, 1987; pp. 3–5. Available online: https://books.google.ro/books?id=XwhJKW3vOvUC&lpg=PR9&dq=technological%20change%20literature%20review&lr&hl=ro&pg=PA4#v=onepage&q=technological%20change%20literature%20review&f=false (accessed on 21 August 2022).
- Holmström, B.R.; Tirole, J. The Theory of the Firm; Elsevier: Amsterdam, The Netherlands, 1987; Volume 1, pp. 61–133. [Google Scholar]
- Geroski, P.A. Markets for Technology: Knowledge, Innovation and Appropriability. In Handbook of the Economics of Innovation and Technological Change; Stoneman, P., Ed.; Edward Elgar Publishing: Cheltenham, UK, 1995. [Google Scholar]
- Griliches, Z. R&D, Patents and Productivity; University of Chicago Press: Chicago, IL, USA, 2001. [Google Scholar]
- Griliches, Z. R&D and Productivity, The Econometric Evidence; University of Chicago Press: Chicago, IL, USA, 1998. [Google Scholar]
- Griliches, Z. The Search for R&D Spillovers. Scand. J. Econ. 1992, 94, S29–S47. [Google Scholar]
- Jaffe, A.; Newell, R.; Stavins, R. Environmental Policy and Technological Change. Environ. Resour. Econ. 2002, 22, 41–70. [Google Scholar] [CrossRef]
- Jorgenson, D. Productivity and Economic Growth. In Fifty Years of Economic Measurement; Berndt, E., Triplett, J., Eds.; University of Chicago Press: Chicago, IL, USA, 1990; pp. 19–118. [Google Scholar]
- Jorgenson, D.W.; Stiroh, K.J. Raising the Speed Limit: U.S. Economic Growth in the Information Age. Brook. Pap. Econ. Act. 2000, 1, 125–211. [Google Scholar] [CrossRef]
- Karshenas, M.; Stoneman, P. Technological Diffusion. In Handbook of the Economics of Innovation and Technological Change; Stoneman, P., Ed.; Blackwell Publishers: Oxford, UK, 1995. [Google Scholar]
- Geroski, P. Models of technology diffusion. Res. Policy 2000, 29, 603–625. [Google Scholar] [CrossRef]
- David, P.A.; Hall, B.H.; Toole, A.A. Is public R&D a complement or substitute for private R&D? A review of the econometric evidence. Res. Policy 2000, 29, 497–529. [Google Scholar] [CrossRef]
- Romer, P.M. The Origins of Endogenous Growth. J. Econ. Perspect. 1994, 8, 3–22. [Google Scholar] [CrossRef]
- Grossman, G.; Helpman, E. Technology and trade. In Handbook of International Economics; Grossman, G.M., Rogoff, K., Eds.; Elsevier: Amsterdam, The Netherlands, 1995; p. w4926. [Google Scholar]
- Schumpeter, J. Capitalism, Socialism and Democracy. In Environmental Policy and Technological Change; Jaffe, A.B., Newell, R.G., Stavins, R.N., Eds.; Harper: New York, NY, USA, 1942. [Google Scholar]
- Jaffe, A.B.; Newell, R.G.; Stavins, R.N. Environmental Policy and Technological Change; Nota di Lavoro, No. 26.2002; Fondazione Eni Enrico Mattei (FEEM): Milano, Italy, 2002. [Google Scholar]
- Jorgenson, D.W.; Griliches, Z. The Explanation of Productivity Change. Rev. Econ. Stud. 1967, 34, 249–283. [Google Scholar] [CrossRef]
- Jaffe, A.B.; Newell, R.G.; Stavins, R.N. Chapter 11—Technological change and the Environment. In Handbook of Environmental Economics; Elsevier: Amsterdam, The Netherlands, 2003; Volume 1, pp. 461–516. ISBN 9780444500632. [Google Scholar] [CrossRef]
- Mäler, K.-G.; Vincent, J.R. Handbook of Environmental Economics; Elsevier: Amsterdam, The Netherlands, 2003; Volume 1, pp. 466–468. [Google Scholar]
- Dănilă, A. Performanţa Financiară a Întreprinderii; Editura Universitaria: Craiova, Romania, 2014. [Google Scholar]
- Liu, L.; Yang, H. Research on the Enterprise Performance Management Information System Development and Robustness Optimization based on Data Regression Analysis and Mathematical Optimization Theory. Int. J. Secur. Its Appl. 2016, 10, 377–390. [Google Scholar] [CrossRef]
- Tannenbaum, R.; Schmidt, W.H. How to Choose a Leadership Pattern. Harv. Bus. Rev. 2009, 2009, 133. [Google Scholar] [CrossRef]
- Lebas, M. Oui, il faut définir la performance. La performance des entreprises est-elle liée au style de pouvoir du dirigeant? Une étude à partir des PME camerounaises. Rev. Française Comptab. 1995, 226, 79–86. [Google Scholar]
- Kueng, P.; Krahn, A.J.W. Building a Process Performance Measurement Systems: Some Early Experience. J. Sci. Ind. Res. 1999, 58, 149–159. [Google Scholar]
- Creswell, J.W. Qualitative, Quantitative, and Mixed Methods Approaches. Research Design. In Research Design: Qualitative, Quantitative, and Mixed Methods Approaches, 2nd ed.; SAGE: Newcastle upon Tyne, UK, 2003. [Google Scholar]


Publisher’s Note: MDPI stays neutral with regard to jurisdictional claims in published maps and institutional affiliations. |
© 2022 by the authors. Licensee MDPI, Basel, Switzerland. This article is an open access article distributed under the terms and conditions of the Creative Commons Attribution (CC BY) license (https://creativecommons.org/licenses/by/4.0/).