Abstract
The municipality of Romblon in the Philippines is an island known for its marble industry. The subsurface of the Philippines is known for its limestone. The production of marble into slab, tiles, and novelty items requires heavy equipment to cut rocks and boulders. The finishing of marble requires polishing to smoothen the surface. During the manufacturing process, massive amounts of particulates and slurry are produced, and with a lack of technology and human expertise, the environment can be adversely affected. Hence, this study assessed and monitored the environmental conditions in the municipality of Romblon, particularly the soils and sediments, which were affected due to uncontrolled discharges and particulates deposition. A total of fifty-six soil and twenty-three sediment samples were collected and used to estimate the metal and metalloid (MM) concentrations in the whole area using a neural network-particle swarm optimization inverse distance weighting model (NN-PSO). There were nine MMs; e.g., As, Cr, Ni, Pb, Cu, Ba, Mn, Zn and Fe, with significant concentrations detected in the area in both soils and sediments. The geo-accumulation index was computed to assess the level of contamination in the area, and only the soil exhibited contamination with zinc, while others were still on a safe level. Nemerow’s pollution index (NPI) was calculated for the samples collected, and soil was evaluated and seen to have a light pollution level, while sediment was considered as “clean”. Furthermore, the single ecological risk (Er) index for both soil and sediment samples was considered to be a low pollution risk because all values of Er were less than 40.
1. Introduction
Metal and metalloid (MM) contamination in soils and sediments, and its subsequent release into groundwater or surface waters, is considered to be a major environmental concern. The extent of MM contamination can be attributed to many factors, such as microbial activity, the physicochemical properties of the media, and location sources [1]. Globally, rapid industrialization with uncontrolled discharges are major sources of high concentrations of metalloids such as antimony (Sb), arsenic (As), and boron (B), and metals such as cadmium (Cd), chromium (Cr), copper, (Cu), lead (Pb), molybdenum (Mo), vanadium (Va), and zinc (Zn). Industrial inputs to water bodies may come from various sources, which include industrial effluents, sewage wastewater, fossil energy combustion, land deposition from landfills and industrial emissions [1,2,3,4], and agricultural wastes.
Soil pollution and its adverse effects by heavy metal contamination are often irreversible [5], and the detection of its point sources can be a serious challenge. The MMs are mostly inorganic, and normally As, Cd, Cr, Cu, Pb, mercury (Hg), nickel (Ni), and Zn have affinity to soils. The specific environmental media (i.e., soil and sediments) are the major sink of MMs. This creates a potential hazard and health risks to humans through skin contact and accidental ingestion of contaminated soil, in addition to the risk of ingestion of these MMs through groundwater (GW) and soil–plant–human or soil–plant–animal–human interaction in the food chain. The presence of elevated MMs can negatively affect vegetation by reducing farm produce and food quality, consequently affecting food and nutrition security [5]. On the other hand, sediments are produced by forces breaking rocks and turning them into small particles that are carried by river flow [6]. According to Monjardin et al. [7], land use change also affects the water availability in certain areas, which is related to the river flow that produces these sediments. Usually, sediments tend to accumulate in areas where the river slope is at a minimum and the river does not produce enough hydraulic energy to carry these sedimentary particles.
Elevated MM concentration in soil can be due to natural causes or anthropogenic activities. The spatial heterogeneity of MMs in soils can be a result of topography, climate, or other natural factors [8] including typhoons [9], which transport the soils and sediments. On the other hand, anthropogenic activities can cause MMs to accumulate in the soil, especially when there are mine tailings and uncontrolled dumpsites. Petrochemical products such as leaded gasoline, lead-based paints, fertilizers, and pesticides, along with coal combustion residues, also contribute to contamination when the accumulated amount exceeds the allowable limits [10]. Thus, it is important to monitor the concentration of MMs, and to determine the possible sources of contamination in order to effectively implement programs and prevent and/or reduce soil pollution by MMs.
Romblon town, the capital municipality of the province of Romblon in the Philippines, is part of the Romblon Island Group located at the center of the archipelago and is almost wholly underlain by the Romblon metamorphic rocks [11]. It is a third-class municipality, with a land area of 86.87 km2 and a population of more than 40,000 people, where the primary livelihood is agriculture, livestock raising, and marble mining and processing. Romblon is known as the marble capital of the Philippines, having the largest and highest-quality marble deposits. The increasing population and the aspiration to develop more marble-based products raised the concern of the community due to environmental pollution, particularly soil contamination by MMs, which has been associated with mining activities. The mining of marble in Romblon for commercial use started in the 1970s. However, to date, there has been no research conducted in the area to determine the presence and extent of MM accumulation in soils in Romblon. Hence, this research was carried out in order to provide information to the community and local government units to allow them to create appropriate programs and necessary interventions.
According to research by Adepoju and Adekoya [12], even small- to medium-sized mining operations can contaminate sediments with various heavy metals such as Ag, As, Cd, Co, Cr, Cu, Hg, Ni, Pb, and Zn. Additionally, it was also found that the sediments receiving marble mine discharge showed elevated concentrations of potentially harmful elements such Cu, Zn, Pb, As, Cr, Hg, Ni, and Co [13]. Furthermore, significant Cd concentrations in soils in the marble mining district were recorded in 2019 [14]. These findings were associated with marble mining activities. There were also significant concentrations of Zn in the study area that were linked to emissions from the trucks and other machinery used in marble quarrying. The abovementioned recorded studies explicitly described the human health risks when there are marble mining activities in the area.
Spatial concentration maps have been frequently used in the monitoring of the quality of soils and sediments impacted by heavy metals. In the Asian continent, the use of spatial concentration mapping in soils and sediments has been broadly implemented and includes research carried out in the western Asian region [15,16], the central Asian region [17,18], the south Asian region [19,20], the east Asian region [21,22], and the southeast Asian region [23,24]. Actual sampling can be used to assess the quality of soils and sediments, but it is time consuming and labor intensive. Moreover, the density of the datapoints has an impact on the precision of the maps created using these sampling data [25].
The employment of innovative tools, such as machine learning methods, is consistent with the interdisciplinary shift toward Industry 4.0 and has become increasingly common over the past few years. One of the focal points of Industry 4.0 is artificial intelligence. This is crucial for the development of various technical specialties [26]. The Artificial Neural Network (ANN) is an effective system that is primarily based on biological neural network systems. In this instance, an ANN is made up of artificial neurons [27]. ANNs have been broadly implemented in spatial estimation in soils and sediments, including in the study of soil erosion [28], soil salinity [29], soil metal pollution [30], rainfall-runoff sediment process [31], and suspended sediment concentration estimation [32]. However, there are some limitations and drawbacks in the use of ANN, such as having trouble in crossing plateaus of the error function landscape. To address this issue, optimization algorithms such as Particle Swarm Optimization (PSO), which utilizes a global search feature, could further improve the ANN model performance [33]. The PSO effectively uses probability-based transition procedures to conduct concurrent searches of the solution hyperspace without formally assuming derivative information. The physical model, that underpins the transition rules, assumes emergent group action results from the social interaction of bird flocks and fish schools [34]. Therefore, this new research is focused on determining the concentration and distribution of some MMs in Romblon’s soils. This has been carried out to evaluate the quality of the soil and the potential ecological risk posed by various MMs, and to calculate the geo-accumulation index that determines the level of MM accumulation in soils.
2. Materials and Methods
2.1. Study Area and Sampling Points
The island municipality of Romblon is located in the Philippines, with coordinates of 12.5294° N and 122.2881° E. The climate of the island falls under Type III of the Corona climatic classification system, with no pronounced wet and dry seasons, but it is relatively dry from January to May. Its topography is mostly composed of hills and it has a maximum elevation of approximately 400 m above sea level. The soil and sediment samples collected were spatially distributed across the municipality of Romblon, as shown in Figure 1.
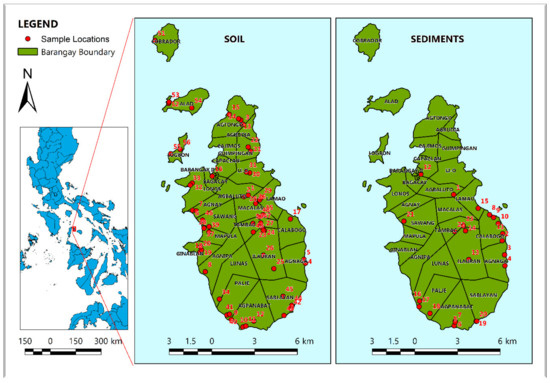
Figure 1.
Study Area and Sampling Locations in Romblon island. The numbers at the bottom of the figure represent the map scale.
2.2. Collection of Samples
A total of fifty-six soil and twenty-three sediment samples were collected from twenty-six barangays of the municipality of Romblon. The sampling locations were spatially distributed over the island municipality of Romblon, targeting barangays that would best represent the whole area. Top soils were collected using a grab stainless trowel, while sediment was collected using an Eckman [35] grab sampler. Twenty-five soil and twelve sediment samples were collected from agricultural and residential areas. Coordinates were recorded using a handheld Garmin global positioning system (GPS), model Montana 680. Collected samples were transported to the RSU-Mapua joint research laboratory in Sawang, Romblon Municipality, for laboratory preparation and analysis.
2.3. Sample Preparation and Analysis
The preparation and MM concentration analysis were conducted at the Mapua-RSU Joint Laboratory at RSU Sawang campus in the municipality of Romblon, Philippines. The soil and sediment samples were stored in zipper bags upon collection and transported to the laboratory for preparation following the work of Wang et al. [36] and EPA No. LSASDPROC-300-R4 [37]. The acquired soil samples were dried at 68 °C for 3 h, grounded into a fine powder using an agate mortar and pestle, homogenized, and passed through a 10-mesh sieve before analysis. The concentration of nine metals, As, Ba, Cr, Cu, Fe, Mn, Ni, Pb, and Zn, was analyzed using a handheld portable Olympus Vanta X-Ray Fluorescence analyzer (pXRF). This portable device is known to perform both in-situ and in the laboratory for the detection of MMs, with an accuracy comparable to ICP [23,38]. The pXRF was calibrated using the Olympus Vanta blank and set to Geochem mode before analysis. The data curation, validation, modeling, and visualization were carried out in the Yuchengco Innovation Center of Mapua University, Manila, Philippines.
2.4. Assessment of Metal Pollution in Soils and Sediments
The contamination levels of the soil were assessed using Single Factor index (Pi) and Nemerow’s pollution index (NPI) values (Pn) [38]. The computations of the two indices, Pi and Pn, were calculated based on Equations (1) and (2).
where in Pi is the single factor index, Ci is the heavy metal concentrations in the soil samples (mg/kg), and Si is the soil quality standard value for each element (mg/kg) [39].
The Nemerow’s synthetic pollution index can be calculated using the equation above. Wherein, Pimax is the maximum value of the single factor index and Piave is the average value of the computed Pi. The grading standards for the pollution indices are shown in Table 1 [38,39].

Table 1.
Grading standards for pollution indices [2].
The potential ecological risk index (RI) developed by Hackanson was widely used to assess the ecological dangers of heavy metal pollution in sediments, soils, and water [2]. The computation of RI is shown by Equation (3)
where RI represents the total number of risk factors observed in the soil samples, Er indicates the monomial potential ecological risk factor for each component, and Ti is the metal toxic response factor. The Ti values for Pb, Cr, Ni, Mn, Cu, and Cd were 5, 2, 5, 1, 5, and 30, respectively [4]. The grading standards for the risk index are shown in Table 1.
2.5. Correlation Analysis
Pearson’s correlation was performed using OriginLab 2021 to look at how a certain metal concentration affects the other concentrations of various metals found in soils and sediments. This is also used to identify the groupings of MMs.
2.6. Spatial Analysis
ArcGIS was used to render the spatial distribution map for the concentration of metals by spatial interpolation. Spatial interpolation is the process of using points with known values to estimate values at other unknown points. It is a method of creating surface data from sample points. One of the simplest and most popular interpolation techniques is inverse distance weighted (IDW) interpolation, which enforces the estimated value of a point that was influenced more by nearby known points rather than those farther away. In IDW interpolation, the sample points are weighted during interpolation, such that the influence of one point relative to another declines with the distance from the unknown point to be determined. Conventional deterministic approaches, on the other hand, were frequently created under certain constraints and do not work in different real-world situations. The performance is restricted using default settings and the scarcity of accurate observations. Due to the ANN-PSO algorithm’s capacity for modeling non-linear datasets and its adaptation to real-world circumstances, combined with the IDW approach, provides solution to this concern [40].
2.7. Geo-Accumulation Index
Another way to identify the degree of contamination of soils and sediments would be by using Muller’s geo-accumulation index. This method compares the background concentration of heavy metals in the area versus its current concentration [41]. Background concentration is the level of concentration that is normal in a certain area. This can be found in places that are free from economic and human activity. Equation 4 shows the formula to calculate the geo-accumulation index, where its values correspond to seven levels of contamination.
where Cn is the measured concentration of the element in the environment and Bn is the geo-chemical background value in the soil.
The following values indicate the degree of contamination in soil: Igeo of ≤ 0, no contamination; 0 < Igeo ≤ 1, no contamination to moderately contaminated; 1 < Igeo ≤ 2, moderately contaminated; 2 < Igeo ≤ 3, moderately to heavily contaminated; 3 < Igeo ≤ 4, heavily contaminated; 4 < Igeo ≤ 5, heavily to extremely contaminated; and Igeo ≥ 5, extremely contaminated [42,43].
3. Results and Discussion
3.1. Concentration of Metals and Metalloids in Soil Samples
The MMs concentration in soil and sediment samples were recorded and showed that the highest concentration detected in soil was 41.25 mg/kg (Ba), 236.60 mg/kg (Pb), 10.60 mg/kg (Cr), 31.28 mg/kg (Ni), 591.84 mg/kg (Mn), 233.10 mg/kg (Cu), 0.005 mg/kg (As), 6367.01 mg/kg (Fe), and 542.96 mg/kg (Zn). While sediments showed maximum concentrations of 13.71 mg/kg (Ba), 37.59 mg/kg (Pb), 12.91 mg/kg (Cr), 13.71 mg/kg (Ni), 14.93 mg/kg (Mn), 233.10 mg/kg (Cu), 0.003 mg/kg (As), 3201.14 mg/kg (Fe), and 13.422 mg/kg (Zn). Table 2 shows the comparison between measured MMs concentration and the corresponding allowable concentrations based on soil quality standards (SQS) and sediment quality guidelines (SGV). It was recorded that the maximum values of three heavy metals (Pb, Mn, Cu) exceeded the SQS value. This is perceived to be dangerous and should be subjected for mitigation. The average concentration for each MMs was observed to be within the limits of the SQS. Standard deviations are also shown in the table. The SDs have higher values compared to mean concentration which indicated that there were high variations between datasets. There were many areas with low metal concentrations, while there were also small areas who have much higher concentrations. The results showed that the Romblon municipality in totality is still within the acceptable MMs concentration range, although there are specific areas that exceeded the allowable values, which should be mitigated. It can be perceived that there were no imminent dangers and health risks posed by MMs concentrations in soils and sediments in the municipality of Romblon. However, the local government shall make strategic plans concerning how to maintain these metal concentrations within allowable levels. In addition, there was no Cd concentration recorded in soils and sediments. According to the findings of Usman et al. [38], soil acidity and plant absorption prevented the detection of Cd in the soil. It was explicitly stated that Cd accumulates in the shoots and is remedied by plants through phytoextraction [35,43].
Table 2.
Mean concentrations of MMs in soil (mg/kg) compared to soil quality standards (SQS) and sediment quality guidelines (SGV).
3.2. Assessment of Metal Pollution in Soils
Nemerow’s pollution index was determined in order to assess the degree of soil contamination in the municipality of Romblon. The Pn value shows how much pollution each metal is likely to contribute to contaminate a certain environmental medium.
As shown in Table 3, the Romblon municipality has a Pn value of 1.72 for soil, indicating a light pollution level contamination across the municipality. In comparison to the single factor pollution indices, the values of Pn were higher due to the few samples that exhibited a higher MMs concentration, because Pn accounted for the highest index observed in these sets of data. This was illustrated by the outliers in Figure 2a. The sediments have a Pn value that also indicated a clean pollution level for the municipality. Because no observed Pi values reached intermediate or severe level pollution, this minimized the risk of metal contamination that may pose a threat upon human exposure through dermal contact, incidental ingestion, and impact by agricultural crops quality [36,37,47,48,49]. The mean Pi values of soil and sediments from the municipality were observed to be less than 1, as shown in Figure 3. This implied that the soil and sediments across the municipality is at Class I, with a clean pollution level (Table 1). This showed that there was no evidence of MMs contamination throughout the municipality.
Table 3.
Single Factor Index, NPI, and Pollution Risk Index for Soil and Sediments.
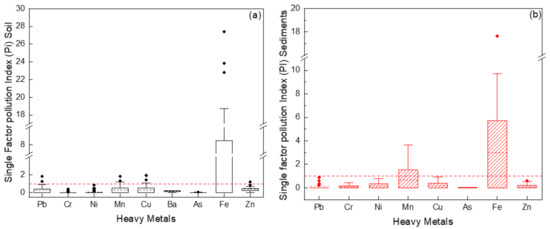
Figure 2.
(a) Box plot of single factor pollution index (Pi) of Pb, Cr, Ni, Mn, Cu, Ba, As, Fe, and Zn in Romblon Municipality for soil; (b) Box plot of single factor pollution index (Pi) of Pb, Cr, Ni, Mn, Cu, Ba, As, Fe, Zn in Romblon Municipality for sediments.
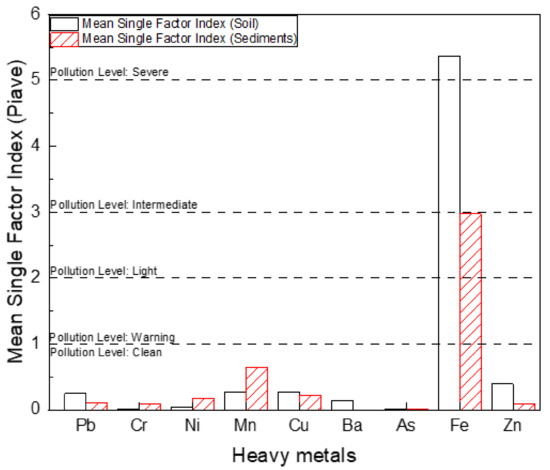
Figure 3.
Mean Single Factor pollution index of Pb, Cr, Ni, Mn, Cu, Ba, As, Fe, and Zn for soil and sediment.
The study area’s single ecological risk index for soil and sediments had an order of Cd < Cr < Ni < Mn < Pb < Cu and Cd < Pb < Mn < Cr < Ni < Cu, respectively, as shown in Figure 4a,b. In general, for all MMs found in soils and sediments, most of the sites had low potential ecological risk index values. Furthermore, no sampling points in the study area exceeded the single potential ecological risk index (Er) value of 40. According to grading standards, this Er value indicated that there was low pollution risk in soil and that the soil was clean.
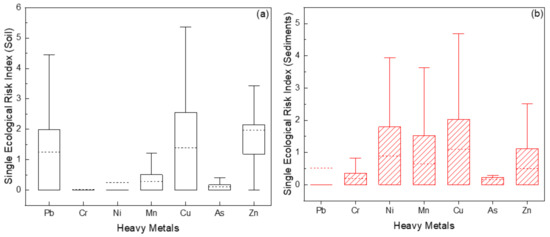
Figure 4.
(a) Boxplot of single ecological risk index of Pb, Cr, Ni, Mn, Cu, As, and Zn for soil; (b) Boxplot of single ecological risk index of Pb, Cr, Ni, Mn, Cu, As, and Zn for sediments.
3.3. Correlation Analysis
Pearson correlation analysis was used to determine the relationship between MMs in both soils and sediments. The degree of metal interdependence and association in both soils and sediments was determined. The correlation coefficients and matrices of Ni-Cr, Ni-Mn, Ni-Cu, and Cu-Pb were 0.957, 0.423, 0.376, and 0.886 (p < 0.01), respectively, for soils as shown in Figure 5a. The correlation coefficients of Cr-Ni, Cr-Mn, Cr-Cu, Ni-Mn, Ni-Cu, and Cu-Mn were 0.9521, 0.8703, 0.9045, 0.8880, 0.8383, and 0.8345, respectively, for sediments, as shown in Figure 5b. The value at p < 0.01 expresses the statistical significance of the relationship and association of metals in soil and sediments. The correlation matrix for sediments and soils are presented in Figure 5a,b.
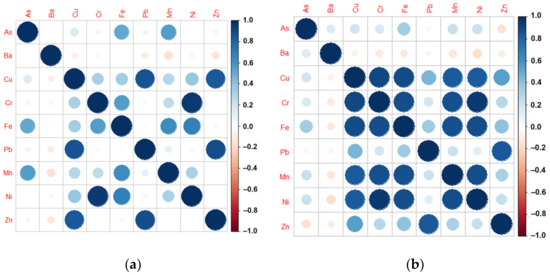
Figure 5.
Correlation matrix for (a) Soils; (b) Sediments.
3.4. Spatial Analysis using NN-PSO-Inverse Distance Weighted Interpolation
The spatial distributions of the MMs of both soils and sediments in the municipality of Romblon using NN-PSO with IDW interpolation technique are shown in Appendix A. It was found out that there was elevated concentration of up to 25.06−41.22 mg/kg of Ba in soil on the main island of Romblon. Meanwhile, the highest concentrations of up to 5.26−10.55 mg/kg of Cr and 13.08–31.14 mg/kg of Ni in soil were found in the southeastern areas of the main island. On the other hand, concentrations of up to 142.59–233.07 mg/kg of Cu, 139.16–236.56 mg/kg of Pb, and 255.23–591.64 mg/kg of Mn in soil were found in both the southeastern areas of the main island and Logbon island. Elevated concentrations of Mn in soil were also found in the northeast part of the main island. Lastly, Cd in soil was not detected in Romblon.
The highest concentrations of Ba in sediments of up to 6.89–13.71 mg/kg were found in the central part of the main island. For Cr, Cu, Pb, and Ni, the highest concentrations in sediments were in the central-south to southern part of the main island, with values of up to 3.77–12.80 mg/kg, 14.85–43.50 mg/kg, 20.35–37.58 mg/kg, and 4.31–14.80 mg/kg, respectively. Meanwhile, the highest concentrations of Mn in sediments of up to 118.50–392.41 mg/kg are in the central-south to southern and western portions of the main island. Lastly, Cd in sediments was not detected in Romblon as well. Considering the overall effect of the group of metals detected in the area of study, Figure 6a,b exhibited the spatial map of the NPI for soils and sediments.
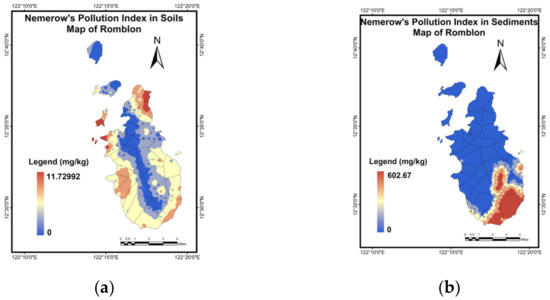
Figure 6.
NN-PSO-IDW map for (a) Soils; (b) Sediments.
The results suggest that there was movement of metals from the mountains or higher elevations and accumulation of the same in the lower elevations, which might be due to erosion or weathering effects. This can be supported by studies conducted to identify sources of Pb contamination and accumulation. It suggests that complex topography is more conducive to soil Pb accumulation, as it often affects soil movement due to runoff erosion and topographic differences that allow the enrichment of soil with heavy metals [8]. The concentration distribution of Cr, Cu, Pb, and Ni in soil and sediments appeared to be very similar. Combinations of metals in either medium that can be compared are Cr and Ni in soil, Cu and Pb in soil, and Cr, Cu, Pb, and Ni in sediments.
Cr and Ni are mostly found in ultramafic rocks, typically ranging from <LOD to 100 mg/kg [50]. Another study also concluded that Cr and Ni are highly correlated and similar in spatial distributions in contaminated soils [10]. In a study conducted by Huang et al. [10], a high correlation and similar spatial distribution between these three elements, Cr, Cu, and Ni, existed when there is the presence of soil pollution due to anthropogenic activities. Another study also identified that metals such as Cr, Cu, and Pb exist in roadside soils, and their concentration decreases with the distance from the road and is due to traffic emissions [51] and the wearing of tires and brake linings from vehicles [3].
The NN-PSO simulation results are presented in Table 4 and Table 5 for soils and sediments, respectively. This includes the structure of the models. The training algorithm used was the Levenberg–Marquardt algorithm because it is the fastest method for moderately sized networks [52]. The transfer function employed was the hyperbolic tangent sigmoid function, as suggested by De Jesus et al. [53], while the number of iterations used in the simulations was 2000 [54]. The regression plots for validation and testing are exhibited in Appendix B.
Table 4.
NN-PSO Simulation Results for Soil Samples.
Table 5.
NN-PSO Simulation Results for Sediment Samples.
3.5. Geo-Accumulation Index
Figure 7 and Figure 8 show the computed geo-accumulation index of the following MMs: Ba, Cr, Cu, Pb, Mn, Ni, As, Fe, and Zn. The geo-accumulation index has already been used by many researchers to assess the level of heavy metal and metalloid elements in soil [55,56]. This is being achieved by comparing the measured concentration with its background concentration. Considering the geo-accumulation index for all MMs in soil, Zn showed the highest accumulation, followed by Ba, Mn, As, Pb, Ni, Cu, Cr, and Fe. Almost all the areas in Romblon Municipality recorded “no contamination to moderately contaminated” with respect to Ba. This means that Ba accumulation in the area is happening; however not in an alarming level. The Cr, on the other hand, showed no evidence of contamination in the whole municipality of Romblon. An alarming level of Pb was recorded at Logbon Island, where the geo-accumulation index was within the range of “moderately to heavily contaminated”. This should be given special attention by the local government unit (LGU) because exposures to elevated concentrations of Pb could cause serious health problems, such as high blood pressure, joint and muscle pain, headache, and mood disorders [57]. Also, the geo-accumulation index tells us that these elements were increasing in concentration at a very fast pace. The Zn registered the highest geo-accumulation index among all the metals presented. Logbon island was categorized as being extremely contaminated. This is alarming, and LGU should be aware and create appropriate intervention. There is a significant possibility that the community may be exposed to elevated Zn concentrations which might cause severe iron deficiency as Zn inhibits the uptake of Fe. Also, As poses a threat to people living in the northern part of the island, as the results showed that there is a buildup of As concentration in the area. This is something that the LGU has to give attention to in order to ensure the safety of inhabitants. The northern area is the only place on the island that is moderately contaminated with As. Sediments, on the other hand, did not exhibit alarming sediments geo-accumulation level as it moved from upstream to downstream. Sediments do not stay in one place for a long period of time, which is why metal accumulation is not that significant [58]. The Ni and Mn showed the highest geo-accumulation index among all the metals measured but only at a level of “no contamination to moderately contaminated”. All other metals exhibit “no contamination” on the island. Below maps (Figure 7) could guide LGUs to plan an action on how to prevent continuous contamination in the environment. Many of these elements are still within the safe threshold; however, there is a significant possibility that it will reach its toxic level if not given proper intervention.
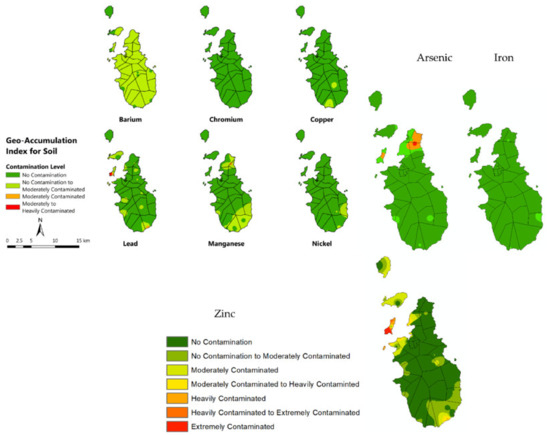
Figure 7.
Geo-accumulation index of soil for Ba, Cr, Cu, Pb, Mn, Ni, As, Fe, and Zn.
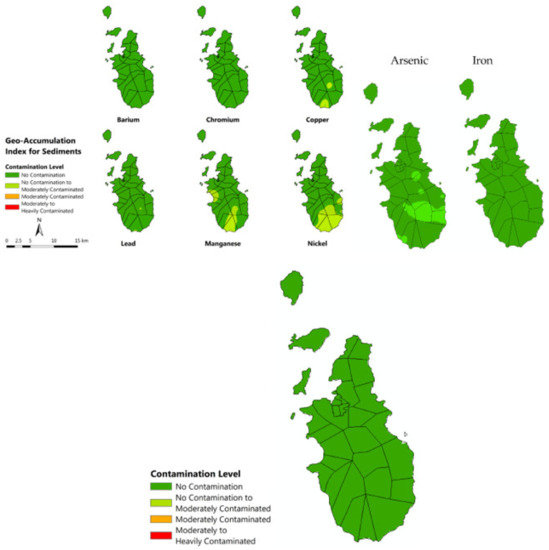
Figure 8.
Geo-accumulation index of sediments for Ba, Cr, Cu, Pb, Mn, Ni, As, Fe, and Zn.
4. Discussion
The results showed that Romblon Municipality has low pollution risk level; however, current condition presented clear signs of being classified as contaminated in the near future as a result of human activities [59] if no intervention will be carried out. The study focused on determining the current soil and sediment heavy metal concentration level in the island using an XRF scanner. This technology has been very effective in accurately determining metal concentration levels in soil with convenience [60,61]. Nine MMs were detected that have significant concentration in the area, and these are listed as follows: Ba, Cr, Cu, Pb, Mn, Ni, As, Fe, and Zn. In this study, Nemerow’s pollution index was calculated to assess the potential of certain metal that contributed to the contamination of an environmental medium. Many studies have already made use of NPI to assess metals in soil contamination [62,63,64] and all produced a critical assessment as to how these metals contaminated the environment and at which level. In this study, NPI was calculated and resulted in a Pi value of less than 1. This result implied that the municipality was under the Class I category of having a “clean” level. It is fortunate that the area is still under this category; however, if no proper regulation is carried out, the environmental condition could become worse [65]. Another parameter considered in the study is the geo-accumulation index computation; this uses spatial analysis [66] to determine the index and locate it in a spatial map. The Igeo of the nine MMs detected in the soils and sediments were computed. The Ni, Cr, Fe, and Cu in soil showed the lowest value of Igeo, which means that these metals are not significantly accumulating in the municipality [67]. On the other hand, Mn, Pb, Ba, and Zn produced higher value of Igeo in some parts of the municipality, especially in the northern area, giving the idea that something is happening in the area that caused the significant accumulation of metal. The Mn reached a moderately contaminated Igeo level in the northern part of Romblon, while Pb and As reached the heavily contaminated Igeo level in that region. Logbon Island was found to be extremely contaminated with Zn. Too much uptake of Zn could produce a severe deficiency in Fe. No significant contamination level was found for the sediment samples collected around the whole island. Only the Mn and Ni were elevated, but only at the “no contamination to moderately contaminated” level and covered only a small area south of the island. Fortunately, all other metal concentrations were still on the “no contamination” level. The Igeo is a useful tool to assess the current contamination level in a certain area for sediments [68,69] and soils [70,71]. It gives accurate assessment that could aid in planning certain mitigation actions. The maps produced in this study presented hotspot locations that should be given attention, and the local government shall create a plan on how this could be mitigated and managed. The Ba is another metal of great concern in the area.The Igeo level is on “no contamination to moderately contaminated” and covered almost the entire municipality. This level indicates that possible significant metal accumulation might happen in the area soon. The Ba is a dangerous metal because when ingested could cause hypokalemia, hypertension, cardiac arrhythmia, and skeletal muscle paralysis [72].
5. Conclusions
In this study, the contamination levels of MMs in the soils and sediments across the municipality of Romblon in the Philippines were assessed and monitored. Soil and sediment samples were collected from the 26 barangays. All samples were analyzed for the presence of As, Ba, Pb, Cr, Cu, Mn, Ni, Zn, and Fe and assessed for potential ecological risk by both soil and sediments. It was recorded that all mean metal concentrations in the soils and sediments were within the SQS and SGV, except for the Mn and Fe in sediments. The highest metal concentration recorded from fifty-six soil samples were as follows: Fe (3258.36 mg/kg), Mn (49.44 mg/kg), and Zn (109.58 mg/kg); and for twenty-three sediment samples, Fe (1146.44 mg/kg), Mn (41.09 mg/kg), and Zn (6.08 mg/kg). An X-ray fluorescence scanner was used to measure this concentration with comparable accuracy to ICP. Another index used to assess this metal concentration was the geo-accumulation index, which identifies the contamination level in a certain area. The Igeo exhibits levels of contamination and gives us an idea of which metals tend to accumulate in the area at a significant rate. In soil, while Fe has the highest concentration, Zn was the one to exhibit the highest geo-accumulation index that reached up to the “heavily contaminated” level. The Fe showed no contamination because its level does not change significantly and it is perceived as being naturally occurring in the area. No alarming Igeo level was computed for sediments, and the highest level was only at the “no contamination to moderately contaminated” level and was found only for the metals Ni and Mn. Logbon island is an area that should be closely monitored as it shows an alarming level of heavy contamination from Zn and Ba. The Pn values of the soil and sediment samples from the municipality were under Class II and Class I, respectively. This indicated a light pollution level for soil and a clean for sediments. Furthermore, the single ecological risk index of the heavy metals from both soil and sediment samples were considered as “low pollution risk” because the values of all the soils and sediments are Er < 40. The calculated mean pERIs for both soils and sediments were considerably low, which supports the Pi and Pn for no pollutants across the municipality.
Author Contributions
Conceptualization, D.B.S.; methodology, D.B.S.; software, K.L.M.d.J., A.F.B.G. and M.L.G.I.; analysis, E.G.F., K.L.M.d.J., C.E.F.M. and M.L.G.I.; investigation, Z.E.C.B., D.B.S. and J.P.W.; resources, D.B.S.; data curation, A.F.B.G., Z.E.C.B., D.B.S., C.E.F.M. and K.L.M.d.J.; writing—original draft preparation, E.G.F., C.E.F.M., K.L.M.d.J. and M.L.G.I.; writing—review and editing, D.B.S., E.G.F. and J.P.W.; visualization, A.F.B.G., K.L.M.d.J. and Z.E.C.B.; validation, C.E.F.M., K.L.M.d.J. and Z.E.C.B., supervision, D.B.S.; project administration, D.B.S.; funding acquisition, D.B.S. All authors have read and agreed to the published version of the manuscript.
Funding
This research was funded by the Philippine Council for Health Research and Development of the Department of Science and Technology, Philippines, under the project “Development of Health Index and Vulnerability Reduction System for Region 4B Capital (DOST-PCHRD: D-HIVE 4B Capital)”.
Institutional Review Board Statement
Not applicable.
Informed Consent Statement
Not applicable.
Data Availability Statement
All data are contained in the manuscript.
Acknowledgments
We wish to acknowledge the “in kind” support of Mapua University, Manila, Philippines; the Romblon State University, Odiongan, Romblon, Philippines; and the local government unit of Romblon for their cooperation.
Conflicts of Interest
The authors declare no conflict of interest.
Appendix A


Figure A1.
Heavy metal concentration of sediments: (a) Arsenic, (b) Barium, (c) Chromium, (d) Copper, (e) Iron, (f) Lead, (g) Manganese, (h) Nickel, (i) Zinc.


Figure A2.
Heavy metal concentration of soils: (a) Arsenic, (b) Barium, (c) Chromium, (d) Copper, (e) Iron, (f) Lead, (g) Manganese, (h) Nickel, (i) Zinc.
Appendix B


Figure A3.
Regression plots for sediments: (a) Arsenic, (b) Barium, (c) Chromium, (d) Copper, (e) Iron, (f) Lead, (g) Manganese, (h) Nickel, (i) Zinc.


Figure A4.
Regression plots for soils: (a) Arsenic, (b) Barium, (c) Chromium, (d) Copper, (e) Iron, (f) Lead, (g) Manganese, (h) Nickel, (i) Zinc.
References
- Dousova, B.; Buzek, F.; Rothwell, J.; Krejcova, S.; Lhotka, M. Adsorption behavior of arsenic relating to different natural solids: Soils, stream sediments and peats. Sci. Total Environ. 2012, 433, 456–461. [Google Scholar] [CrossRef] [PubMed]
- Kang, Z.; Wang, S.; Qin, J.; Wu, R.; Li, H. Pollution characteristics and ecological risk assessment of heavy metals in paddy fields of Fujian province, China. Sci. Rep. 2020, 10, 12244. [Google Scholar] [CrossRef] [PubMed]
- Wang, M.; Zhang, H. Accumulation of heavy metals in roadside soil in urban area and the related impacting factors. Int. J. Environ. Res. Public Health 2018, 15, 1064. [Google Scholar] [CrossRef]
- Kolawole, T.O.; Olatunji, A.S.; Jimoh, M.T.; Fajemila, O.T. Heavy metal contamination and ecological risk assessment in soils and sediments of an industrial area in Southwestern Nigeria. J. Health Pollut. 2018, 8, 180906. [Google Scholar] [CrossRef] [PubMed]
- Jaiswal, A.; Verma, A.; Jaiswal, P. Detrimental effects of heavy metals in soil, plants, and aquatic ecosystems and in humans. J. Environ. Pathol. Toxicol. Oncol. 2018, 37, 183–197. [Google Scholar] [CrossRef]
- National Geographic. Sediment. Available online: https://education.nationalgeographic.org/resource/sediment (accessed on 28 September 2022).
- Caja, C.C.; Ibunes, N.L.; Paril, J.A.; Reyes, A.R.; Nazareno, J.P.; Monjardin, C.E.; Uy, F.A. Effects of land cover changes to the quantity of water supply and hydrologic cycle using water balance models. In MATEC Web of Conferences; EDP Sciences: Ulis, France, 2018; p. 06004. [Google Scholar]
- Yang, X.; Yang, Y.; Wan, Y.; Wu, R.; Feng, D.; Li, K. Source identification and comprehensive apportionment of the accumulation of soil heavy metals by integrating pollution landscapes, pathways, and receptors. Sci. Total Environ. 2021, 786, 147436. [Google Scholar] [CrossRef]
- Ji, Y.; Xu, J.; Zhu, L. Impact of a super typhoon on heavy metal distribution, migration, availability in agricultural soils. Environ. Pollut. 2021, 289, 117835. [Google Scholar] [CrossRef]
- Huang, S.; Xiao, L.; Zhang, Y.; Wang, L.; Tang, L. Interactive effects of natural and anthropogenic factors on heterogenetic accumulations of heavy metals in surface soils through geodetector analysis. Sci. Total Environ. 2021, 789, 147937. [Google Scholar] [CrossRef]
- Dimalanta, C.B.; Ramos, E.G.L.; Yumul, G.P., Jr.; Bellon, H. New features from the Romblon Island Group: Key to understanding the arc–continent collision in Central Philippines. Tectonophysics 2009, 479, 120–129. [Google Scholar] [CrossRef]
- Adepoju, M.O.; Adekoya, J.A. Heavy metal distribution and assessment in stream sediments of River Orle, Southwestern Nigeria. Arab. J. Geosci. 2014, 7, 743–756. [Google Scholar] [CrossRef]
- Obaje, S.O.; Ogunyele, A.C.; Adeola, A.O.; Akingboye, A.S. Assessment of stream sediments pollution by potentially toxic elements in the active mining area of Okpella, Edo State, Nigeria. Rud. Geol. Naft. Zb. 2019, 34, 43–50. [Google Scholar] [CrossRef]
- Chaanda, M.S.; Izeze, O.; Osaze, I.T. Environmental geochemistry of Igarra marble mining district, southwestern Nigeria. J. Environ. Prot. 2019, 10, 722–737. [Google Scholar] [CrossRef][Green Version]
- Keshavarzi, A.; Kumar, V. Spatial distribution and potential ecological risk assessment of heavy metals in agricultural soils of Northeastern Iran. Geol. Ecol. Landsc. 2020, 4, 87–103. [Google Scholar] [CrossRef]
- Allafta, H.; Opp, C. Spatio-temporal variability and pollution sources identification of the surface sediments of Shatt Al-Arab River, Southern Iraq. Sci. rep. 2020, 10, 6979. [Google Scholar] [CrossRef]
- Suska-Malawska, M.; Vyrakhamanova, A.; Ibraeva, M.; Poshanov, M.; Sulwiński, M.; Toderich, K.; Mętrak, M. Spatial and In-Depth Distribution of Soil Salinity and Heavy Metals (Pb, Zn, Cd, Ni, Cu) in Arable Irrigated Soils in Southern Kazakhstan. Agronomy 2022, 12, 1207. [Google Scholar] [CrossRef]
- Amirgaliyev, N.A.; Ismukhanova, L.T. The Level of Anthropogenic Pollution of the Kapshagay Water Reservoir, Republic of Kazakhstan. In Water Resources Management in Central Asia; Springer: Berlin/Heidelberg, Germany, 2020; pp. 143–162. [Google Scholar]
- Adimalla, N.; Qian, H.; Wang, H. Assessment of heavy metal (HM) contamination in agricultural soil lands in northern Telangana, India: An approach of spatial distribution and multivariate statistical analysis. Environ. Monit. Assess. 2019, 191, 246. [Google Scholar] [CrossRef]
- Kabir, M.; Islam, M.; Hoq, M.; Tusher, T.R. Appraisal of heavy metal contamination in sediments of the Shitalakhya River in Bangladesh using pollution indices, geo-spatial, and multivariate statistical analysis. Arab. J. Geosci. 2020, 13, 1135. [Google Scholar] [CrossRef]
- Cai, L.M.; Wang, Q.S.; Wen, H.H.; Luo, J.; Wang, S. Heavy metals in agricultural soils from a typical township in Guangdong Province, China: Occurrences and spatial distribution. Ecotoxicol. Environ. Saf. 2019, 168, 184–191. [Google Scholar] [CrossRef]
- Ota, Y.; Suzuki, A.; Yamaoka, K.; Nagao, M.; Tanaka, Y.; Irizuki, T.; Fujiwara, O.; Yoshioka, K.; Kawagata, S.; Kawano, S.; et al. Geochemical distribution of heavy metal elements and potential ecological risk assessment of Matsushima Bay sediments during 2012–2016. Sci. Total Environ. 2021, 751, 141825. [Google Scholar] [CrossRef]
- Nolos, R.C.; Agarin, C.J.M.; Domino, M.Y.R.; Bonifacio, P.B.; Chan, E.B.; Mascareñas, D.R.; Senoro, D.B. Health Risks due to metal concentrations in soil and vegetables from the six municipalities of the Island Province in the Philippines. Int. J. Environ. Res. Public Health 2022, 19, 1587. [Google Scholar] [CrossRef]
- Van Thinh, N.; Osanai, Y.; Adachi, T.; Thai, P.K.; Nakano, N.; Ozaki, A.; Kuwahara, Y.; Kato, R.; Makio, M.; Kurosawa, K. Chemical speciation and bioavailability concentration of arsenic and heavy metals in sediment and soil cores in estuarine ecosystem, Vietnam. Microchem. J. 2018, 139, 268–277. [Google Scholar] [CrossRef]
- Senoro, D.B.; de Jesus, K.L.M.; Mendoza, L.C.; Apostol, E.M.D.; Escalona, K.S.; Chan, E.B. Groundwater Quality Monitoring Using In-Situ Measurements and Hybrid Machine Learning with Empirical Bayesian Kriging Interpolation Method. Appl. Sci. 2021, 12, 132. [Google Scholar] [CrossRef]
- Popkova, E.G.; Ragulina, Y.V.; Bogoviz, A.V. Fundamental differences of transition to industry 4.0 from previous industrial revolutions. In Industry 4.0: Industrial Revolution of the 21st Century; Springer: Cham, Switzerland, 2019; pp. 21–29. [Google Scholar]
- Lin, Y.H.; Hu, Y.C. Electrical energy management based on a hybrid artificial neural network-particle swarm optimization-integrated two-stage non-intrusive load monitoring process in smart homes. Processes 2018, 6, 236. [Google Scholar] [CrossRef]
- Gholami, V.; Booij, M.J.; Tehrani, E.N.; Hadian, M.A. Spatial soil erosion estimation using an artificial neural network (ANN) and field plot data. Catena 2018, 163, 210–218. [Google Scholar] [CrossRef]
- Shahabi, M.; Jafarzadeh, A.A.; Neyshabouri, M.R.; Ghorbani, M.A.; Valizadeh Kamran, K. Spatial modeling of soil salinity using multiple linear regression, ordinary kriging and artificial neural network methods. Arch. Agron. Soil Sci. 2017, 63, 151–160. [Google Scholar] [CrossRef]
- Jia, Z.; Zhou, S.; Su, Q.; Yi, H.; Wang, J. Comparison study on the estimation of the spatial distribution of regional soil metal (loid) s pollution based on kriging interpolation and BP neural network. Int. J. Environ. Res. Public Health 2018, 15, 34. [Google Scholar] [CrossRef]
- Nourani, V.; Kalantari, O. Integrated artificial neural network for spatiotemporal modeling of rainfall–runoff–sediment processes. Environ. Eng. Sci. 2010, 27, 411–422. [Google Scholar] [CrossRef]
- Moridnejad, A.; Abdollahi, H.; Alavipanah, S.K.; Samani, J.M.V.; Moridnejad, O.; Karimi, N. Applying artificial neural networks to estimate suspended sediment concentrations along the southern coast of the Caspian Sea using MODIS images. Arab. J. Geosci. 2015, 8, 891–901. [Google Scholar] [CrossRef]
- Shariati, M.; Mafipour, M.S.; Mehrabi, P.; Bahadori, A.; Zandi, Y.; Salih, M.N.; Nguyen, H.; Dou, J.; Song, X.; Poi-Ngian, S. Application of a hybrid artificial neural network-particle swarm optimization (ANN-PSO) model in behavior prediction of channel shear connectors embedded in normal and high-strength concrete. Appl. Sci. 2019, 9, 5534. [Google Scholar] [CrossRef]
- Sengupta, S.; Basak, S.; Peters, R.A. Particle Swarm Optimization: A survey of historical and recent developments with hybridization perspectives. Mach. Learn. Knowl. Extr. 2018, 1, 157–191. [Google Scholar] [CrossRef]
- Eckman, S.; Himelein, K. Methods of Geo-Spatial Sampling. In Data Collection in Fragile States; Hoogeveen, J., Pape, U., Eds.; Palgrave Macmillan: Cham, Switzerland; London, UK, 2020; pp. 103–128. [Google Scholar]
- Wang, Z.; Bao, J.; Wang, T.; Moryani, H.T.; Kang, W.; Zheng, J.; Zhan, C.; Xiao, W. Hazardous heavy metals accumulation and health risk assessment of different vegetable species in contaminated soils from a typical mining city, central China. Int. J. Environ. Res. Public Health 2021, 18, 2617. [Google Scholar] [CrossRef]
- United States Environmental Protection Agency. Soil Sampling Operating Procedure. Available online: https://www.epa.gov/sites/default/files/2015-06/documents/Soil-Sampling.pdf (accessed on 28 September 2022).
- Usman, K.; Al-Ghouti, M.A.; Abu-Dieyeh, M.H. The assessment of cadmium, chromium, copper, and nickel tolerance and bioaccumulation by shrub plant Tetraena qataranse. Sci. Rep. 2019, 9, 5658. [Google Scholar] [CrossRef]
- Zhou, S.; Yuan, Z.; Cheng, Q.; Zhang, Z.; Yang, J. Rapid in situ determination of heavy metal concentrations in polluted water via portable XRF: Using Cu and Pb as example. Environ. Pollut. 2018, 243, 1325–1333. [Google Scholar] [CrossRef]
- Ma, J.; Ding, Y.; Gan, V.J.; Lin, C.; Wan, Z. Spatiotemporal prediction of PM2. 5 concentrations at different time granularities using IDW-BLSTM. IEEE Access 2019, 7, 107897–107907. [Google Scholar] [CrossRef]
- Muller, G. Schwermetalle in den sediments des Rheins-Veranderungen seitt 1971. Umschan 1979, 79, 778–783. [Google Scholar]
- Fodoué, Y.; Ismaila, A.; Yannah, M.; Wirmvem, M.J.; Mana, C.B. Heavy Metal Contamination and Ecological Risk Assessment in Soils of the Pawara Gold Mining Area, Eastern Cameroon. Earth 2022, 3, 907–924. [Google Scholar] [CrossRef]
- Hu, B.; Chen, S.; Hu, J.; Xia, F.; Xu, J.; Li, Y.; Shi, Z. Application of portable XRF and VNIR sensors for rapid assessment of soil heavy metal pollution. PLoS ONE 2017, 12, e0172438. [Google Scholar] [CrossRef]
- Canadian Council of Ministers of the Environment. Soil Quality Guidelines for the Protection of Environmental and Human Health. Available online: https://ccme.ca/en/results/123,9,12,71,124,139,229,61,129/ch/4 (accessed on 28 September 2022).
- Huang, S.H.; Chang, T.C.; Chien, H.C.; Wang, Z.S.; Chang, Y.C.; Wang, Y.L.; Hsi, H.C. Comprehending the Causes of Presence of Copper and Common Heavy Metals in Sediments of Irrigation Canals in Taiwan. Minerals 2021, 11, 416. [Google Scholar] [CrossRef]
- Aiman, U.; Mahmood, A.; Waheed, S.; Malik, R.N. Enrichment, geo-accumulation and risk surveillance of toxic metals for different environmental compartments from Mehmood Booti dumping site, Lahore city, Pakistan. Chemosphere 2016, 144, 2229–2237. [Google Scholar] [CrossRef]
- Ali, H.; Khan, E.; Ilahi, I. Environmental chemistry and ecotoxicology of hazardous heavy metals: Environmental persistence, toxicity, and bioaccumulation. J. Chem. 2019, 2019, 6730305. [Google Scholar] [CrossRef]
- Xie, Y.; Fan, J.; Zhu, W.; Amombo, E.; Lou, Y.; Chen, L.; Fu, J. Effect of heavy metals pollution on soil microbial diversity and bermudagrass genetic variation. Front. Plant Sci. 2016, 7, 755. [Google Scholar] [CrossRef] [PubMed]
- Chibuike, G.U.; Obiora, S.C. Heavy metal polluted soils: Effect on plants and bioremediation methods. Appl. Environ. Soil Sci. 2014, 2014, 752708. [Google Scholar] [CrossRef]
- Quantin, C.; Ettler, V.; Garnier, J.; Šebek, O. Sources and extractibility of chromium and nickel in soil profiles developed on Czech serpentinites. C. R. Geosci. 2008, 340, 872–882. [Google Scholar] [CrossRef]
- Zhang, H.; Wang, Z.; Zhang, Y.; Ding, M.; Li, L. Identification of traffic-related metals and the effects of different environments on their enrichment in roadside soils along the Qinghai–Tibet highway. Sci. Total Environ. 2015, 521, 160–172. [Google Scholar] [CrossRef]
- De Jesus, K.L.M.; Senoro, D.B.; Dela Cruz, J.C.; Chan, E.B. A Hybrid Neural Network–Particle Swarm Optimization Informed Spatial Interpolation Technique for Groundwater Quality Mapping in a Small Island Province of the Philippines. Toxics 2021, 9, 273. [Google Scholar] [CrossRef]
- De Jesus, K.L.M.; Senoro, D.B.; Dela Cruz, J.C.; Chan, E.B. Neuro-Particle Swarm Optimization Based In-Situ Prediction Model for Heavy Metals Concentration in Groundwater and Surface Water. Toxics 2022, 10, 95. [Google Scholar] [CrossRef]
- Senoro, D.B.; de Jesus, K.L.M.; Nolos, R.C.; Lamac, M.R.L.; Deseo, K.M.; Tabelin, C.B. In Situ Measurements of Domestic Water Quality and Health Risks by Elevated Concentration of Heavy Metals and Metalloids Using Monte Carlo and MLGI Methods. Toxics 2022, 10, 342. [Google Scholar] [CrossRef]
- Barbieri, M.J.J.G.G. The importance of enrichment factor (EF) and geoaccumulation index (Igeo) to evaluate the soil contamination. J. Geol. Geophys. 2016, 5, 1–4. [Google Scholar] [CrossRef]
- Amadi, A.N.; Nwankwoala, H.O. Evaluation of heavy metal in soils from Enyimba dumpsite in Aba, southeastern Nigeria using contamination factor and geo-accumulation index. Energy Environ. Res. 2013, 3, 125–134. [Google Scholar]
- Needleman, H. Lead poisoning. Annu. Rev. Med. 2004, 55, 209–222. [Google Scholar] [CrossRef]
- Monjardin, C.E.F.; Gomez, R.A.; Cruz, M.N.G.D.; Capili, D.L.R.; Tan, F.J.; Uy, F.A.A. Sediment Transport and water quality analyses of Naic River, Cavite, Philippines. In Proceedings of the 2021 IEEE Conference on Technologies for Sustainability (SusTech), Irvine, CA, USA, 22–24 April 2021; IEEE: Piscataway, NJ, USA; pp. 1–8. [Google Scholar]
- Garbuio, F.J.; Howard, J.L.; dos Santos, L.M. Impact of human activities on soil contamination. Appl. Environ. Soil Sci. 2012, 2012, 619548. [Google Scholar] [CrossRef][Green Version]
- Monjardin, C.E.F.; Senoro, D.B.; Magbanlac, J.J.M.; de Jesus, K.L.M.; Tabelin, C.B.; Natal, P.M. Geo-Accumulation Index of Manganese in Soils Due to Flooding in Boac and Mogpog Rivers, Marinduque, Philippines with Mining Disaster Exposure. Appl. Sci. 2022, 12, 3527. [Google Scholar] [CrossRef]
- Fu, L.; Zhang, Z.; Zhang, Q.; Zhang, H. Spatial distribution, risk assessment, and source identification of pollutants around gold tailings ponds: A case study in Pinggu District, Beijing, China. Environ. Monit. Assess. 2021, 193, 483. [Google Scholar] [CrossRef]
- Jiang, J. Research and Evaluation of Heavy Metal Pollution of Contaminated Site. E3S Web Conf. 2019, 131, 01107. [Google Scholar] [CrossRef]
- Wang, Y.; Sun, W.; Zhao, Y.; He, P.; Wang, L.; Nguyen, L.T.T. Assessment of Heavy Metal Pollution Characteristics and Ecological Risk in Soils around a Rare Earth Mine in Gannan. Sci. Program. 2022, 2022, 5873919. [Google Scholar]
- Zulaehah, I.; Handayani, C.O.; Zu’Amah, H. Heavy metal pollution assessment in paddy fields and dryland in Bandung District, West Java. IOP Conf. Ser. Earth Environ. Sci. 2021, 648, 012114. [Google Scholar]
- Ashraf, M.A.; Maah, M.J.; Yusoff, I. Soil contamination, risk assessment and remediation. Environ. Risk Assess. Soil Contam. 2014, 1, 3–56. [Google Scholar]
- Hua, L.; Yang, X.; Liu, Y.; Tan, X.; Yang, Y. Spatial distributions, pollution assessment, and qualified source apportionment of soil heavy metals in a typical mineral mining city in China. Sustainability 2018, 10, 3115. [Google Scholar] [CrossRef]
- Ma, X.L.; Deng, F.Y.; Liu, Y. Study on Spatial Distribution and Seasonal Variations of Trace Metal Contamination in Sediments from the Three Adjacent Areas of the Yellow River Using HR-ICP-MS. Guang Pu Xue Yu Guang Pu Fen Xi Guang Pu 2016, 36, 2705–2711. [Google Scholar]
- Nowrouzi, M.; Pourkhabbaz, A. Application of geoaccumulation index and enrichment factor for assessing metal contamination in the sediments of Hara Biosphere Reserve, Iran. Chem. Speciat. Bioavailab. 2014, 26, 99–105. [Google Scholar] [CrossRef]
- Kimijima, S.; Sakakibara, M.; Pateda, S.M.; Sera, K. Contamination Level in Geo-Accumulation Index of River Sediments at Artisanal and Small-Scale Gold Mining Area in Gorontalo Province, Indonesia. Int. J. Environ. Res. Public Health 2022, 19, 6094. [Google Scholar]
- Radomirović, M.; Ćirović, Ž.; Maksin, D.; Bakić, T.; Lukić, J.; Stanković, S.; Onjia, A. Ecological risk assessment of heavy metals in the soil at a former painting industry facility. Front. Environ. Sci. 2020, 8, 560415. [Google Scholar] [CrossRef]
- Wu, J.; Teng, Y.; Lu, S.; Wang, Y.; Jiao, X. Evaluation of soil contamination indices in a mining area of Jiangxi, China. PLoS ONE 2014, 9, e112917. [Google Scholar] [CrossRef]
- Su, J.F.; Le, D.P.; Liu, C.H.; Lin, J.D.; Xiao, X.J. Critical care management of patients with barium poisoning: A case series. Chin. Med. J. 2020, 133, 724–725. [Google Scholar] [CrossRef]
Publisher’s Note: MDPI stays neutral with regard to jurisdictional claims in published maps and institutional affiliations. |
© 2022 by the authors. Licensee MDPI, Basel, Switzerland. This article is an open access article distributed under the terms and conditions of the Creative Commons Attribution (CC BY) license (https://creativecommons.org/licenses/by/4.0/).