Article

Optimization of Lactoperoxidase and Lactoferrin Separation on an Ion-Exchange Chromatography Step

1
Department of Chemical and Biochemical Engineering, University of Western Ontario, London, ON N6A 5B9, Canada
2
Faculty of Engineering and Applied Science, Memorial University of Newfoundland, St John’s, NL A1B 3X9, Canada
*
Author to whom correspondence should be addressed.
Separations 2017, 4(2), 10; https://doi.org/10.3390/separations4020010
Submission received: 11 January 2017 / Revised: 13 March 2017 / Accepted: 17 March 2017 / Published: 23 March 2017
(This article belongs to the Special Issue Ion Chromatography)

Abstract

:
Lactoperoxidase (LP), which is a high-value minor whey protein, has recently drawn extensive attention from research scientists and industry due to its multiplicity of function and potential therapeutic applications. In this study, the separation and optimization of two similar-sized proteins, LP and lactoferrin (LF) were investigated using strong cation exchange column chromatography. A two-step optimization strategy was developed for the separation of LP and LF. Optimization was started with central composite design-based experiments to characterize the influences of different decision variables, namely, flow rate, length of gradient, and final salt concentration in the linear elution gradient step on the yield of LP. This was followed by a more accurate optimization of ion-exchange chromatography (IEC) separation of LP and LF based on an experimentally verified chromatographic model. The optimal operating points were found and the results were compared with validation experiments. Predictions respecting yield confirmed a very good agreement with experimental results with improved product purity.

1. Introduction

Nowadays, the extraction and purification of high-value proteins from waste food streams, which can be re-used as nutritionally and pharmacologically functional ingredients has attracted great attention [1]. Whey, the liquid residue from dairy processing, is one of the biggest reservoirs of food protein available today. World whey output was approximately 180 million tonnes in 2013, containing about 1.5 million tonnes of high-value proteins and 8.6 million tonnes of lactose [2]. Whey proteins are not only nutritious supplements, but also valuable bioproducts demonstrating a wide range of biological features, such as antivirus properties, anticarcinogenic activities and immune system modulation [3]. It is therefore of utmost importance to develop cost-effective techniques for large-scale isolation of pure whey protein components.
Whey proteins have been adequately separated into different fractions, the major and minor proteins [4,5,6,7,8]. Isolation and purification of major proteins, e.g., β-lactoglobulin, α-Lactalbumin and serum albumin, through various chromatographic and membrane-separation techniques have been extensively studied [7,9,10]. However, the efficient purification of high-value minor proteins such as lactoperoxidase (LP) and lactoferrin (LF) still remains a challenge due to their extremely low concentrations. LP, a peroxidase enzyme with molecular weight of approximately 77.5 kDa [11] and an isoelectric point approaching 9.5, contributes to the humoral immune defense against pathogens by oxidation of thiocyanate and iodide [12]. LF, an iron-binding glycoprotein with a molecular weight of about 80.0 kDa and an isoelectric point around 8.7, shows many biological functions, including: antibacterial, antitumor and anti-inflammatory functions, as well as anabolic functions for bone [13]. Both LP and LF have great therapeutic potential and are expected to find many important applications. Over the past two decades, research efforts have been invested in isolating LP and LF by different chromatographic methods [8,14,15]. However, the average recovery rates and final purity for LP and LF were quite low [16], and technical development to improve the yield and purity of LP and LF deserves further study.
Ion-exchange chromatography (IEC) is one of the most powerful and widely-used techniques for isolation and purification of LP and LF [8,17]. Nevertheless, the similar molecular weights and isoelectric points of lactoperoxidase and lactoferrin pose difficulties in the isolation of LP and/or LF in a pure form by ICE. To improve the resolution, either salt-gradient or pH-gradient elution can be employed [18], which complicates the design and the operation of an IEC process. Optimization of the operating parameters, such as protein loading, elution flow rate, pH, salt concentration and gradient length, necessitates a large number of experiments, which are expensive and time-consuming. Optimization of LP and LF separation by IEC based on experimentally-verified mechanistic chromatographic model is a better choice because of its high efficiency and accuracy.
Successful approaches to the optimization of an IEC always include a detailed consideration of the physicochemical properties of involved components as well as interactions between the proteins and the adsorbent phase. To the best of our knowledge, no model-integrated approach has been applied to optimizing minor milk protein separation in IEC, making it a topic worthy of investigation. The present work aims to develop a two-step optimization strategy to maximize yield of lactoperoxidase while respecting constraints on purity. A statistical model based on response surface methodology was first employed to examine the influence of the operation variables (concentration of salt at the end of gradient, length of gradient, and velocity). Subsequently, productive information was used to assist the mechanistic model to gain more insight into the optimization of IEC. Methods developed in this study provide a reasonable way to solve complex high-dimensional optimization problems, which can be applied for other chromatographic separations of proteins.

2. Theory

2.1. Response Surface Modeling and Design of Experiments

Response surface methodology (RSM), a collection of mathematical-statistical techniques based on design of experiments (DoE), has been successfully used for optimization studies of different bio-separation processes [19]. RSM has been widely adopted to investigate the effects of several design factors influencing a response by varying them simultaneously in a limited set of experiments. The concept of DoE-techniques outlines various statistical approaches to maximize specific information in an experimental planning and after all determine the most favorable direction to move in order to find a true optimum. Central composite design (CCD) is an ideal choice as a symmetrical experimental design for sequential experimentation, and allows reasonable information to calculate model lack of fit while reducing the number of design points. In general, CCD is the better-known class of quadratic design that consists of: (1) a factorial (or cubic) design; (2) an additional design, often a star design, with all points set equidistantly from the center; and (3) at least one center point [20]. Therefore, full uniformly-routable central composite designs involve the total number of N = k2 + 2k + cp points, where k is the number of factors, and cp is the number of replicate runs performed at the center point. In this design, the distance α from the center point depends on the number of the factors and can be calculated by α = 2(k−p)/4. All factors have to be adjusted at five levels (−α, −1, 0, +1, +α) [20]. The quadratic polynomial model for the measured values of the results from experiments variable, Y with k factors is given by:
Y = β 0 + i = 1 k β i x i + i = 1 k β i i x i 2 + 1 i j k β i j x i x j + ε
where xi and xj are the design factors in coded values, β0 is the constant parameter, βi, βij, and βii are the coefficient of the linear, interaction, and quadratic terms of the model, respectively. The coefficients of Equation (1) are estimated using statistical software packages (e.g., Minitab, Design Expert, SPSS).

2.2. Mechanistic Modeling of Chromatography

A mechanistic model is used to describe the physical phenomena based on a set of mathematical equations. Two types of physical phenomena dominate chromatography: movement of solutes through the packed bed of porous particles via mass transfer mechanisms, and adsorption based on the fundamental thermodynamic interactions between migrating solutes and the stationary phase. The general system of equations used to describe the mass transfer phenomena consist of two sets of partial differential mass conservation equations. The general rate model for a chromatographic process includes convective and diffusive flows through porous particles on the column level and imitates mass transfer resistances and surface interactions on particle level. In IEC, an external film surrounding adsorbent particles is commonly presumed to model the movement of components from column to particle level; the sorption of protein on the particle surface can be described by the steric mass-action (SMA) model, developed by Iyer et al. [21] and generally used for the modeling of salt gradient elution in IEC, for example in [22].
On column level, concentration change for the ith component with respect to the time and position, is described by:
c i t = u int c i x + D a x 2 c i x 2 1 ε c ε c × 3 r p   k eff , i [ c i c p , i ]
The first term on the right-hand side represents the convective transport through the column while the second and third terms represent respectively the dispersive transport and the mass transfer to the particle surface. The symbol uint indicates the interstitial velocity, εc the column voidage, rp the particle radius, Dax the axial dispersion representing combined effect of dispersion and diffusive processes, and keff,i epitomize combined effect of both the internal and external mass transfer resistances in one lumped film diffusion coefficient. Analogously, on a particle level, concentration change for the ith component is expressed by:
c p , i t = 3 ε p r p   k eff , i [ c i c p , i ] 1 ε p ε p × q i t
where qi denotes the concentration of component i within the particle and εp the particle voidage. The first term on right-hand side describes adsorption and desorption processes on particle level, i.e., the interaction between mobile and particle-bound phase.
For the description of sorption kinetics, the steric mass-action (SMA) isotherm developed by Brooks and Cramer [23] was embedded into the mechanistic model. It has been successfully used to describe protein adsorption in IEC. Based upon the stoichiometric exchange of charges and steric hindrance of binding sites, the isotherm can be described by the reaction:
c i + v i q ¯ salt q i + v i c salt
The parameter νi is the characteristic charge of protein, which represents the average number of ligands, or binding sites, interacting during adsorption. q ¯ salt is the concentration of adsorbed salt counter-ions that are available for exchange, csalt is the salt concentration of the bulk.
q ¯ salt = i = 2 n + 1 ( v i + σ i ) q i
where the parameter Λ is the ionic capacity of the adsorbent and σi is the steric factor, which represents the average number of counter-ions shielded per adsorbed protein molecule.
SMA isotherm in its kinetic form can be expressed as:
q i t = k ads , i [ j = 1 k ( v j σ j ) q j ] v i c i k des , i c salt v i q i
kads,i and kdes,i respectively denote the adsorption and desorption rates.

2.3. Optimization for the ICE Separation of LP and LF

Optimization maximizes/minimizes an objective function by varying one or more variables, called decision variables, to obtain an optimal purification step. A chromatographic purification step involves many decision variables, such as loading-, washing- and elution times, salt concentration, flow rate for different steps, column length, column diameter, and gradient for the elution step. The decision variables can be narrowed down by including lower and upper boundaries. To limit the optimization further, constraints can also be added as equality or inequality functions. The most typical objective functions used in a preparative chromatographic purification step are production rate and yield. In this work, the objective function studied was the yield, and the inequality constraints set on the optimization was purity.
The yield is calculated as the fraction of the target component captured:
Y = c captured , i d V V load × C load
where ccaptured,i is the concentration of the target component i leaving the column during the elution.
The purity is defined as:
P u i = m captured , i j m captured , j
where mcaptured,i is the amount of substance captured of component i.

3. Materials and Methods

3.1. Materials, Column and Software

The study aims at an optimal separation of lactoperoxidase on the adsorbent SP Sepharose FF by linear gradients. Lactoperoxidase from bovine milk, ≥90% pure, and Lactoferrin from bovine milk, approximately 95% pure, were used. Sodium monobasic phosphate, sodium dibasic phosphate and sodium chloride for buffers preparation were purchased from Sigma-Aldrich (Oakville, ON, Canada). NaOH was used for pH-adjustment. The running buffer in all experiments was a 0.02 M sodium phosphate buffer at pH 6.7. The buffer for elution purposes contained additional NaCl. Proteins were diluted into phosphate buffers by slowly stirring to prevent any foam formation. Afterward, the protein solution was filtered through a 0.2 μm hydrophilic polypropylene membrane filter to remove any fine particles. The chromatographic setup consisted of a prepacked HiScreen™ SP Sepharose FF 4.7 mL column (10.0 cm length, 0.77 cm ID) and an ÄKTA purifier 100 system, both purchased from GE Healthcare (Mississauga, ON, Canada). The software Minitab®17 (State College, PA, USA) was used as a statistical tool for handling response surface methodology. The software MATLAB R2014a (Natik, MA, USA) was used to execute the mechanistic model.

3.2. Experimental Methods

In all experimental setups the column was at first equilibrated with running buffer for 5 column volumes (CV). This step was followed by an automated sample load of 2 mL protein mixture. Then the column was flushed for another 2 CV to remove unbound proteins, before initiating a linear elution gradient. The elution gradient was applied from 0% to 100% high-salt elution buffer, followed by a 5 CV high-salt wash step, and regenerated and re-equilibrated with 1 M NaOH and running buffer respectively. Conductivity and UV-absorbance were measured online at column outlet. The data collected from these measurements was further analyzed and taken into account to estimate SMA parameter by the inverse method. Three design factors were employed to describe the gradient profile:
  • Final concentration of salt in elution step (M)
  • Length of linear elution gradient (CV)
  • Superficial velocity (cm/min)
The experimental ranges used for these factors included (0.35–1.35 M) for final concentration of salt in elution step, (1.11–5.98 cm/min) for flow velocity, and (9.88–35.1 CV) for length of gradient. All the buffers were prepared using ultra-pure water (Barnstead easy-pure RODI, Fisher Scientific), filtered with a 0.45 µm membrane and degassed prior to use.

Protein Quantification

Lactoperoxidase concentration was determined by Lowry protein assay. The collected fractions of lactoperoxidase were analyzed using measurement of absorbance at 280 nm (extinction coefficient of lactoperoxidase ε1% = 14.9 [24]) and 412 nm. Lactoperoxidase absorbs radiation at 280 nm as well as 412 nm; it has maximum absorbance at 412 nm [25] and its purity is estimated as a ratio of A412/A280. The BCA (bicinchoninic acid) protein assay kit from Sigma (Oakville, ON, Canada) with BSA protein standard was used for further analysis of protein fractions from ÄKTA.

3.3. Mathematical Method

3.3.1. Screening Experiments to Determine Importance of Design Factors

Concentration of salt was studied over a broad range, as for the elution step a lower salt concentration can result in a lower purity for lactoperoxidase, and less lactoperoxidase will elute in the elution step. On the other hand, a higher salt concentration in the elution step is less critical, as lactoferrin is far from eluting at lower conductivities. Flow rate is remarked to be easy to control and was investigated over a narrower range, with an upper bound recommended by the manufacturer. Initial operating conditions to maximize chromatography performance were determined by means of a functional relationship between the experimental designs combined with response surface modeling. To ensure the consistency of prediction error, the value (α) was adjusted as 1.68 ( 8 4 ), and it was assumed that all points with an equal distance from the design center have a constant prediction variance. Table 1 shows design factors in their coded and un-coded (experimental) forms in an experimental design performed in a random order to avoid systematic error. As seen in Table 1, the design experiments had 20 runs in total. The analysis of variance (ANOVA) was used to test the significance of the fit of the empiric model. The significance level of 0.05 was chosen to establish the statistical significance in all results.

3.3.2. SMA Model Calibration and Validation

The inverse method [26] was used to calibrate the model parameters to experimental data. SMA parameters were estimated based on 20 chromatograms seeking to achieve a best fit between model response and measured chromatogram data. The optimal set of the parameter values, {ν, kads, kdes, σ}, can be generated by minimizing the error function F(p), defined as follows:
F ( p ) = i = 1 p θ min ( c i , ex c i , m ) 2 ,   θ = { v , k ads , k des , σ }
where p is the total number of the experimental data. The minimization of Equation (9) was performed with the MATLAB function lsqnonlin.
Method of lines (MoL) [27] was used to discretize the column in spatial dimensions. The boundary conditions of the column were Danckwert’s boundary conditions [28]. The discretized model was solved with a stiff ordinary differential equation solver (ode15s) using variable-order method in MATLAB [29].
For estimating the dispersion coefficient’s dependency on flow rate, the mean particle Péclet number (Pe), estimated to be 0.5 [30], the dispersion coefficient was calculated from:
D a x = u int d p P e
The film mass transfer coefficient kf can be estimated from the correlation [31]:
S h = ( 7 10 ε c + 5 ε c 2 ) ( 1 + 0.7 R e 0.2 S c 1 3 ) + ( 1.33 2.4 ε c + 1.2 ε c 2 ) R e 0.7 S c 1 3
where Sh = keff·dp/Dm is the Sherwood number, Re = u0ρdp/η is the Reynolds number and Sc = η/ρDm is the Schmidt number.
To ascertain that the model is correct, the confidence interval of the parameters calculated from the Jacobian and the residual. The relative residual error is plotted against the cumulative distribution to show how well the model fits the data. The model is then compared to the validation experiments, and if the simulation fits the experiments, the model is valid.

3.3.3. Optimization Method

The calibrated mechanistic model was then employed for optimization with respect to an objective function. In this study, yield as the fraction of target protein eluted was defined the objective function. The purity of lactoperoxidase was used as the nonlinear inequality constraint with a requirement of 85%. Parameters such as concentration of feed and pH are determined by the composition of natural milk. Other parameters, such as buffer, eluting salt and stationary phase material, were kept the same during the optimization step. The main decision variables were determined according to the results of the DoE-RSM; length of gradient has no significant effect on yield, thus the response to variation of the final salt concentration in the elution and mobile phase flow velocity were studied by computer simulation. The optimization problem with respect to the objective was solved using fmincon in MATLAB. fmincon finds the optimum of an objective function Y with defined lower and upper boundaries on the decision variables. The optimization problem can be defined as:
Ymax = max (Y)
Decision variables, x = [velocity, salt concentration at the end of gradient]
LB ≤ x ≤ UB
subject to purity ≥ purity requirement.

4. Results and Discussion

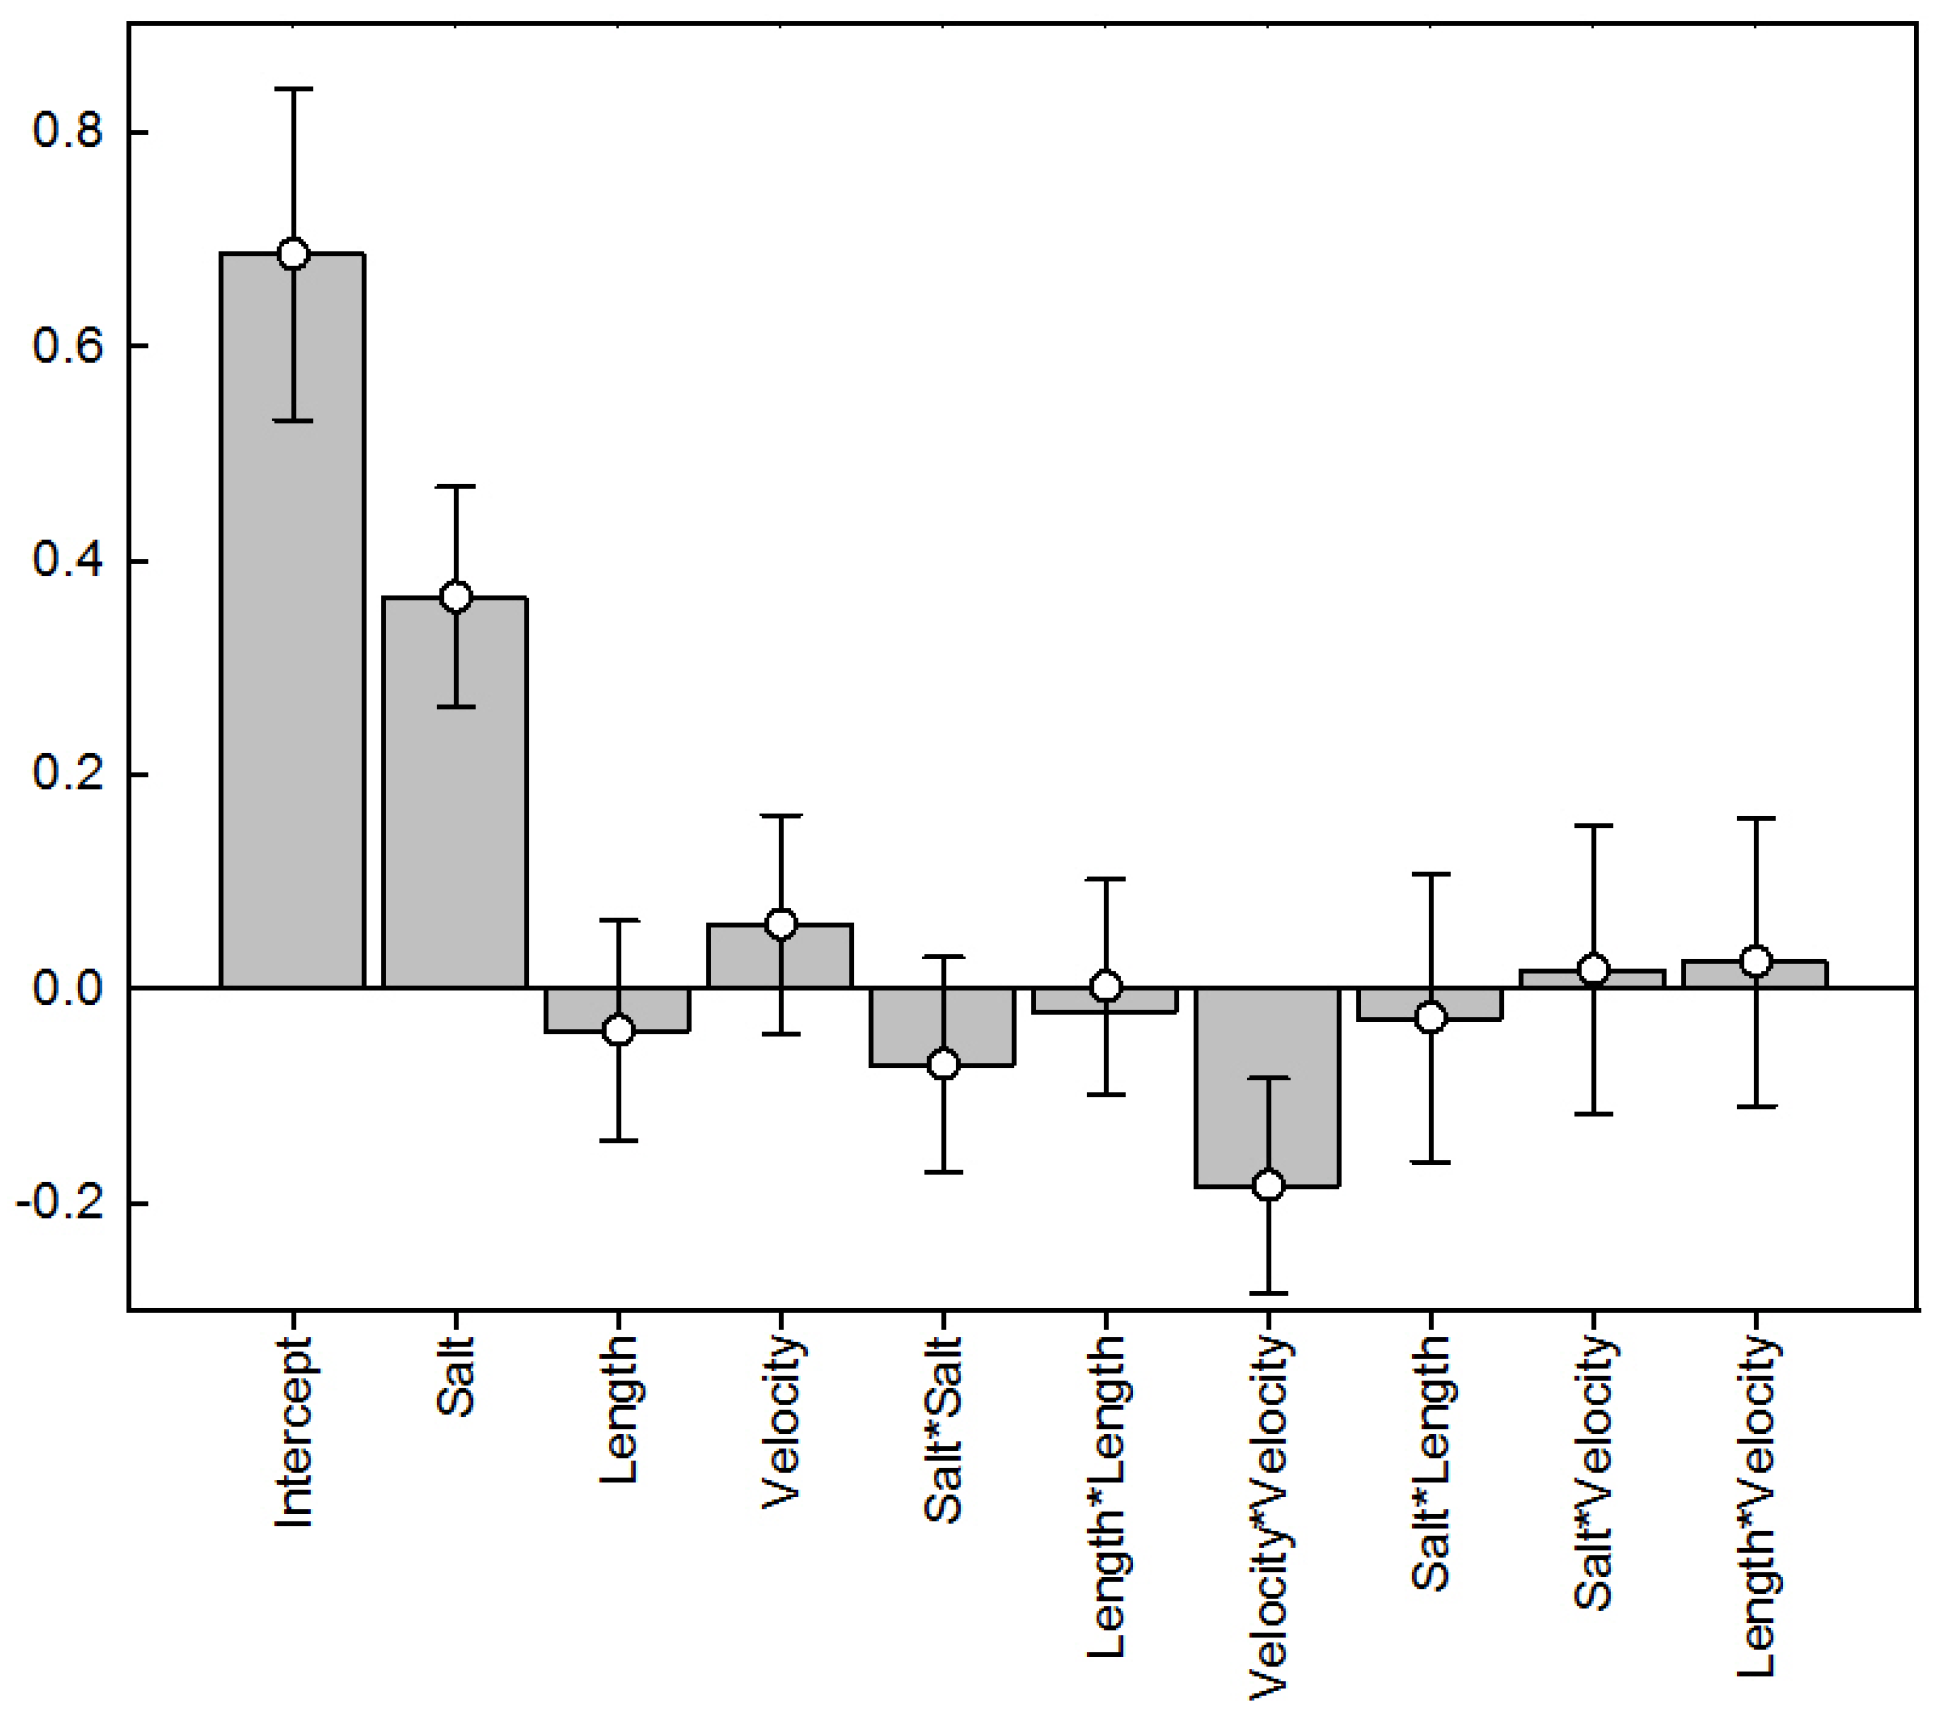
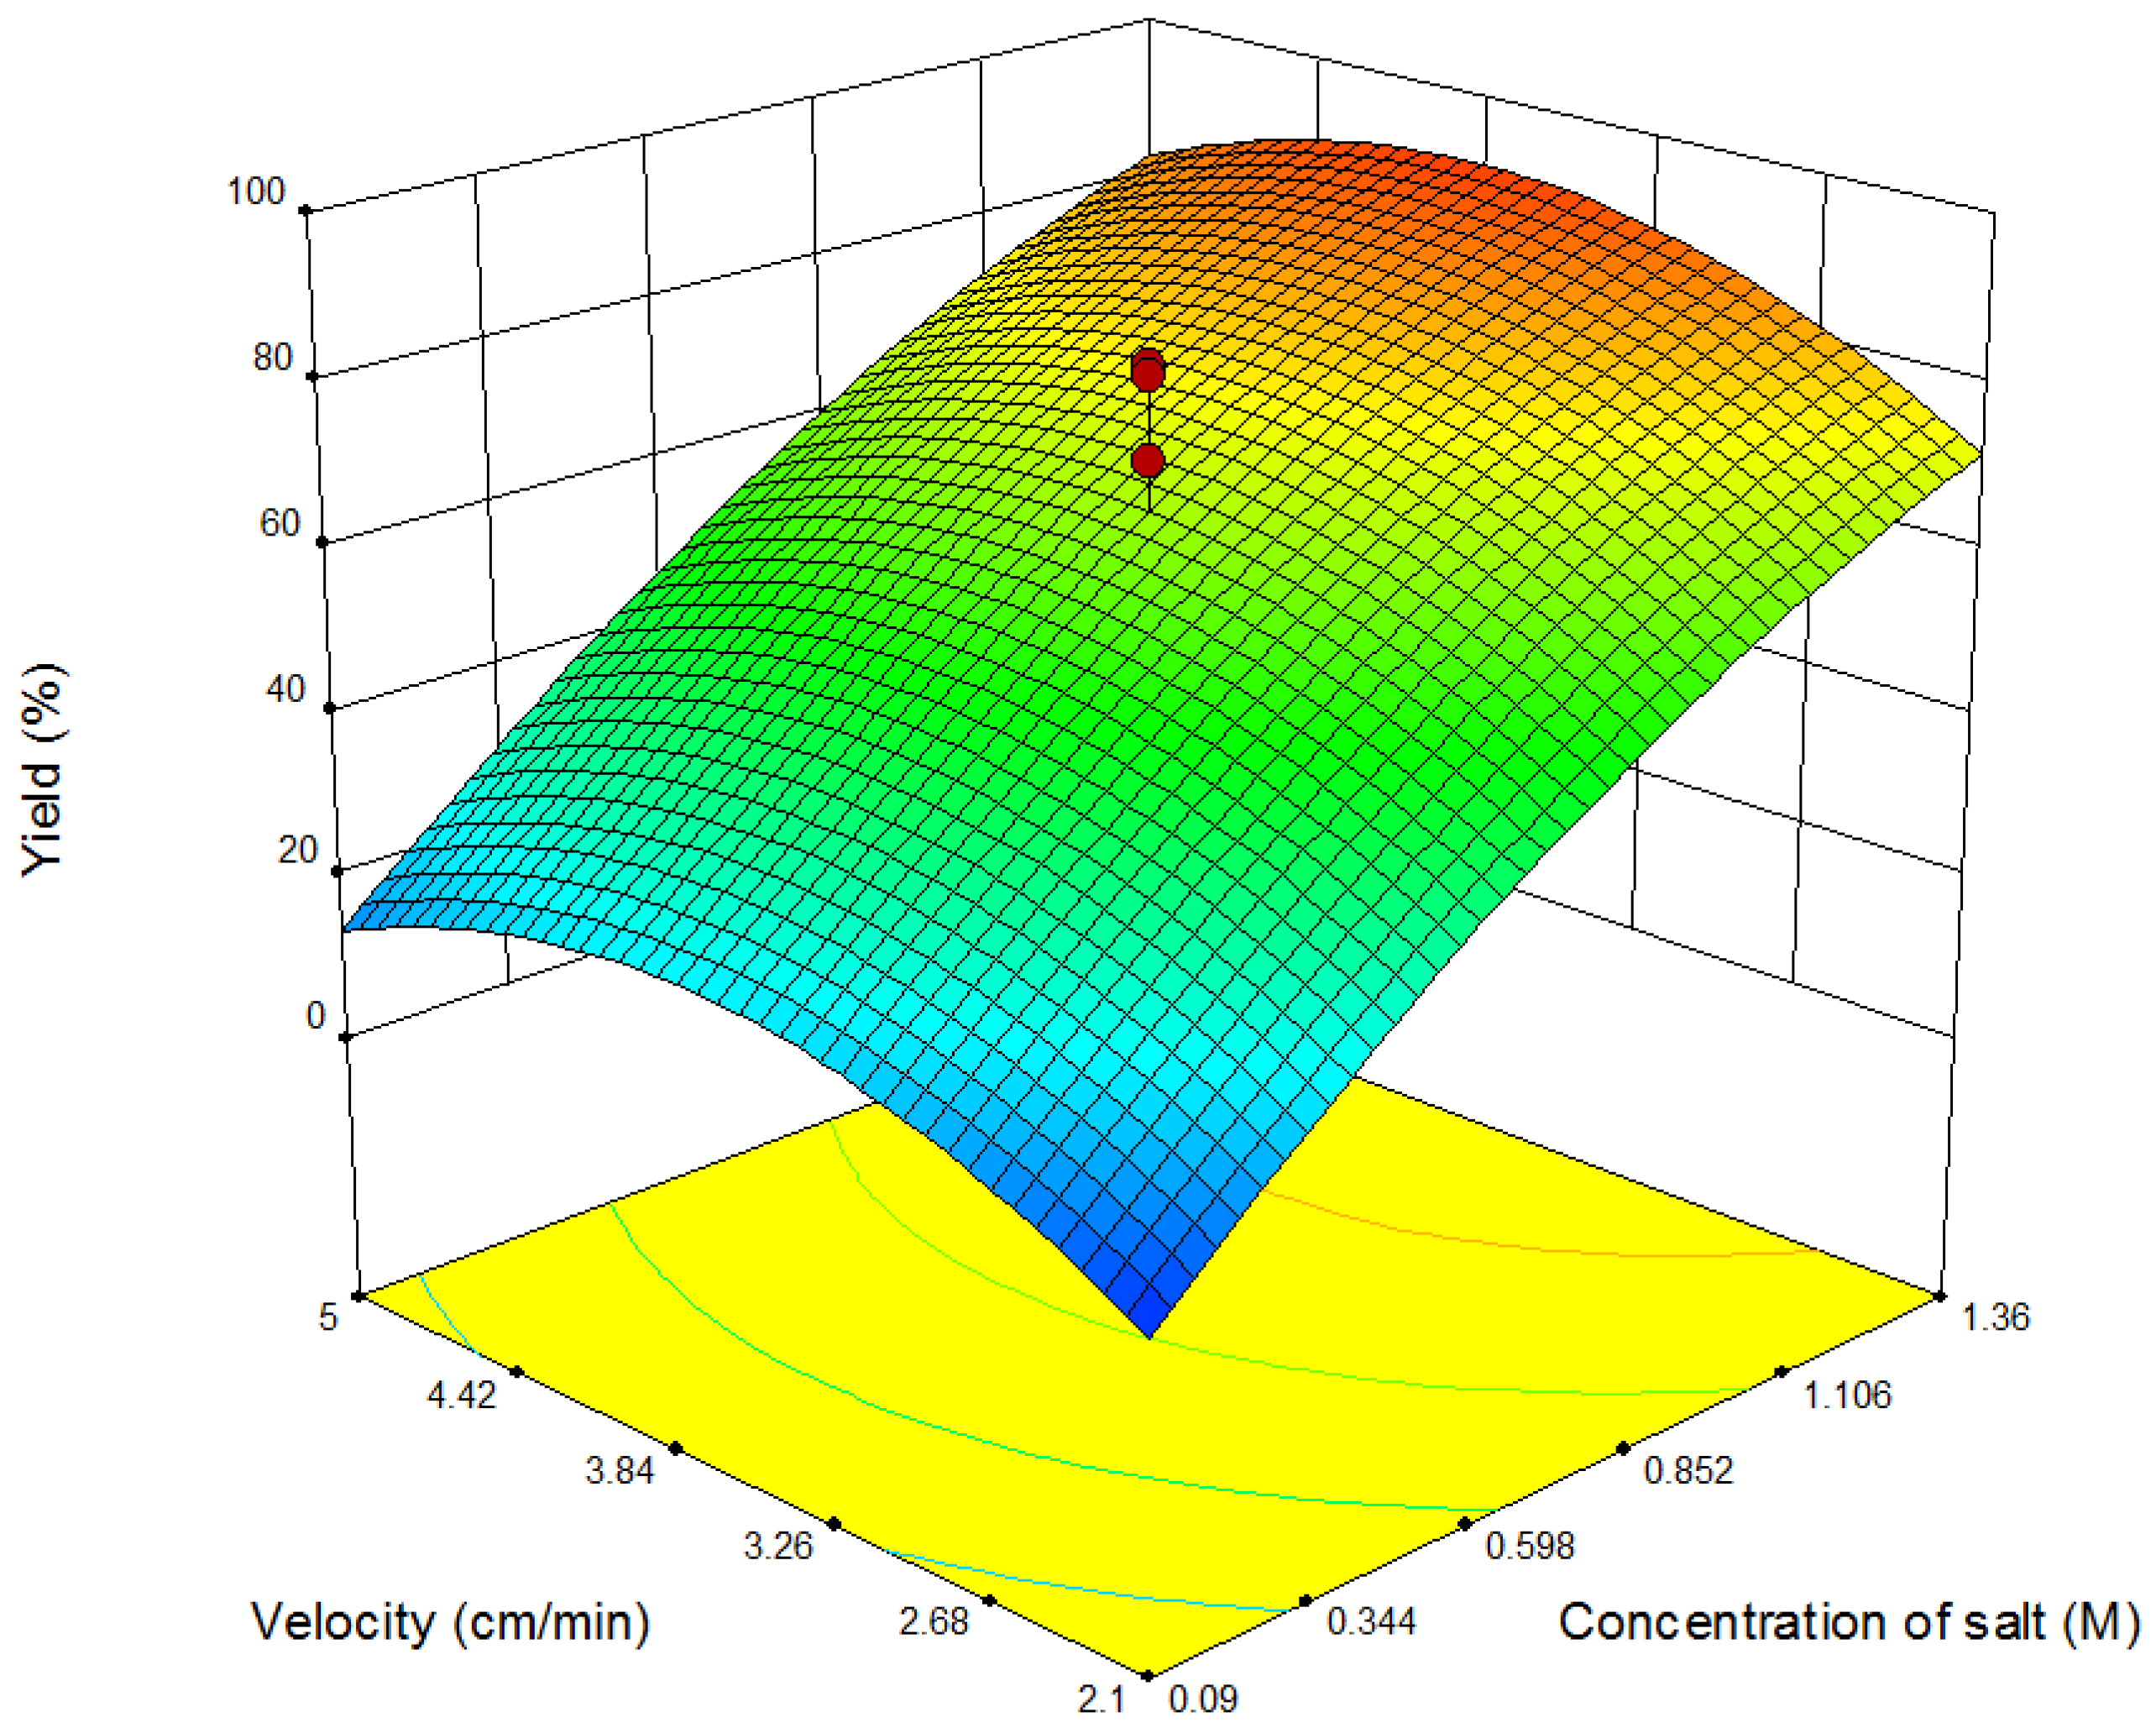
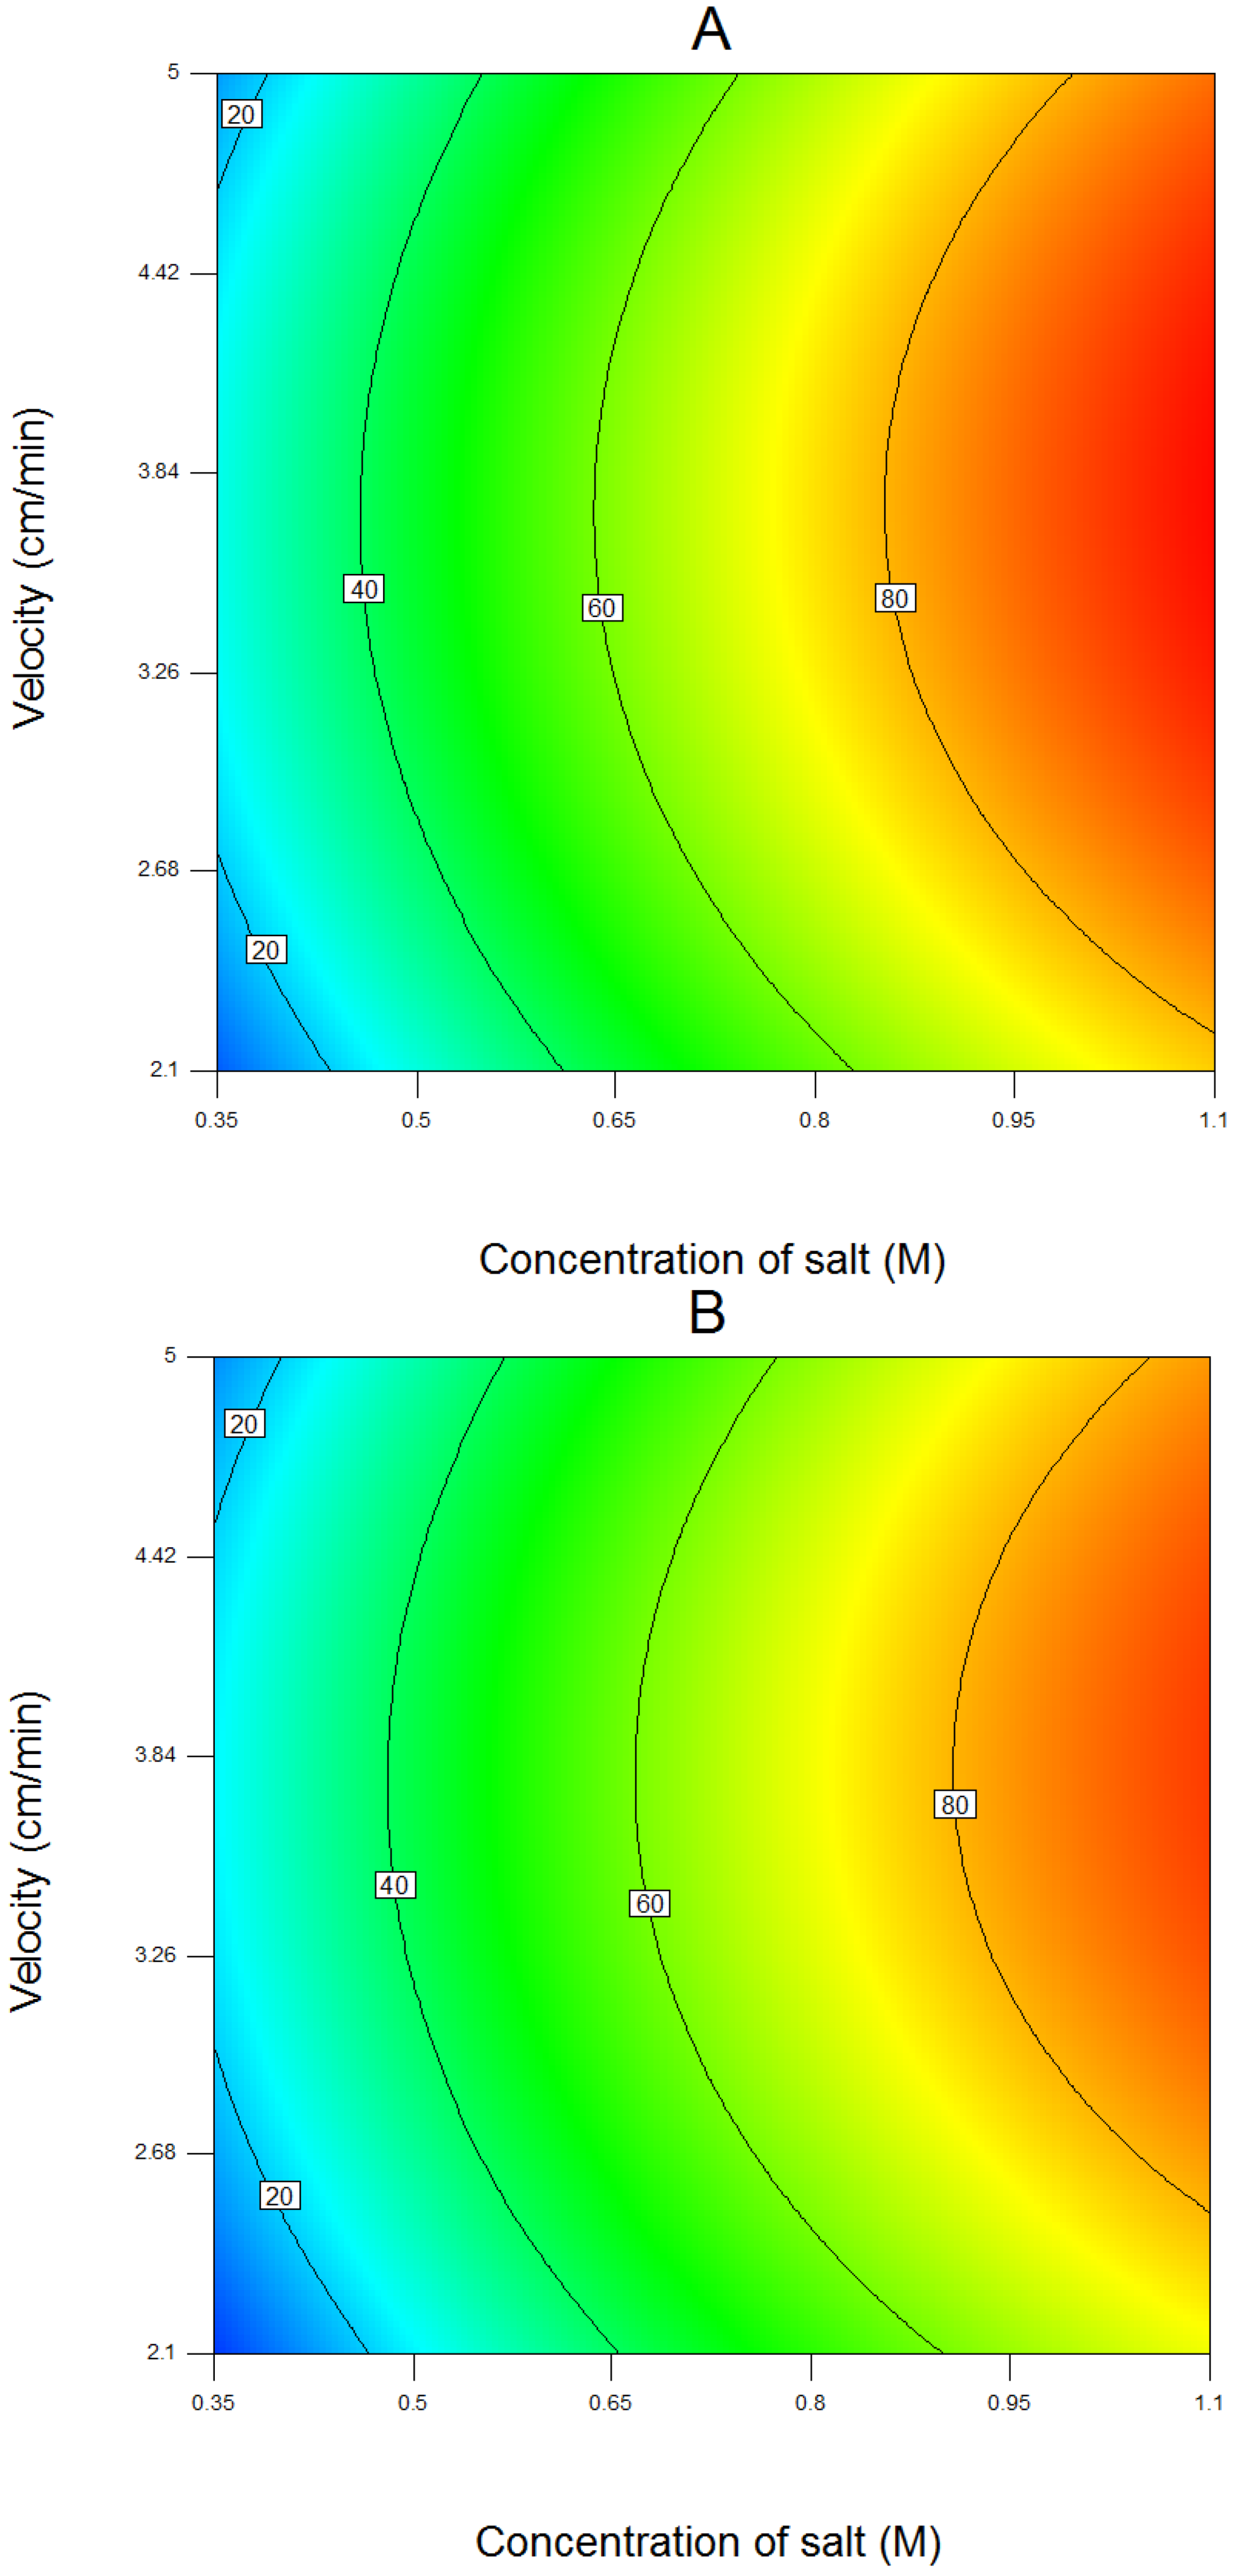
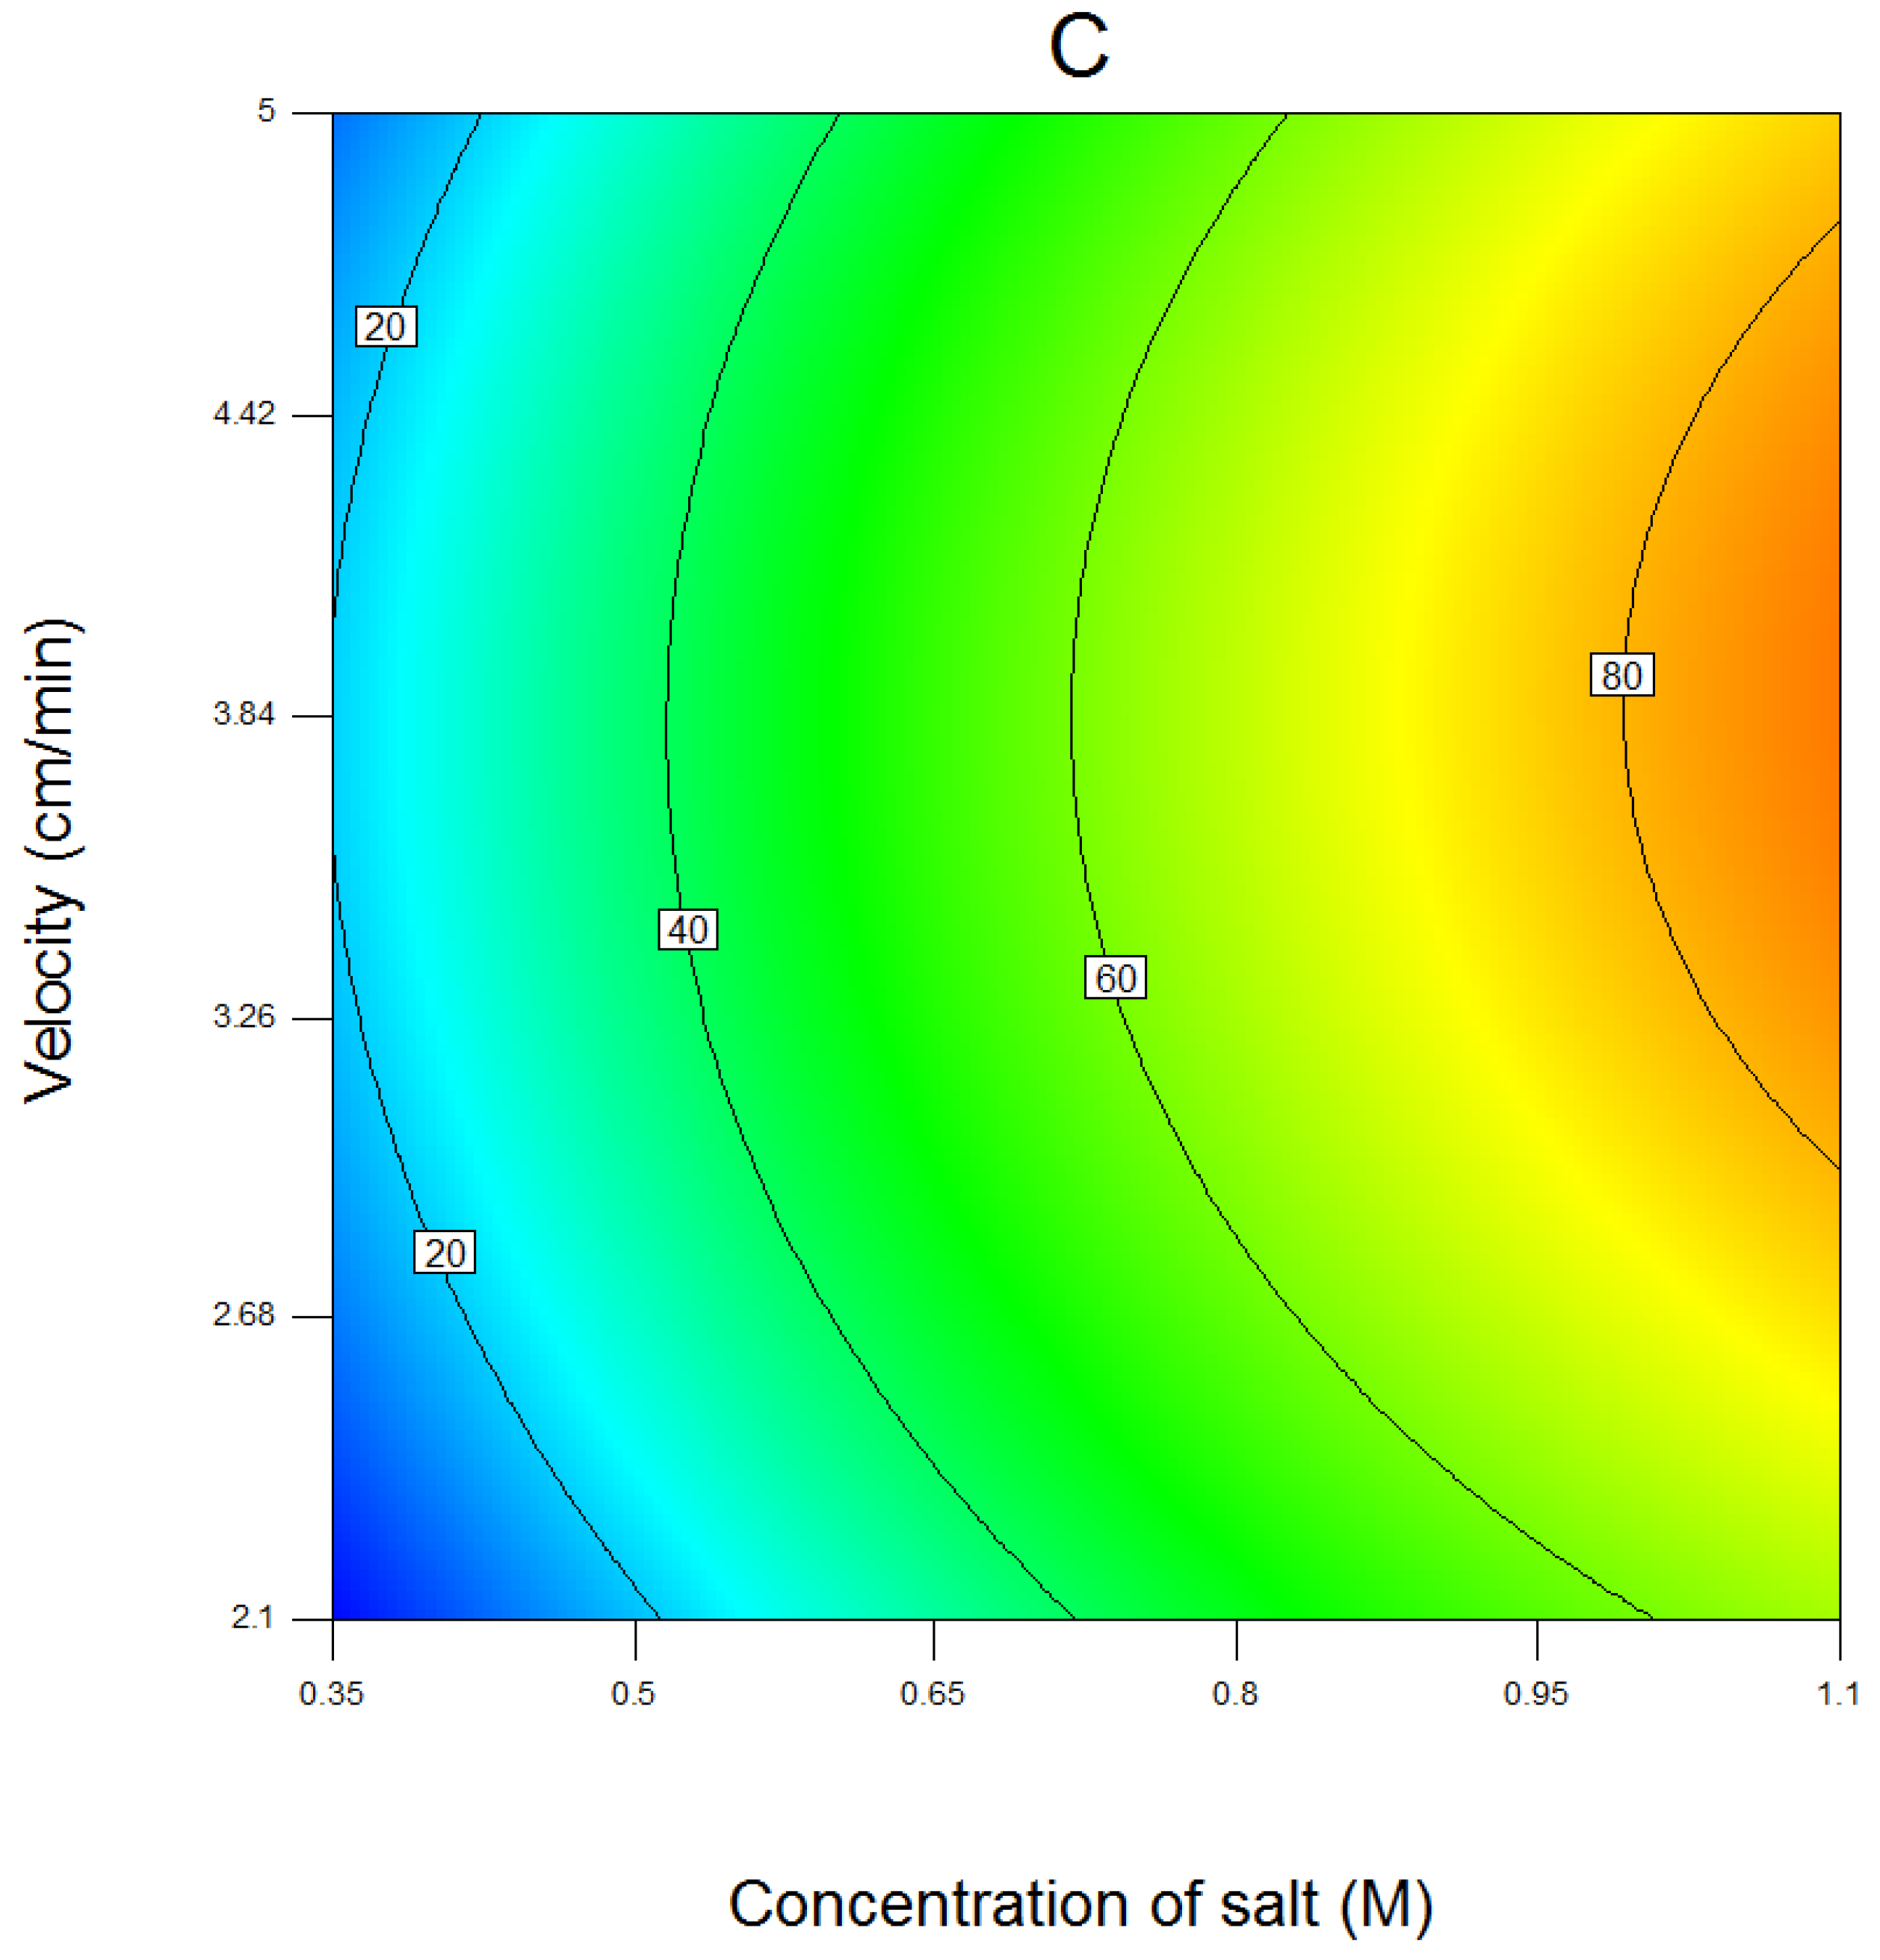
4.1. Results of Response Surface Modeling

In this study, the best-fitting response surface provided a functional relationship between the objective function yield and the gradient explanatory factors salt concentration, length of gradient, and flow velocity. The normal probability plot of the residuals from the analysis was normally distributed, indicating no evidence of non-normality, skewedness, outliers, or the existence of unidentified variables. An R2 of 0.89 is probably due to the variations in the experiments at the six center points.
According to the analysis of variance (ANOVA), the calculated probability (p-value) of a test statistic was less than 0.005 for the term final concentration of salt which translates its significance within a 95% confidence interval; whereas the p-values of gradient length and flow velocity justifiy that the coefficients are zero. The mixed effects/interaction terms of each two factors were also quantified and revealed no considerable effect in the response model. The coefficient plot (Figure 1) shows the scaled and centered coefficients for the most important factors and their influence on the objective function. The height and direction of the bars illustrate the corresponding significance of each factor. In addition, the coefficient plot displays relatively large confidence intervals for the coefficients. The broad confidence intervals are probably due to variations in the experimental equipment as the six center points show fairly large variance. Another explanation could be the fact that the investigated system reveals non-linear performance that the statistical model cannot describe.
Analysis of the model response shows that gradient final salt concentration is an important factor for yield. This is to be expected as salt will displace protein as elution proceeds, and as a result more protein will be present in the collected fractions. It suggests that gradients with a high salt concentration at gradient end were most successful with respect to the separation problem.
The variation in the two factors gradient length and flow velocity were not high enough to cause an effect on the separation of lactoperoxidase in the process. It assures that at higher flow rates, there is no broadening effect or leakage in the loading step. The significance of the coefficient for velocity × velocity term with regard to the p-value predicted by the model indicates that the hypersurface exhibits a curvature meaning that there is a maximum or minimum somewhere in the direction of flow velocity (Figure 2).
Figure 3 illustrates the projection of the response surface as a two-dimensional plane for three levels of the factor length of gradient: 15, 22.5 and 30 CV. As can be seen in Figure 3, the maximum velocity of around 3.8 cm/min with highest concentration of salt in elution buffer is predicted to achieve maximum protein yield to for all gradient lengths. The optimal region is quite large and the concentration of salt within the contour plot is steep. This indicates that small changes in the concentration of salt in elution buffer will have significant effects on the product quality of the investigated process.
Based on this empiric model function and the modeling surfaces, the factor setups for maximum qualities of separation with respect to yield were predicted (see Table 2) and experiments to evaluate the results predicted by the model were performed. The comparison between experimental results and the empiric model predictions shows low predictability of the RSM model. As can be seen in Figure 4, the predicted coefficient of determination, pred-R2 of about 0.66, indicates a narrow predictability. In other words, quadratic RSM can only describe 66% of the variety in the experimental data.

4.2. Results of the Mechanistic Model

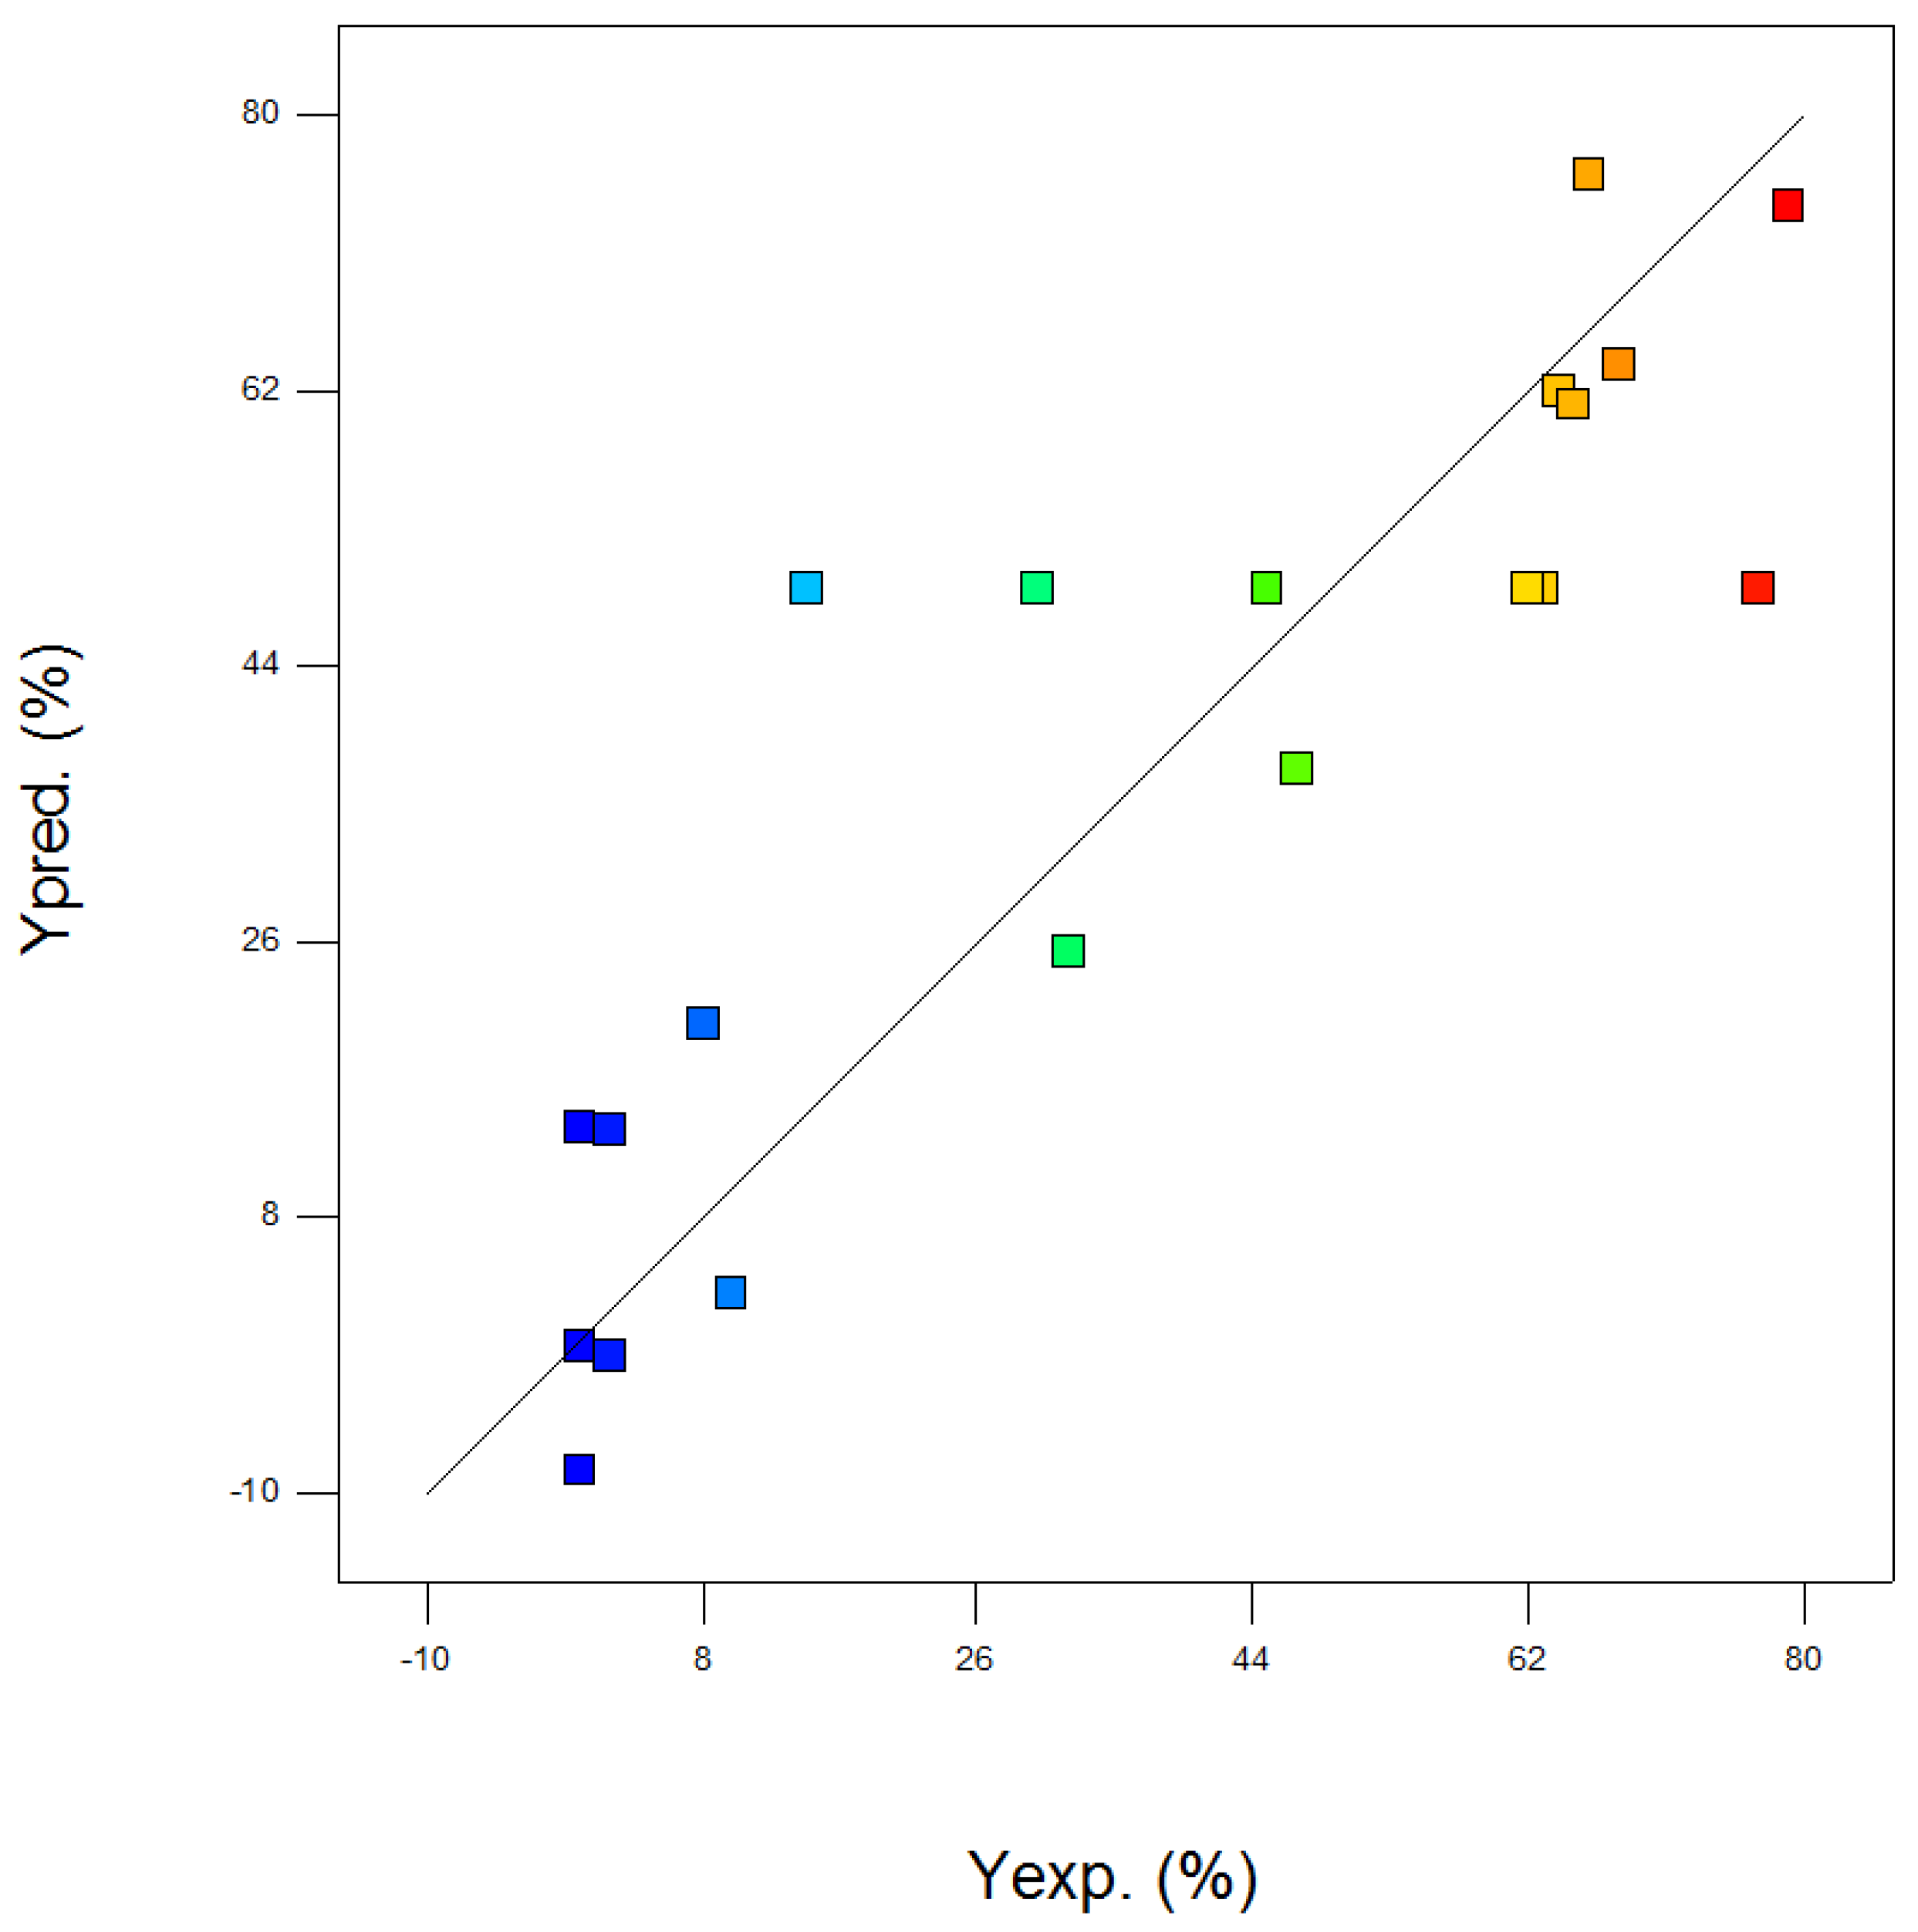
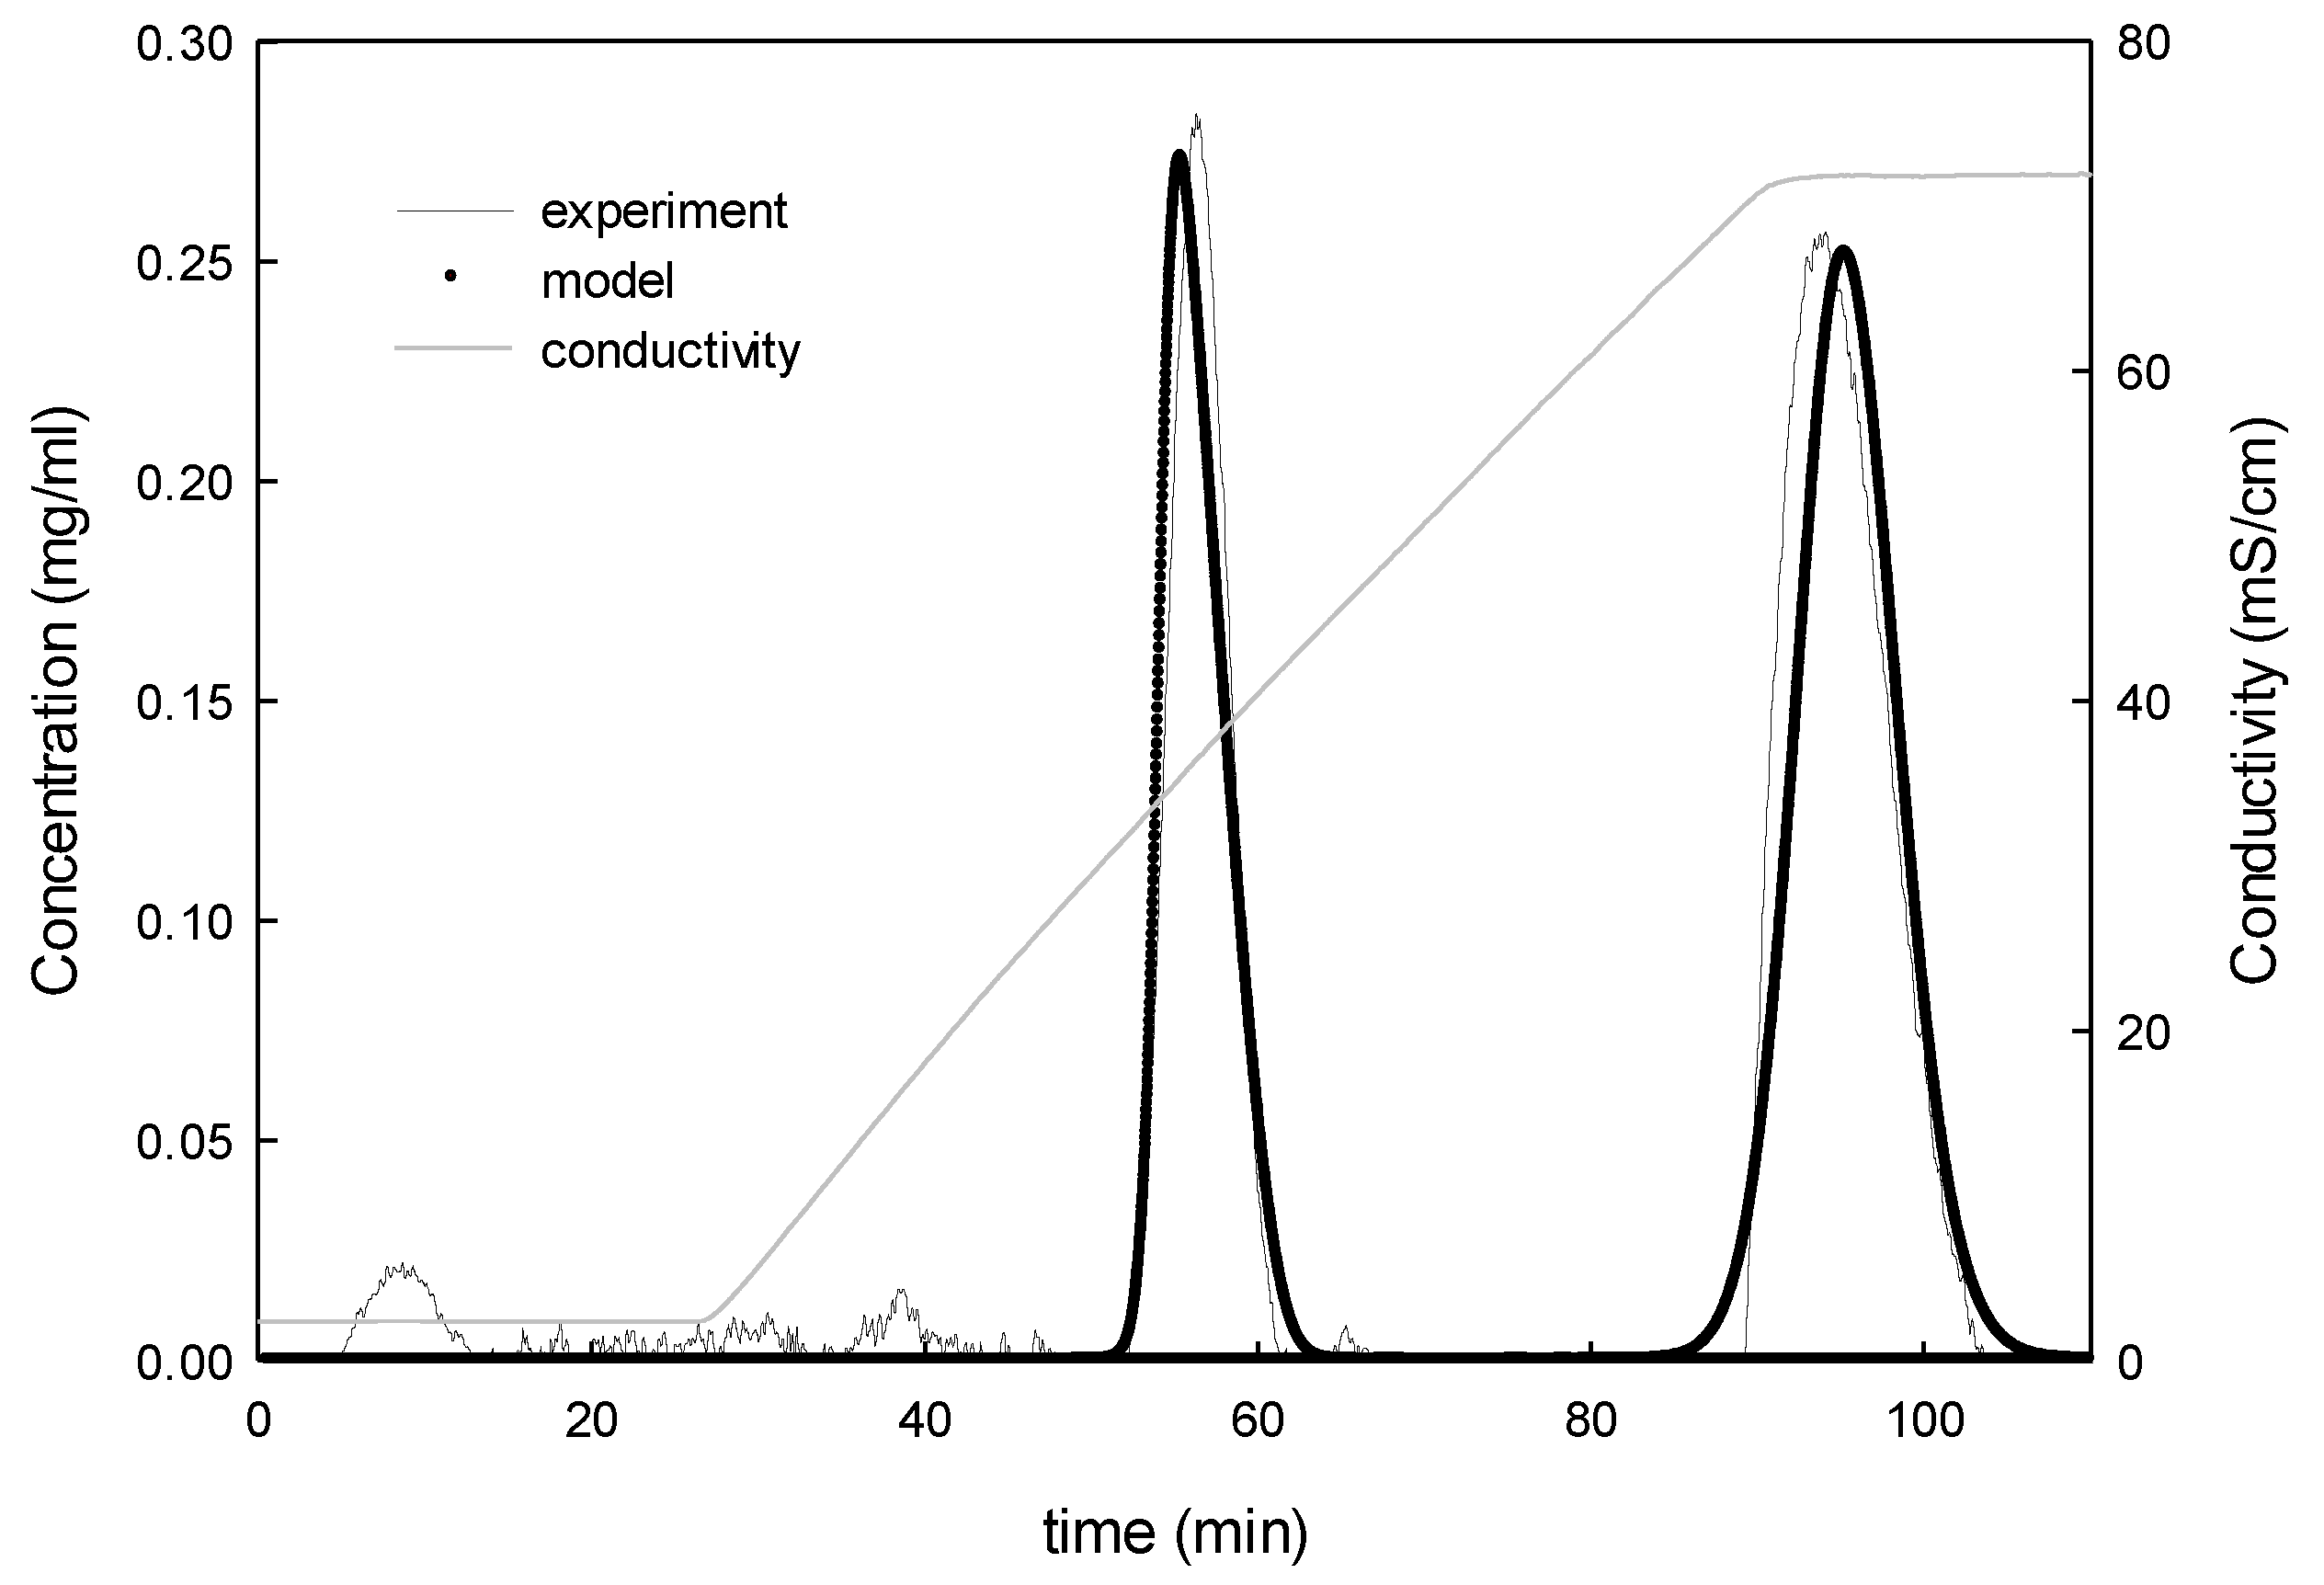
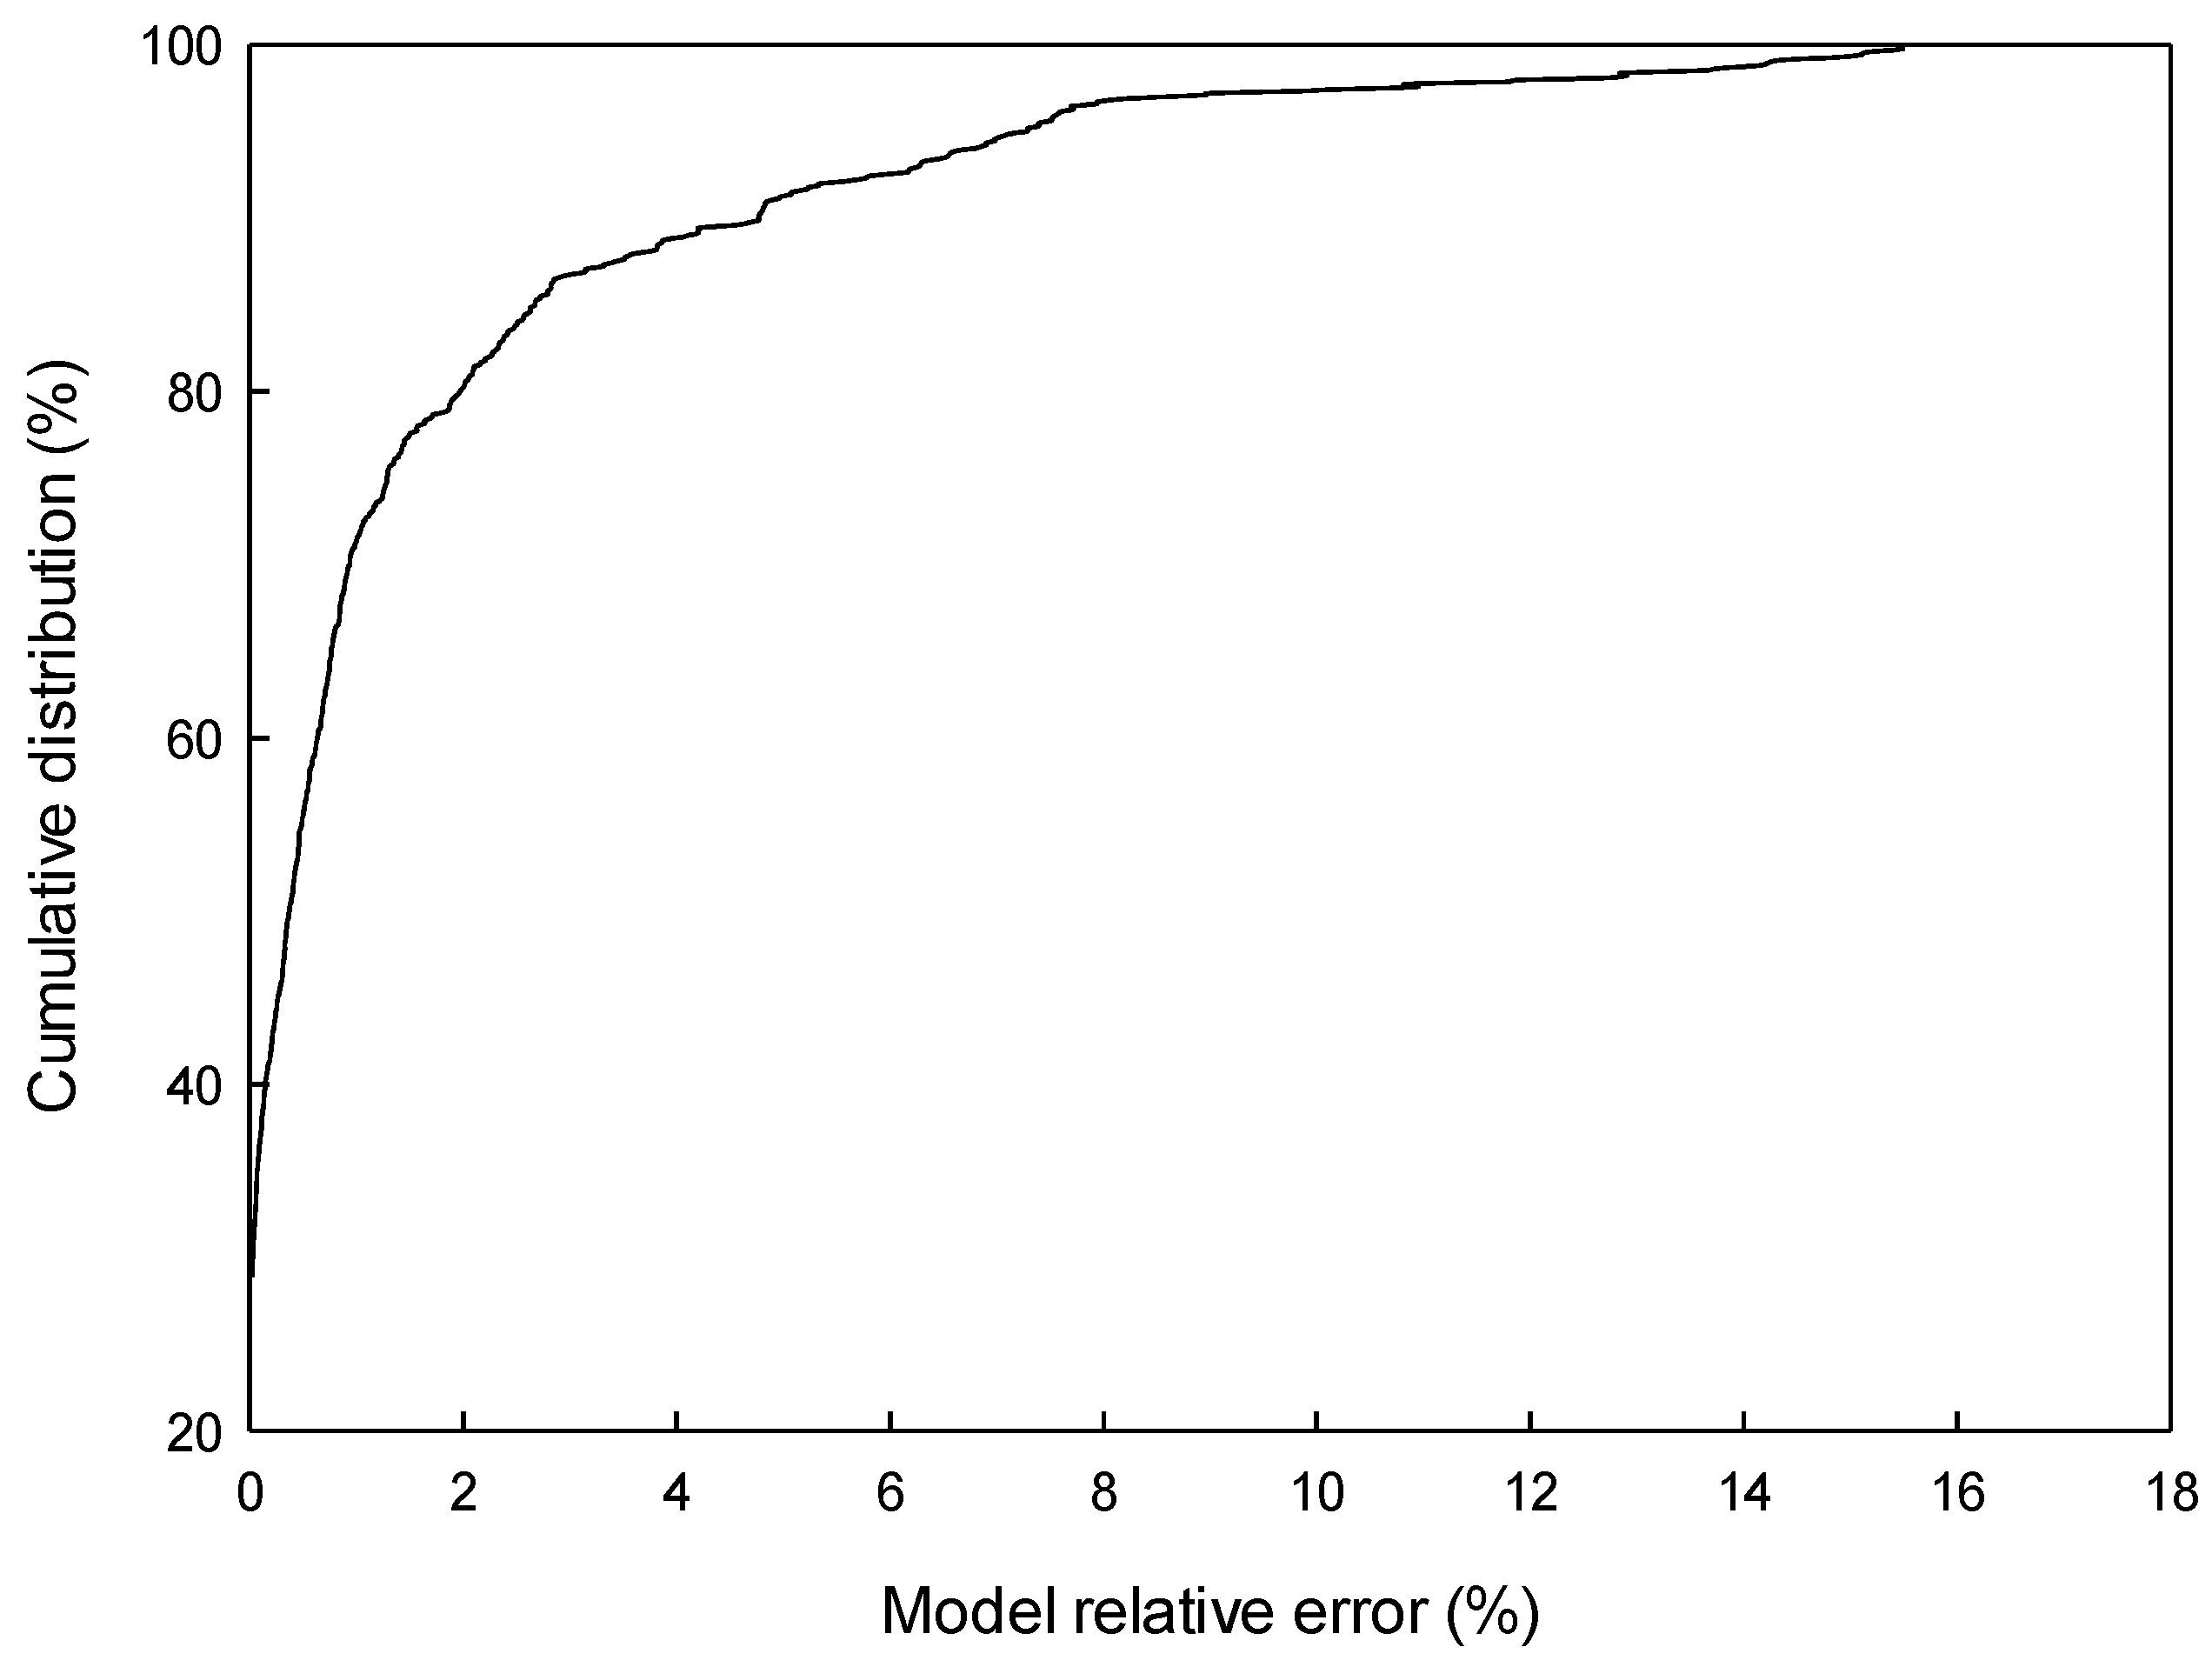
4.2.1. Model Calibration and Validation

In this section, the bed parameters of a 4.7 mL prepacked HiScreen™ SP Sepharose FF column characterized in [32] were set into the mechanistic model. The adsorption parameters with their confidence intervals are presented in Table 3. The parameters were estimated based on DoE experiments in section 4.1 to keep the predictions over the similar design space. The steric factor (σ) had negligible influence on the fitting result; thus it was fixed during the optimization of Equation (8) to previously calibrated values in [32]. Broad statistical range in the determination of σ has been reported before in [21,22].
The successful predictions based on the calibrated and verified mechanistic model is a key associated to a model-integrated process development. The validation experiments were carried out as a gradient elution experiment with higher protein concentrations that were not used in the model calibration. The model fitted the validation experiment with relatively good accuracy; in Figure 5 an example chromatogram for the gradient elution experiments with 3.55 cm/min flow velocity, an elution gradient volume of 22.5 CV at 0.26, and 1.47 mg/mL for LP and LF concentrations is shown. The elution gradient was started after 50 min and continued for around 50 min, at which point 100% high-salt buffer with a salt concentration of 0.725 M NaCl was reached. The first breakthrough is LP and the second is LF. In the washing step, some of the LP and LF were washed out; the model did not capture this amount of protein loss, causing the lack of fit in the elution step at the chromatogram.
The cumulative distribution of the error residual, including both the calibration and the validation experiments, is plotted in Figure 6. The 90% figure for the error residual is below a relative error of 4.8% and 99% of the error residual is below 14%, which may seem high; at high protein loading (validation experiments) a small deviation in the retention volume will result in a large residual error. However, these results confirm that the model is capable of describing the problem. If a more accurate solution is sought, the model should be recalibrated based on a new set of DoE experiments in this region.

4.2.2. Optimization Predictions Based on the Mechanistic Model

The elution gradient was numerically optimized with respect to the objective function. On Table 4, the prediction for the optimal gradient based on SMA parameters derived from chromatograms of the 4.7 mL column on the ÄKTA system is given in numbers. To quantitatively evaluate the optimizing performance of the calibrated model, the experimental validation was performed with the corresponding data; chromatogram was transformed beforehand from the UV absorbance measurements on the ÄKTA system to mg/ml of protein using the extinction coefficient. However, the experimental yield is close to the predictions with good precision, and describes the mechanistic model to be successful and predictive.
The predictions for the yield of lactoperoxidase with respect to optimal operating conditions deviate slightly; one explanation for this deviation can be the dynamic effects that the model cannot handle, such as pH-variations caused by increasing high-salt buffer in the system as suggested in [23]. However, as the constraint on purity (≥85%) was acceptably satisfied in the optimization step, deviation in the yield of protein can be ignored. The lowest expected purity can be determined by means of the confidence intervals of the process parameters.

5. Conclusions

The method presented in this manuscript constitutes data from factorial design of an experimental approach to quickly identifying the significance of process parameters on the objective function, as well as complexity, of the system. The empirical multi-variate model revealed a low capability to predict the behavior in the IEC column with respect to optimal operating settings for separation as a result of lack of fit and limitations in robustness of the linear gradient elution process. Nevertheless, it was reasonably accurate at proving the significant factors. In the next step, a mechanistic model was calibrated based on the DoE-planned experiments by the inverse method. The calibrated model with a reduced number of variables was then applied to find the optimal operating conditions and provide insight into the knowledge of process performance with respect to yield of lactoperoxidase and more accurate predictions with respect to process variations. The optimal operation was successfully predicted, yet the prediction of yield deviated slightly from the experimental results. This may be related to some effects such as random configurations of protein interacting with binding sites of the adsorbent, or slight changes in pH during the salt gradient elution step that the model was unable to take into account.
In summary, model-integrated process development proved to be efficient with regard to the objective of the optimization of process and led to finding the true optimum process parameters of flow velocity and concentration of salt at the end of gradient.

Author Contributions

Naeimeh Faraji, Yan Zhang and Ajay K. Ray conceived and designed the experiments, Naeimeh Faraji performed all the experiments and calculations, Naeimeh Faraji and Yan Zhang analyzed the data, Naeimeh Faraji wrote the article, Yan Zhang and Ajay K. Ray reviewed and revised the article.

Conflicts of Interest

The authors declare no conflict of interest.

Abbreviation

cp,iconcentration of protein i in the pores of the adsorbent (M)
csaltsalt concentration in the pores of the adsorbent (M)
ciprotein concentration i in the mobile phase (M)
Daxaxial dispersion coefficient (mm2/s)
Dmmolecular diffusivity in mobile phase (mm2/s)
keff,ieffective mass transfer coefficient of protein i (mm/s)
kads,iadsorption coefficient of protein i in the SMA isotherm
kdes,idesorption coefficient of protein i in the SMA isotherm
keq,iequilibrium coefficient of protein i
Llength of the column (mm)
qiprotein concentration i on the adsorbent phase (M)
rpparticle radius (mm)
uintinterstitial velocity of the fluid (mm/s)
Yrecovery yield
εccolumn voidage
εpparticle voidage
εttotal voidage
1−εttphase ratio
Λtotal ionic capacity (M)
νicharacteristic charge of protein i in SMA isotherm
ηmobile phase viscosity (Pa.s)
σisteric factor of protein i in the SMA isotherm

References

  1. Ekstrand, B. Antimicrobial factors in milk—A review. Food Biotechnol. 1989, 3, 105–126. [Google Scholar] [CrossRef]
  2. Dairy Processing Handbook. Available online: http://www.dairyprocessinghandbook.com/chapter/whey-processing (accessed on 10 January 2017).
  3. Barth, C.A.; Schlimme, E. Milk Proteins: Nutritional, Clinical, Functional and Technological Aspects; Springer International: Darmstadt, Germany, 1988. [Google Scholar]
  4. Pedersen, L.; Mollerup, J.; Hansen, E.; Jungbauer, A. Whey proteins as a model system for chromatographic separation of proteins. J. Chromatogr. B 2003, 790, 161–173. [Google Scholar] [CrossRef]
  5. Gerberding, S.; Byers, C. Preparative ion-exchange chromatography of proteins from dairy whey. J. Chromatogr. A 1998, 808, 141–151. [Google Scholar] [CrossRef]
  6. Hahn, R.; Schulz, P.; Schaupp, C.; Jungbauer, A. Bovine whey fractionation based on cation-exchange chromatography. J. Chromatogr. A 1998, 795, 277–287. [Google Scholar] [CrossRef]
  7. El-Sayed, M.M.H.; Chase, H.A. Purification of the two major proteins from whey concentrate using a cation-exchange selective adsorption process. Biotechnol. Prog. 2009, 192–199. [Google Scholar] [CrossRef] [PubMed]
  8. Fee, C.J.; Chand, A. Capture of lactoferrin and lactoperoxidase from raw whole milk by cation exchange chromatography. Sep. Purif. Technol. 2006, 48, 143–149. [Google Scholar] [CrossRef]
  9. Strohmaier, W. Chromatographic fractionation of whey proteins. IDF Bull. 2004, 389, 29–35. [Google Scholar]
  10. Tolkach, A.; Kulozik, U. Fractionation of whey proteins and peptides by means of membrane techniques in connection with chemical and physical pretreatments. IDF Bull. 2004, 389, 20–23. [Google Scholar]
  11. Rombauts, W.A.; Schroeder, W.A.; Morrison, M. Bovine lactoperoxidase. partial characterization of the further purified protein. Biochemistry 1967, 6, 2965–2977. [Google Scholar] [CrossRef] [PubMed]
  12. Flemmig, J.; Gau, J.; Schlorke, D.; Arnhold, J. Lactoperoxidase as a potential drud tarket. Expert Opin. Ther. Targets 2016, 20, 447–461. [Google Scholar] [CrossRef] [PubMed]
  13. Yao, X.; Bunt, C.; Cornish, J.; Quek, S.-Y.; Wen, J. Oral delivery of lactoferrin: A review. Int. J. Pept. Res. Ther. 2013, 19, 125–134. [Google Scholar] [CrossRef]
  14. Noppe, W.; Pliva, F.M.; Galaev, I.Y.; Vanhoorelbeka, K.; Mattiasson, B.; Deckmyn, H. Immobilised peptide displaying phages as affinity ligands purification of lactoferrin from defatted milk. J. Chromatogr. A 2006, 1101, 79–85. [Google Scholar] [CrossRef] [PubMed]
  15. Andersson, J.; Mattiasson, B. Simulated moving bed technology with a simplified approach for protein purification Separation of lactoperoxidase and lactoferrin from whey protein concentrate. J. Chromatogr. A 2006, 1107, 88–95. [Google Scholar] [CrossRef] [PubMed]
  16. Korhonen, H.; Pihlanto, A. Technological options for the production of health-promoting proteins and peptides derived from milk and colostrum. Curr. Pharm. Des. 2007, 13, 829–843. [Google Scholar] [CrossRef] [PubMed]
  17. Fweja, L.W.T.; Lewis, M.J.; Grandison, A.S. Isolation of lactoperoxidase using different cation exchange resins by batch and column prodecures. J. Dairy Res. 2010, 77, 357–367. [Google Scholar] [CrossRef] [PubMed]
  18. Ahamed, T.; Nfor, B.K.; Verheart, P.D.E.M.; van Dedem, G.W.K.; van der Wielen, L.A.M.; Eppink, M.H.M.; van der Sandt, E.J.A.X.; Ottens, M. pH-gradient ion-exchange chromatography: An analytical tool for design and optimization of protein separations. J. Chromatogr. A 2007, 1164, 181–188. [Google Scholar] [CrossRef] [PubMed]
  19. Mandenius, C.-F.; Brundin, A. Bioprocess optimization using design-of-experiments methodology. Biotechnol. Prog. 2008, 24, 1191–1203. [Google Scholar] [CrossRef] [PubMed]
  20. Bezerra, M.A.; Santelli, R.E.; Oliveira, E.P.; Villar, L.S.; Escaleira, L.A. Response surface methodology (RSM) as a tool for optimization in analytical chemistry. Talanta 2008, 76, 965–977. [Google Scholar] [CrossRef] [PubMed]
  21. Iyer, H.; Tapper, S.; Lester, P.; Wolk, B.; van Reis, R. Use of the steric mass action model in ion-exchange chromatographic process development. J. Chromatogr. A 1999, 832, 1–9. [Google Scholar] [CrossRef]
  22. Shukla, A.A.; Bae, S.S.; Moore, J.A.; Barnthouse, K.A.; Cramer, S.M. Synthesis and Characterization of High-Affinity, Low Molecular Weight Displacers for Cation-Exchange Chromatography. Ind. Eng. Chem. Res. 1998, 37, 4090–4098. [Google Scholar] [CrossRef]
  23. Brooks, C.A.; Cramer, S.M. Steric mass-action ion exchange: Displacement profiles and induced salt gradients. AIChE J. 1992, 38, 1969–1978. [Google Scholar] [CrossRef]
  24. Carlström, A. The heterogeneity of lactoperoxidase. Acta Chem. Scand. 1965, 19, 2387–2394. [Google Scholar] [CrossRef] [PubMed]
  25. Bardsley, W.G. Steady-state kinetics of lactoperoxidase-catalyzed reactions. Immunol. Ser. 1985, 27, 55–87. [Google Scholar]
  26. Guiochon, G.; Felinger, A.; Shirazi, D.G.; Katti, A.M. Fundamentals of Preparative and Nonlinear Chromatography; Academic Press: San Diego, CA, USA, 2006. [Google Scholar]
  27. Davis, M.E. Numerical Methods and Modeling for Chemical Engineers; John Wiley & Sons: New York, NY, USA, 1984. [Google Scholar]
  28. Danckwerts, P.V. Continuous flow systems. Chem. Eng. Sci. 1953, 2, 1–13. [Google Scholar] [CrossRef]
  29. Shampine, L.F.; Reichelt, M.W. The MATLAB ODE Suite. SIAM J. Sci. Comput. 1997, 18, 1–22. [Google Scholar] [CrossRef]
  30. Sherwood, T.K.; Pigford, R.L.; Wilke, C.R. Mass Transfer; McGraw-Hill: New York, NY, USA, 1975. [Google Scholar]
  31. Gunn, D.J. Axial and radial dispersion in fixed beds. Chem. Eng. Sci. 1987, 42, 363–373. [Google Scholar] [CrossRef]
  32. Faraji, N.; Zhang, Y.; Ray, A.K. Determination of adsorption isotherm parameters for minor whey proteins by gradient elution preparative liquid chromatography. J. Chromatogr. A 2015, 1412, 67–74. [Google Scholar] [CrossRef] [PubMed]
Figure 1. The coefficient plot resulting from the response surface regression of the screening experiments. The values on y-axis represents corresponding values of variables depicted on x-axis.
Separations 04 00010 g001
Figure 2. 3D surface plot based on the central composite design (CCD) method.
Separations 04 00010 g002
Figure 3. Surface contour plots based on 20 experiments.
Separations 04 00010 g003aSeparations 04 00010 g003b
Figure 4. Experimental and predicted yield of lactoperoxidase.
Separations 04 00010 g004
Figure 5. The validation experiment with an elution gradient of 22.5 column values (CV).
Separations 04 00010 g005
Figure 6. The cumulative distribution for the calibration and validation experiments plotted against the relative residual error.
Separations 04 00010 g006
Table 1. Coded and un-coded values of the process factors in screening experiments of central composite.
RunSaltCoded Length of GradientFlow VelocitySalt (M)Un-Coded Length of Gradient (CV)Flow Velocity (cm/min)
1−1−1−10.35152.1
21−1−11.1152.1
3−11−10.35302.1
411−11.1302.1
5−1−110.35154.998
61−111.1154.998
7−1110.35304.998
81111.1304.998
9−1.681000.09422.53.549
101.681001.35522.53.549
110−1.68100.7259.883.549
1201.68100.72535.13.549
1300−1.6810.72522.51.112
14001.6810.72522.55.985
150000.72522.53.549
160000.72522.53.549
170000.72522.53.549
180000.72522.53.549
190000.72522.53.549
200000.72522.53.549
Table 2. Optimum factor set for maximum yield of lactoperoxidase based on the design of experiments–response surface methodology (DoE–RSM) approach.
Concentration of Salt (M)1.10
Flow velocity (cm/min)3.77
Gradient length (CV)15
Predicted yield (%)96.41
Experimental yield (%)78.04
Table 3. SMA parameters for lactoperoxidase and lactoferrin on HiScreen™ SP FF column.
Protein k eq ν k des σ
lactoperoxidase0.22 ± 0.0053.07 ± 0.01419.89 ± 0.0711283
lactoferrin11.65 ± 0.0032.73 ± 0.0060.98 ± 0.220.98
Table 4. Optimal operating conditions for the separation of LP and LF.
Concentration of Salt (M)0.82
Flow velocity (cm/min)4.32
Gradient length (CV)16.28
Predicted yield (%)89.92
Experimental yield (%)86.73

