1. Introduction and Background of This Research
Currently, the electrification of islands has become an effective instrument for the sustainable development of these regions both in developing countries and in developed countries. A lot of research has been carried out in the field of renewable energy use on remote islands to increase the penetration of renewable energy [
1,
2]. More and more islands have become self-sufficient in energy thanks to renewable energy. For example, the island of EL Hierro in Spain is 100% self-sufficient due to their hydro-wind electricity generation system. In addition, the Greek island of Tilos is the first in the Mediterranean to produce almost all of its own electricity from wind and solar energy [
3]. Thanks to 11 wind turbines and a biomass power plant, the island of Samso in Denmark was also the first to get completely rid of fossil fuels. However, compared to the number of islands in the world, only 1% of the islands have become self-sufficient in energy. The cost and power system flexibility are among the reasons for the observed low penetration of renewable energies in remote areas. With strong social and environmental incentives to integrate maximum renewable content, improved power system efficiency and reduced system cost can be seen as a pathway to increased renewable energy penetration.
In Tunisia, 21 islands are not populated. They are remote islands. Power shortages and high conventional power cost remains one of the biggest drawbacks of covering remote areas. Islands need a continuous and reliable electricity supply from renewable sources, especially photovoltaic (PV) sources and wind systems (WT). Exploiting these sources can bring great socio-economic benefits to islands. According to the National Institute of Meteorology, Tunisia has one of the largest solar deposits in the world. The annual average of sunshine exceeds 3000 h; it is also the most important of all the Mediterranean Basin with 1800/m
2/year. The wind resource is also important, with an annual speed wind equal to 6 m/s [
4,
5]. However, their intermittent and random character does not guarantee a continuous supply. For this reason, attaching a storage system (H
2 storage) can overcome this problem, but this solution is still hampered by the high owning costs [
6,
7,
8,
9,
10,
11,
12]. Thus, the use of hydraulic storage and a battery energy system associated with the PV/wind system is an attractive concept to provide consumers on remote islands with reliable and cheap electricity. However, this alternative depends upon the optimal combination and sizing design of the renewable energy generation system coupled with the storage system. Recently, different sizing and optimization methodologies have been developed by the research community in order to appreciate the feasibility and the economic effect of such solutions [
13,
14,
15,
16,
17,
18,
19]. Some studies [
20,
21,
22,
23,
24] have developed several methods to extract the optimal sizing of renewable systems associated with different storage devices. In Refs. [
25,
26], Particle Swarm Optimization (PSO) has been used for optimal sizing of hybrid renewable energy systems. In Ref. [
27], the authors used the cuckoo optimization algorithm for sizing wind, PV, batteries, and diesel generator components for the lowest cost of energy and loss of load probability. Another study solved the sizing problem by using the grey wolf optimization (GWO) [
28]. However, the most common is by far the class of genetic algorithms (GA), and the most widely used one is NSGA-II [
29,
30]. More recent research has used NSGA II for the optimal sizing of a hybrid renewable energy system [
31,
32,
33].
In the literature, the demand for electricity on remote islands is usually provided by diesel generators, leading to considerable uncertainty because of the cost of fuel and the high pollution of the surrounding environment [
34]. The optimal sizing of PV/wind/hydraulic/battery with multi-objective formulation with combination of cost-LPSP is rarely found in literature.
In this context, this paper presents techno-economic analysis and intelligent optimization of a PV/wind system with hydraulic and battery storage system, ensuring the continuous supply of electricity to a load demand on a remote island in Tunisia.
2. Description of the System
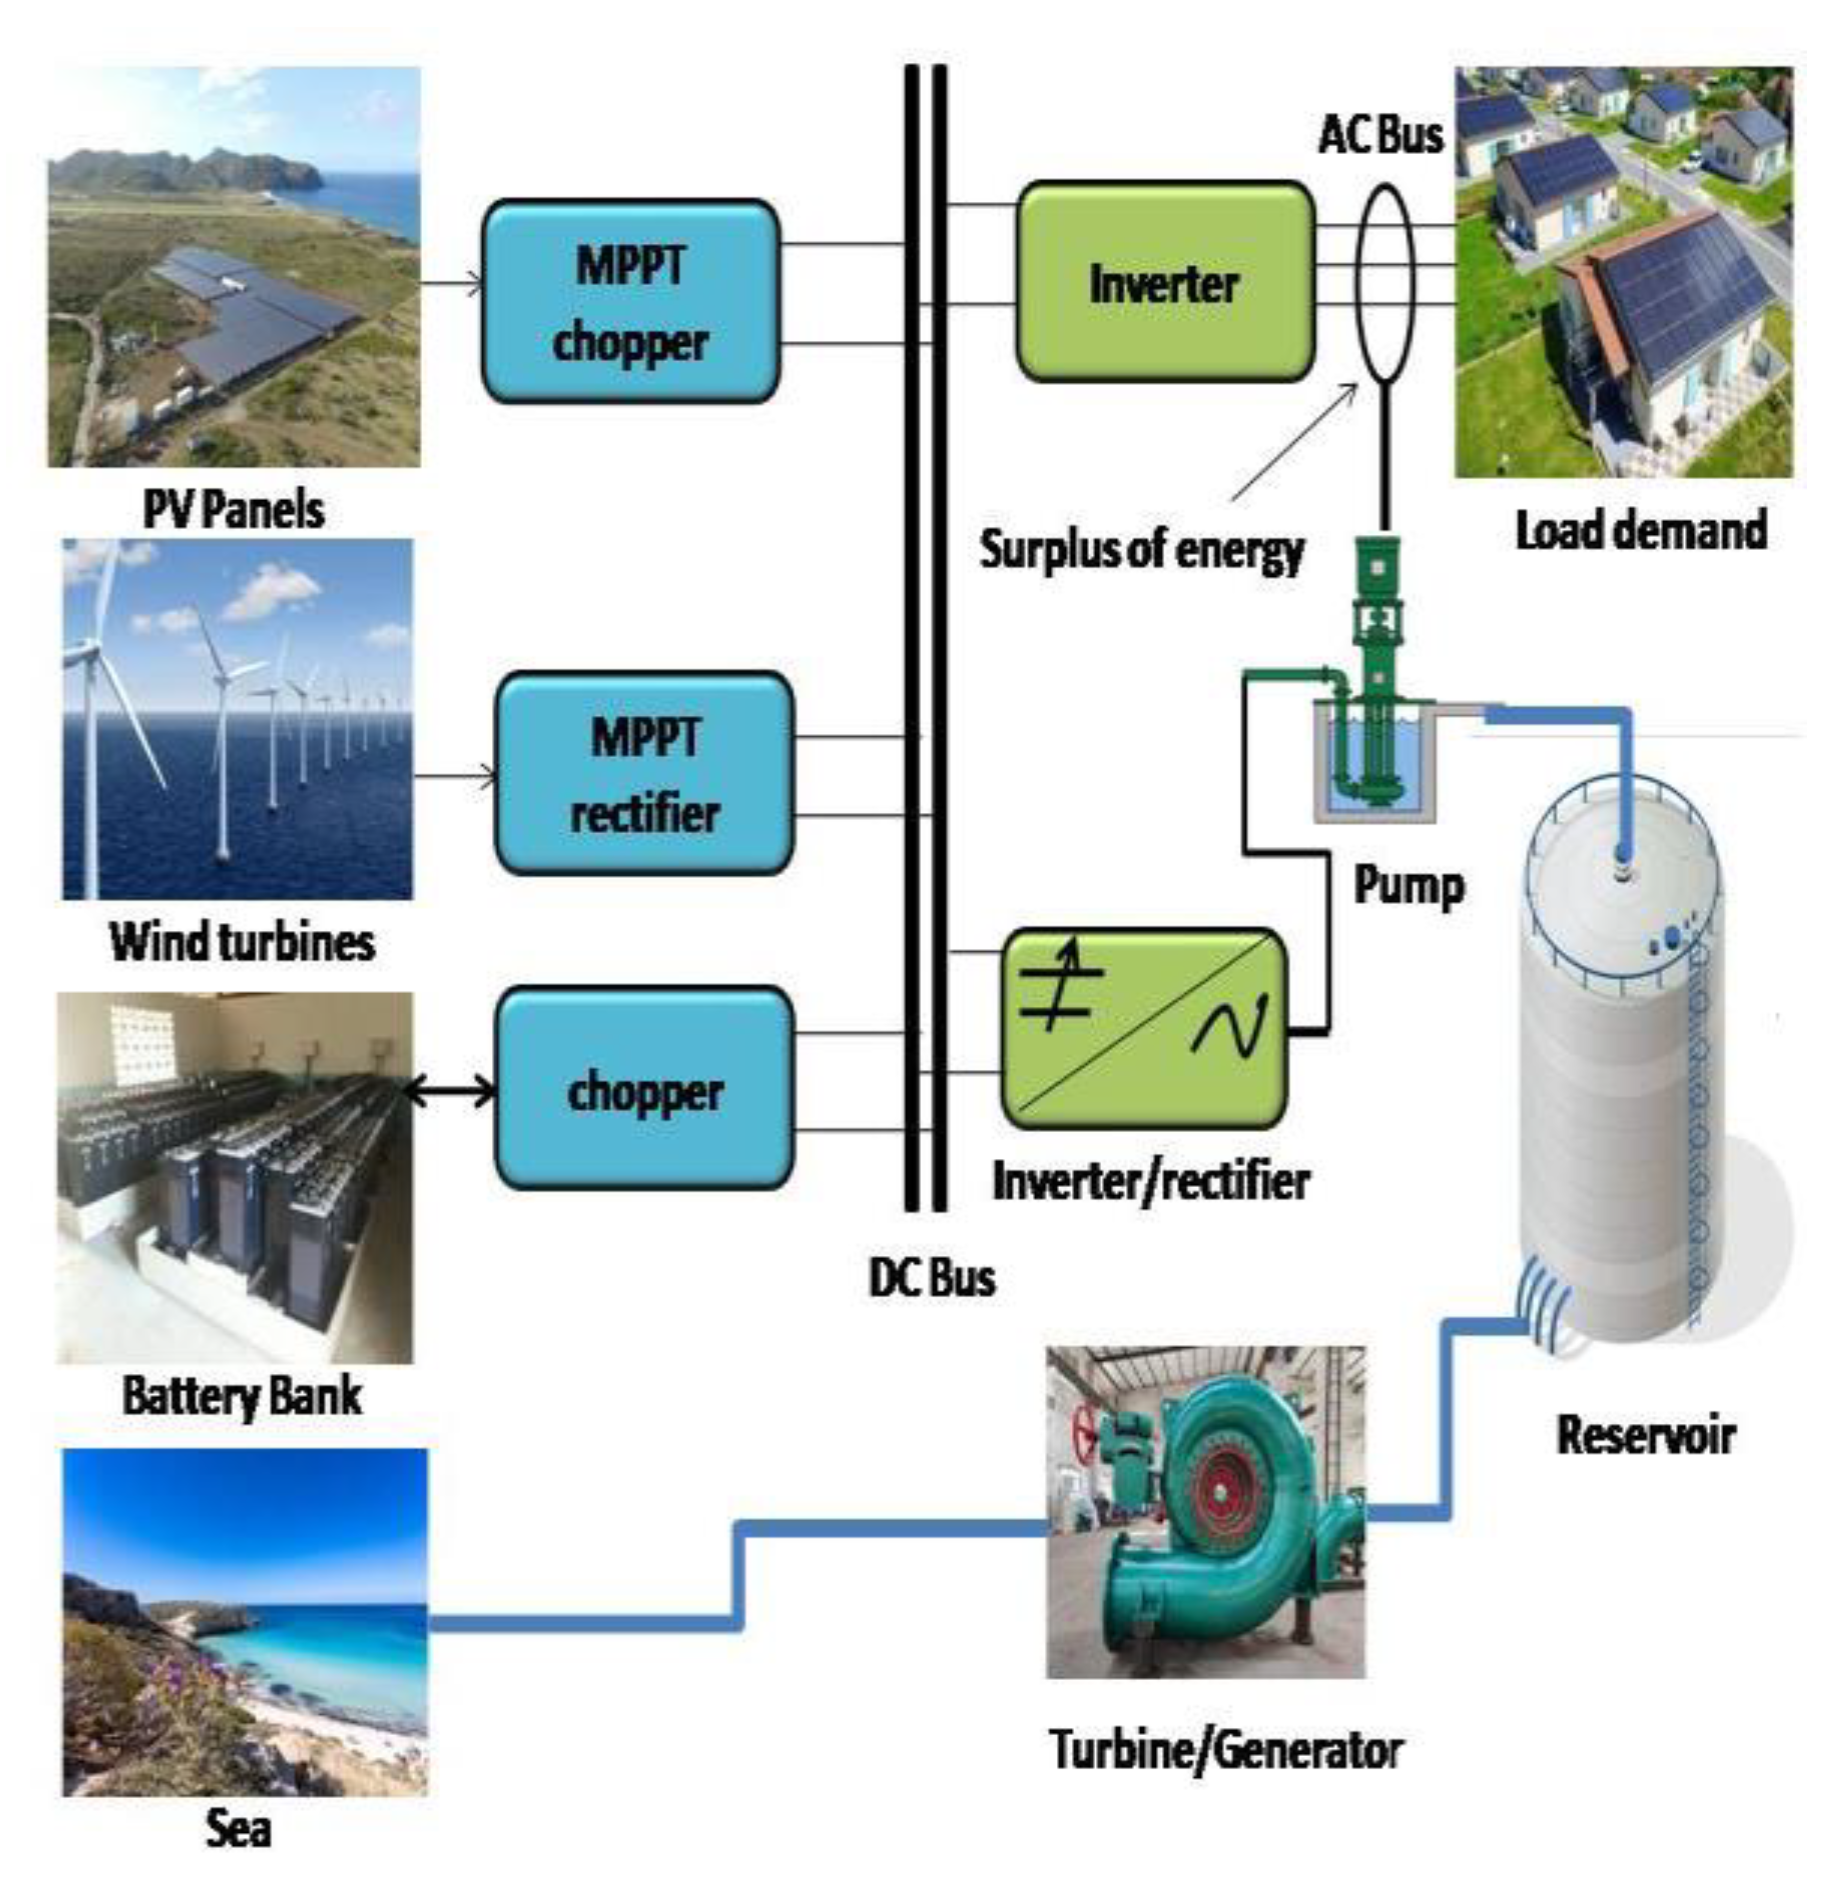
Figure 1 presents the proposed architecture of the hybrid PV/wind electricity production system and the hydraulic/electrochemical (bank battery) storage system investigated in this study. Wind energy production system(wind turbine), PV energy production system (PV arrays),bank battery, and hydraulic storage (pump, turbines/generator, and reservoir) are interfaced by static converters in a maximum power point tracking (MPPT) operation, thus enabling energy on the DC bus (48 V) routed to the AC load demand by means of the inverter. The energy flows of the storage system are bidirectional, while they are unidirectional for the production system. The phase of pumping seawater to the reservoir and charging the bank battery when the PV/wind hybrid electricity production has a surplus of energy compared to the energy demand and the turbinated phase and discharge in the event of a lack of energy by the hydraulic turbine and the battery ensures continuity of supply to the remote site. Simulations will be carried out with solar radiation, wind, and load of charge in the remote site, over a year on average, sampling every half an hour. This work is interested in optimizing the dimension of this system based on two contradictory criteria. The crucial phase will consist in defining these criteria for optimizing the problem.
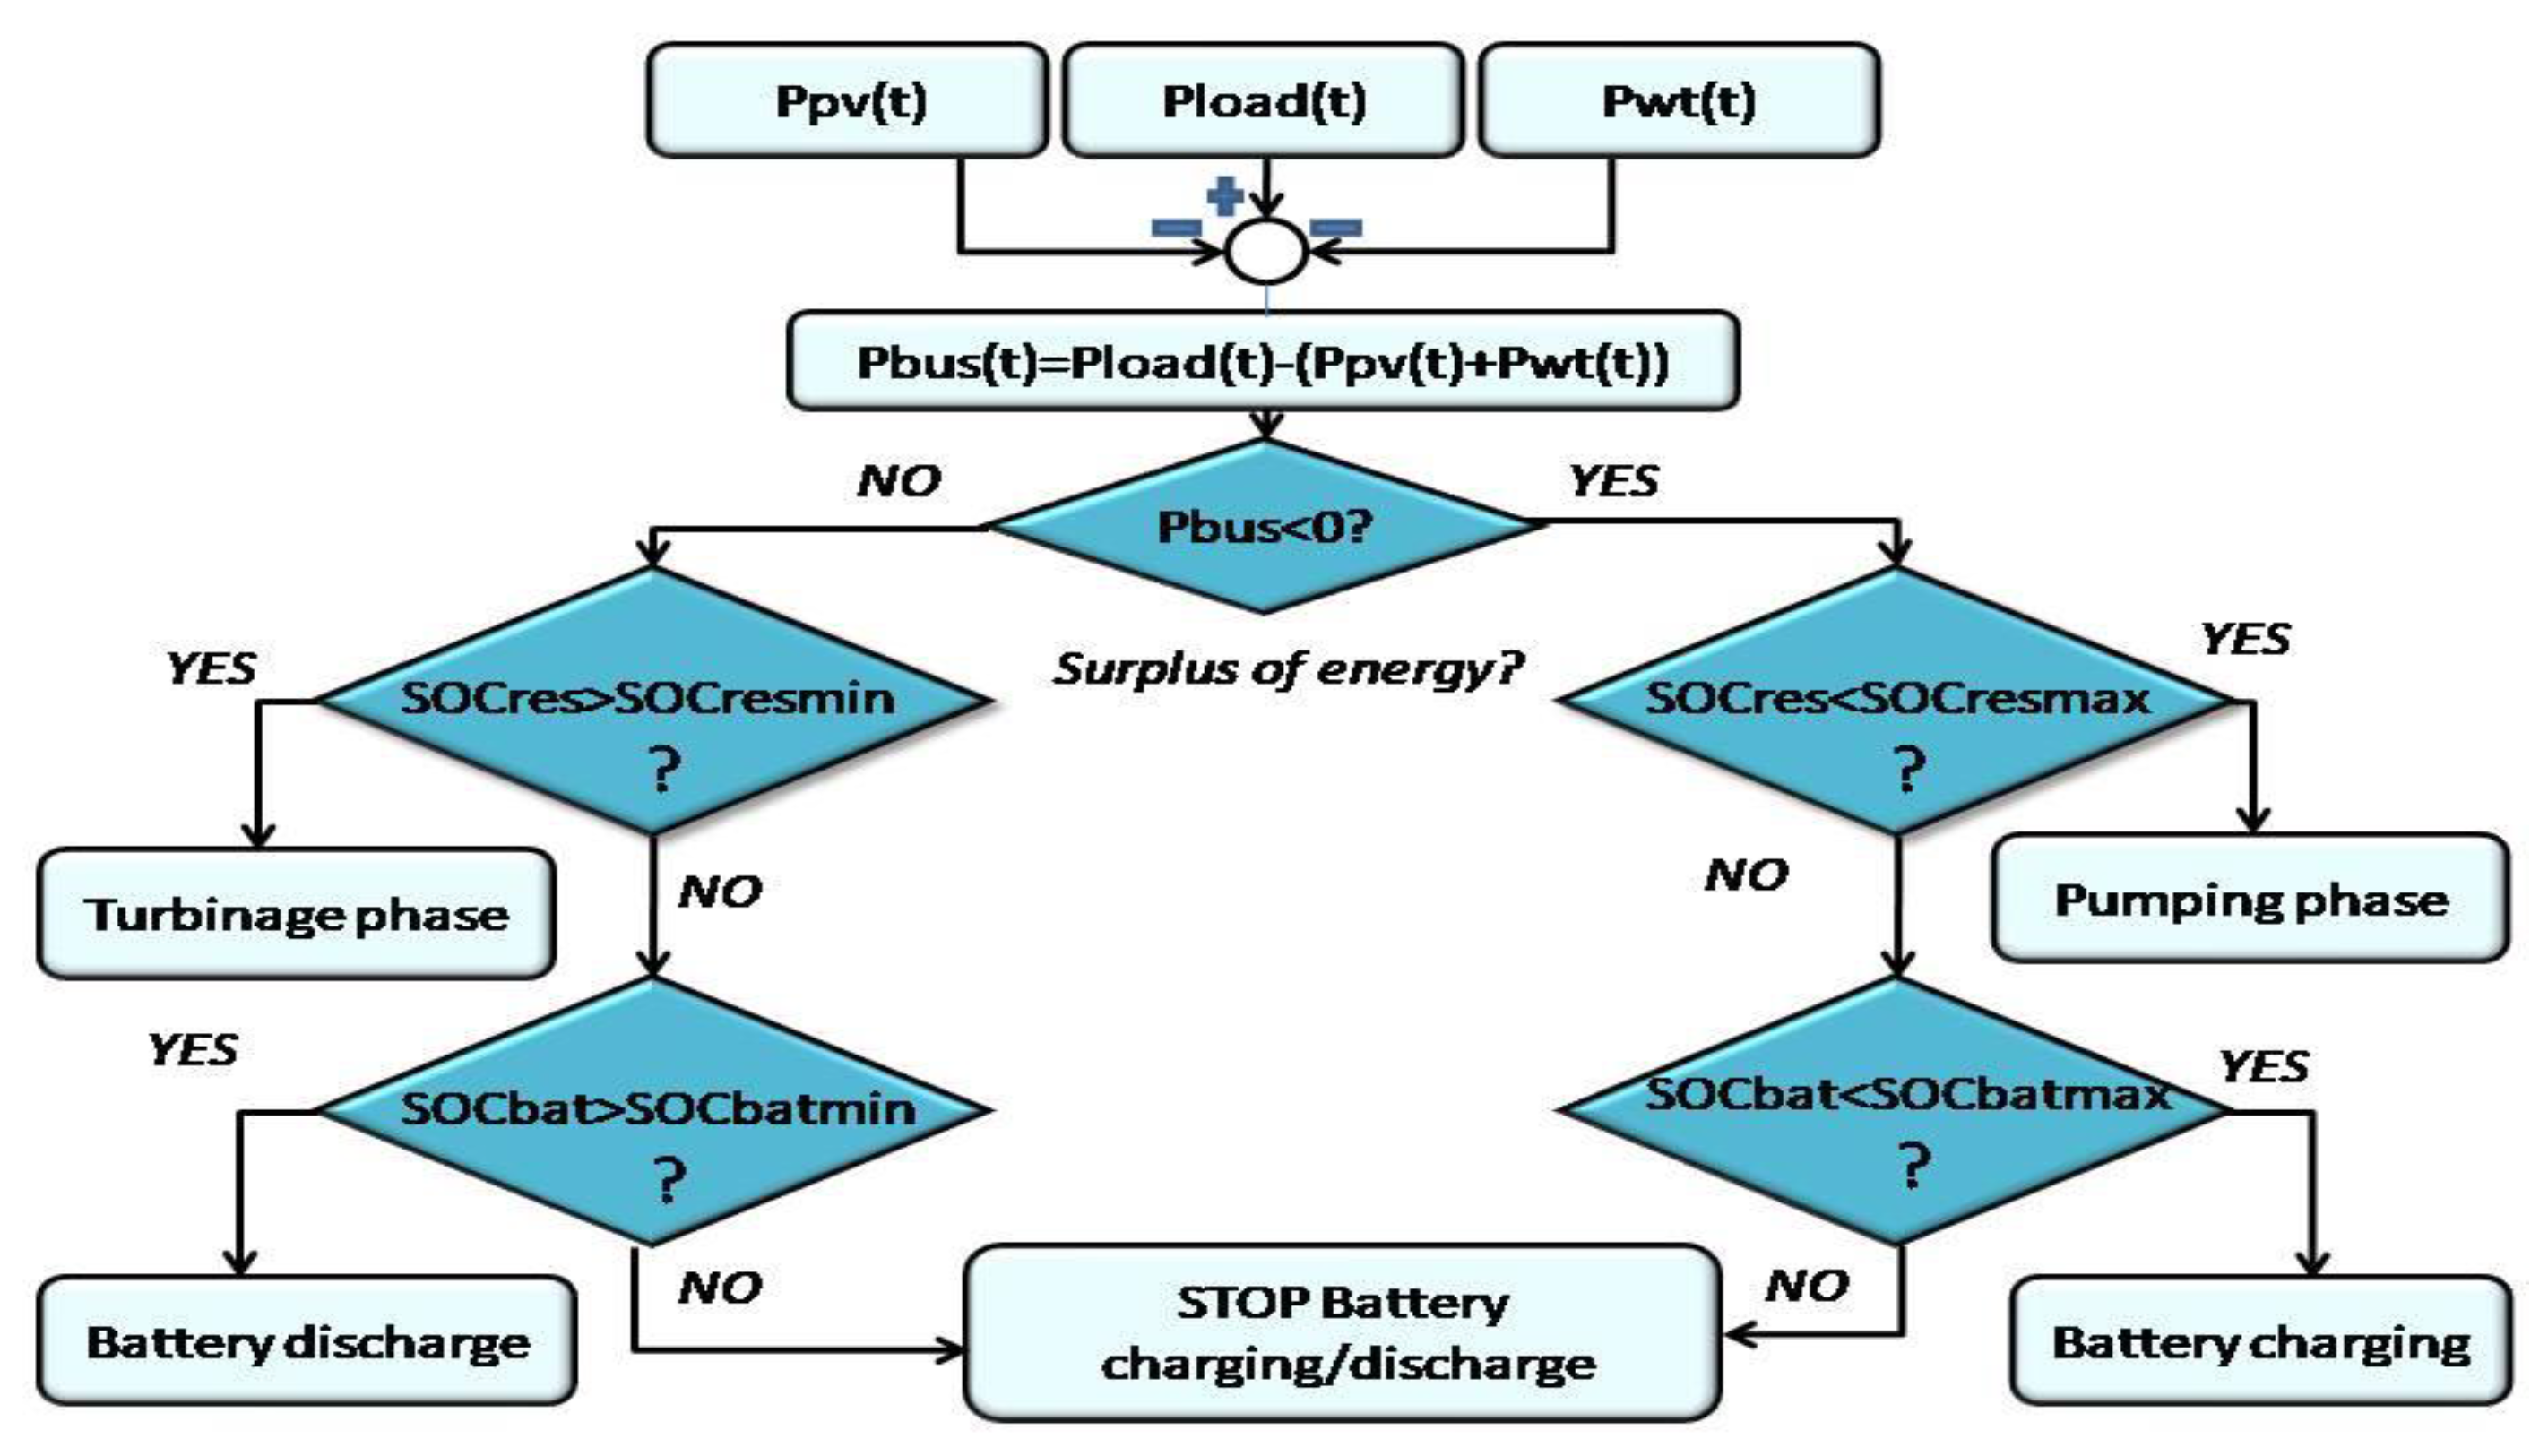
The flowchart of the hybrid PV/wind and hydraulic /battery multi-storage system operation is illustrated in
Figure 2. Primary, wind profile, solar irradiation profile, and load demand of the remote site are included. The wind will turn into wind power (Pwt), from which the power generated by the wind turbine will be calculated. In addition, the PV power generated by the PV panels will be measured through a solar irradiation. The sum of PV power (Ppv) and wind power (Pwt) will be compared with power consumption (Pload) through the DC bus (Pbus). Second, the state of charge of the reservoir (SOCres) and of the battery bank (SOCbat) will be calculated. If Pload < (Ppv + Pwt), we have a surplus of energy, leading to verify the SOCres. If SOCres < SOCresmax is confirmed, the pumping phase until the water tank is full. When, the SOCres = SOCres max and SOCbat < SOCbatmax, the surplus of energy will charge the bank of battery until SOCbat = SOCbatmax. The second condition is when Pload > (Ppv + Pwt). Here we have a deficiency of energy. The system switches to turn on the turbine, which operates until SOCres = SOCresmin. When this condition is verified, the battery discharges and supplies the site with energy until SOCbat = SOCbatmin.
3. Modeling and Simulation
In this study, we consider that the bus DC voltage is constant and equal to 48 V. All the elements of the system such as PV power source, wind power source, the water storage system, and the bank of battery are coupled to the bus DC through converters (choppers and inverters).These models will be used by the optimal design process. Due to the higher computation time in this type of optimization problems, we use energetic models. The processing time cost is a priority in our work.
3.1. Data Capture
The wind speed profile represented in
Figure 3 has been obtained from a statistical distribution model (based on Weibull distribution) from the wind energy potential at a typical region in Tunisia. This model successfully models the probability of occurrence of wind resource wind speeds [
35,
36].
The load profile is obtained by estimating the energy needs on a remote site and the behavior of the habitat during the day. The first phase is between 0 h and 5 h 30 min, corresponding to a period during which the demand for electrical energy is low (no activities). The second phase is between 5 h 30 min and 10 h, corresponding to a period of high family activity (lighting, heating, etc.) and agricultural activities (operation of rural equipment): during this phase, electricity consumption increases, with a peak around 7:30 a.m., then it decreases. The third phase, which is approximately between 10 a.m. and 4.45 p.m., corresponds to a period of slower activity due to lunch breaks and interruptions in agricultural activities: during this phase, electricity consumption is at an average level and is quite stable. The fourth phase, which extends from 4:45 p.m. to midnight, corresponds to the return period and the end of agricultural activities; the families return to their homes (lighting, audiovisual, etc.). During this period, the demand for electrical energy is the highest. Electricity consumption increases sharply, and then falls again at the end of the evening, with the peak of consumption being around 6:30 p.m. The description of the lead demand is illustrated by
Figure 4.
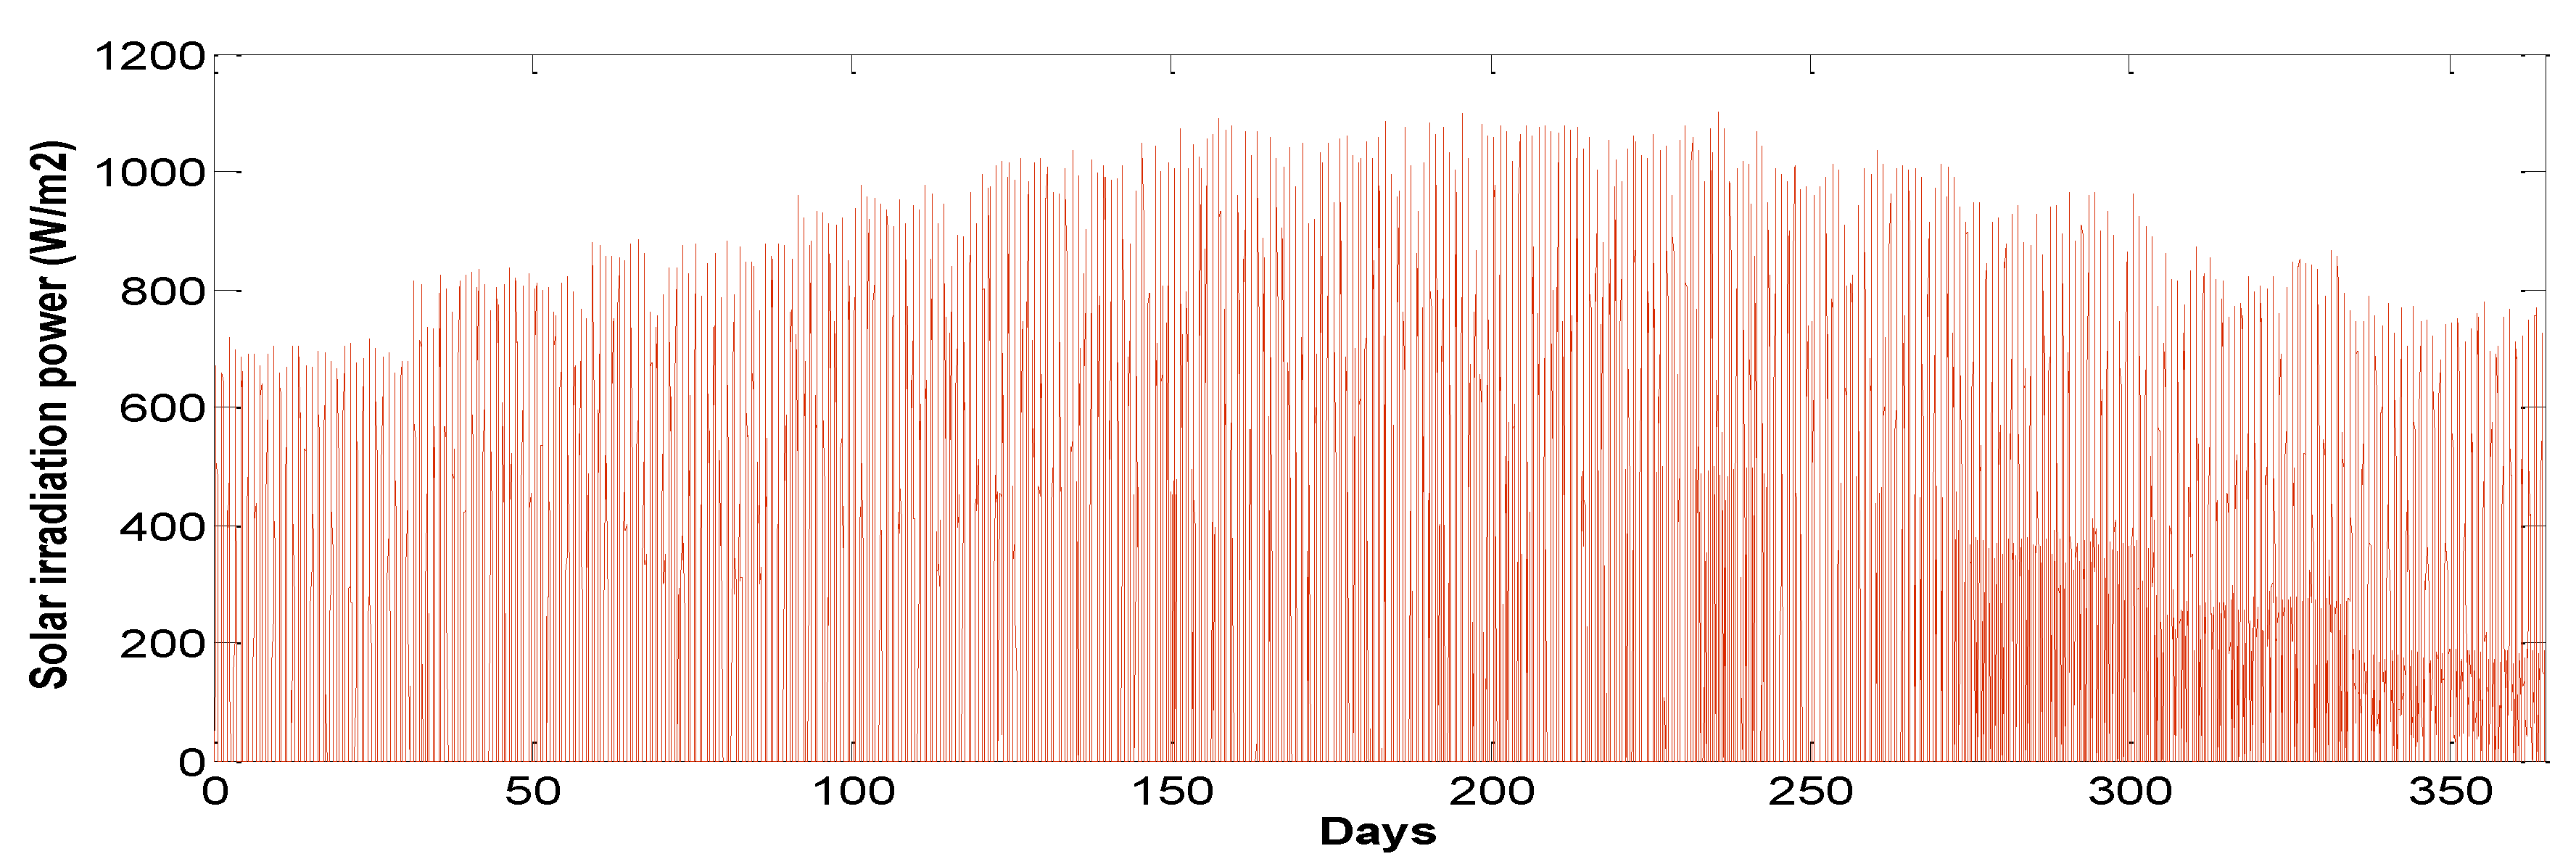
The solar irradiation profile is generated in a deterministic manner from the data, and measurements are done by the National Institute of Meteorology, using high-precision instruments to estimate solar irradiation.
Figure 5 represents the power of solar irradiation given every half hour for (sampling time Ts) a typical site in Tunisia over a whole year.
3.2. Wind Turbine Modeling
In our study, we used an active wind turbine(Air X 400 W) operating at optimal powers through a MPPT rectifier(maximum power points tracker rectifier). This convertor is modeled using an efficiency equal to 95%. The energetic model used in the optimization problem is defined by the electrical power Pwt, which represents the following:
where
R is the blade radius is the air density, and
Cp is the power coefficient from manufacturer data corresponding to the considered turbine.
The average value of this power generated by the wind speed over a period of one year, with a sampling interval of half an hour, is equal to 283.3 W, as shown in
Figure 6.
3.3. PV Module Modeling
In the literature, many models of PV modules have been developed [
37]. The famous form is double diode mode, but the existence of a double exponential and six parameters to makes it very complex. In contrast, using a model based on a single diode of the PV generator makes it simple, especially in the case of optimization problems. In our study, we implement the single diode model, or the four-parameter models for simplicity. Then, we will use the model of a PV cell to assimilate it into a module under different lighting and temperature conditions based on the parameters provided by the manufacturers’ data sheets.
3.3.1. Environmental Factors That Affect the Performance of PV
Different factors can include pressure, temperature, and many more, but the most critical factors that affect the performance of PV are:
- -
Solar radiation intensity and spectrum (since the last depends on air mass), effectively received by the module (in W/m²), which is an environmental factor. This effectively received solar radiation can be limited by dust, snow, or any other natural or artificial shadowing;
- -
Ambient temperature;
- -
Rainfall;
- -
Accumulation of dust on the surface of the solar panel [
38,
39].
3.3.2. Single Diode Model of the PV Generator
It should be noted that this four-parameter model is only valid for mono polycrystalline PV cells. The PV module considered in our study’’ Sun module SW 250 mono’’ is deduced from the manufacturer’s data.
Table 1 summarizes the different characteristics of this PV panel.
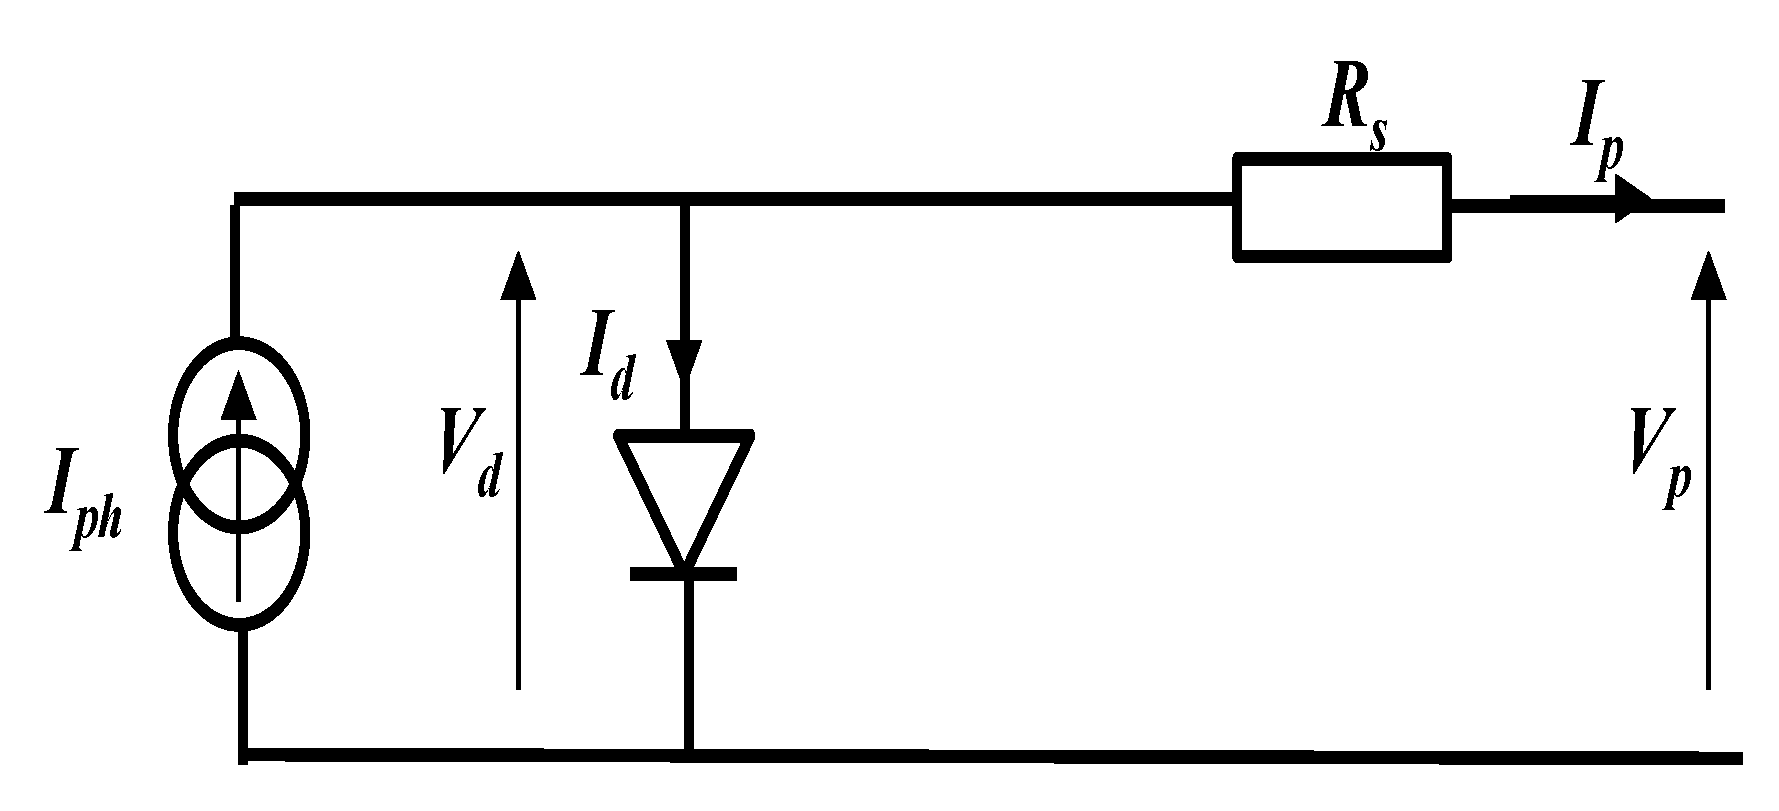
The four-parameter model is a model that considers the PV module as an irradiance-dependent current source, connected in parallel with a diode and in series with a series resistor as shown in
Figure 7.
The current source generated a current
Iph proportional to the solar irradiation. The current
Iph supplied by the PV cell is expressed by the following equation:
The diode current
Id has a given exponential classical form expressed by:
where
is the thermodynamic potential (or thermal voltage),
Tc is the cell temperature,
IS is the reverse saturation current of the diode,
k is the Boltzmann constant (
k = 1.38.10 – 23 J/K),
q is the charge of the electron (1.6 × 10
−19 C, and n is the ideality factor of the junction (
n = 1 for an ideal diode and it is between 1 and 2 depending on the technology). Neglecting the effect of parallel resistance (Rsh), the PV cell current can then be written as:
With
where
Eg is the band energy (1.12 eV for Si),
Tref is the temperature under reference conditions, and
Tc is the cell temperature in Kelvin (K).
The photo-current is linked to the illumination
E, to the temperature
Tc and to the photo-current measured under reference conditions by:
where
E is the illumination in W/m
2,
Iphref is the photo-current under the reference conditions (to simplify the calculation of
Iph, we often make the approximation that the current
Iphref is equal to the short-circuit current ISC, ref of the module), and
CTIsc is the coefficient of the temperature of the short-circuit current (A/K).
The module temperature
Tc varies according to the ambient temperature
Tamb and the illumination according to the following relationship [
34,
35].
By dividing this equation by
dIp, we will have:
Through the fine modeling of the photovoltaic cell, we determine the four parameters of the electrical circuit.
The validation of the fine modeling is illustrated by the following figures.
Figure 8 shows the variations of power and current as a function of voltage for different levels of solar irradiation at a temperature kept constant (T = 25 °C), for the PV panel with maximum power Pppm = 250 W measured under standard test conditions (Est = 1000 W/m
2, Tst = 25 °C). We note that when the sunshine increases, the intensity of the current increases, with the increasing allowing the module to produce a greater electrical power.
Figure 9 shows the effect of temperature change at constant solar irradiation G = 1000 W/m
2, for the same PV panel. The evolution of the I (V) characteristic as a function of temperature shows that the current increases very rapidly when the temperature rises, with the same occurring for the P (V) characteristic, as the voltage increases when the temperature rises.
3.4. Energetic PV Modules
Previously, we detailed how the fine modeling precisely predicts the behavior of PV panels. However, this modeling is very expensive in terms of time of the digital processor calculation when an optimization process is carried out. In our study, reducing the cost of time is a priority. For that reason, the use of an energy modeling that takes into account that the maximum power regions depending on solar irradiation and temperature is inevitable. In our work, we assume that the PV system is equipped a MPPT device to extract the maximum power.
Therefore, we can model the PV generation of a PV panel by the following simplified model:
where S
PV is the PV panel surface in m
2 and η
PV is the PV panel and PV conversion system (choppers with MPPT) efficiency, which is equal to 10% in this study.
Figure 10 represents the power of PV panels given every half hour for (sampling time Ts) a typical site in Tunisia over a whole year.
3.5. Hydraulic Storage Model
In the literature, the two most important variables for sizing the pumping system are the elevated head of the tank and the sea (Hm), and the volume of the water reservoir (V). We consider these variables in the optimization sizing of our system.
In hydraulic storage, we have two phases. The first phase is in the case of excess power of the generator source. This phase is a pumping phase. It can be modulated by:
where the useful power is P
IM, delivered on the output shaft of the engine as the electromagnetic power efficiency η
IM, which is taken as 95%: and the efficiency of the pump ηp, which is considered equal to 80%.
The second phase is when we have a lack of energy at the load demand. The discharge of the tank operates the turbine to meet the needs of the load. They can be modulated by:
3.6. Battery Model
Our choice was to use lead batteries, given their relatively low cost compared to other technologies. Our modeling is based on a Yuasa NP 38-12I (38A.h 12 V) reference battery. One of the important parameters for the continuation of the study is the value of the capacity for a discharge of 3 h: C3 = 30.3 A.h, as well as the coefficient of Peukert, in which one deduces from the various measurements of the discharge: n = 1.28.
The battery is built by assembling elementary cells, in series and/or in parallel. The equivalent diagram of the battery, shown in the figure below, is then deduced from the assembly of the elementary cells using Thévenin’s theorem. The current in a cell, used to calculate the state of charge, depends on the type of association made, and is expressed by:
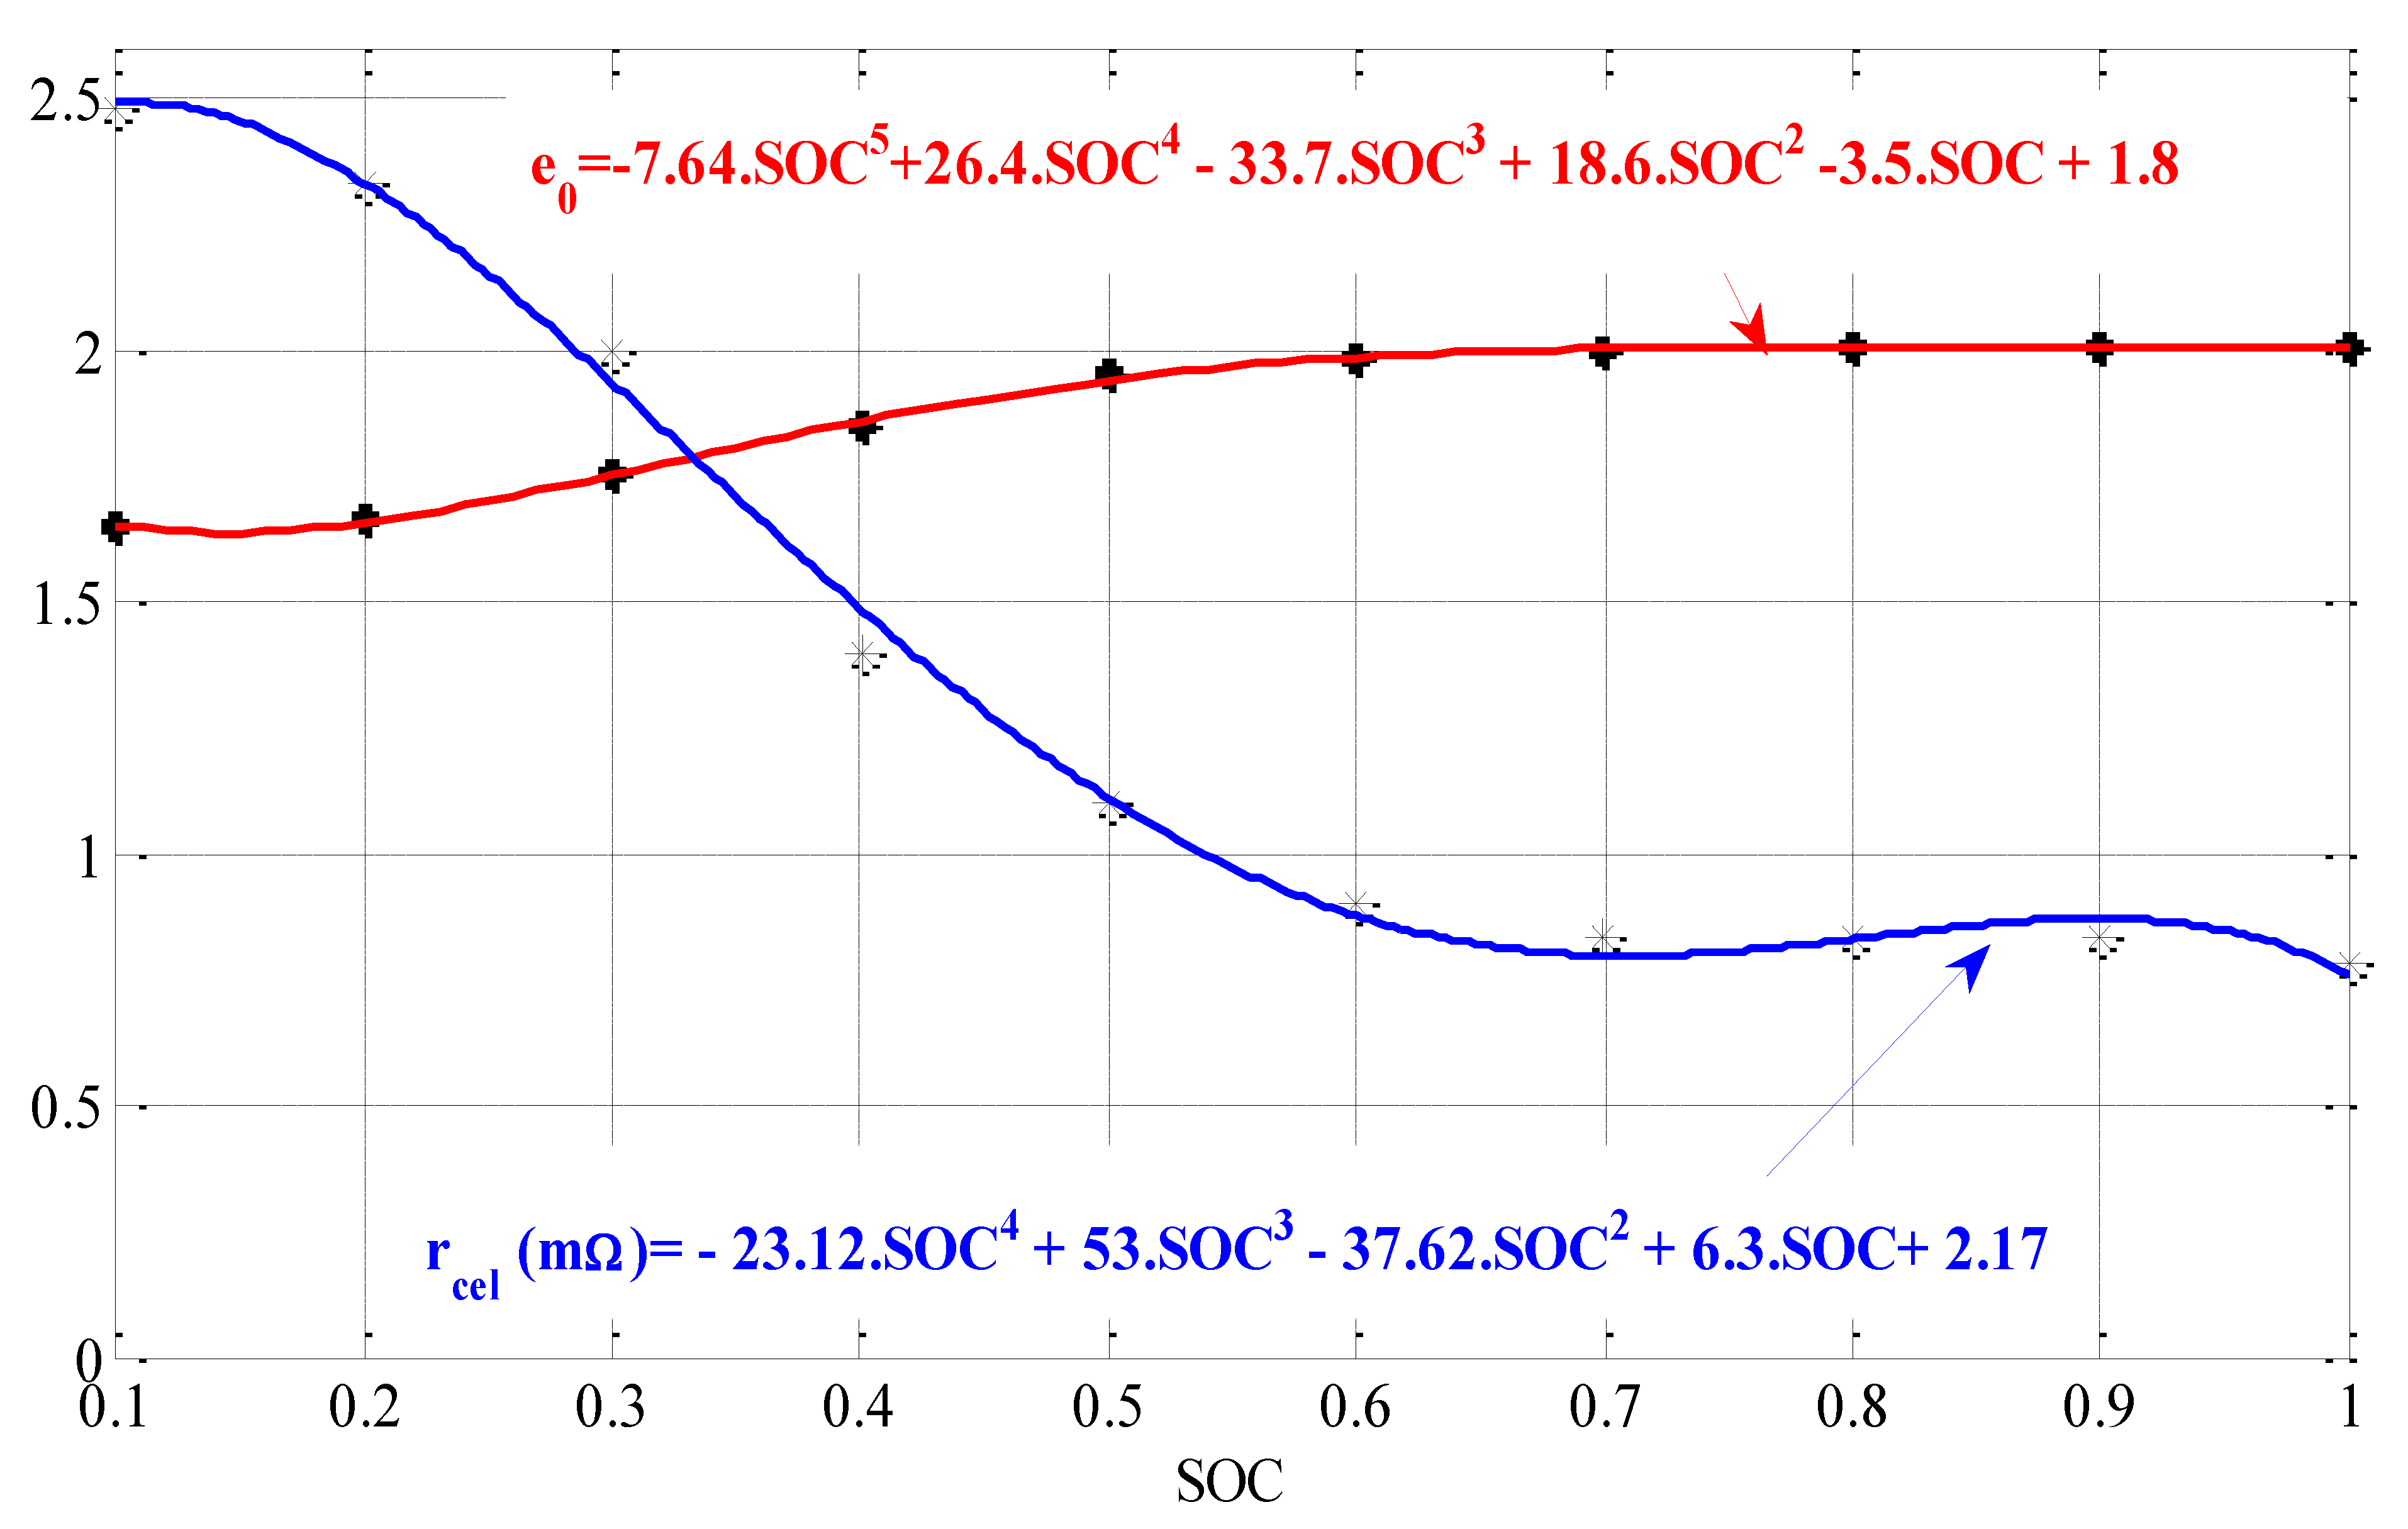
The parameters e0 and rcel are the functions of the level of energy available in the battery, of the current delivered, and of the temperature of the accumulator.
In its electrical model
Figure 11, the resistance r
cel and the voltage e
0 both vary depending on the state of charge SOC of the battery.
Figure 12 shows the evolution of r
cel and e
0 depending on the state of charge of a cell.
Factors Influencing the Aging of the Battery
The main factors influencing the aging of a battery are:
- -
The number of cycles (charge/discharge);
- -
Temperature, one of the most influencing factors on battery life. Usage at high temperature will accelerate aging due to an increased parasitic reaction. Many studies show that the aging of a battery is divided by 2 to 3 between a usage at 25 °C and the same usage at 45 °C [
40].
We suppose in our work that the influence of thermal and aging is not considered in this model for reasons of simplification.
The expression of the voltage DC is:
where
, where
Iconso designates the consumption current.
Knowledge of the state of charge of a cell SOC is a determining element in relation to the behavior of the complete system. One must be able to evaluate it to check if the conversion chain can carry out its mission.
A cell is, from an energy point of view, characterized by its capacity C
cel. This is the quantity of electricity, indicated in A.h, that it is able to restore after a full charge, and when discharged with a current kept constant. This capacity varies according to several factors such as the intensity of the discharge, the temperature, and the concentration of the electrolyte. Thus, the maximum quantity of electricity available, under a discharge current
I, is lower than the theoretical capacity of the accumulator, defined for a discharge at infinitesimal current. The quantity of electricity accessible for a discharge in
i hours at constant current
Ii is deduced from the maximum capacity by the empirical relationship of Peukert, which is written as:
For a discharge at constant current
Icel, we express the state of charge
SOC of an elementary cell of the accumulator as follows:
For our application, the current is constantly variable over time. We then discredited the previous equation by considering the constant current between two calculation steps. We can thus determine the expression of the variation of the state of charge Δ
SOCk of the cell at time
k.Δ
t:
This approach also makes it possible to take into account the battery recharging phases. Indeed, if the current in the cell becomes negative, its state of charge increases. In the end, the state of charge of the cell is expressed by:
For optimal operation, management of the state of charge of the battery is considered for limit values of the state of charge of the battery such as SOC
batmin ≥ 20% and SOC
batmax ≤ 95% [
41,
42,
43].
4. Formulation of the Optimization Problem
Optimization consists in finding the minimum of an optimization criterion (an objective function to find according to a vector
, representing the input variables of the optimal solution of
f [
44,
45,
46,
47].
4.1. Input Variables
The five input variables associated with the system sizing model are chosen as parameters to be optimized. These variables are given by the following
Table 2, where their range of variation is also specified.
4.2. Design Constraints
To ensure the efficiency of the system, when the design parameters
x vary over the whole exploration domain, it is necessary to introduce some constraints
gi, which can generally be translated into inequalities of the form:
where
x denotes the vector associated with the input variables.
In our study, the chosen constraints are related to the state of charge of the battery (SOCbat) and the tank (SOCres).
For the reservoir, it is crucial to ensure that SOC
res does not reach the tolerable limit value, which is equal to SOC
resmax = 1 (full tank) and does not fall below to SOC
resmin = 0, so that the pump does not work in a vacuum and avoids related problems:
In addition, it necessary to make sure that the battery does not operate in deep discharge and stays in safe state-of-charge zones.
4.3. Optimization Criteria
The criteria to be optimized can have constraints on their variables through inequalities and vector functions g and h. mathematically, the optimization problem can be formulated as follows:
In our study, the optimization problem has two contradictory objectives; the first objective is to minimize the satisfaction of the electrical load demand, known as LPSP (loss of power supply probability). The second objective is to minimize the cost of the Cost
sys system over a life cycle of 25 years. Thus, we have a bi-objective optimization problem [
48].
4.4. System Cost Modeling
In our study, we estimate the cost of energy (cost per Khw) produced by our system through the costs of PV panels, wind turbines, converters, installation, maintenance, and replacement of components over a cycle of life (Tcycle) equal to 25 years. Cost modeling is done through an energy model that relates the cost of each element to its average power.
For the battery cost and for an operating time Tcycle of 25 years and a tank cycle time T of 356 days, the approximate cost of the battery pack over 25 years is expressed by the following relationship:
where
C0 is the cost of a battery cycle estimated at EUR0.1 (additional batteries). A YUASA 12V battery costs Cbat = EUR108.A 2 V cell costs Célé = 108 EUR/6. We have 180 deep cycles. One deep cycle on a cell costs Célé/180 = EUR 0.1. For the turbine system, the cost is estimated at EUR 50/kW (Cost
tur). For the pumping system, the cost is estimated at 240EUR/kW(Cost
pump). The cost, combining the PV panels, converters, cables, sensors, and control circuits, is estimated at EUR 2000/kW(Cost
PV). For the cost of the wind turbine, the approximate cost model is given by the following equation [
8,
9,
10,
11]:
where P
wt is the average power of a wind turbine.
Finally, the cost model of the Cost
sys system can be expressed as follows:
4.5. Satisfying the Electrical Load LPSP (Loss of Power Supply Probability) Criteria
LPSP is the sum of the energy deficits supplied to the load (Loss of Power Supply LPS), encountered during a period
T (
T = 1 year) and reduced to the annual energy supplied to the annual load (
ELoad) [
49].
LPS represents the difference between the energy demanded by the load
Eload and the available energy supplied by the generation system and the storage system (
, where
EPV is the available photovoltaic energy,
EWT is the available wind energy,
EBat is the useful energy stored and available in the batteries, and
Etank is the useful energy stored in the reservoir, described by the relationship below:
4.6. Optimization Process
Dimension optimization has become a standard approach for the design systems [
50,
51,
52].
In our study we seek to adapt the five design parameters Npv, Nwt, Nbat, Hm, and V through technical and economic criteria to satisfy the need of the load demand at any time. We used the NSGAII algorithm to adapt these parameters. In several works, NSGAII has shown its efficiency in solving the multi-objective optimization problem. This is why we chose it. The optimization process integrating the NSGA-II algorithm as well as the simulation model of the system is illustrated by the synoptic of the following
Figure 13.
The discrete variables NPV, NWT, Nbat, Hm, and V are decoded using the integer function. The typical values of the NSGAII regulation parameters used for the system optimization considered are summarized in
Table 3.
The evolution of the population as the genetic algorithm is executed is presented in
Figure 14, according to the different steps of the NSGA-II algorithm described below.
An initial population of Nind individuals is first randomly created, in order to be used for the 1st generation; each generation evaluates the performances of the 2Nind individuals: the parent Nind from the previous generation, to which Nind children resulting from the application of genetic operators are added. These operators bring a diversification of the individuals at each generation, in order to explore the space of the solutions. Two types of genetic operators (also called evolution operators) are applied to the best performing individuals of the parent population (selection phase).The first genetic operator is crossover. Here the chromosomes of two individuals (two parents) are exchanged so as to create two new individuals (two children), i.e., two new sizes. The second genetic operator is mutation. Here, one of the chromosomes of an individual is modified, resulting in a new dimension. A selection of Nind individuals is then made among the 2Nind individuals according to the Pareto dominance: the dominant individuals are kept (the elitist approach).The population is then completed if necessary with the best remaining individuals in order to obtain a new population of Nind individuals used in the next generation. Thus, the best individuals are never lost from one generation to another [
53].
To verify the reproducibility of the results obtained, we carried out three executions of the algorithm with MATLAB R2013a.The numbers of individuals and generations considered result in a computing time of approximately 6 h on an Intel Core i7 processor.
5. Results and Discussion
In this part, we present the optimization design process. Our objective is to extract the optimal sizing choice of the system.
Figure 15 presents the pareto front of the two optimization criteria of our problem (cost-LPSP).This front is obtained after three executions. The zone of good compromise circled by blue dots on the optimal front presents the best solutions of our study. By moving outside to this zone, the solutions become insignificant given the dominance of one criterion over another.
The path of the input variables along the optimal front according to the two criteria is illustrated in
Figure 16. These results explain how trends of increasing values of input variables are in the direction of inflating the cost of the system. On the other hand, these tendencies are reversed if the increase becomes the direction of LPSP aggravation.
To decide on an optimal configuration among this panoply of solutions on the optimal front, it is fundamental to analyze the characteristics of at least three different configurations (Optimum1, Optimum2, and Optimum3) extracted from the optimal front, positioned in the zone of good compromise mentioned above, and whose positions have been articulated in
Figure 17.
The characteristics of these configurations are summarized in
Table 4.
The cost of the system presents remarkable differences. Between the first configuration and the second there is a gain about EUR 2000 in terms of system cost, while the LPSP is 40% for the first configuration encountered, and 20% for the second. When we compare the second configuration and the third, there is a notable difference in the cost of the system of about EUR 4000, but the LPSP is 15%. The state of the charge of the battery is represented in
Figure 18.If we compare the first configuration and the second one, we note that for the second configuration the battery does not undergo a deep discharge throughout the year SOCbat > 80%, while for the first configuration it decreases up to 30%.As a final point, these interpretations will then be a good marker to choose the correct and the performed configuration of our site.
The results of the simulation for the preferred configuration (Optimum 2) are presented below. We choose two typical days: one in summer and the other in winter.
The objective of this illustration is to demonstrate the complementarity between the different elements of our system to satisfy the load demand at all times.
Figure 19 represents respectively the powers evolution for two typical days: one in summer and the other in winter. In summer, the power delivered by the photovoltaic panels Ppv is important; it reaches 1100 w, which exceeds the need for our site. The surplus of energy therefore goes in the direction of charging the batteries and pumping water into the reservoirs. In winter, Ppv does not exceed 6000 w, which causes the discharging of the turbines and battery t and ensuring the continuity of supply to our site.
In the nocturnal days and when the wind is strong, it is very clear that the supply of the load is assured by the wind turbine and the discharge of the storage system.
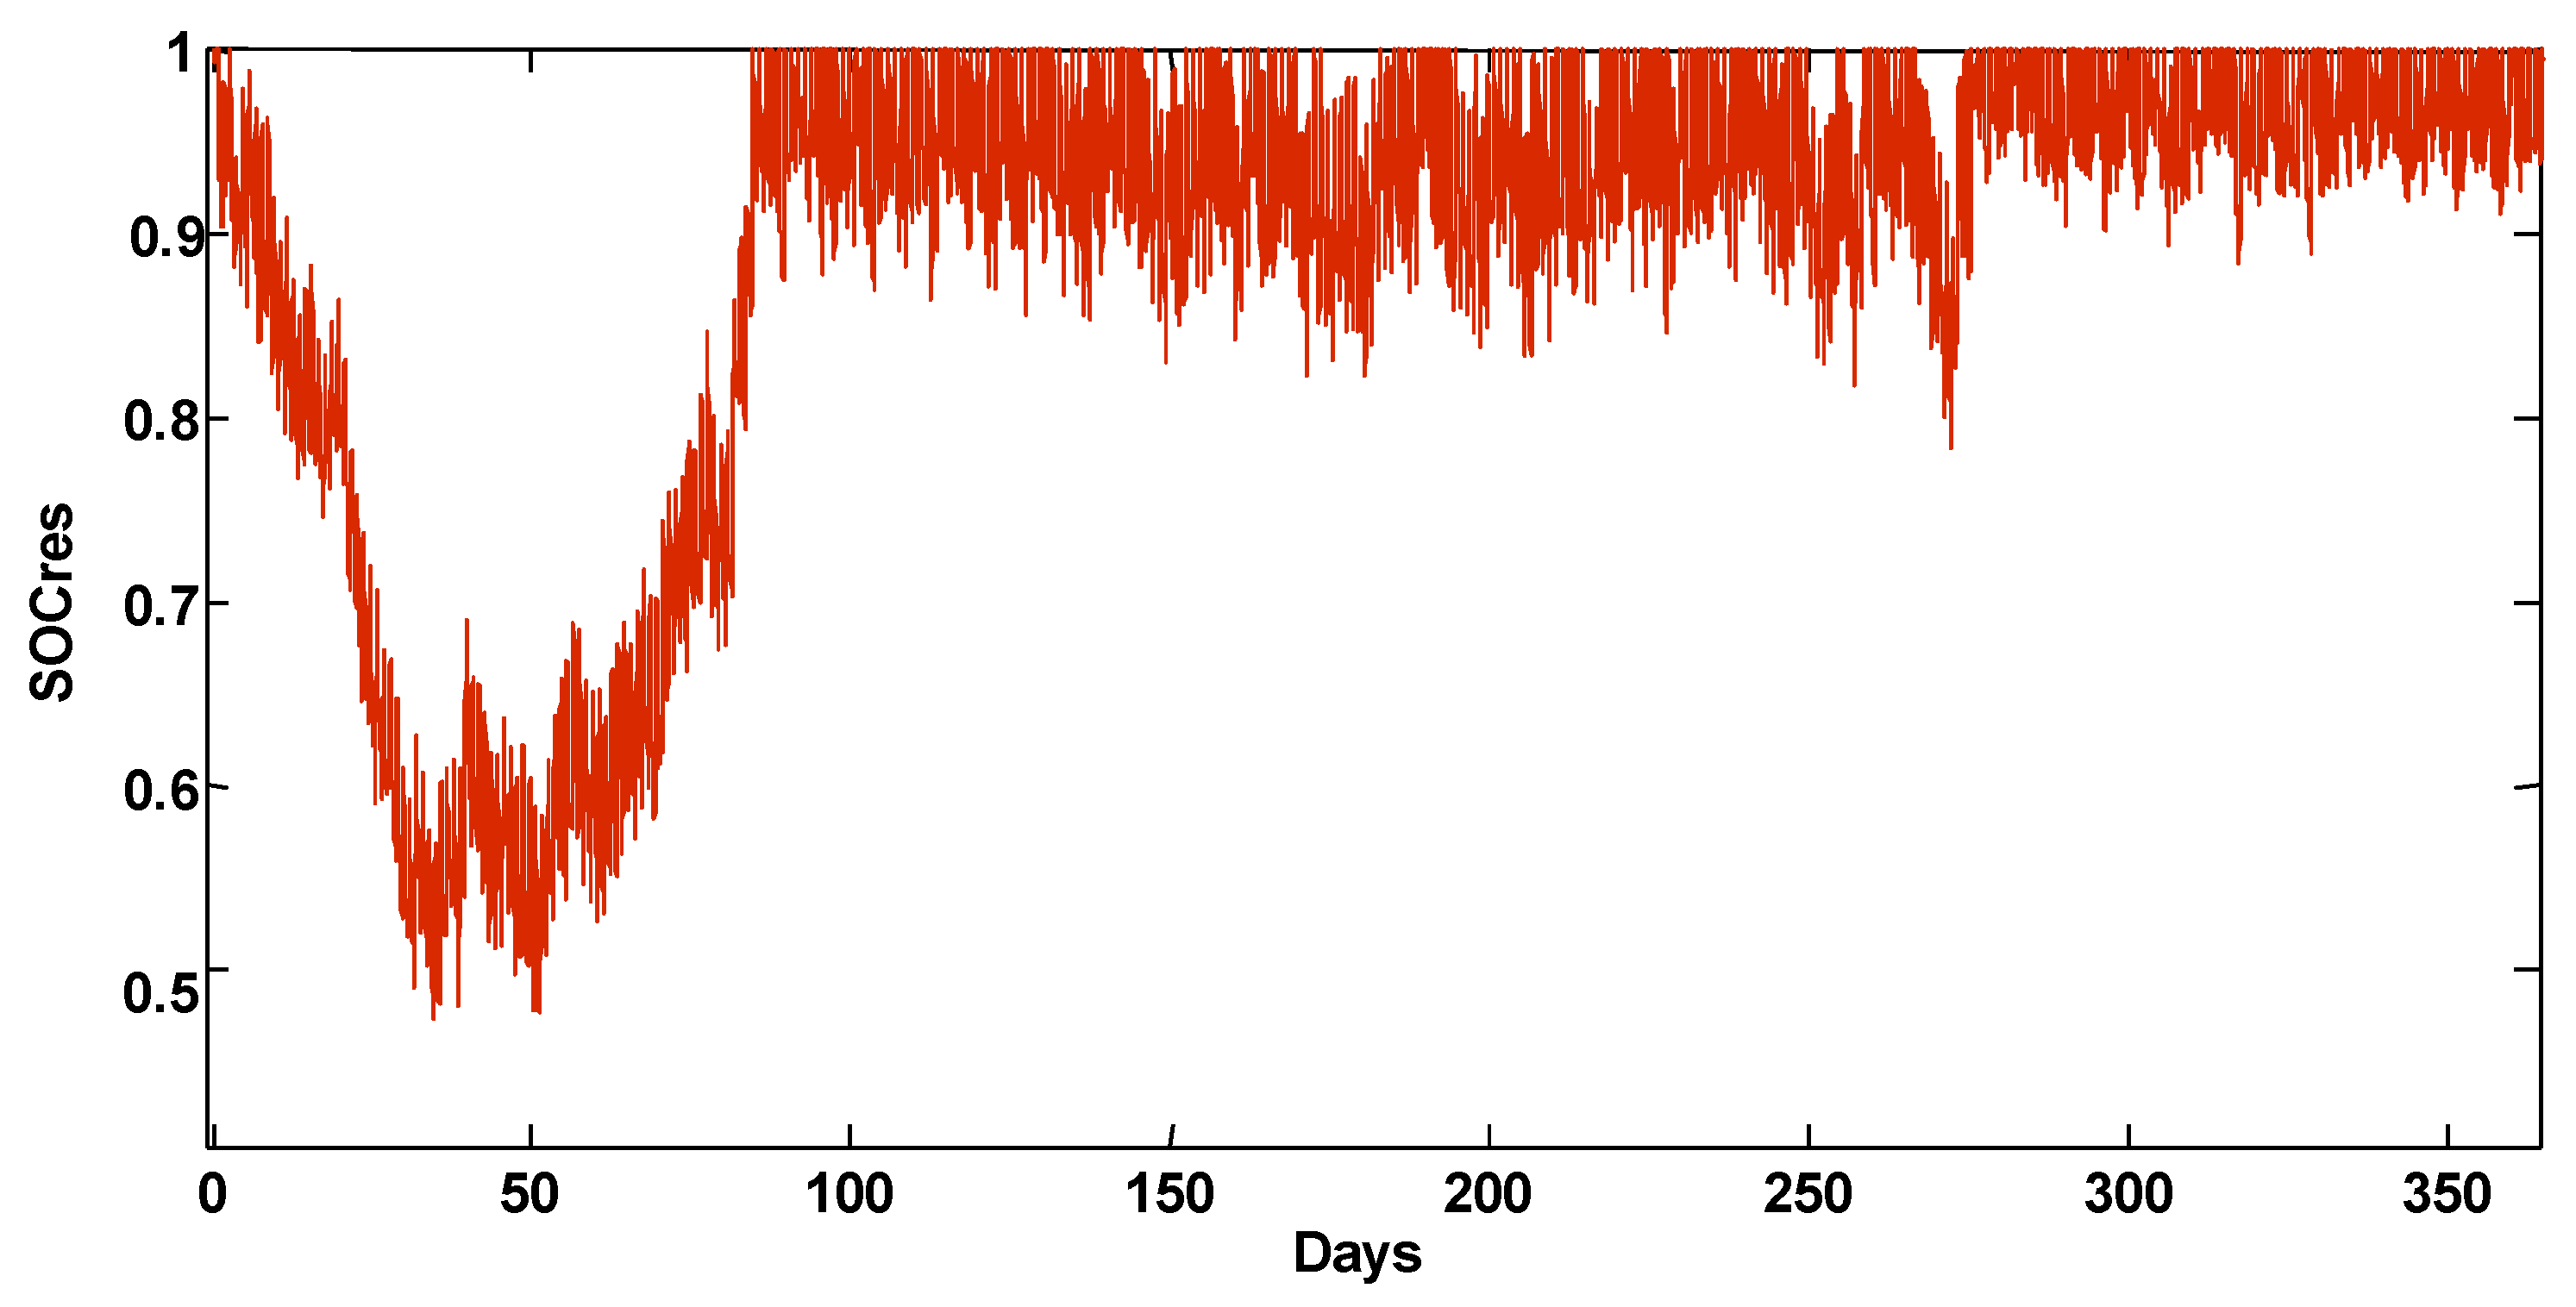
Finally, the state of the charge of the tank is illustrated in
Figure 20. We notice that the reservoir is charged and discharged with a SOC varying between 100% and 50%.Thisrespects the optimization constraints that we have set.
6. Conclusions
This paper studies a hybrid wind–photovoltaic system associated with an electrochemical and hydraulic storage system. The objective of this system is to produce electricity to satisfy the demand of a consumer on a remote island in Tunisia at any time. From there, we presented the components of the studied system and their principles of operation. Then we gave their mathematical models. For the photovoltaic production chain, we presented two types of modeling of the PV panels: a fine modeling that faithfully reproduces the behaviors of these panels and a simplified energy modeling that will be integrated in the optimization process. Concerning the wind generation chain, we created a wind profile using the probability function of the wind speed (the Weibull distribution) for every half hour for one year. Then, we modeled the wind power under different wind speeds. For the electrochemical and hydraulic storage system, based on the electrical model and its equations, we determined the different parameters that characterize the battery and the reservoir and that allow us to determine the power and the states of charge of the battery (SOCbat) and reservoir (SOCres).
The bi-objective optimization methodology (LPSP-Cost), using an evolutionary algorithm NSGAII, was used to size the optimal system size, i.e., to find the (NPV, NWT, Nbat, V, and Hm), which satisfies the consumer demand and minimizes the cost of the system, while ensuring an honorable lifetime for the batteries. Results from multi-objective optimization using the NSGAII genetic algorithm were presented and discussed. We select three optimal configurations to analyze. The results show the effectiveness and robustness of our synthesis approach to ensure the continued electrification of the remote island.
To finish, several perspectives can be considered in order to complete the experimental validation, such as the use of weather forecasts based on intelligent algorithms. In addition to wind and photovoltaic, the use of an energy source (such as the fuel cell) is very interesting to make the system more efficient during the worst periods of the year.
Author Contributions
Conceptualization, D.M. and C.C.; Formal analysis, M.H.; Investigation, M.H.; Methodology, A.M.; Supervision, C.C. and D.M.; Writing—original draft, M.H. All authors have read and agreed to the published version of the manuscript.
Funding
This research received no external funding.
Acknowledgments
This work was supported by the Tunisian Ministry of High Education, Research and Technology. I would like to express my deep gratitude to Malek Belouda for his help in doing the data analysis.
Conflicts of Interest
The authors declare no conflict of interest.
Nomenclature
| Pload | Load power (w) |
| PPV | Photovoltaic power (w) |
| PWT | Electrical wind turbine output powe(W) |
| Hm | Head height (m) |
| Ρ | Water density (1000 kg/m3) |
| Q | Electron charge (C) |
| Rcel | Internal resistance of a cell(Ω) |
| Ppump | Pumping power (W) |
| Ptur | Turbine power (W) |
| Q | Electron charge (C) |
| Q | Water volumetric flow (m3/s) |
| Ccel | Cell capacity (A.h) |
| Cp | Power coefficient |
| Eg | Band gap energy (ev) |
| G | Real solar irradiation (W/m2) |
| Ibat | Battery current (A) |
| Icel | Cell current (A) |
| Id | Diode current (A) |
| Iph | Photo-current (A) |
| Is | Diode saturation current (A) |
| K | Boltzmann’s constant (J/K) |
| N | Diode ideality factor |
| Np | Number of PV modules in parallel |
| Ns | Number of PV cells in series |
| Pbat | Battery power (w) |
| Rs | Series resistance (Ω) |
| Rsh | Parallel resistance (Ω) |
| SOC | State of charge of the reservoir |
| SPV | PV panel surface (m2) |
| Tc | Cell temperature (K) |
| Ts | Sampling time (hours) |
| V | Wind speed (m/s) |
| Vcel | Voltage at cell terminals (V) |
| VT | Thermodynamic potential (V) |
| U | Voltage of cell (V) |
| ηinv | Inverter efficiency |
| ηPV | PV system efficiency |
References
- Kuang, Y.; Zhang, Y.; Zhou, B.; Li, C.; Cao, Y.; Li, L.; Zeng, L. A Review of Renewable Energy Utilization in Islands Renewable and Sustainable Energy Reviews; Elsevier: Amsterdam, The Netherlands, 2016; Volume 59, pp. 504–513. [Google Scholar]
- Gioutsos, D.M.; Blok, K.; van Velzen, L.; Moorman, S. Cost-optimal electricity systems with increasing renewable energy penetration for islands across the globe. Appl. Energy 2018, 226, 437–449. [Google Scholar] [CrossRef]
- John, K. Kaldellis the Clean Electrification for Remote Islands: The Case of the Greek Tilos Island. Energies 2021, 14, 1336. [Google Scholar]
- International Energy Agency, World Energy Outlook. 2021. Available online: https://www.iea.org/reports/world-energy-outlook-2021 (accessed on 22 June 2022).
- National Institute of Meteorology- Tunisia. Available online: www.meteo.tn (accessed on 22 June 2022).
- Tao, M.; Hongxing, Y.; Lin, L. Study on standalone power supply options for an isolated community. Electr. Power Energy Syst. 2015, 65, 1–11. [Google Scholar]
- Ma, T.; Yang, H.; Lu, L. A feasibility study of a stand-alone hybrid solar–wind–battery system for a remote Island. In Proceedings of the 12th International Conference on Sustainable Energy Technologies (SET2013), Hong Kong, China, 26–29 August 2013. [Google Scholar]
- Belouda, M.; Jaafar, A.; Sareni, B.; Roboam, X.; Belhadj, J. Design methodologies for sizing a battery bank devoted to a stand-alone and electronically passive wind turbine system. Renew. Sustain. Energy Rev. 2016, 60, 144–154. [Google Scholar] [CrossRef]
- Belouda, M.; Jaafar, A.; Sareni, B.; Roboam, X.; Belhadj, J. Integrated optimal design and sensitivity analysis of a standalone wind turbine system with storage for rural electrification. Renew. Sustain. Energy Rev. 2013, 28, 616–624. [Google Scholar] [CrossRef]
- Bernard-Agustín, J.L.; Dufo-Lopez, R.; Rivas-Ascaso, D.M. Design of isolated hybrid systems minimizing costs and pollutant emissions. Renew. Energy 2006, 31, 2227–2244. [Google Scholar] [CrossRef]
- Senjyu, T.; Hayashi, D.; Yona, A.; Urasaki, N.; Funabashi, T. Optimal configuration of power generating systems in isolated island with renewable energy. Renew. Energy 2007, 32, 1917–1933. [Google Scholar] [CrossRef]
- Belfkira, R.; Nichita, C.; Reghem, P.; Barakat, G. Modeling and optimal sizing of hybrid energy system. In Proceedings of the International Power Electronics and Motion Control Conference (EPE-PEMC), Poznan, Poland, 1–3 September 2008. [Google Scholar]
- Minayégnan, T.; Oladapo, O.; Sako, K.; Marvillet, C.; Marvillet, C. Analysis of the Technico-Economic Viability of an Electric Micro-Grid with Renewable Electricity Production Sources in Elokato-Bingerville, Cote d’Ivoire. Smart Grid Renew. Energy 2021, 12, 183–202. [Google Scholar] [CrossRef]
- Kharrich, M.; Kamel, S.; Alghamdi, A.S.; Eid, A.; Mosaad, M.I.; Akherraz, M.; Abdel-Akher, M. Optimal Design of an Isolated Hybrid Micro grid for Enhanced Deployment of Renewable Energy Sources in Saudi Arabia. Sustainability 2021, 13, 4708. [Google Scholar] [CrossRef]
- Jurasz, J.; Mikulik, J. Economic and environmental analysis of a hybrid solar, wind and pumped storage hydro electric energy source: A Polish perspective. Bull. Pol. Acad. Sci. Tech. Sci. 2017, 65, 859–869. [Google Scholar]
- Jurasz, J.; Mikulik, J. Integrating photovoltaic sinto energy systems by using a run-off-river power plant with pondage to smoothenergy exchange with the power grid. Appl. Energy 2017, 198, 21–35. [Google Scholar] [CrossRef]
- Khare, V.; Nema, S.; Baredar, P. Solar-wind hybrid renewable energy system: A review. Renew. Sustain. Energy Rev. 2016, 58, 23–33. [Google Scholar] [CrossRef]
- Evans, A.; Strezov, V.; Evans, T.J. Assessment of utility energy storage options for increased renewable energy penetration. Renew. Sustain. Energy Rev. 2012, 16, 4141–4147. [Google Scholar] [CrossRef]
- Díaz-González, F.; Sumper, A.; Gomis-Bellmunt, O.; Villafáfila-Robles, R. A review of energy storage technologies for wind power applications. Renew. Sustain. Energy Rev. 2012, 16, 2154–2171. [Google Scholar] [CrossRef]
- Charabi, Y.; Abdul-Wahab, S. The optimal sizing and performance assessment of a hybrid renewable energy system for a mini-gird in an exclave territory. AIMS Energy 2020, 8, 669–685. [Google Scholar] [CrossRef]
- Tran, Q.T.; Davies, K.; Sepasi, S. Isolation Microgrid Design for Remote Areas with the Integration of Renewable Energy: A Case Study of Con Dao Island in Vietnam. Clean Technol. 2021, 3, 804–820. [Google Scholar] [CrossRef]
- Oladeji, A.S.; Akorede, M.F.; Aliyu, S.; Mohammed, A.A.; Salami, A.W. Simulation-Based Optimization of Hybrid Renewable Energy System for Off-grid Rural Electrification. Int. J. Renew. Energy Dev. 2021, 10, 667–686. [Google Scholar] [CrossRef]
- El-houari, H.; Allouhi, A.; Rehman, S.; Buker, M.S.; Kousksou, T.; Jamil, A.; El Amrani, B. Design, Simulation, and Economic Optimization of an Off-Grid Photovoltaic System for Rural Electrification. Energies 2019, 12, 4735. [Google Scholar] [CrossRef]
- Diab, A.A.Z.; Sultan, H.M.; Kuznetsov, O.N. Optimal sizing of hybrid solar/wind/hydro electric pumped storage energy system in Egypt based on different meta-heuristic techniques. Environ. Sci. Pollut. Res. 2020, 27, 32318–32340. [Google Scholar] [CrossRef]
- Ashagire, A.A.; Adjallah, K.H.; Bekele, G. Optimal sizing of Hybrid energy Sources by Using Genetic Algorithm and Particle Swarm Optimization algorithms considering Life Cycle Cost. In Proceedings of the 2021 International Conference on Electrical, Computer, Communications and Mechatronics Engineering (ICECCME), Mauritius, 7–8 October 2021; pp. 1–6. [Google Scholar]
- Aguila-Leon, J.; Vargas-Salgado, C.; Chiñas-Palacios, C.; Díaz-Bello, D. Energy Management Model for a Standalone Hybrid Micro grid through a Particle Swarm Optimization and Artificial Neural Networks Approach. Energy Convers. Manag. 2022, 267, 115920. [Google Scholar] [CrossRef]
- Eltamaly, A.M.; Alotaibi, M.A. Novel Fuzzy-Swarm Optimization for Sizing of Hybrid Energy Systems Applying Smart Grid Concepts. IEEE Access 2021, 9, 93629–93650. [Google Scholar] [CrossRef]
- Tabak, A.; Kayabasi, E.; Guneser, M.T.; Ozkaymak, M. Grey wolf optimization for optimum sizing and controlling of a PV/WT/BM hybridenergy system considering TNPC, LPSP, and LCOE concepts. Energy Sources Part A Recovery Util. Environ. Eff. 2022, 44, 1508–1528. [Google Scholar] [CrossRef]
- Lee, C.K.H. A review of applications of geneticalgorithms in operations management. Eng. Appl. Artif. Intell. 2018, 76, 1–12. [Google Scholar] [CrossRef]
- Deb, K.; Pratap, A.; Agarwal, S.; Meyarivan, T. A fast and elitist multi objective genetic algorithm: NSGA-II. IEEE Trans. Evol. Comput. 2002, 6, 182–197. [Google Scholar] [CrossRef]
- Das, B.K.; Hassan, R.; Tushar, M.S.H.; Zaman, F.; Hasan, M.; Das, P. Techno-economic and environmental assessment of a hybrid renewable energy system using multi-objective genetic algorithm: A case study for remote Island in Bangladesh. Energy Convers. Manag. 2021, 230, 113823. [Google Scholar] [CrossRef]
- Ammari, C.; Belatrache, D.; Touhami, B.; Makhloufi, S. Sizing, optimization, control and energy management of hybrid renewable energy system—A review. Energy Built Environ. 2022, 3, 399–411. [Google Scholar] [CrossRef]
- Yusuf, A.; Bayhan, N.; Tiryaki, H.; Hamawandi, B.; Toprak, M.S.; Ballikaya, S. Multi-objective optimization of concentrated Photovoltaic-Thermo electric hybrid system via non-dominated sorting genetic algorithm (NSGA II). Energy Convers. Manag. 2021, 236, 114065. [Google Scholar] [CrossRef]
- Diab, A.A.Z.; Sultan, H.M.; Mohamed, I.S.; Kuznetsov, O.N.; Do, T.D. Application of Different Optimization Algorithms for Optimal Sizing of PV/Wind/Diesel/Battery Storage Stand-Alone Hybrid Micro grid. IEEE Access 2019, 7, 119223–119245. [Google Scholar] [CrossRef]
- Belouda, M.; Hajjaji, M.; Sliti, H.; Mami, A. Bi-objective optimization of a standalone hybrid PV–Wind–battery system generation in a remote area in Tunisia. Sustain. Energy Grids Netw. 2018, 16, 315–326. [Google Scholar] [CrossRef]
- Belouda, M.; Sliti, H.; Hajjaji, M.; Mami, A. Multi objective optimization of a photovoltaic system generation with hydraulic storage in remote areas. Environ. Prog. Sustain. Energy 2018, 38, 13095. [Google Scholar] [CrossRef]
- Liu, Y.; Yu, S.; Zhu, Y.; Wang, D.; Liu, J. Modeling, planning, application and management of energy systems for isolated areas: A review. Renew. Sustain. Energy Rev. 2018, 82, 460–470. [Google Scholar] [CrossRef]
- Coşgun, A.E. The potential of Agrivoltaic systems in TURKEY. Energy Rep. 2021, 7, 105–111. [Google Scholar] [CrossRef]
- Demir, H.; Coşgun, A.E. Performance Prediction Approach Using Rainfall Based on Artificial Neural Network For Pv Module. 2021. Available online: https://www.researchgate.net/publication/351811591_PERFORMANCE_PREDICTION_APPROACH_USING_RAINFALL_BASED_ON_ARTIFICIAL_NEURAL_NETWORK_FOR_PV_MODULE (accessed on 22 June 2022).
- Pelletier, S.; Jabali, O.; Laporte, G.; Veneroni, M. Battery degradation and behavior for electric vehicles: Review and numerical analyses of several models. Transp. Res. Part B Methodol. 2017, 103, 158–187. [Google Scholar] [CrossRef]
- Banos, R.; Manzano-Agugliaro, F.; Montoya, F.G.; Gil, C.; Alcayde, A.; Gómez, J. Optimization methods applied to renewable and sustainable energy: A review. Renew. Sustain. Energy Rev. 2011, 15, 1753–1766. [Google Scholar] [CrossRef]
- Luna-Rubio, R.; Trejo-Perea, M.; Vargas-Vázquez, D.; Ríos-Moreno, G.J. Optimal sizing of renewable hybrids energy systems: A review of methodologies. Sol. Energy 2012, 86, 1077–1088. [Google Scholar] [CrossRef]
- Gupta, R.A.; Kumar, R.; Bansal, A.K. BBO-based small autonomous hybrid power system optimization incorporating wind speed and solar radiation forecasting. Renew. Sustain. Energy Rev. 2015, 41, 1366–1375. [Google Scholar] [CrossRef]
- Ma, T.; Yang, H.; Lu, L.; Peng, J. Optimal design of an autonomous solar-wind pumped storage power supply system. Appl. Energy 2015, 160, 728–736. [Google Scholar]
- Jahromi, M.A.Y.; Farahat, S.; Barakati, S.M. Optimal size and cost analysis of stand–alone hybrid wind/photovoltaic power–generation systems. Civil Eng. Env. Syst. 2014, 31, 283–303. [Google Scholar] [CrossRef]
- Layadi, T.M.; Champenois, G.; Mostefai, M. Modeling and design optimization of an autonomous multi source system under a permanent power-supply constraint. IEEE Trans. Sustain. Energy 2015, 6, 872–880. [Google Scholar] [CrossRef]
- Yeh, T.H.; Wang, L. A study on generator capacity for wind turbines under various stowed heights and rated wind speeds usingweibull distribution. IEEE Trans. Energy Conv. 2008, 23, 592–602. [Google Scholar]
- Ma, T.; Yang, H.; Lu, L. A feasibility study of a stand-alone hybrid solar–wind–battery system for a remote island. Appl. Energy 2014, 121, 149–158. [Google Scholar] [CrossRef]
- Mohammed, O.H. On Optimal Sizing and Energy Management of Hybrid Power Generation Systems Based on Renewables. Ph. D. Thesis, Université de Bretagne Occidentale, Brest, France, 2016. [Google Scholar]
- Thiaux, Y. Optimisation des Profils de Consommation Pour Minimiser Les Coûts Économique et Énergétique sur Cycle de vie des Systèmes Photovoltaïques Autonomes et Hybrides—Evaluation de la Technologie Li-ion. Ph. D. Thesis, École Normale Supérieure de Cachan—ENS Cachan, 2010. Available online: https://tel.archives-ouvertes.fr/tel-00502428/document (accessed on 22 June 2022).
- Bouabdallah, A. Méthodologie de Dimensionnement et D’optimisation de Systèmes Multi-Sources à Énergies Renouvelables Pour L’habitat. Ph.D. Thesis, Université de Nantes, Nantes, France, 2014. [Google Scholar]
- Sareni, B.; Regnier, J.; Roboam, X. Recombination and self-adaptation in multi objective genetic algorithms. In Proceedings of the 6th International Conference on Artificial Evolution, Marseille, France, 27–30 October 2003. [Google Scholar]
- Downing, S.D.; Socie, D.F. Simple rain flow counting algorithms. Intl. J. Fatigue 1982, 4, 31–40. [Google Scholar] [CrossRef]
Figure 1.
System architecture to optimize.
Figure 1.
System architecture to optimize.
Figure 2.
Flowchart of the hybrid PV/wind hydraulic/battery multi storage system operation.
Figure 2.
Flowchart of the hybrid PV/wind hydraulic/battery multi storage system operation.
Figure 3.
Wind speed profile during a year.
Figure 3.
Wind speed profile during a year.
Figure 4.
Consumption profile for atypical day.
Figure 4.
Consumption profile for atypical day.
Figure 5.
Solar irradiation during a year.
Figure 5.
Solar irradiation during a year.
Figure 6.
Power of wind turbines (w).
Figure 6.
Power of wind turbines (w).
Figure 7.
Single-diode electrical model (four parameters) of a PV cell.
Figure 7.
Single-diode electrical model (four parameters) of a PV cell.
Figure 8.
Electrical characteristics of the Sun module SW 250 mono panel for different solar irradiations.
Figure 8.
Electrical characteristics of the Sun module SW 250 mono panel for different solar irradiations.
Figure 9.
Electrical characteristics of the Sun module SW 250 mono panel for different temperatures.
Figure 9.
Electrical characteristics of the Sun module SW 250 mono panel for different temperatures.
Figure 10.
Power of the PV panels (w).
Figure 10.
Power of the PV panels (w).
Figure 11.
Equivalent electrical diagram of an elementary battery cell.
Figure 11.
Equivalent electrical diagram of an elementary battery cell.
Figure 12.
Evolution of rcel and e
0 as a function of the state of charge of a cell [
35].
Figure 12.
Evolution of rcel and e
0 as a function of the state of charge of a cell [
35].
Figure 13.
Optimization process.
Figure 13.
Optimization process.
Figure 14.
Evolution of the population of individuals during the execution of the NSGA-II genetic algorithm.
Figure 14.
Evolution of the population of individuals during the execution of the NSGA-II genetic algorithm.
Figure 15.
Pareto front of optimal system configurations.
Figure 15.
Pareto front of optimal system configurations.
Figure 16.
Evolution of design parameters along the optimal front as a function of system cost and as a function of LPSP.
Figure 16.
Evolution of design parameters along the optimal front as a function of system cost and as a function of LPSP.
Figure 17.
Particulate configurations from the good compromise zone of the optimal front.
Figure 17.
Particulate configurations from the good compromise zone of the optimal front.
Figure 18.
Battery SOCbat variations for configurations 1 and 2.
Figure 18.
Battery SOCbat variations for configurations 1 and 2.
Figure 19.
Power evolution for two typical days: one in summer and the other in winter.
Figure 19.
Power evolution for two typical days: one in summer and the other in winter.
Figure 20.
State of charge of the tank.
Figure 20.
State of charge of the tank.
Table 1.
Characteristics of the PV module.
Table 1.
Characteristics of the PV module.
| Maximum power:Pmax | 250 W |
| Maximum power point voltage: Umpp | 31.1 V |
| Open circuit voltage: Voc | 37.8 V |
| Maximum power point current: Impp | 8.05 A |
| Short circuit current: Isc | 8.28 |
| Temperature coefficient of the short-circuit | 47 °C |
| current: CTIsc | 0.042%/°C |
| Cells per module Ns | 60 |
| Surface: SPV | 1.67 m² |
| Efficiency: ηconst | 14% |
Table 2.
Input variables.
Table 2.
Input variables.
| Input Variable: x | Minimum Value xmin | Maximum Value xmax |
|---|
| Number of batteries: Nbat | 1 | 100 |
| Number of wind turbines: Nwt | 1 | 30 |
| Number of PV panels: Npv | 1 | 100 |
| Elevating head: Hm | 1 | 40 |
Water reservoir
volume: V | 1 | 100 |
Table 3.
Parameters regulation for NSGAII.
Table 3.
Parameters regulation for NSGAII.
| Settings | Values |
|---|
| Number of generations | 100 |
| Number of individuals | 100 |
| Number of executions | 3 |
| Variable mutation rate | 0.35 |
| Crossover gene mutation rate | 0.04 |
Table 4.
The characteristics of the selected configurations.
Table 4.
The characteristics of the selected configurations.
| Configurations | Optimum1 | Optimum2 | Optimum3 |
|---|
| Nbat | 10 | 20 | 50 |
| NWT | 15 | 20 | 28 |
| NPV | 60 | 25 | 20 |
| Am | 22 | 25 | 30 |
| V | 60 | 50 | 40 |
| Cost system (f1) kEUR | 7.1 | 9.2 | 11.1 |
| LPSP (f2) | 0.4 | 0.2 | 0.5 |
| Publisher’s Note: MDPI stays neutral with regard to jurisdictional claims in published maps and institutional affiliations. |
© 2022 by the authors. Licensee MDPI, Basel, Switzerland. This article is an open access article distributed under the terms and conditions of the Creative Commons Attribution (CC BY) license (https://creativecommons.org/licenses/by/4.0/).


