
Analyzing Various Factors Affecting Farmers’ Willingness to Adopt Soil Erosion Control Measures in the Sebeya Catchment, Rwanda


Abstract
1. Introduction
2. Methodology
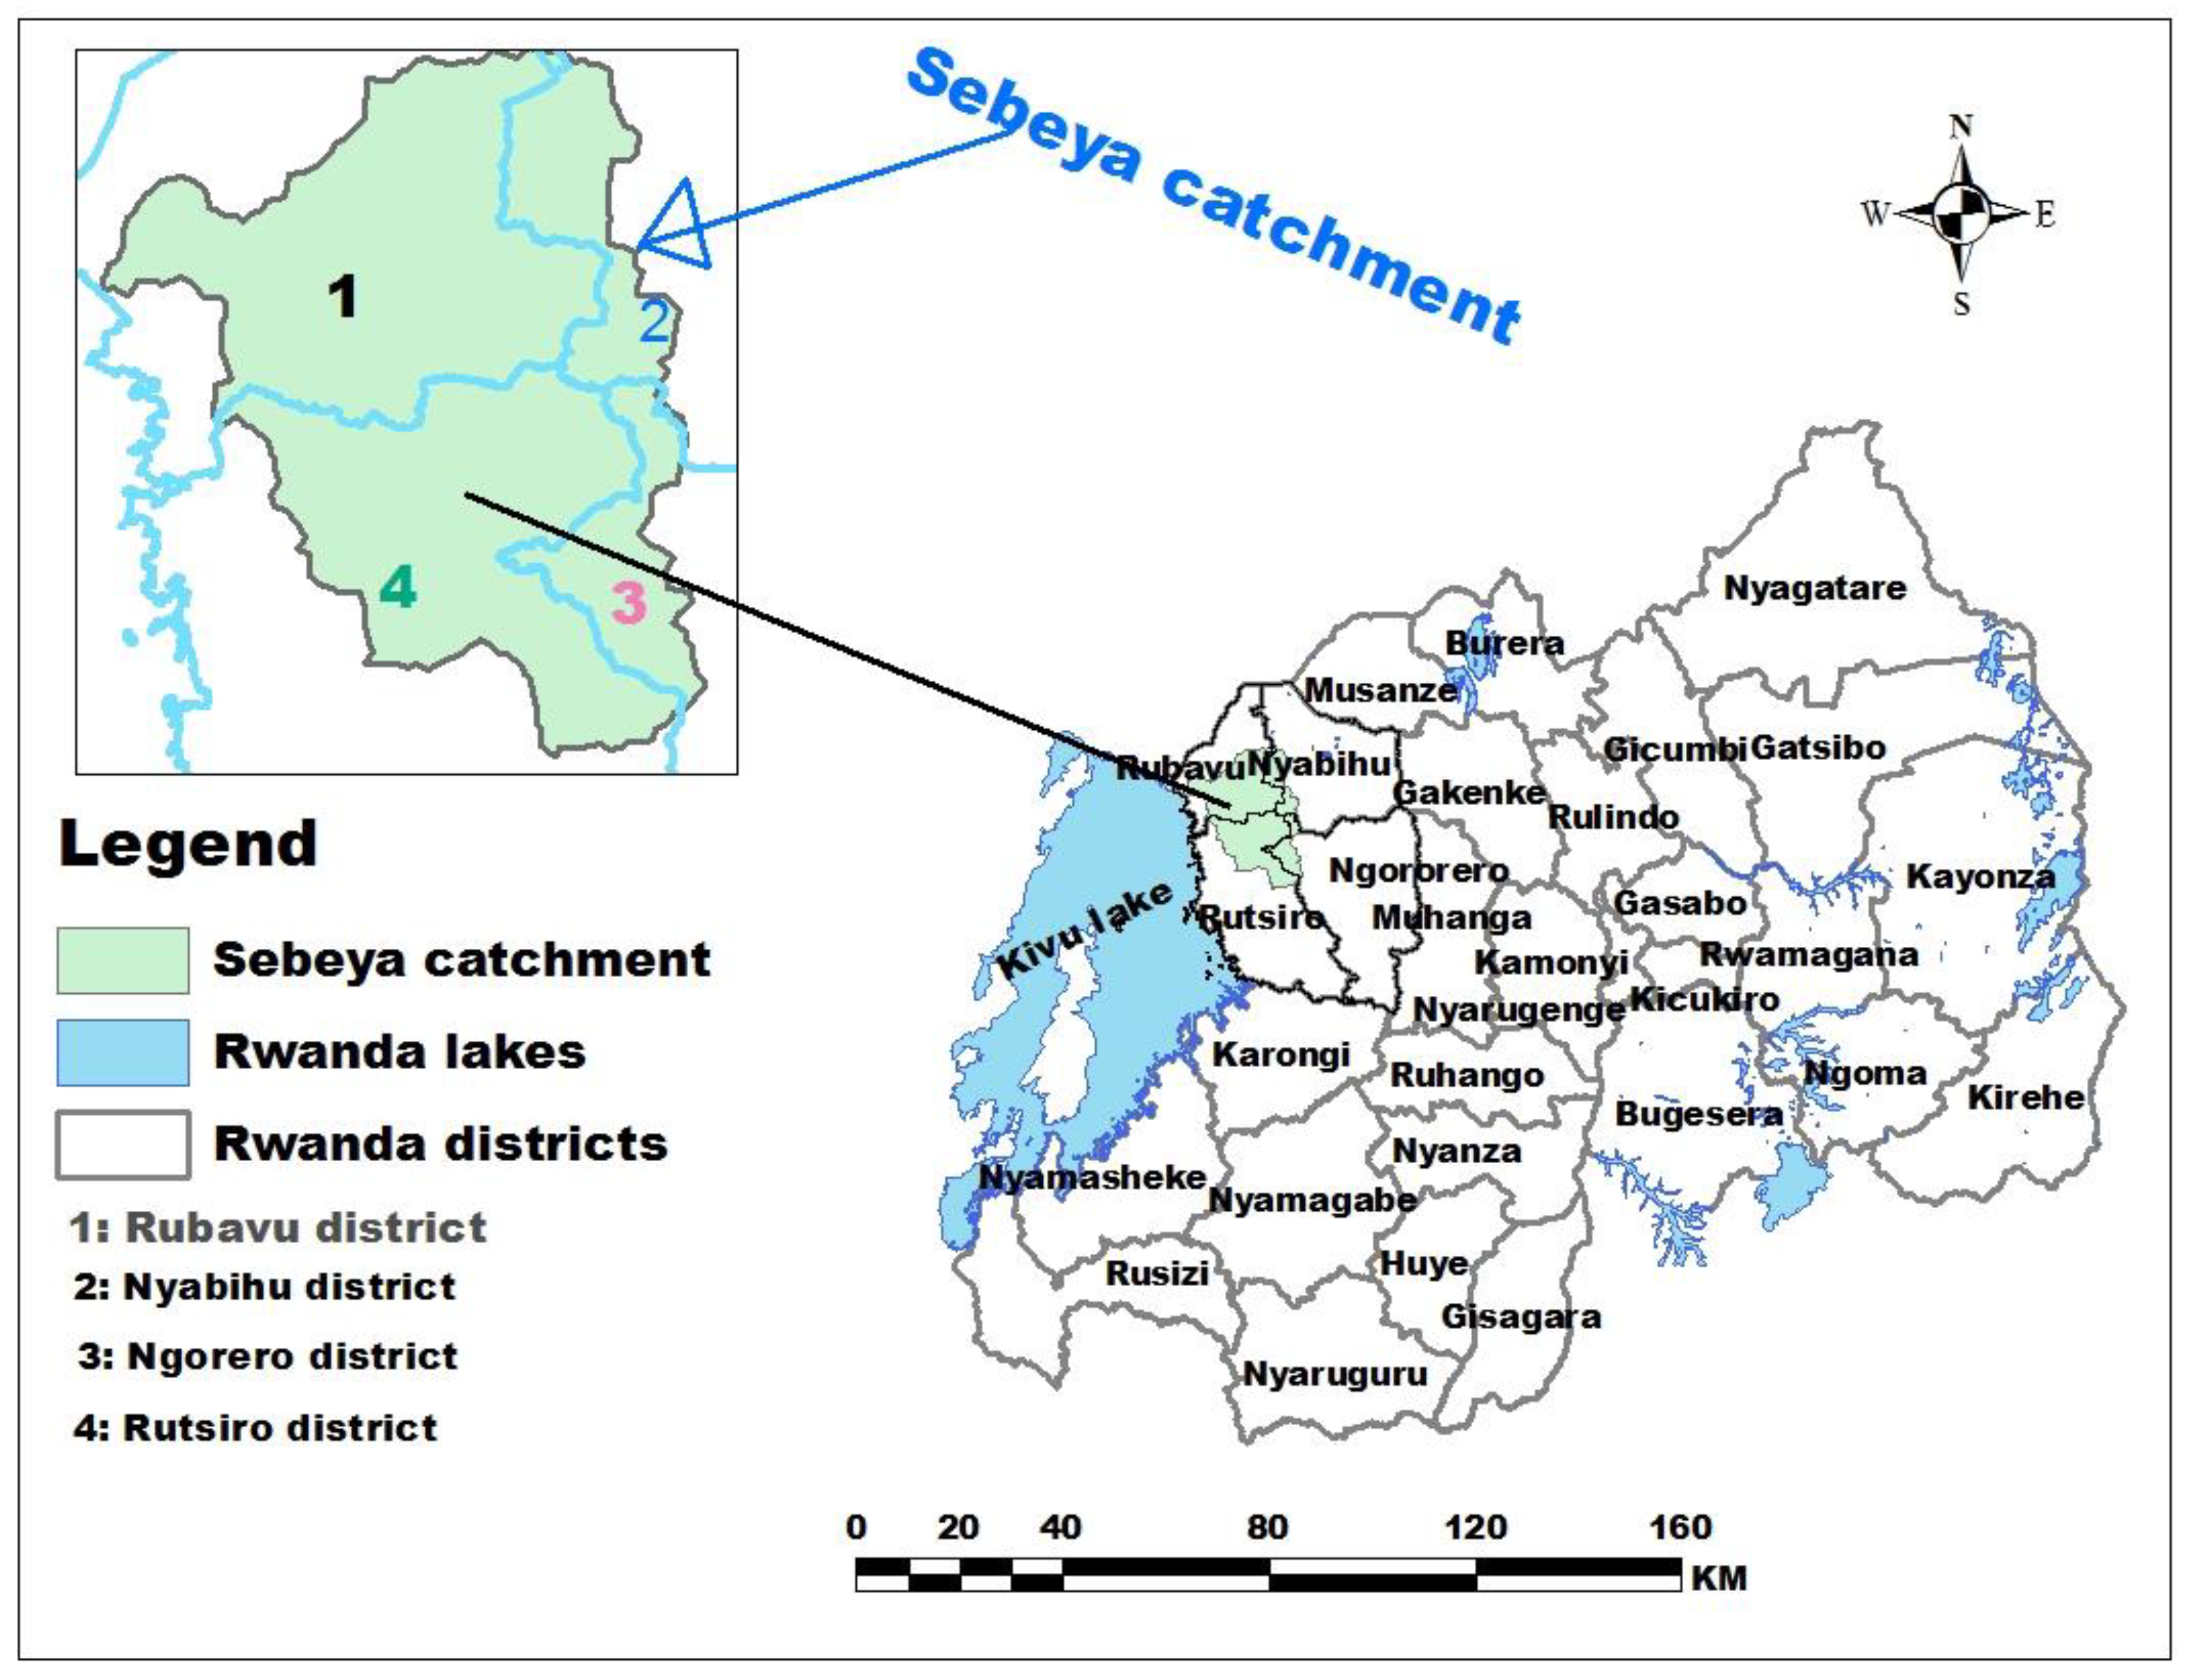
2.1. Study Area
2.2. Determining the Sample Size and Sampling Procedures
2.3. Data Collection
2.4. Data Analysis
3. Results
3.1. Estimating Soil Loss from Sebeya Catchment
3.2. Farmers’ Socioeconomic Characteristics
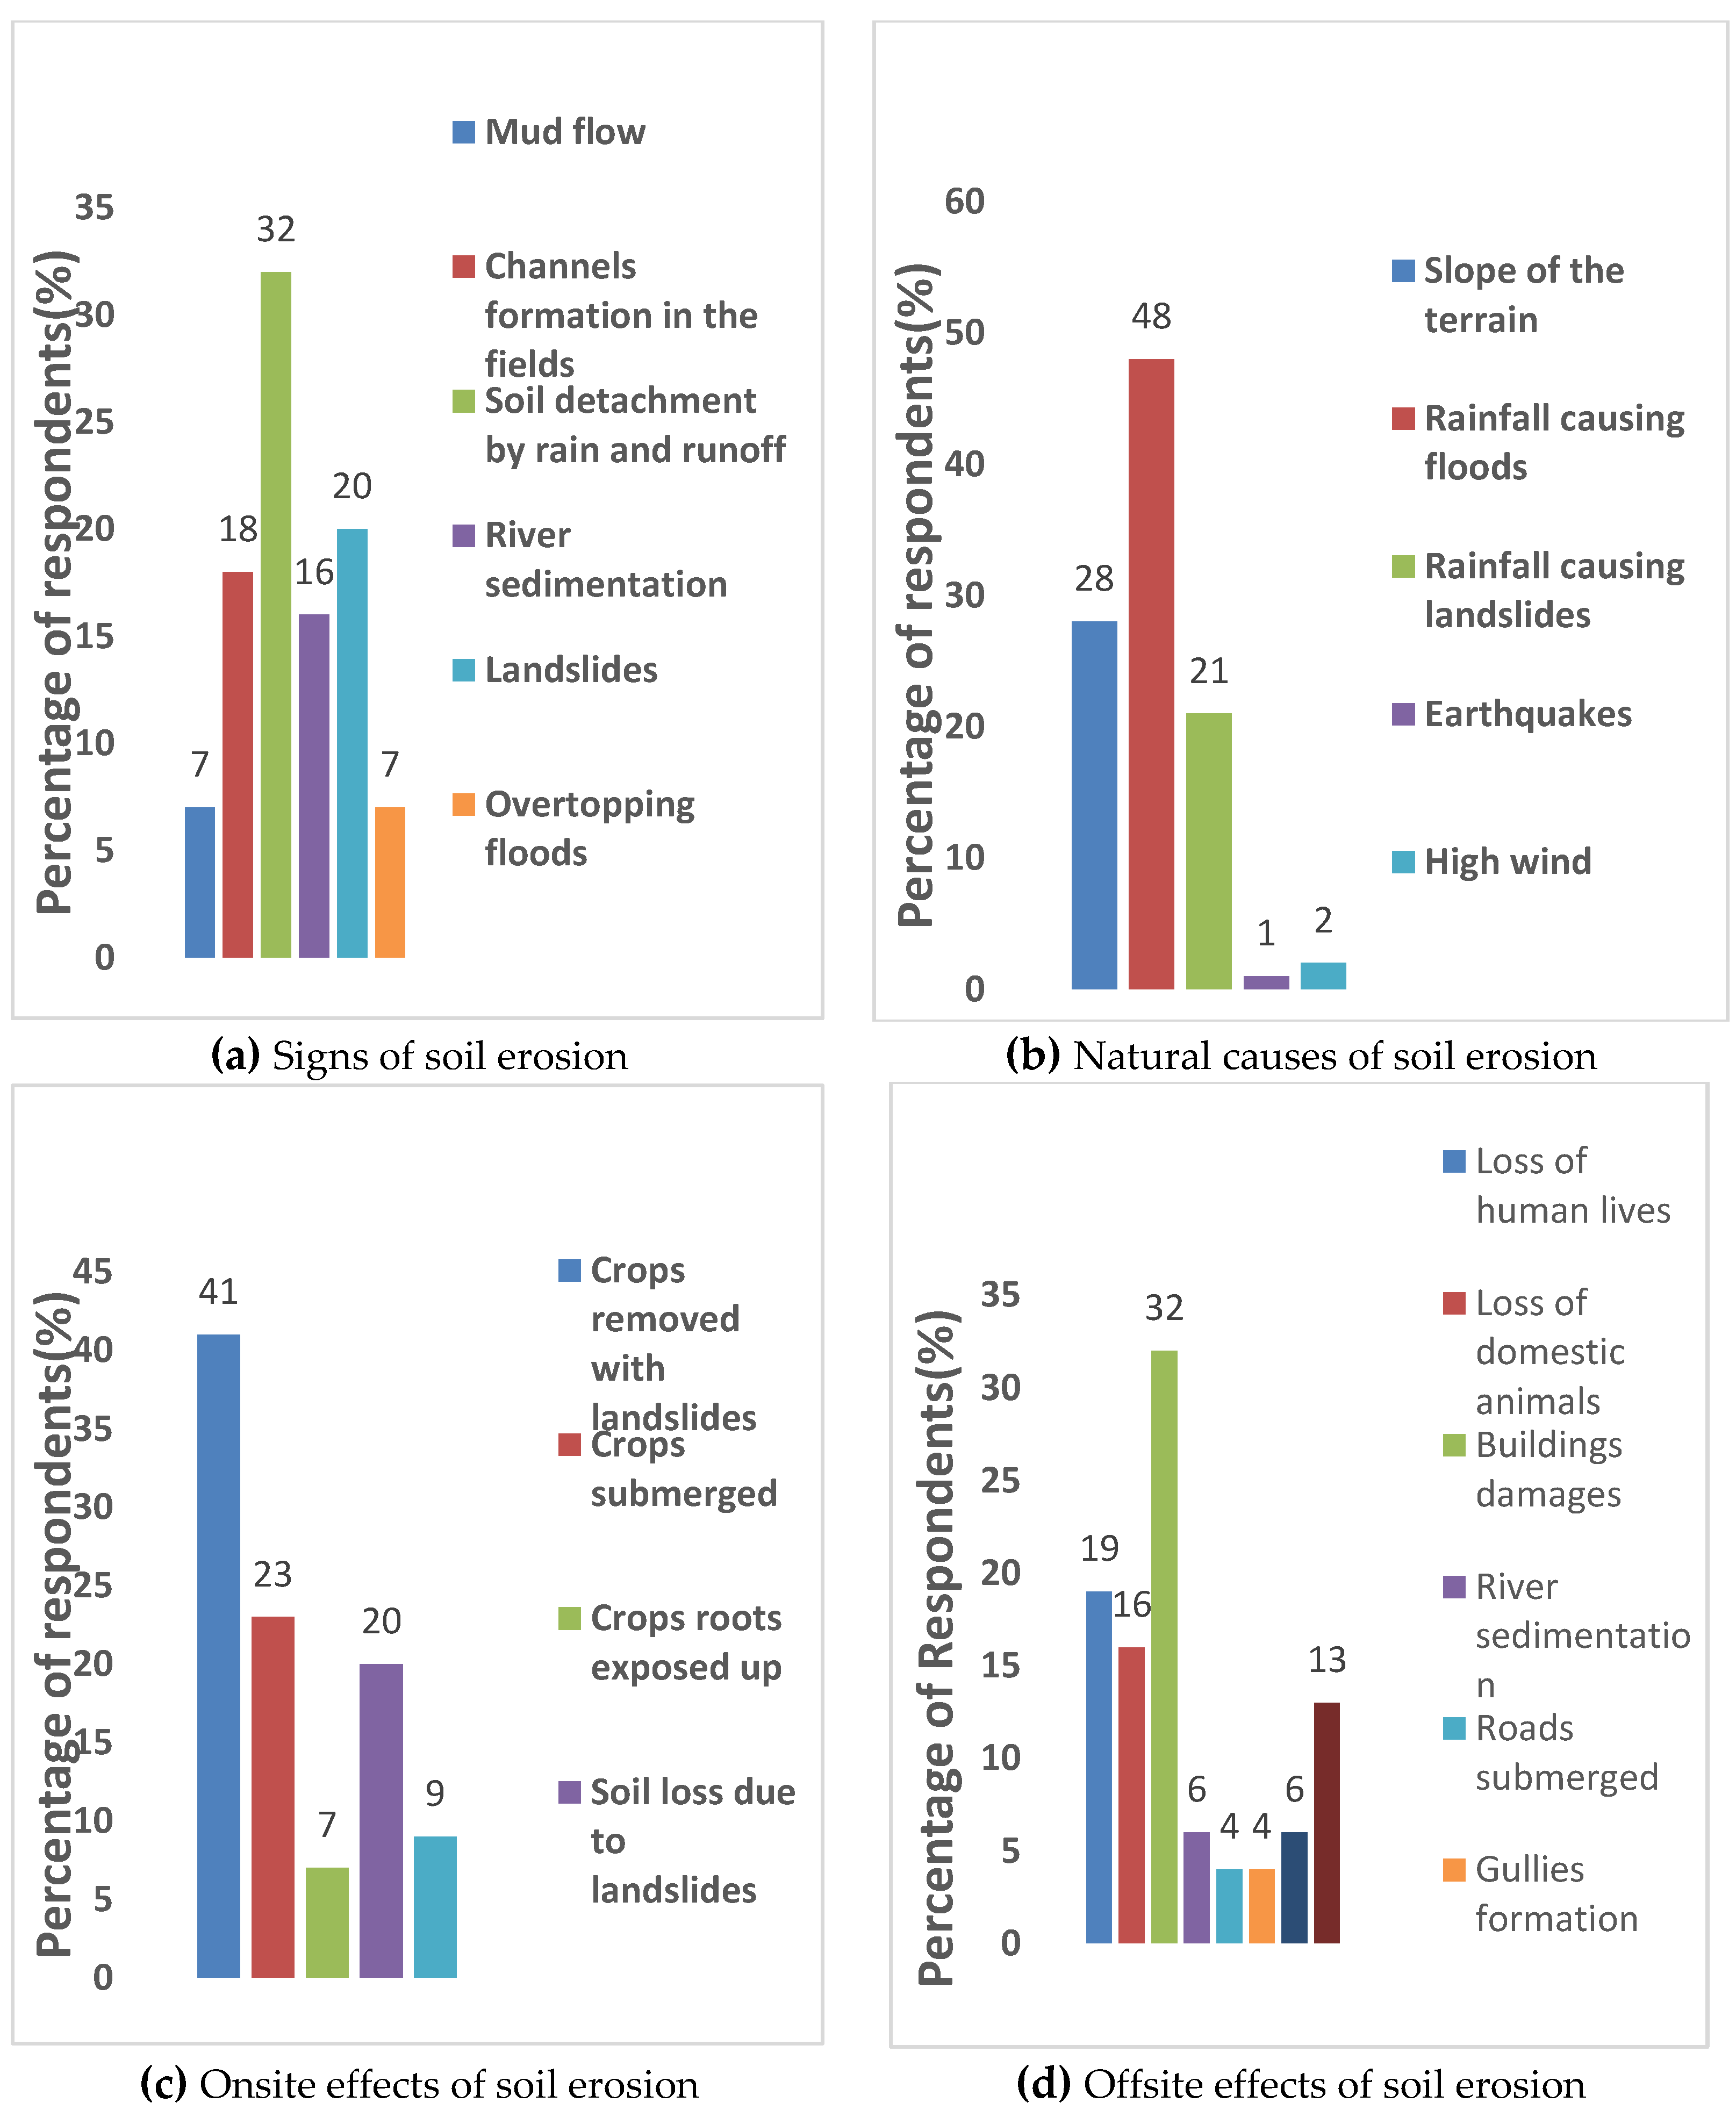
3.3. Farmers’ Perceptions of Causes and Effects of Soil Erosion
3.4. Needs for the Implementation of SEC Measures in the Sebeya Catchment
4. Discussion
4.1. Actual Status of Soil Erosion and its Control in the Sebeya Catchment
4.2. Adoptability of SEC Measures in the Sebeya Catchment
4.3. SWOT Analysis
4.4. Future Work
5. Conclusions and Recommendations
Author Contributions
Funding
Institutional Review Board Statement
Informed Consent Statement
Data Availability Statement
Acknowledgments
Conflicts of Interest
References
- Simeneh, D.; Getachew, F. Evaluation of land use types and physical soil and water conservation structures in Wyebla watershed in Northern Ethiopia. Int. J. Environ. Prot. 2015, 6, 90–96. [Google Scholar]
- Tegegne, M.; Biniam, S. Estimating Soil Erosion Risk and Evaluating Erosion Control Measures for Soil Conservation Planning at Koga Watershed, Highlands of Ethiopia. Solid Earth Dis. 2016, 8, 1–23. [Google Scholar]
- Chen, G.; Zhang, Z.; Guo, Q.; Wang, X.; Wen, Q. Quantitative Assessment of Soil Erosion Based on CSLE and the 2010 National Soil Erosion Survey at Regional Scale in Yunnan Province of China. Sustainability 2019, 11, 3252. [Google Scholar] [CrossRef]
- Issaka, S.; Ashraf, M.A. Impact of soil erosion and degradation on water. Geol. Ecol. Landsc. 2017, 1, 1–11. [Google Scholar] [CrossRef]
- Borrelli, P.; Diodato, N.; Panago, P. Rainfall erosivity in Italy: A national scale spatio temporal Assessment. Int. J. Digit. Earth 2016, 9, 835–850. [Google Scholar] [CrossRef]
- Antenah, G. Farmers’ Awareness about Land Degradation and Their Attitiudes toward Land Management: A Case of Sidama Zone, Aleta Wondo Wereda, Southern Ethiopia; Addis Ababa University: Addis Ababa, Ethiopia, 2010. [Google Scholar]
- Falcao, K.D.; Panachuki, E.O.; Monteiro, F.D.; Menezes, R.D.; Rodrigues, D.B.; Sone, J.S.; Oliveira, P.T. Surface runoff and soil erosion. Surf. Runoff Soil Eros. A Nat. Regen. Area Braz. Cerrado 2020, 8, 124–130. [Google Scholar]
- Huang, X.L. The effects of farmers’ adoption behavior of soil and water conservation measures on agricultural output. Int. J. Clim. Change Strateg. Manag. 2020, 12, 599–615. [Google Scholar] [CrossRef]
- Bizoza, A.R.; De Graff, J. Financial cost-benefit analysis of bench terraces in Rwanda. Land Degrad. Dev. 2012, 23, 103–115. [Google Scholar] [CrossRef]
- Debebbe, W.; Melaku, K.M. Farmers’ perceptions’ and participation on mechanical soil and water conservation techniques in Kembata Tembaro Zone: The Case of Kachabirra Woreda, Ethiopia. Int. J. Adv. Struct. Geotech. Eng. 2013, 2, 118–131. [Google Scholar]
- Liu, X.B.; Zhang, X.; Wang, X.; Sui, Y.Y.; Zhang, S.L.; Herbert, S.J.; Ding, G. Soil degradation: A problem threatening the sustainable development of agriculture in Northeast China. Plant Soil Environ. 2010, 56, 87–97. [Google Scholar] [CrossRef]
- Bagarella, G.; Lazzarin, R.; Noro, M. On the activation strategy of the chiller in water-loop self-contained refrigeration system: An experimental analysis. Int. J. Refrig. 2015, 57, 94–102. [Google Scholar] [CrossRef]
- Munyaneza, O.; Majoro, F.; Hagenimana, E.; Usabyisa, W. Impact Assessment of Hillside Rainwater Harvesting Ponds on Agriculture Income: Case Study of Ntarama Sector in Rwanda. J. Water Resour. Prot. 2016, 8, 844–854. [Google Scholar] [CrossRef][Green Version]
- Karamage, F.; Zhang, C.; Ndayisaba, F.; Shao, H.; Kayiranga, A.; Fang, X.; Nahayo, L.; Nyesheja, M.E.; Tian, G. Extent of Cropland and Related Soil Erosion Risk in Rwanda. Sustainability 2016, 7, 609. [Google Scholar] [CrossRef]
- IWRM. Sebeya Catchment Plan 2018–2024; Water for Growth Rwanda: Kigali, Rwanda, 2018. [Google Scholar]
- MoE. Mapping of Erosion in Rwanda and Guidelines for Erosion Control; Ministry of Environment: Kigali, Rwanda, 2018.
- Munyaneza, O.; Majoro, F.; Mutake, S.; Hagenimana, E. Performance Evaluation of Sediment Basins: Case Study of Keya Hydropower Plant in Rwanda. J. Water Resour. Prot. 2014, 7, 1387–1398. [Google Scholar] [CrossRef][Green Version]
- Thapa, B.S.; Dahlhaug, O.G.; Thapa, B. Sediment erosion in hydro turbines and its effect on the flow around guide vanes of Francis Turbines. Renew. Sustain. Energy Rev. 2017, 49, 1100–1113. [Google Scholar] [CrossRef]
- NISR. Demographic and Health Survey; National Institute of Statistics in Rwanda: Kigali, Rwanda, 2014.
- Taherdoost, H. Sampling Methods in Research Methodology; How to Choose a Sampling Technique for Research. Int. J. Acad. Res. Manag. 2016, 5, 18–27. [Google Scholar] [CrossRef]
- Faber, J.; Fonseca, L.M. How a Sample Size Influences Research Outcomes. Dent. Press J. Orthod. 2014, 19, 27–29. [Google Scholar] [CrossRef] [PubMed]
- Kumar, R. Research Methodology: A Step-by-Step Guide for Beginners; SAGE publication Ltd.: New Dehli, India, 2011. [Google Scholar]
- Kim, J.H. How to Choose the Level of Significance: A Pedagogical Note. Minich Pers. RePEc Arch. 2015, 1–13. [Google Scholar] [CrossRef][Green Version]
- Tesfahunegn, G.B.; Ayuk, E.T.; Adiku, S.G. Farmers’ perception on soil erosion in Ghana: Implication for developing sustainable soil management strategy. PLoS ONE 2021, 16, e0242444. [Google Scholar] [CrossRef] [PubMed]
- Kleinbaum, D.G.; Klein, M. Logistic Regression: A Self-Learning Text, 3rd ed.; Springer: Atlanta, GA, USA, 2010. [Google Scholar]
- Park, H.A. An Introduction to Logistics Regression: From Basic Concepts to Interpretation with Particular Attention to Nursing Domain. J. Korean Acad. Nurs. 2013, 43, 154–164. [Google Scholar] [CrossRef]
- Sakinc, I.; Ugurlu, E. Logistic Regression Analysis to Examine Factors Affecting Gender Diversity on the Boardroom: ISE Case. Int. J. Bus. Soc. Sci. 2013, 4, 57–61. [Google Scholar]
- NISR. Agricultural Household Survey; National Institute of Statistics in Rwanda: Kigali, Rwanda, 2021.
- Stockemer, D. Quantitative Methods for Social Sciences: A Practical Introduction with Examples in SPSS and Data; Springer: Ottawa, ON, Canada, 2019. [Google Scholar]
- Biratu, A.A.; Asmamaw, D.K. Farmers’ perception of soil erosion and participation in soil and water conservation activities in the Gusha Temela watershed, Arsi, Ethiopia. Int. J. River Basin Manag. 2016, 4, 329–336. [Google Scholar] [CrossRef]
- Misebo, A.M. The role of agronomic practices on soil and water conservation in Ethiopia: Implication for climate change adaptation: A review. J. Agric. Sci. 2018, 10, 227–237. [Google Scholar] [CrossRef][Green Version]
- Belay, T.T. Perception of Farmers on Soil Erosion and Conservation Practices in Dejen District, Ethiopia. Int. J. Environ. Prot. Policy 2020, 2, 224–229. [Google Scholar] [CrossRef]
- Amenu, L.; Megersa, T. Factors Influencing Soil Erosion Management Practices in Ejersa Lafo District, West Showa Zone, Oromia, Regional State, Ethiopia. J. Appl. Sci. Environ. Manag. 2021, 5, 79–85. [Google Scholar]
- Pravat, K.S.; Gourie, S.B.; Ramkrishna, M. Farmers’ perceptions of soil erosion and management strategies in South Bengal in India. Eur. J. Geogr. 2015, 6, 85–100. [Google Scholar]
- IWRM. Catchment Plan Sebeya 2017–2023; Water for Growth: Kigali, Rwanda, 2017. [Google Scholar]
- IWRM. Feasibility Study and Detail Design of the Early Implementation Project on Sebeya Catchment; Ministry of Foreign Affairs, Embassy of the Kingdom of the Netherland: Kigali, Rwanda, 2016.
- Onu, F.M.; Mohammed, A. Competency improvement needs of farmers in soil erosion prevention and control for enhancing crop production: Case study of Kogi State, Nigeria. Agric. Sci. 2014, 5, 958–963. [Google Scholar] [CrossRef][Green Version]
- Turhan, N.S. Karl Pearson’s chi-square tests. Educ. Res. Rev. 2020, 15, 575–580. [Google Scholar]
- Asfaw, D.; Neka, M. Factors affecting adoption of soil and water conservation practices: The case of Wereillu Woreda (District), South Wollo Zone, Amhara Region, Ethiopia. Int. Soil Water Conserv. Res. 2017, 5, 273–279. [Google Scholar] [CrossRef]
- Senkoro, A.J. Impact of Soil Erosion Control Practices on Household Food Security and Income: A Case of East Usambara Highlands, Tanzania; Sokoine University of Agriculture: Morogoro, Tanzania, 2010. [Google Scholar]
- Nigussie, Z.; Tsunekawa, A.; Haregeweyn, N.; Adgo, E.; Nohmi, M.; Tsubo, M. Farmers’ perception about soil erosion in Ethiopia. Land Degrad. Dev. 2017, 28, 401–411. [Google Scholar] [CrossRef]
- Alemu, M.D. Farmers’ Perception of Soil Erosion and Adoption of Soil Conservation Technologies at Geshy Sub-Catchment, Gojeb River Catchment, Ethiopia. Agric. Sci. 2019, 10, 46–65. [Google Scholar] [CrossRef]
- Belachew, A.; Mekuria, W.; Nachimuthu, K. Factors influencing adoption of soil and water conservation practices in the northwest Ethiopian highlands. Int. Soil Water Conserv. Res. 2020, 8, 80–89. [Google Scholar] [CrossRef]
- Nadhomi, D.L.; Tenywa, J.S.; Musali, P.; Nakileza, B.R. Farmers’ Perception of Erosion Risk and Its Implication on the Adoption of Soil and Water Conservation Practices. Int. J. Adv. Agric. Sci. Technol. 2013, 2, 28–44. [Google Scholar]
- Betela, B.; Wolka, K. Evaluating soil erosion and factors determining farmers’ adoption and management of physical soil and water conservation measures in Bachire watershed, southwest Ethiopia. Environ. Chall. 2021, 5, 100348. [Google Scholar] [CrossRef]
- Mango, N.; Makate, C.; Tamene, L.; Mponela, P.; Ndengu, G. Awareness and adoption of land, soil and water conservation practices in the Chinyanja Triangle, Southern Africa. Int. Soil Water Conserv. Res. 2017, 5, 122–129. [Google Scholar] [CrossRef]
- Teshome, A.; de Graaff, J.; Kassie, M. Household-Level determinants of soil and water conservation adoption phases: Evidence from North-Western Ethiopian highlands. Environ. Manag. 2016, 57, 620–636. [Google Scholar] [CrossRef]
- Moges, D.M.; Taye, A.A. Determinants of farmers’ perception to invest in soil and water conservation technologies in the North-Western Highlands of Ethiopia. Int. Soil Water Conserv. Res. 2017, 5, 56–61. [Google Scholar] [CrossRef]
- Sileshi, M.; Kadigi, R.; Mutabazi, K.; Sieber, S. Determinants for adoption of physical soil and water conservation measures by smallholder farmers in Ethiopia. Int. Soil Water Conserv. Res. 2019, 7, 354–361. [Google Scholar] [CrossRef]
- Mugonola, B.; Deckers, J.; Poesen, J.; Isabirye, M.; Mathijs, E. Adoption of soil and water conservation technologies in the Rwizi catchment of south western Uganda. Int. J. Agric. Sustain. 2013, 11, 264–281. [Google Scholar] [CrossRef]
- Alufah, S.; Shisanya, C.A.; Obando, J.A. Analysis of Factors Influencing Adoption of Soil and Water Conservation Technologies in Ngaciuma Sub-Catchment, Kenya. Afr. J. Basic Appl. Sci. 2012, 4, 172–185. [Google Scholar]
- Wordofa, G.M.; Okoyo, E.N.; Erkalo, E. Factors influencing adoption of improved structural soil and water conservation measures in Eastern Ethiopia. Environ. Syst. Res. 2020, 9, 2–11. [Google Scholar] [CrossRef]
- Fekadu, B.; Yenealem, K.; Jema, H.; Belaineh, L. Impact of integrated soil and water conservation program on crop production and income in West Harerghe Zone, Ethiopia. Int. J. Environ. Monit. Anal. 2013, 1, 11–120. [Google Scholar]
- Karidjo, B.Y.; Wang, Z.; Boubacar, Y.; Wei, C. Factors Influencing Farmers’ Adoption of Soil and Water Control Technology (SWCT) in Keita Valley, a Semi-Arid Area of Niger. Sustainability 2018, 2, 288. [Google Scholar] [CrossRef]
- Guo, X.; Zhou, L.; Chen, Y.; Zhao, M.; Wang, R. Perception and adaption of ecological environment change for farmers in the typical desertification area: A case of hangjin banner in the Inner Mongolia autonomous region. J. Arid. Land Resour. Environ. 2017, 31, 64–69. [Google Scholar]
- Aniah, P.; Wedamb, E.; Pukunyiemc, M.; Yinimid, G. Erosion and livelihood change in North East Ghana. Int. J. Sci. Basic Appl. Res. 2013, 7, 28–35. [Google Scholar]
- Peprah, J.A.; Afoakwah, C.; Isaac, K. Crop Yield Volatility among Smallholder Farmers in Ghana; UNU-INRA: Accra, Ghana, 2016. [Google Scholar]
- Tesfahunegn, G.B.; Tamene, L.; Vlek, P.L. Evaluation of soil quality identified by local farmers in Mai-Negus, Northern Ethiopia. Geoderma 2011, 163, 209–218. [Google Scholar] [CrossRef]
- Kusimi, J.M.; Yiran, G.A. Application of local knowledge in land degradation assessment in the Bawku East Municipality. Ghana J. Geogr. 2011, 3, 88–125. [Google Scholar]


| Case Study | Research Questions | Methods | Results |
|---|---|---|---|
| A sample of 75 farmers in the Sebeya catchment. | What is the actual status of various farmers’ socioeconomic characteristics in the Sebeya catchment? | Scoring of various farmers’ socioeconomic characteristics. | Actual status on various farmers’ socioeconomic characteristics in the Sebeya catchment. |
| What are the farmers’ perceptions of various causes of soil erosion and its effects? | Assessing farmers’ views on various causes and effects of soil erosion on agricultural lands. | A collection of farmers’ views on the main causes and effects of soil erosion in the Sebeya catchment and their assessment. | |
| How do farmers express their needs to improve the existing and implement new soil erosion control measures? | Scoring of various proposed SEC measures. | Farmers’ views on the improvement and implementation of the existing and new proposed SEC measures in the Sebeya catchment. | |
| How do different farmers’ socioeconomic characteristics affect the adoption of SEC measures? | Using the binary logistic regression model to analyze the statistical significance of nine socioeconomic factors influencing the adoption of SEC measures. | The level of the statistical significance of the nine factors influencing the adoption of SEC measures in the Sebeya catchment. |
| Attribute | Frequency | Attribute | Frequency |
|---|---|---|---|
| 1. Gender | 5. Land ownership | ||
| Male | 43(57.3%) | Farmland inherited | 27(36%) |
| Female | 32(42.7%) | Farmland bought | 30(40%) |
| 2. Age | Farmland hired | 10(13%) | |
| 18–25 | 8(11%) | Not owner but a daily laborer | 8(11%) |
| 26–30 | 13(17%) | 6. Total farmland size | |
| 31–40 | 27(36%) | ≤0.1 ha | 15(20%) |
| 41–55 | 21(28%) | >0.1 ha | 60(80%) |
| >55 | 6(8%) | 7. Main occupation | |
| 3. Marital status | Farmer but not the owner | 5(7%) | |
| Married (live together) | 59(79%) | Owner but not farm laborer | 10(13%) |
| Single | 7(10%) | Owner & daily laborer | 60(80%) |
| Divorced | 4(5%) | 8. Access to social media | |
| Widowed | 5(6%) | Yes | 13(17%) |
| 4. Education | No | 62(83%) | |
| Illiterate (no formal education) | 11(15%) | 9. Access to credit | |
| Can read and write | 4(5%) | Yes | 18(24%) |
| Primary education | 42(55%) | No | 57(76%) |
| Secondary education | 15(20%) | ||
| University | 4(5%) | ||
| Parameter | Sample | Country Mean (µ) [28] | t-Test = μ | ||
|---|---|---|---|---|---|
| Min | Max | ||||
| Age (years) | 18 | 67 | 38.40 | - | N.A. |
| Farming experience (years) | 1 | 48 | 17.95 | - | N.A. |
| Total farmland size for Irish per household (m2) | 75 | 90,000 | 2540 | 165 | DD |
| Total farmland size for maize per household (m2) | 48 | 41,160 | 1887 | 615 | DD |
| Total farmland size for beans per household (m2) | 60 | 25,290 | 1814 | 778 | DD |
| Income from Irish potatoes per household (kg/season) | 40 | 4000 | 255 | 127 | DD |
| Income from beans per household (kg/season) | 10 | 30,000 | 821 | 67 | D.D. |
| Income from maize per household (kg/season) | 10 | 4000 | 198 | 88 | D.D. |
| Number of cows per household | 1 | 6 | 0.31 | 0.67 | NS |
| Number of pigs per household | 2 | 9 | 0.33 | 0.52 | SS |
| Number of goats per household | 1 | 5 | 0.60 | 0.72 | SS |
| Number of poultry per household | 2 | 13 | 0.69 | 1.64 | NS |
| Number of rabbits per household | 7 | 15 | 0.29 | 0.31 | SS |
| S.N. | Purposes | Typical SEC Measures |
|---|---|---|
| 1 | BMPs for erosion control on farmlands | Terraces, contour bunds, no-tillage, cover crops, mulching, anti-erosive ditches, strip cropping, crop rotation, agroforestry, stabilizing grasses on farm bunds (vetiver grass, reed, cetaria, tripsacum, paspalum). |
| 2 | BMPs for slope stabilization | Stabilizing trees (grevelia, bamboo), stabilizing grasses (vetiver grass, reed, cetaria, tripsacum, paspalum), retaining walls (use of gabions or stones). |
| 3 | BMPs for river banks stabilization | Stabilizing trees (grevelia, bamboo), stabilizing grasses (vetiver grass, reed, cetaria, tripsacum, paspalum), stone revetment, use of riprap, retaining wall (made of gabions); use of sandbags. |
| 4 | BMPs for sediments control | Sand traps, sediment basins, constructed wetlands, strip cropping along the river buffer zones; siltation ponds at the end of storm sewers; grassed waterways, and protective sediment barriers. |
| 5 | BMPs to prevent large velocities of runoff | Check dams, grassed waterways, stone blocks in a channel, stilling basins, storm sewer drains, roadside channels, ditches, and hillside water ponds. |
| 6 | BMPs to prevent significant volume flow rates of runoff | Hillside water ponds, roof runoff cisterns. |
| Land Slope | Soil Depth | ||
|---|---|---|---|
| (>1 m) | (0.5–1) m | (<0.5 m) | |
| (0–6%) | AG+CC+CT+DC+M+SG | AG+CC+CT+DC+M+SG | AG+CC+CT+DC+M+SG |
| (6–16%) | CC+CT+DC+M+PT+SG | CC+CT+DC+M+PT+SG | M+PT or CB+DC+M+SG |
| Or CB+CC+CT+DC+M+SG | Or CB+CC+CT+DC+M+SG | Or CB+CC+CT+DC+M+SG | |
| (16–40%) | BT+CC+CT+DC+M+SG | BT+CC+CT+DC+M+SG | CC+CT+DC+M+PT+SG |
| or CB+CC+CT+DC+M+SG | |||
| (40–60%) | BT+CC+CT+DC+M+SG | BT+CC+CT+DC+M+SG | A.F. |
| (>60%) | A.F. | A.F. | A.F. |
| S.N. | Variables (Adoption Factors) | df (r − 1)(c − 1) | χ2 (Calculated) | χ2 (Critical) | p-Value | χ2 test (Ho) * |
|---|---|---|---|---|---|---|
| 1 | Age of a farmer (yr) | 12 | 26.762 | 21.026 | 0.0084 | S |
| 2 | Gender of a farmer | 3 | 13.480 | 7.815 | 0.0037 | S |
| 3 | Marital status | 9 | 1.170 | 16.919 | 0.9989 | NS |
| 4 | Education | 12 | 0.310 | 21.026 | 0.9999 | NS |
| 5 | Farmland size (ha) | 3 | 8.350 | 7.815 | 0.0393 | S |
| 6 | Main occupation | 6 | 13.330 | 12.592 | 0.0380 | S |
| 7 | Access to media | 3 | 8.580 | 7.815 | 0.0353 | S |
| 8 | Access to credit | 3 | 11.870 | 7.815 | 0.0078 | S |
| Parameter | B | S.E. | Wald | df | Sig. | Exp (B) |
|---|---|---|---|---|---|---|
| Gender | −2.034 | 0.949 | 4.594 | 1 | 0.032 | 0.131 |
| Age | −0.642 | 0.319 | 2.231 | 1 | 0.035 | 1.719 |
| Marital status | −0.220 | 0.488 | 0.203 | 1 | 0.652 | 0.803 |
| Education | −0.507 | 0.409 | 1.532 | 1 | 0.216 | 0.602 |
| Total farmland size | −2.225 | 1.222 | 3.318 | 1 | 0.069 | 0.108 |
| Main occupation | −0.335 | 0.852 | 0.155 | 1 | 0.694 | 0.715 |
| Farmers experience | 0.749 | 0.321 | 5.440 | 1 | 0.020 | 2.115 |
| Access to social media | 2.107 | 0.954 | 4.880 | 1 | 0.027 | 8.223 |
| Access to credit | −0.521 | 0.841 | 0.384 | 1 | 0.536 | 0.594 |
| Constant | 3.420 | 4.823 | 0.503 | 1 | 0.478 | 30.572 |
| Strength | Weaknesses |
| Reduction of topsoil and nutrient losses, soil compaction, and runoff. | Insufficient data for adequate planning. |
| Increase of organic matter while keeping high the soil depth and soil infiltration. | Lack of technical training in planning and implementing SEC measures. |
| Reduction of soil and water pollution with direct implications on biodiversity preservation. | Lack of incentives for sustainable implementation of SEC measures. |
| The intervention of the government and NGOs in promoting the BMPs of soil erosion control. | The control of soil erosion is not perfect: persistence of soil erosion (indicators and its effects). |
| Opportunities | Threats |
| Improvement and implementation of new SEC measures. | Climate change impacting crop yield expectations. |
| Large-scale adoption. | Excessive rainfall. |
| Increase in environmental awareness and support. | Financial restrictions. |
| Significant improvement in communication through social media. | Some technologies, bench terraces, check dams, hillside water tanks, retaining walls, and sediment basins, require high capital to invest in SEC measures. They are not affordable by an individual farmer. |
Publisher’s Note: MDPI stays neutral with regard to jurisdictional claims in published maps and institutional affiliations. |
© 2022 by the authors. Licensee MDPI, Basel, Switzerland. This article is an open access article distributed under the terms and conditions of the Creative Commons Attribution (CC BY) license (https://creativecommons.org/licenses/by/4.0/).
Share and Cite
Majoro, F.; Wali, U.G. Analyzing Various Factors Affecting Farmers’ Willingness to Adopt Soil Erosion Control Measures in the Sebeya Catchment, Rwanda. Sustainability 2022, 14, 12895. https://doi.org/10.3390/su141912895
Majoro F, Wali UG. Analyzing Various Factors Affecting Farmers’ Willingness to Adopt Soil Erosion Control Measures in the Sebeya Catchment, Rwanda. Sustainability. 2022; 14(19):12895. https://doi.org/10.3390/su141912895
Chicago/Turabian StyleMajoro, Félicien, and Umaru Garba Wali. 2022. "Analyzing Various Factors Affecting Farmers’ Willingness to Adopt Soil Erosion Control Measures in the Sebeya Catchment, Rwanda" Sustainability 14, no. 19: 12895. https://doi.org/10.3390/su141912895
APA StyleMajoro, F., & Wali, U. G. (2022). Analyzing Various Factors Affecting Farmers’ Willingness to Adopt Soil Erosion Control Measures in the Sebeya Catchment, Rwanda. Sustainability, 14(19), 12895. https://doi.org/10.3390/su141912895