1. Introduction
The increasing global life expectancy, especially in developed countries, leads to new challenges in healthcare, particularly in the field of organ transplantation. As people age, the wear and tear on individual organs—such as the heart, liver, or kidneys—becomes a limiting factor, outpacing the body’s overall ability to sustain longevity. Consequently, organ failure is emerging as a critical limiting factor in extending healthy lifespans, which is reflected in the growing of organ transplant waiting lists, the rising number of transplant procedures, and the broadening criteria for organ donation, including the increased use of donors after circulatory death (DCD). While heart and kidney transplants are becoming routine procedures in specialized hospitals, limited viability of donor organs outside the body leads to underutilizing of the potential donor pool.
The heart, in particular, is highly intolerant to ex vivo storage. To prevent undesirable tissue degradation during preservation, various storage techniques have been developed. The standard and most widely used method, static cold storage (SCS), is significantly time-limited. Guidelines of the International Society for Heart and Lung Transplantation, as well as other expert recommendations, discourage SCS of more than four hours due to primary graft dysfunction (PGD) and poorer outcomes [
1,
2,
3,
4]. This restriction imposes severe logistical challenges, limiting the geographic range of potential donors and reducing organ accessibility for recipients.
One of the most promising approaches to increase ex vivo storage life of transplants is organ vitrification, which has demonstrated the ability to preserve a rat kidney for up to 100 days [
5]. However, attempts to apply vitrification to heart preservation have limited success so far, with no reports of functional recovery and contractility [
6,
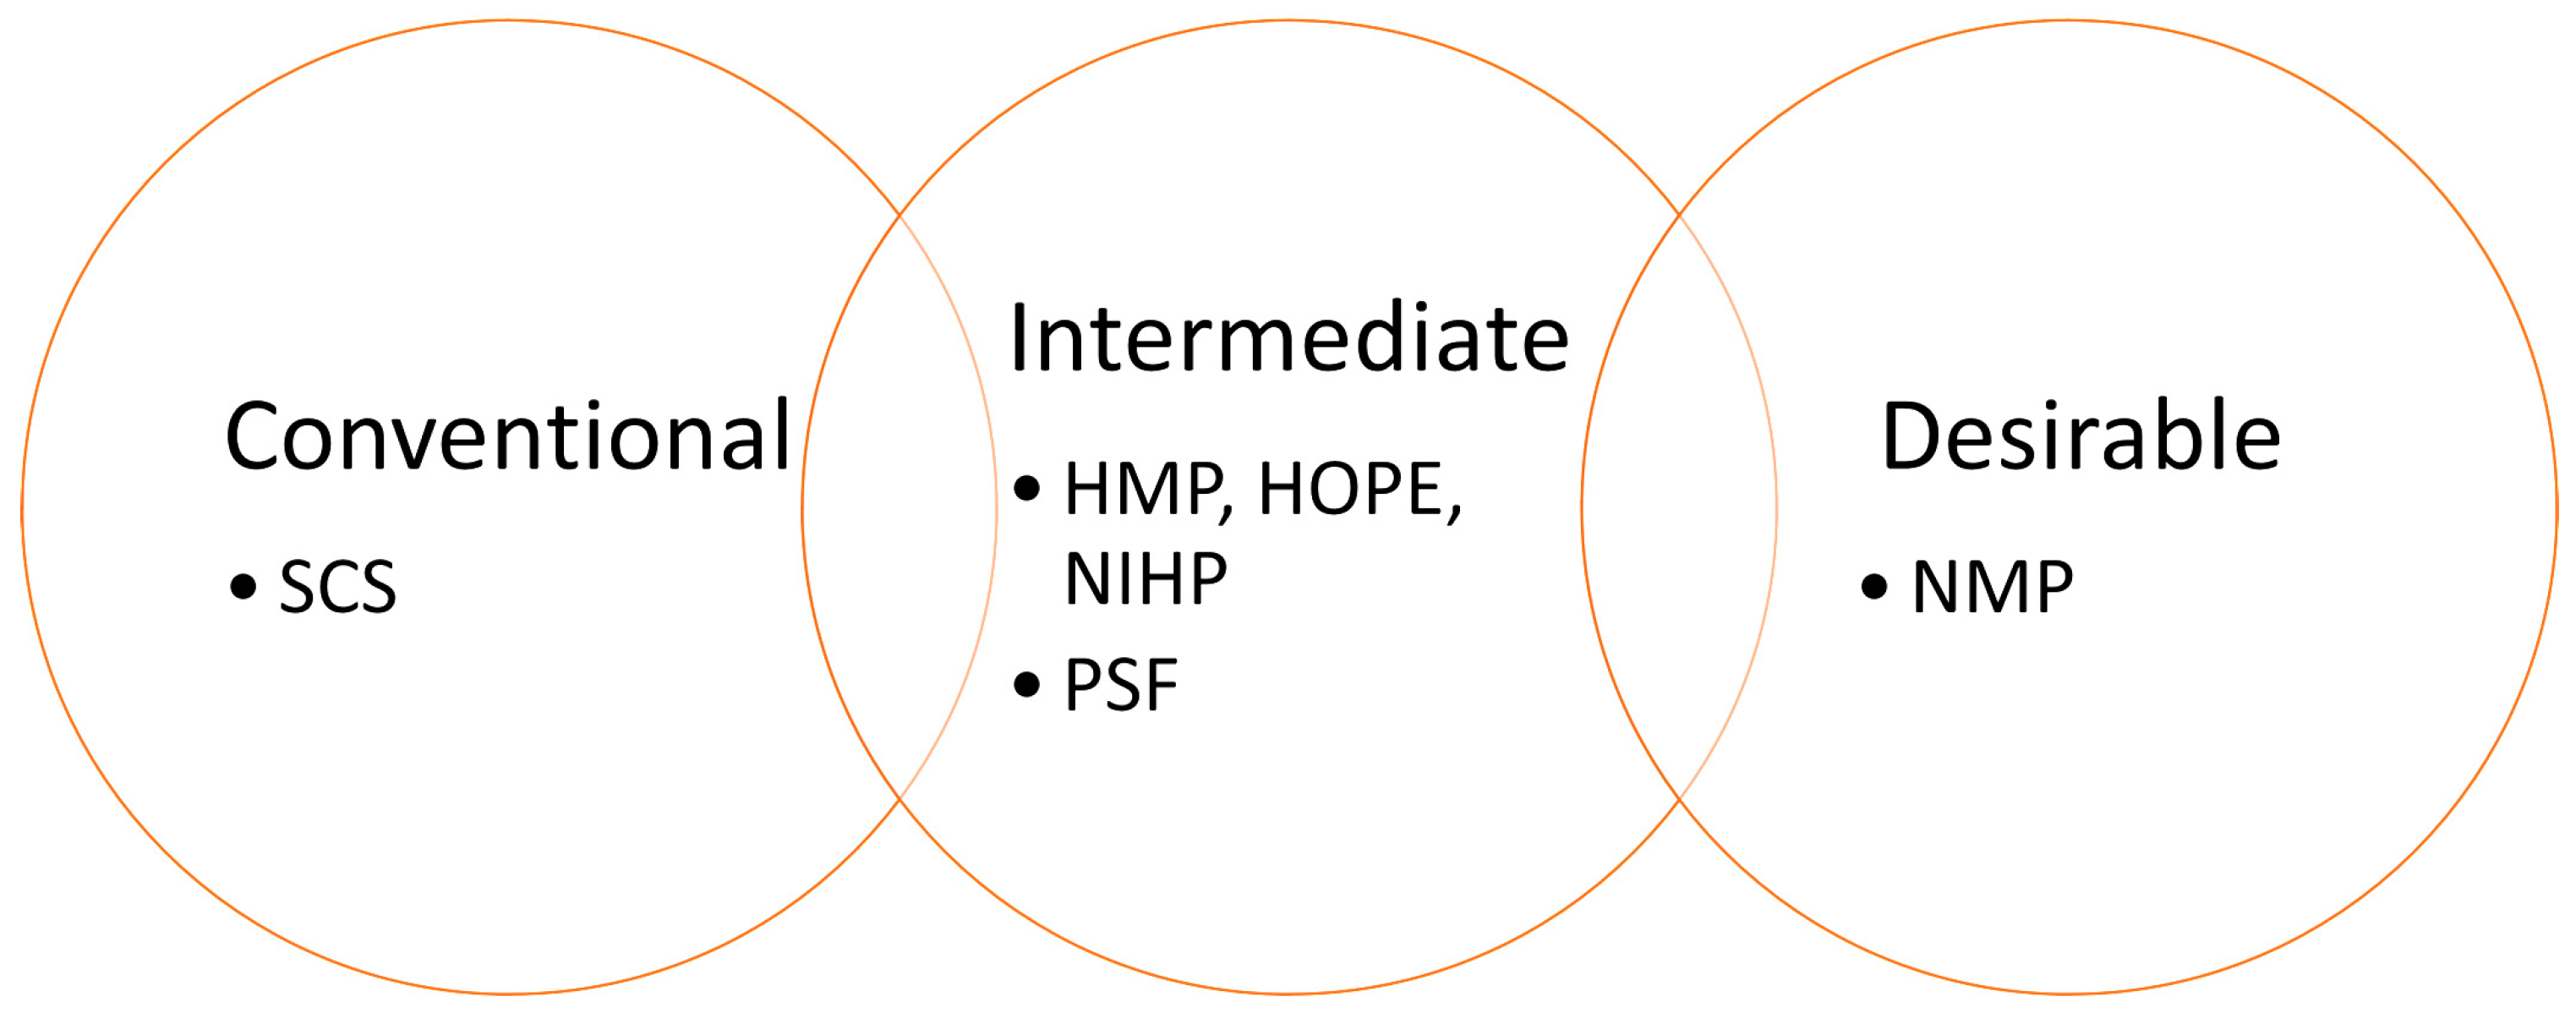
7]. Focusing on other heart preservation technologies, their range can be schematically represented as three intersecting circles (
Figure 1). On one end of the spectrum is Static Cold Storage (SCS), a simple and robust technique based on a principle used for over 50 years: perfusing an organ with a cold preservation solution. Nevertheless, SCS is the least effective option for extended preservation, even though more than 167 different solution formulations have been created [
8]. At the opposite end lies normothermic machine perfusion (NMP), a cutting-edge organ-preserving technique, which utilizes near-physiological perfusion with autologous blood at 35–37 °C [
2,
3,
9]. However, NMP is expensive, technically complex, and requires highly skilled personnel [
10,
11]. Intermediate preservation techniques, including hypothermic machine perfusion (HMP) [
12,
13], non-ischemic heart preservation (NIHP) [
14], and hypothermic oxygenated perfusion (HOPE) [
1], share a common principle: the perfusion of complex solutions through the organ’s vasculature at low temperatures. They effectively balance procedural simplicity with enhanced preservation outcomes. These methods have demonstrated efficacy in large animal models, such as porcine hearts, and are currently under clinical investigation [
1,
14,
15,
16].
In this study, we report a novel heart preservation technique inspired by the concept of antegrade heart persufflation (aPSF) [
15,
16,
17,
18]. aPSF involves perfusion of coronary vessels by gaseous oxygen or gas mixtures (e.g., Carbogen) through aortic bulb. Early studies on porcine hearts showed that aPSF could preserve hearts for up to 14 h in both acute and chronic experiments [
16,
17]. However, despite promising results, aPSF has not gained clinical adoption in heart transplant preservation over the past two decades. Barriers to the adoption of aPSF for heart preservation may stem both from the stigmatization of the technology among clinicians due to concerns about myocardial gas embolism [
19] as well as technical challenges, such as the need for precise aortic cannulation and sealing of the aortic valve, which requires a unique seal tailored to a specific heart. Furthermore, establishing flow of gas through the organ raises concerns not only about aseptic and transport issues but also about the overall bulkiness of the system [
20]. On the other hand, relatively recent clinical trials have confirmed the success of PSF for human liver preservation, and its technical aspects for pancreas preservation have been incorporated into the consensus guidelines of the European Society for Organ Transplantation [
21,
22,
23,
24].
Our approach, termed HIPPER (High-Pressure Perfusion), overcomes key limitations of PSF by introducing several critical innovations: (a) a hermetically sealed pressurized chamber for organ placement, (b) a closed-loop gas perfusion system utilizing a pre-compressed gas mixture prevents open gas outflow, (c) a proprietary gas perfusion algorithm, and (d) a unique gas mixture containing xenon (Xe) and oxygen (O
2). While the critical role of O
2 is undeniable, the selection of an adjuvant gas remained unclear. We chose Xe due to its well-documented protective properties and established use in clinical practice [
25,
26]. A critical question remained: the optimal concentration of Xe to achieve therapeutic effects without toxicity. For instance, a recent study demonstrated that dysregulation of MitoKATP channels—whether through increased or decreased activity—leads to muscle degradation, underscoring the need for precise modulation [
27]. This is particularly relevant given the known effects of Xe-mediated channel modulation [
26]. Thus, different gaseous modalities—and even their ratios—may produce varying effects. For this reason, we employed O
2-Xe mixtures at various ratios to identify potential differences.
In this comparative study, we used rat hearts as the experimental model and conventional SCS with HTK (Histidine–Tryptophane–Ketoglutarate) solution as the control. All experimental groups utilized the HIPPER technique with different gaseous mixtures: varying ratios of Xe:O
2 and pure air. The inclusion of a pure air group was intended to isolate the effects of the gas mixture from those of the perfusion technique itself. For the initial validation of the HIPPER, we focused on a classical and interpretable design centered on the Langendorff method. This method allowed for quantitative assessments of the kinetics of reperfused organs and post-perfusion myocardial infarction [
28].
2. Materials and Methods
2.1. Experimental Design
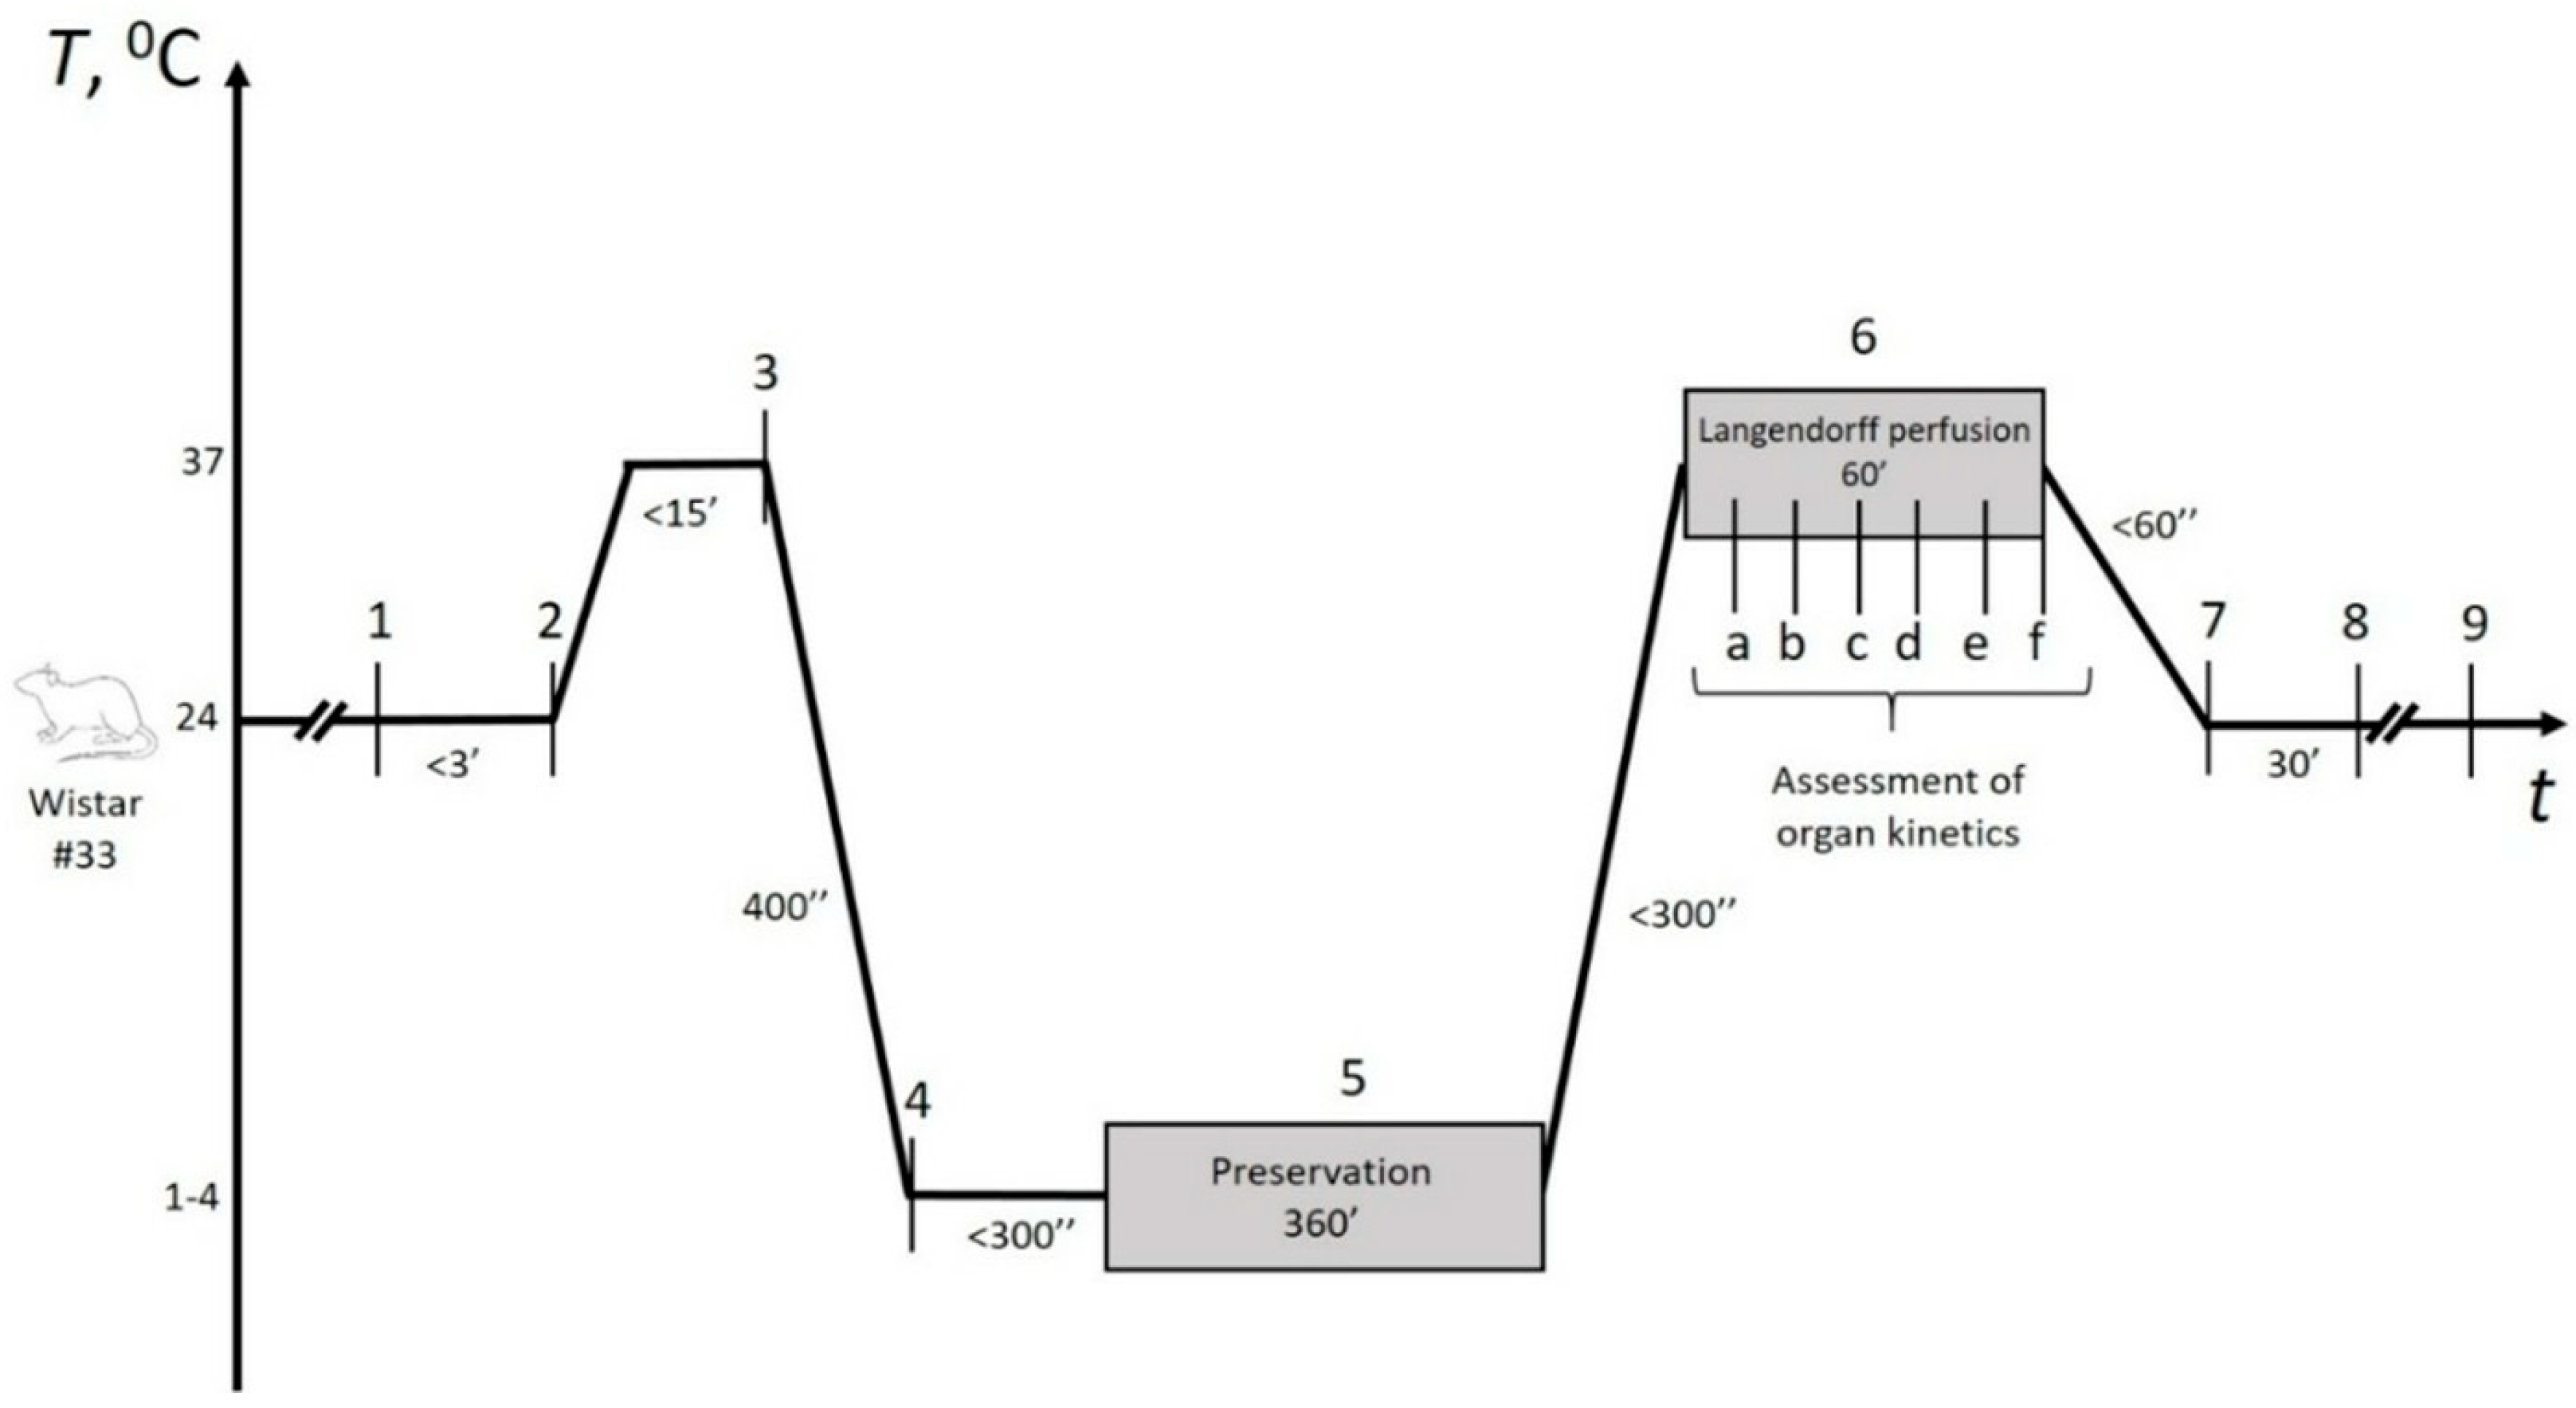
The experimental design is represented in
Figure 2. Briefly, following cardioplegia within 5–7 min and heart relaxation, preservation began immediately, lasting no more than 5 min. In the control group, hearts were filled with HTK solution and immersed in iced saline to avoid contact-mediated ice injury, as recommended by cardiothoracic transplant guidelines [
29]. In the experimental groups, the remaining 21-gauge aortic cannula was connected to the preservation device’s pump after the initial Langendorff perfusion, enabling continuous experimental gaseous perfusion throughout the preservation period. Details regarding the selection of gaseous mixtures and perfusion methods are provided in the following section. At the end of the storage period, control hearts were directly connected to the Langendorff setup (Radnoti, Dunedin, New Zealand), while experimental hearts underwent controlled depressurization first. The total preservation time was 360 ± 9 min, with no significant differences observed between the groups.
2.2. Animals and Ethical Considerations
The study protocol was approved by the ethical committee and the scientific board of the Institute of Immunology and Physiology of the Ural Branch of the Russian Academy of Sciences in Ekaterinburg, Russia. Wistar rats were bred and handled in accordance with the requirements of the European Convention for the Protection of Animals 2010/63/EU.
Given the proof-of-concept nature of this study and the absence of prior data, a preliminary power analysis was performed to estimate the required sample size. The calculation was based on the formula
N = (
DF/*k*) + 1, where
DF (degrees of freedom) ranges from 10 to 20 and *k* is the number of groups. This formula, recommended as a rule of thumb in the absence of preliminary data [
30,
31], yielded a requirement of at least four animals per group using an average
DF value of 15. Accordingly, a total of 33 male rats were randomly allocated into five experimental groups: (Control,
n = 10) static cold storage (SCS) in HTK solution, (Exp) HIPPER using oxygen–xenon gas mixtures of varying ratios (“Gas-A”: 1/9, “Gas-B”: 9/1, and “Gas-C”: 1/1,
n = 15), and (Air,
n = 8) HIPPER using air) with baseline parameters summarized in
Table S1. Statistical comparisons of key parameters showed no significant differences (
Table S1).
2.3. Organ Retrieval
All retrievals began under deep anesthesia induced by barbiturate and ketamine followed by heparin administration. After confirming the absence of a pedal withdrawal reflex, a clamshell thoracotomy was performed, with a midline sternotomy extended to the costal margins and bilateral rib incisions along the anterior axillary lines. The anterior chest wall was retracted, and the pericardium was opened for vessel and organ access. The heart was excised by transecting the ascending aorta (below the brachiocephalic artery) and both venae cavae, then transferred to a dissection dish with iced Krebs–Henseleit buffer for hypothermic cardioplegia. Extraneous tissue was removed, and a 21-gauge blunt cannula was secured in the aorta, ensuring proper sealing without contact with the aortic valve leaflets. All manipulations were completed within 2 min on average to alleviate suffering if any. None of specific sacrificing methods were utilized due to predefined circulatory death under deep anesthesia. The heart was then mounted on the Langendorff rig and perfused with 37 °C Krebs–Henseleit buffer under constant pressure for a 10-min stabilization period (7th column in
Table S1), during which inclusion criteria were assessed (
Table S3). Perfusion was then switched to +4 °C HTK cardioplegic solution (Custodiol
®, Dr. Franz Köhler Chemie GmbH, Bensheim, Germany) under constant flow for up to 5 min, maintaining pulsatile pressures of 60–80 mmHg.
2.4. HIPPER Technique–Gaseous Mixtures
The core concept of High-Pressure Perfusion (HIPPER) is to utilize a sealed chamber to house the organ under elevated pressure in a gaseous mixture. Furthermore, gas flow under high pressure is established through the vasculature, ensuring deep organ penetration. This requires sufficient, but not excessive, pressure to overcome vascular resistance and an optimized gas composition. We employed binary mixture of O
2 and Xe considering the rationale discussed in introduction as well as our earlier results in RBC storage [
25,
32,
33].
To explore the optimal Xe:O
2 ratios, three compositions were tested: 9:1 (Gas A), 1:9 (Gas B), and 1:1 (Gas C). To verify the feasibility of these ratios, we propose the following equations, involving
Ppres (minimum chamber pressure in bar), Xe:O
2 ratio, chamber volume, as well as organ-specific requirements for the preservation period.
is O2 fraction in gaseous mixture,
is the inner volume of the device (mL),
is O
2 demand by the organ within the expected preservation time (mL), which can be estimated as:
where
is the organ weight (g),
is the expected preservation time (min),
is the organ’s O2 requirement under physiological conditions (mL/min/tissue weight in g), derived from literature,
is a coefficient, reflecting a decrease in O2 demand in the relaxed condition (without contraction) at physiologic temperature (e.g., 2.0–4.0 for rat’s heart). = 1, for organs with no contraction.
A2 is a coefficient, reflecting a decrease in O
2 demand when the organ is placed in a hypothermic condition. Estimation is based on Q
10 rule [
34], yielding 2.0–3.0,
is the physiological organ temperature (°C), and
is the preservation temperature (°C).
The estimations show that for device design (200 mL of useful volume) the O2 content in all the mixtures was sufficient without the need to achieve extreme pressures, even for Gas A. In all scenarios, the estimated pressures did not exceed three bar, which was determined non-harmful in preliminary tests.
As a final step, we estimate the required frequency of gas exchange
N within the organ’s vasculature in relation to pump performance:
where
is the pump performance (mL/s),
is the expected preservation time (min),
is O2 demand of the organ within the expected preservation time (mL)
N is the frequency of the pump’s operation, measured in seconds of pump operation per minute time, and depending on device specifications. The ideal pump performance should align with both organ anatomy and O2 demand. For example, since the calculated amount of O2 required for the entire six-hour preservation of a rat heart does not exceed 100 mL, a pump performance of 1 mL/s is sufficient to switch it on once every 3.6 min for 1 s. In the present study, the pump was switched on for 1 s every 2 min.
2.5. Device Description
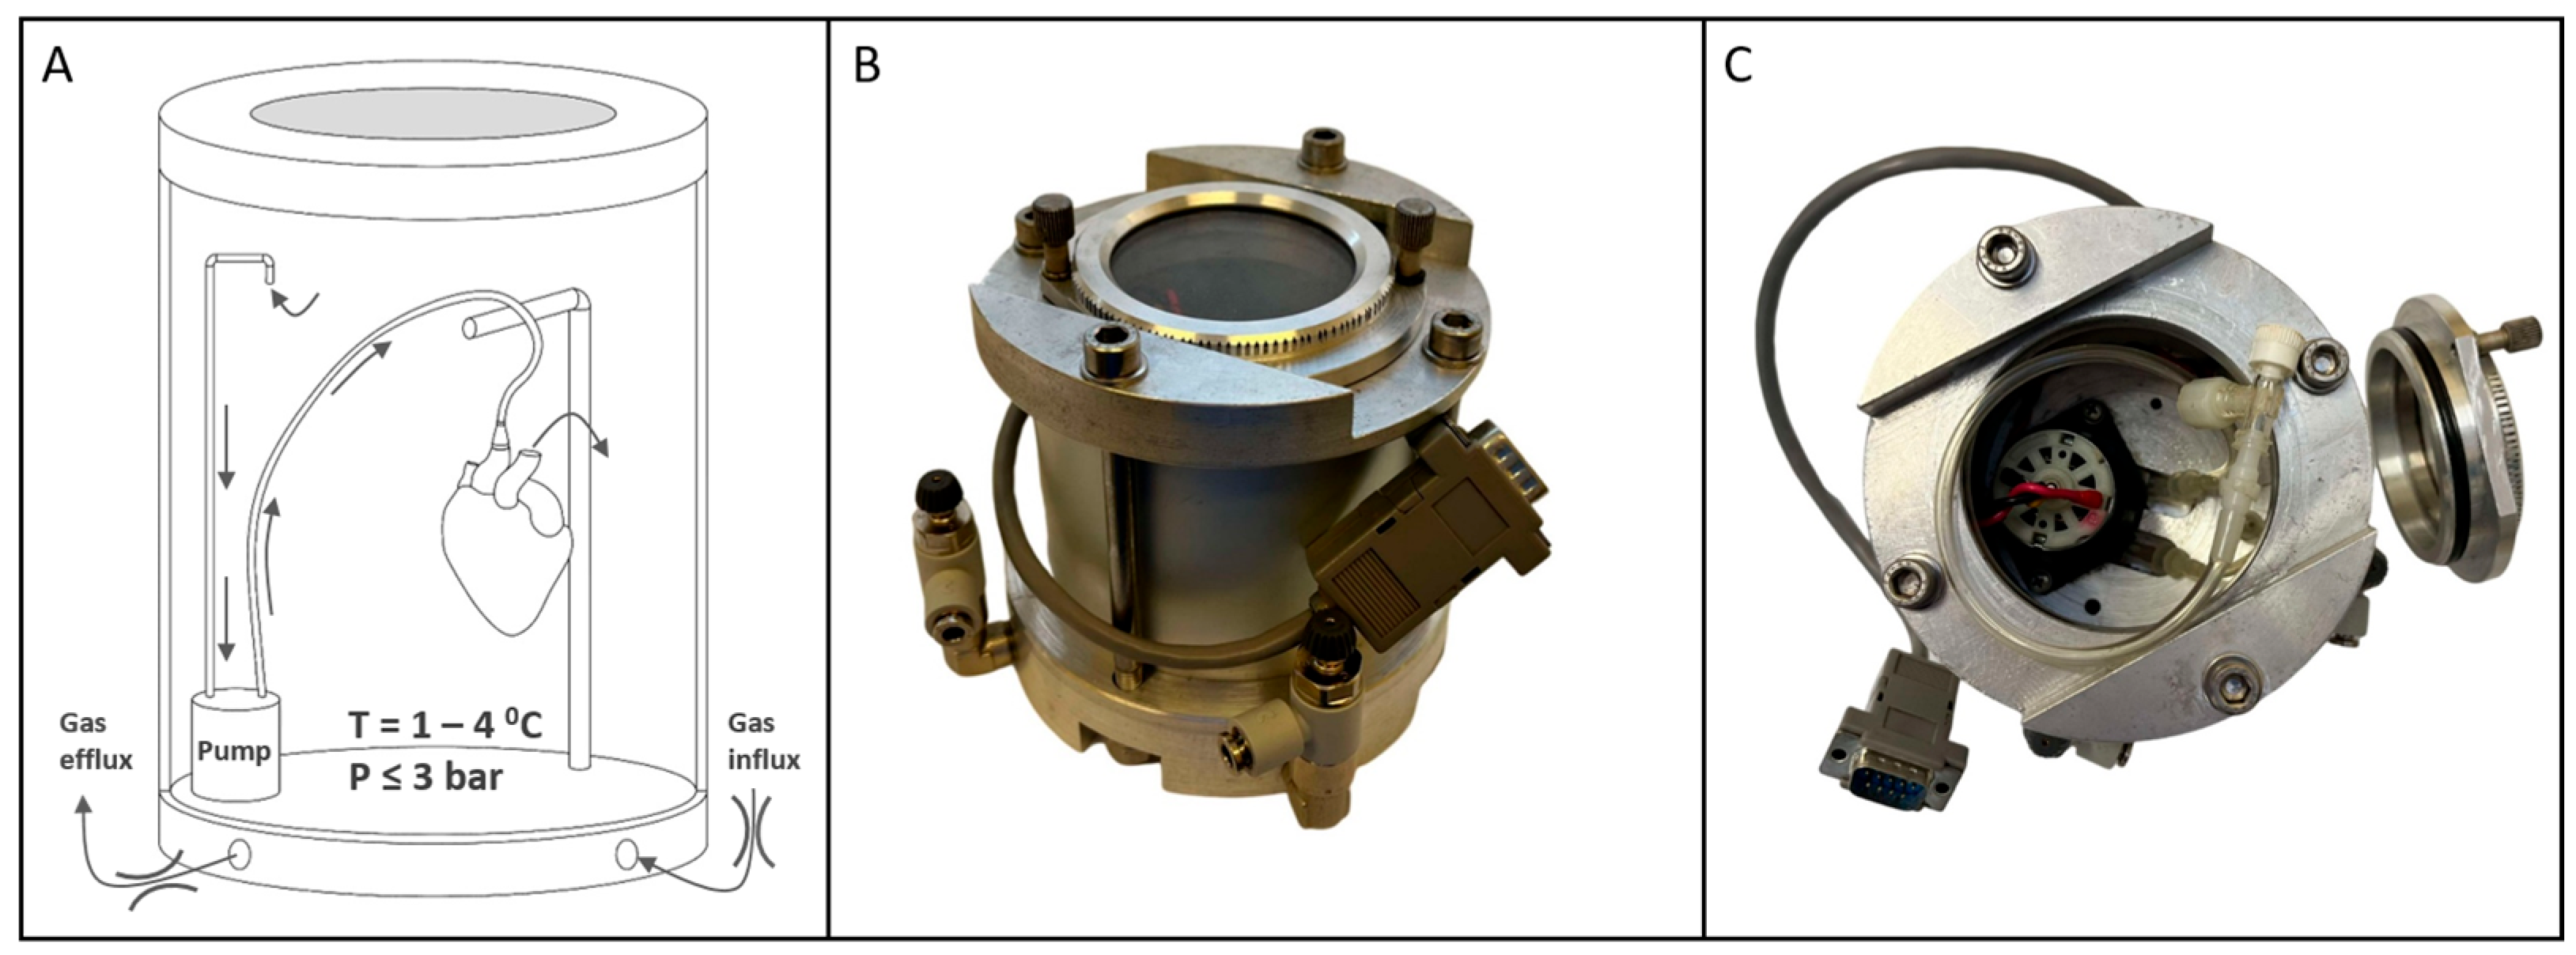
The device used in this study (
Figure 3) featured an inner chamber for organ accommodation, equipped with a pump, perfusion components (tubes, connectors, suspension), and a glass window for observation during pressurization and depressurization. The window also allowed monitoring of cardioplegia solution exiting the vasculature at the onset of gaseous perfusion, ensuring proper closure of the aortic valve leaflets.
A thermoelectric cooler provided precise, continuous refrigeration, eliminating thermal fluctuations typical of pump-based systems and maintaining a stable temperature curve that mimics SCS conditions (in
Figure S1). Temperature and pressure sensors connected to an external controller managed thermobaric conditions within the chamber and organ. Custom software (ver. 1.0) visualized real-time data, plots graphs, and ensures adherence to the storage protocol (in
Figure S1).
2.6. Perfusion Mode—In Operando Organ Assessment Criteria
Following heart suspension on the Langendorff rig, perfusion began at constant pressure (100 mmHg) with carbogenized Krebs–Henseleit buffer (O2:CO2 = 9.5:0.5) at 37 °C. Hemodynamic parameters, including heart rate, coronary flow rate, and left ventricular isovolumetric pressure, were monitored every 10 min over a 60-min reperfusion period using sensors (AD Instruments, Dunedin, New Zealand) and recorded in LabChart ver. 8.1 (AD Instruments, Dunedin, New Zealand). A polyethylene balloon, inserted into the left ventricle via the left atrium and inflated to 5–10 mmHg end-diastolic pressure, mimicked isovolumetric conditions while minimizing myocardial damage. Pressure derivatives (dp/dt max/min) served as surrogate metrics for myocardial contraction and relaxation.
2.7. Post-Reperfusion Organ Assessment
Ischemia–reperfusion injury (IRI) was assessed after reperfusion by slicing hearts into 1–2 mm sections, staining with 1% 2,3,5-triphenyl-tetrazolium chloride (TTC) in saline for 30 min, and fixing with 10% formaldehyde. Infarct areas were visualized using a stereomicroscope (Bresser Advance ICD, Rhede, Germany) equipped with a camera (Levenhuk M800 plus, Tampa, FL, USA) and quantified via planimetry software (LevenhukLite, v. 3.7, Tampa, FL, USA). Infarct size was expressed as the ratio of light (infarcted) to total areas. Hearts without rhythm after preservation were excluded from IRI analysis.
2.8. Data Analysis
Proprietary software LabChart ver. 8.1 (ADInstruments, Dunedin, New Zealand) was used to collect data from sensors integrated into the Langendorff rig. Raw data were exported from LabChart as .txt files and analyzed using open-sourced R statistical software ver. 4.3.1 (Vienna, Austria) [
35]. Data analysis was harmonized across all observations using an identical approach for data processing (R script can be provided upon request). Briefly, heart rate, coronary flow, pressure and its derivatives were calculated by determining local parabola maxima followed by estimation of moving averages (within ±5 s intervals) where applicable. Integral P(t) was approximated as the area under the entire 60-min data (area under the curve, AUC).
Descriptive statistics included mean ± SE for normal distributions and medians (Q1, Q3) for non-normal data. Dichotomous data were analyzed by Fisher’s exact test while continuous data were analyzed using ANOVA. Welch’s or Student’s (fed by common SD) t-tests were used for post hoc pairwise comparisons, with variance homogeneity assessed by Bartlett’s test and data distribution by Shapiro–Wilk test. All multiple pairwise comparisons were adjusted using Holm’s correction based on the number of comparisons. All tests were performed between subjects using two-tailed hypotheses. Cohen’s d-values were calculated as the difference between group means divided by the pooled standard deviation. Principal component analysis (PCA) was used to visualize and measure distances between groups in a 2D plot, and the resulting distance matrix was analyzed using permutational ANOVA (PerMANOVA) to derive p-values. Results were presented as boxplots or barplots, depending on data distribution. A significance level of p < 0.05 was used throughout.
Statistical power estimation was performed either by generating random samples with predefined means and SD followed by Student’s t-test, or using tests of proportions for binomial distribution for continuous and dichotomous data, respectively. To facilitate independent data analysis, we deposited all raw data in an external repository BioStudies (accession number S-BSST2120). The deposited archive includes detailed descriptions for navigating the raw data files as well as .txt files for two independent experiments.
3. Results
3.1. Preliminary Organ Assessment
Within the stabilization period (marked as 2 in
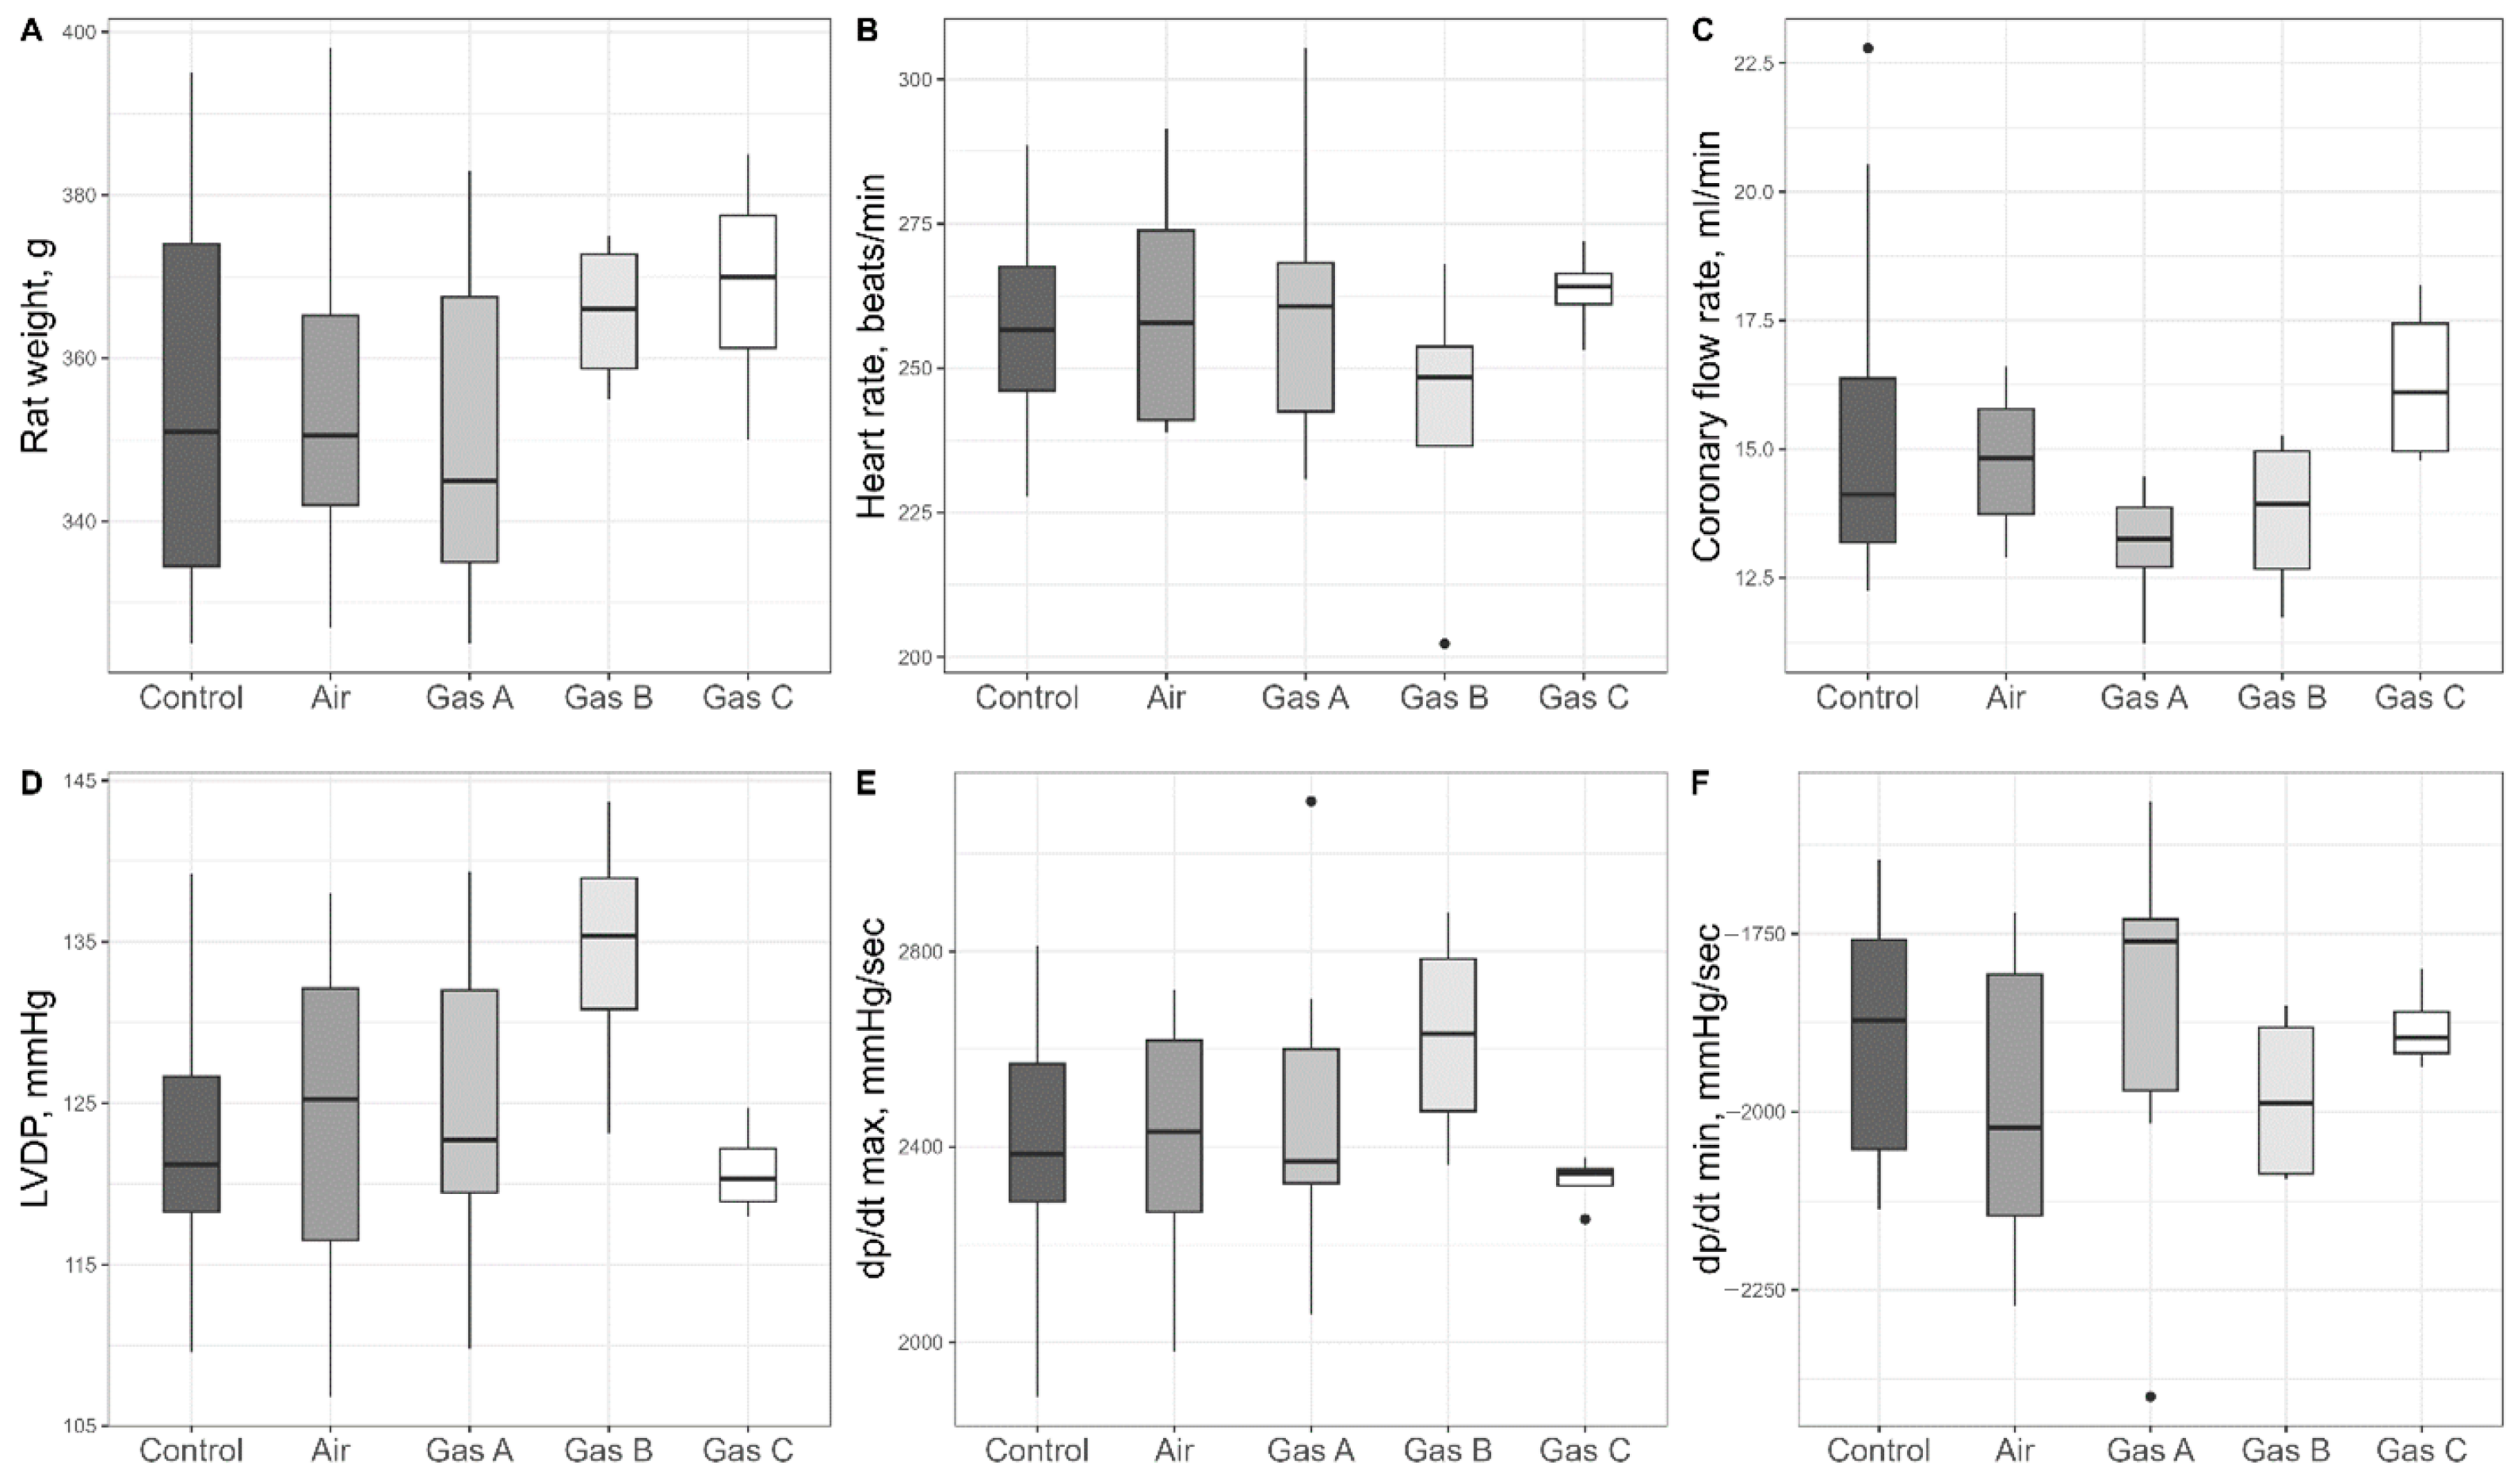
Figure 2), we assessed initial parameters of the organs included in the study (
Table S1 with selected parameters plotted in
Figure 4); more than a dozen parameters were statistically compared, with no distinctions (
p > 0.05).
3.2. Number of Hearts Successfully Resuscitated
To address the presence of non-beating hearts after reperfusion, we analyzed the resuscitation ratios post-preservation.
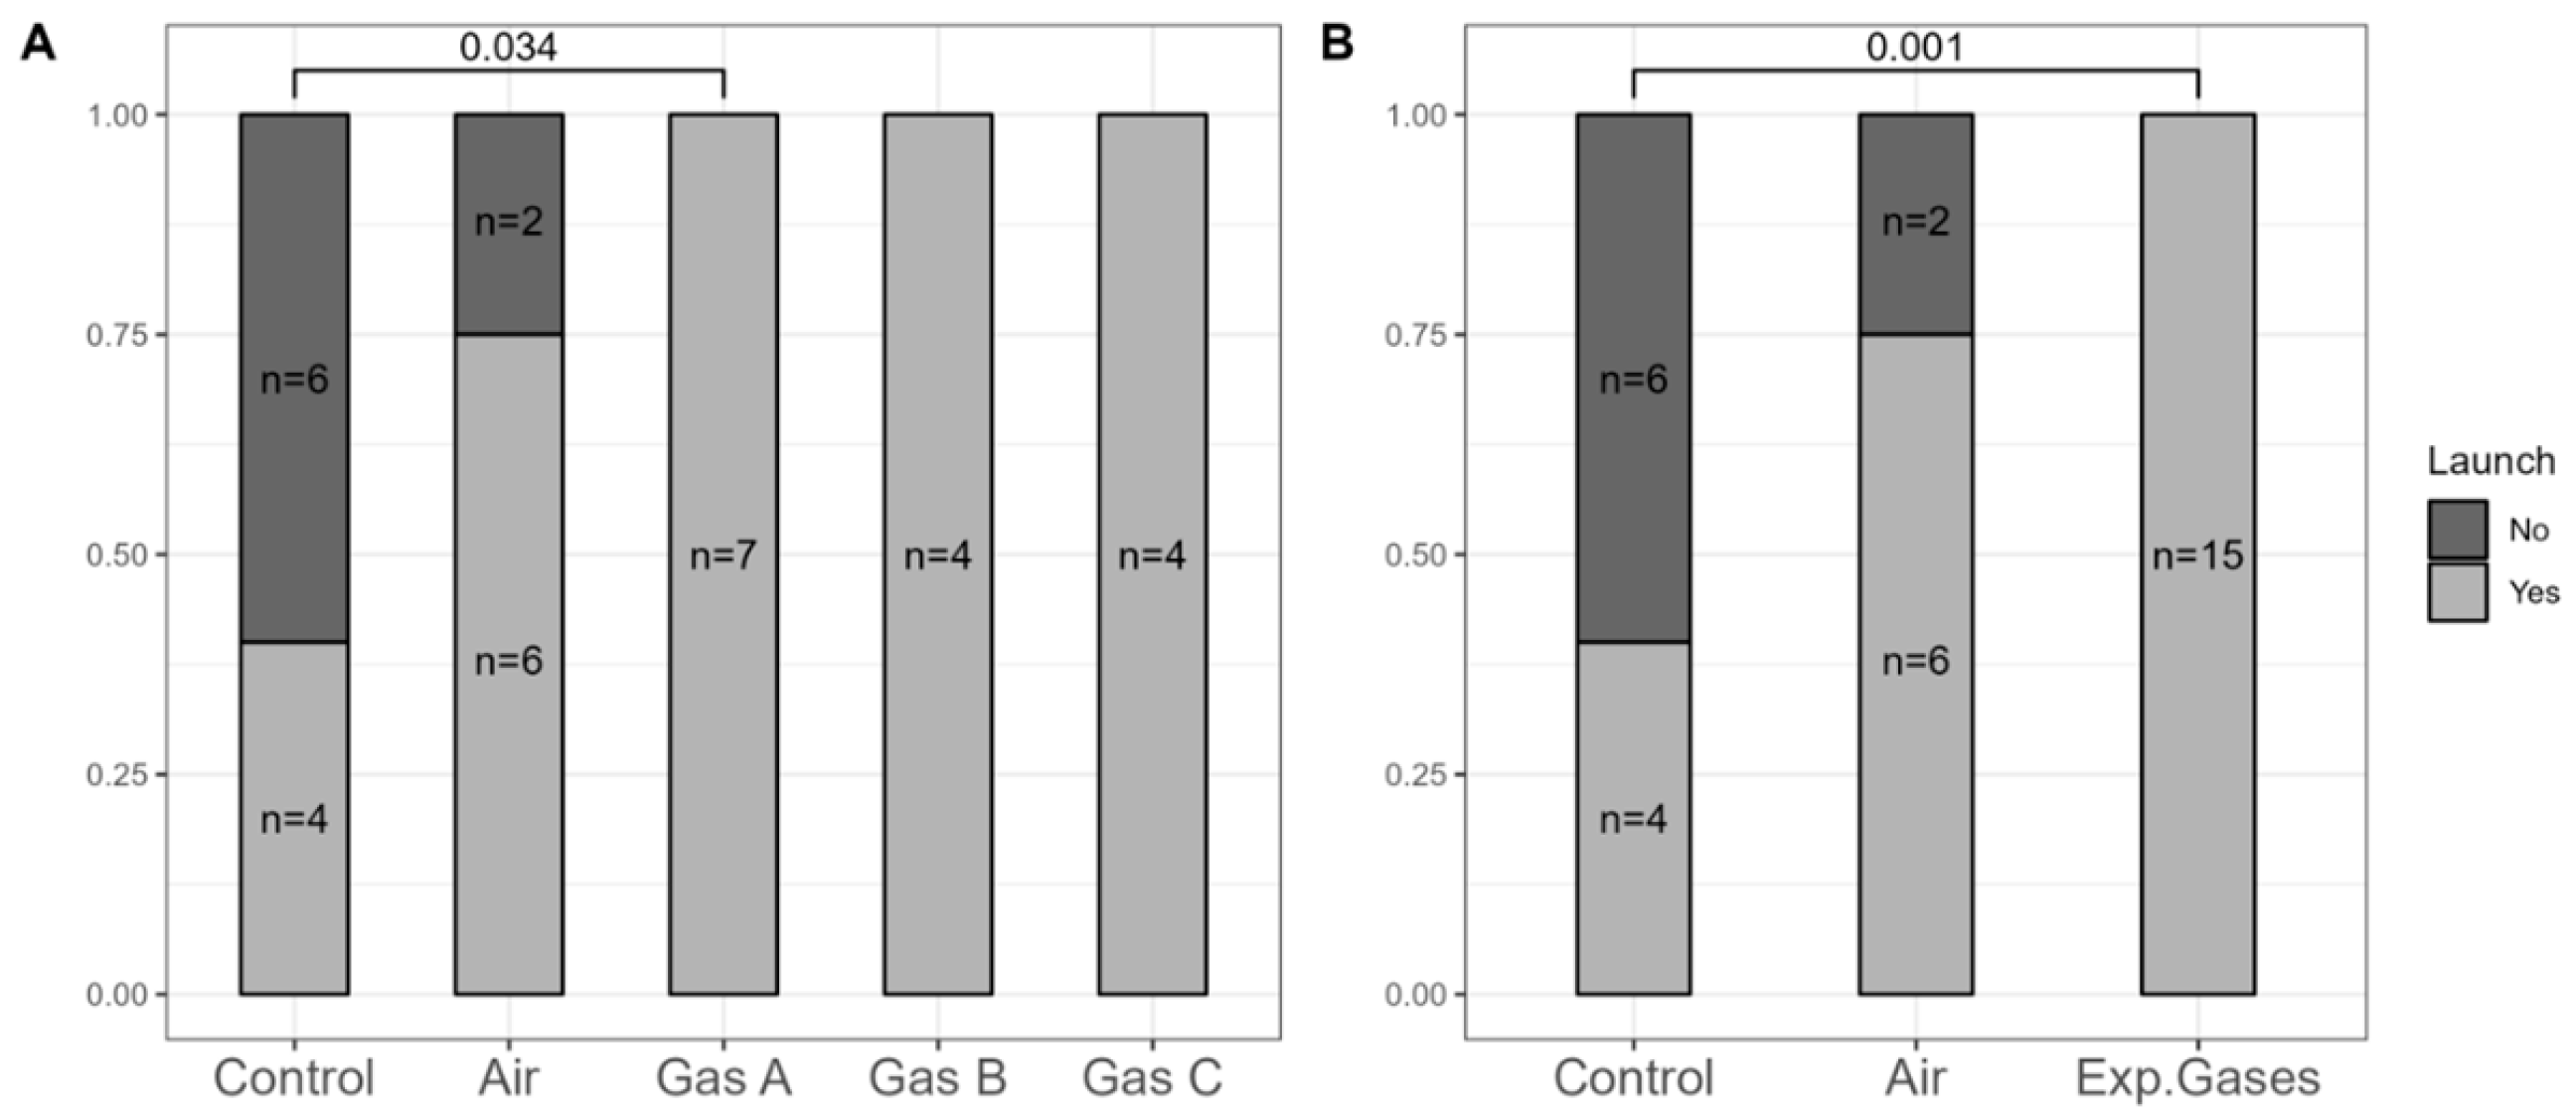
Figure 5 shows the separation and aggregation of the experimental groups (Gases A, B, and C). For a more robust analysis, we combined all experimental gases into a single (pooled) group, reducing the
p-value further—a reasonable step given that they only differed by Xe:O
2 ratios.
All 15 hearts in the experimental groups were successfully resuscitated, compared to only 4 of 10 in the Control group and 6 of 8 in the Air group. Significant differences were noted between the Control group and Gas A (p = 0.034), with even greater significance (p = 0.001) when using the combined experimental gases variable.
3.3. Assessment of Organ Kinetics
We selected heart rate (HR), coronary flow rate (CFR), and the isovolumetric pressure developed by the left ventricle (LVDP) as direct measures of organ viability that reflect hemodynamics (
Figure 6A–C). Significant differences were predominantly observed in HR (ANOVA, df1 = 4, df2 = 17, F = 5.82,
p = 0.004) and LVDP (ANOVA, df1 = 4, df2 = 17, F = 6.37,
p = 0.003) across the groups. We suggest that reporting Cohen’s d values allows readers to better estimate whether the differences between groups are biologically impactful. Therefore, we report these effect sizes alongside
p-values. Following conventional guidelines, values greater than 0.5 are considered to denote a large effect size.
Gas C recorded the highest HR (229 ± 6 bpm), followed by Gas B (226 ± 13 bpm), with Gas A showing a decline (191 ± 17 bpm), though differences among experimental gases were not significant (p > 0.05). HR for the Control and Air groups were 131 ± 11 bpm and 164 ± 21 bpm, respectively, with significant differences noted between Air and Gas B (Cohen’s d = 1.39, p = 0.015), Air and Gas C (Cohen’s d = 1.56, p = 0.01), and Control vs. all experimental gases (Cohen’s d > 2.1, p < 0.03). The largest differences were observed for Gas B vs. Control (Cohen’s d = 3.97, p = 0.001) and Gas C vs. Control (Cohen’s d = 5.56, p = 0.001).
LVDP comparisons showed a similar trend, with an additional significant difference between Air and Gas A (Cohen’s d = 1.55, p = 0.011). LVDP values were 31 ± 5 mmHg, 45 ± 9 mmHg, 74 ± 6 mmHg, 73 ± 7 mmHg, and 71 ± 6 mmHg for Control, Air, Gas A, Gas B, and Gas C, respectively. Pairwise comparisons revealed difference among Control vs. all Gases (Cohen’s d > 3.2, p < 0.003) and Air vs. all Gases (Cohen’s d > 1.4, p < 0.02)
CFR (
Figure 6B) showed no significance (ANOVA, df1 = 4, df2 = 17, F = 1.52,
p = 0.24) but one significant difference on post hoc pairwise comparison: Control vs. Air (8.51 ± 1.37 mL/min vs. 5.98 ± 0.48 mL/min, Cohen’s d = 1.3,
p = 0.029). Experimental gases had intermediate CFR values—6.64 ± 0.61 mL/min, 6.91 ± 0.94 mL/min, and 6.4 ± 0.35 mL/min for Gases A, B, and C, respectively—higher than Air but lower than Control.
The P(t) integral, a measure of overall kinetics that combines developed pressure and heart rate, was used to assess cardiac performance during reperfusion (
Figure 6D). The P(t) integral mirrored the patterns observed for LVDP. One-way ANOVA revealed a significant overall effect (df1 = 4, df2 = 17, F = 7.53,
p = 0.001). The values were as follows: Control (3168 ± 657), Air (6652 ± 1912), Gas A (12,077 ± 1715), Gas B (13,787 ± 1165), and Gas C (12,056 ± 1357). Cohen’s d values also highlighted significant differences. They were 3.4 (Control vs. Gas A,
p = 0.001), 5.6 (Control vs. Gas B,
p < 0.001), 4.2 (Control vs. Gas C,
p = 0.002), 1.3 (Air vs. Gas A,
p = 0.02), 1.8 (Air vs. Gas B,
p = 0.004), 1.3 (Air vs. Gas C,
p = 0.02).
3.4. Infarct Area
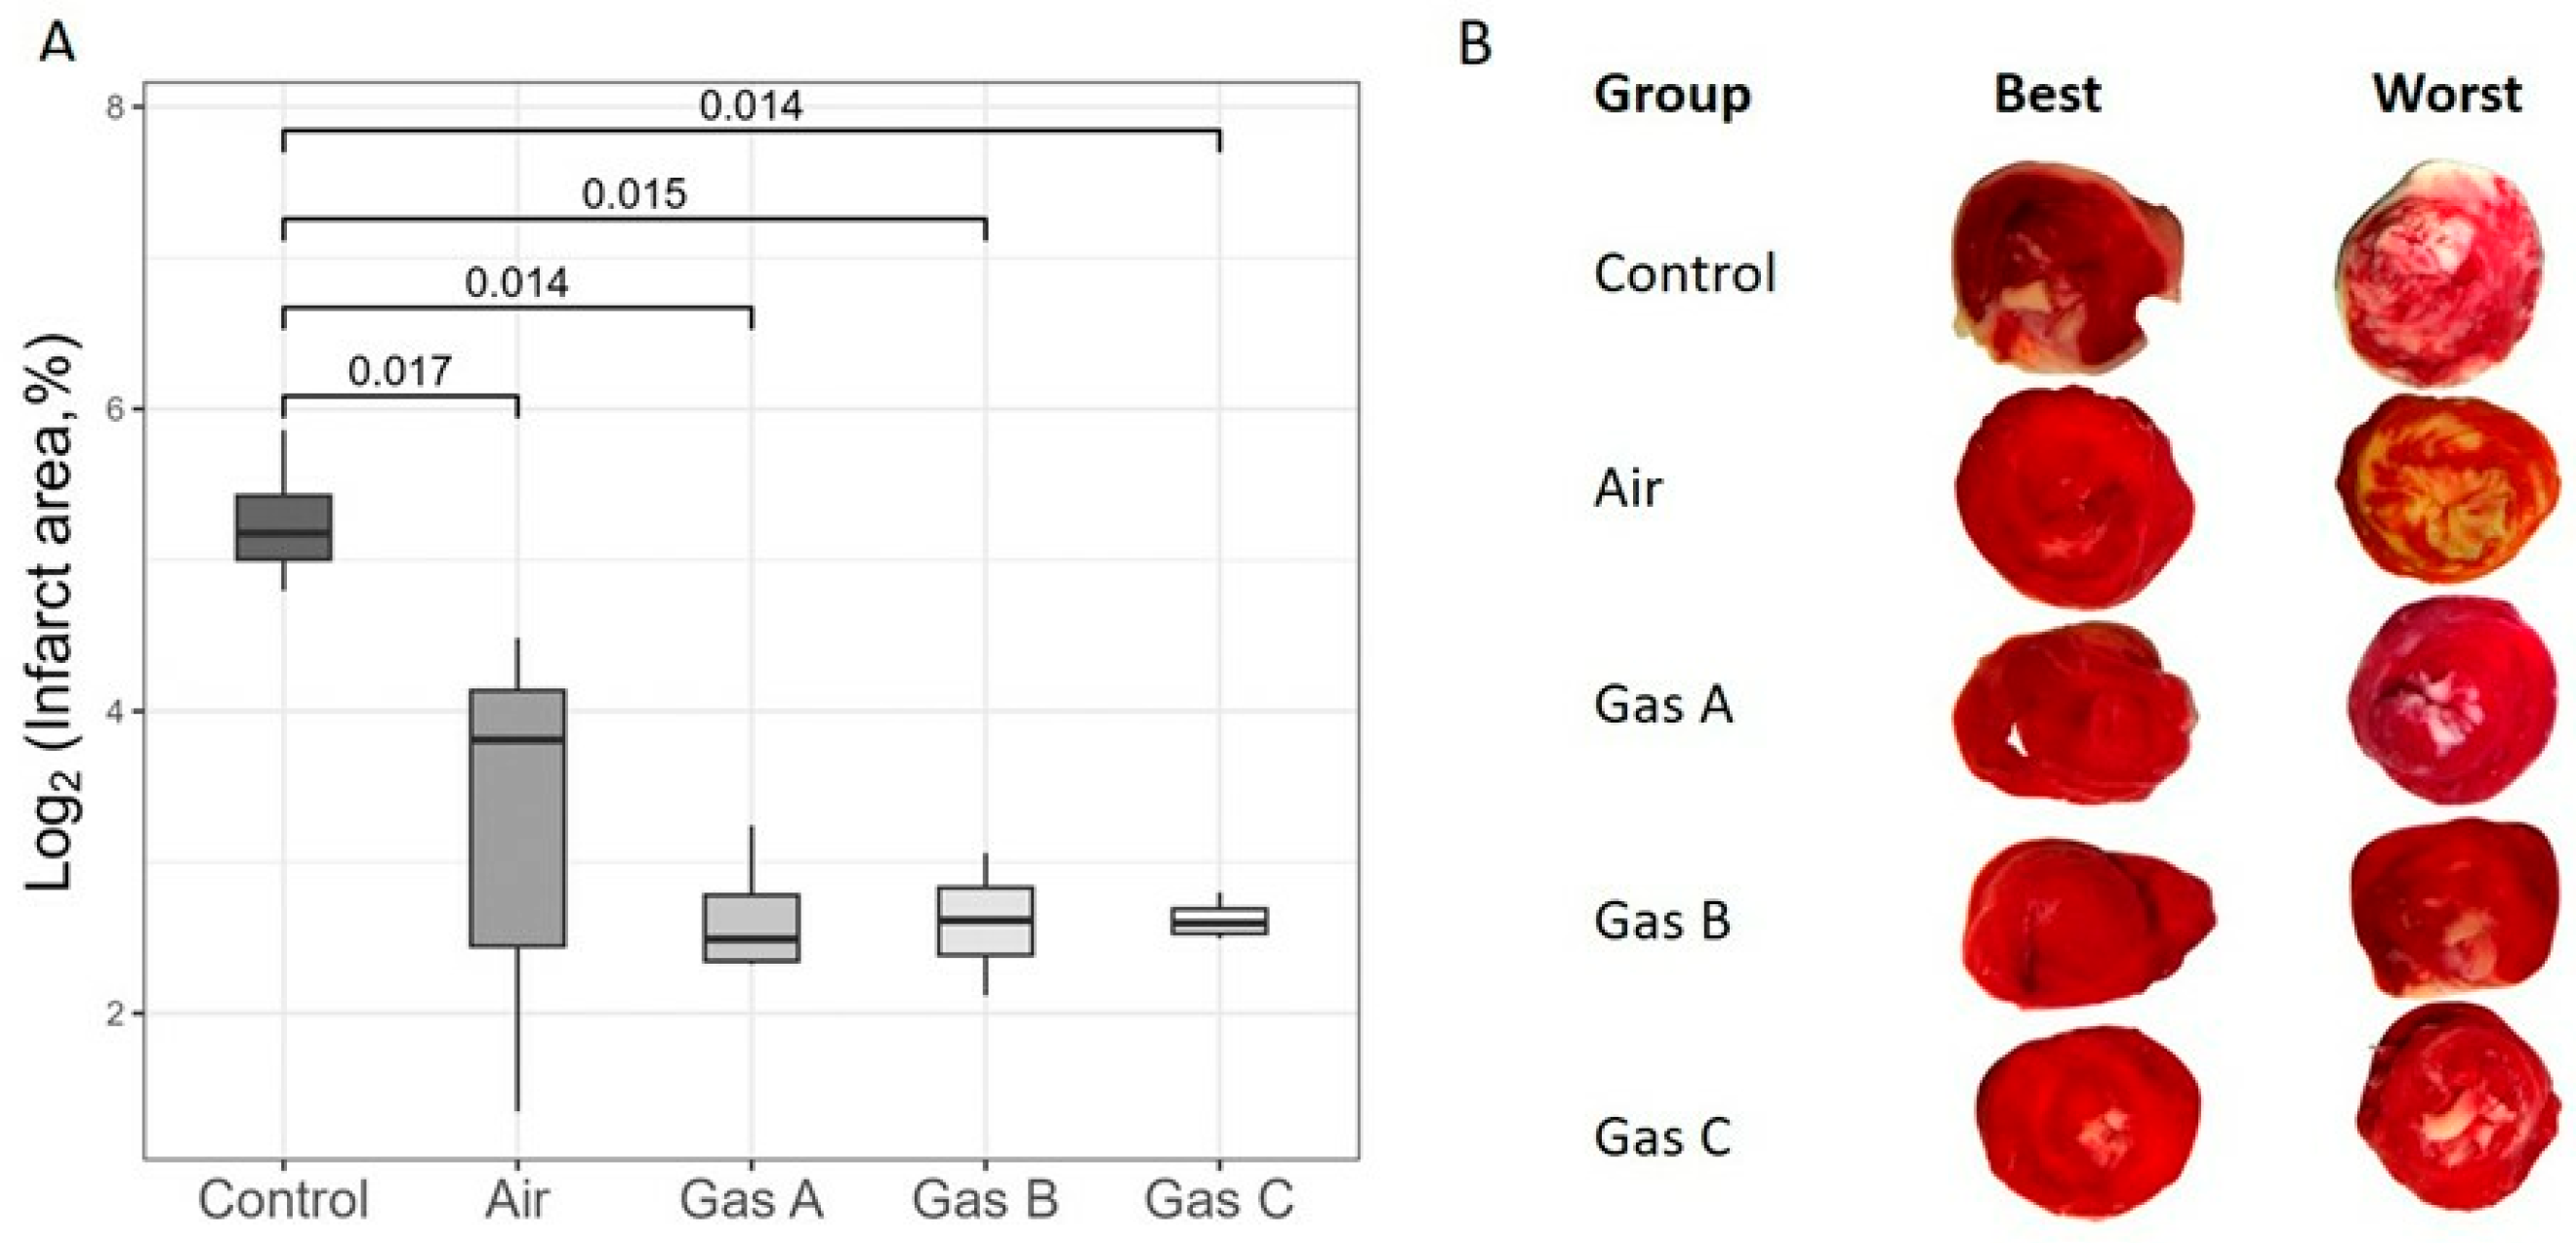
To assess IRI, we calculated the infarct size of organs immediately following a 1-h reperfusion period (
Figure 7). Due to a substantial
y-axis disparity between the Control and Experimental groups, a log2 transformation was applied for visual clarity (
Figure 7A), although we focused on the untransformed data in the text.
Infarct size estimations aligned with the organ kinetics trends, revealing significant differences between the Control and all other groups, including Air (Cohen’s d > 2.6, p ≤ 0.017 for all comparisons). So, Control vs. Air pair showed p = 0.017 (Welch, t = −3.69, df = 4.49, Cohen’s d = 2.6), Control vs. Gas A detected p = 0.014 (Welch, t = 4.99, df = 3.15, Cohen’s d = 3.5), Control vs. Gas B revealed p = 0.015 (Welch, t = 5.04, df = 3.1, Cohen’s d = 3.6) and Control vs. Gas C pair displayed p = 0.014 (Welch, t = 5.09, df = 3.01, Cohen’s d = 3.6). However, no significant differences were observed among Air and the experimental gases. Raw percentage values were 12.6 ± 3.3% (Air), 6.4 ± 1.1% (Gas A), 6.3 ± 0.9% (Gas B), and 6.2 ± 0.3% (Gas C), while Control values were markedly higher at 39.6 ± 6.6%, supporting the derived p-values and d-values.
Each tissue slice was analyzed to highlight qualitative differences and identify the best and worst outcomes.
Figure 7B depicts transverse sections, arranged dichotomously and in groups. As expected, the worst cases were observed in the Control group, with infarct areas clearly distinguishable from all experimental groups, including Air due to the clearly visible ivory margins of varied thickness on all revived and 1-h reperfused hearts. It is worth noting the special attention required for the visible white areas representing the sites of papillary muscles on all the worst slices across experimental groups. This effect may be an artifact of the Langendorff technique, as the placement of a polyethylene balloon within the left ventricle can induce myocardial damage.
3.5. Surrogate Measures and Parallel Evaluation of Batched Variables
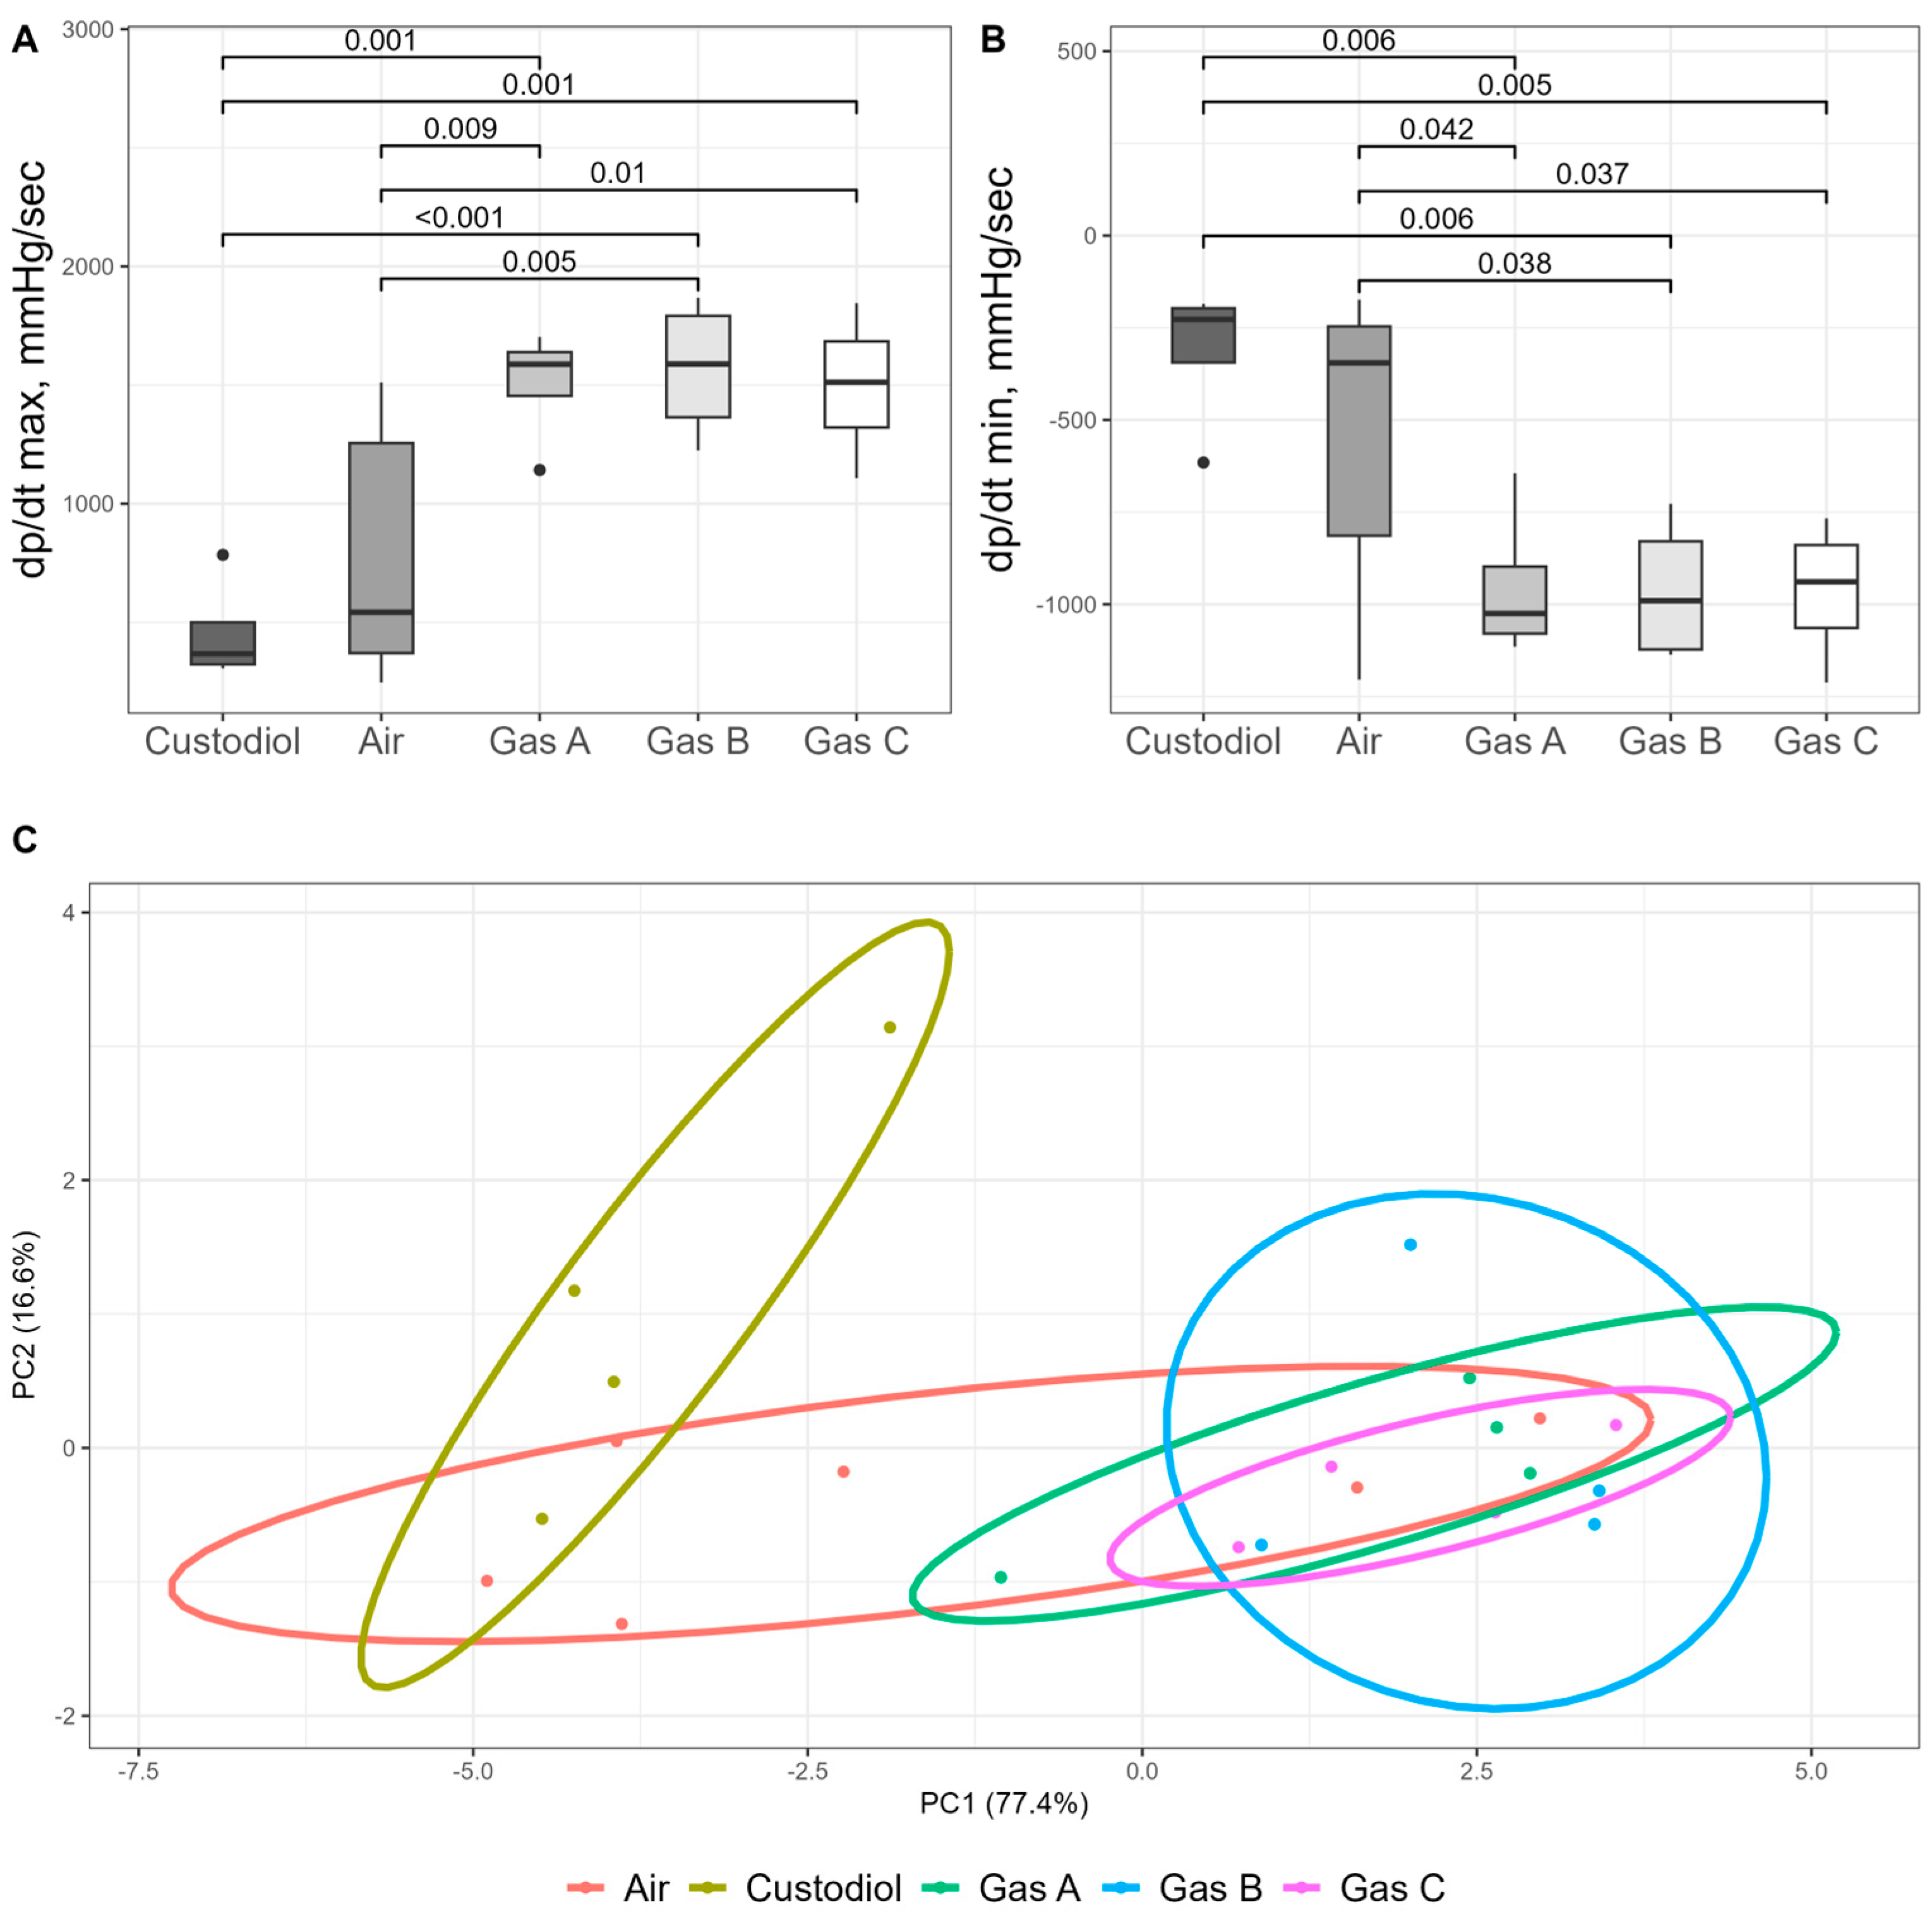
Surrogate measures of organ kinetics dP/dt max and dP/dt min (mmHg/s), followed the overall trends observed in other functional parameters. Statistical significance (p < 0.05) for these metrics aligned with earlier findings.
For dP/dt max, a measure of the heart’s contractile ability (
Figure 8A), one-way ANOVA revealed a significant main effect (df1 = 4, df2 = 17, F = 7.51,
p = 0.001). Post hoc analysis showed that values increased substantially across the experimental groups compared to the Control (456 ± 111), in the following order: Air (775 ± 231), Gas C (1494 ± 159), Gas A (1505 ± 125), and Gas B (1567 ± 151). All experimental gases demonstrated differences with both Control (Cohen’s d > 3.8,
p < 0.001) and Air (Cohen’s d > 1.5,
p < 0.01). Conversely, dP/dt min, which reflects the heart’s ability to relax, also showed a significant overall difference (ANOVA, df1 = 4, df2 = 17, F = 4.61,
p = 0.01) but followed an inverse trend (
Figure 8B). Exact values were −314 ± 102 (Control), −542 ± 175 (Air), −952 ± 106 (Gas A), −961 ± 100 (Gas B), −964 ± 97 (Gas C). Significant difference followed similar trend: all experimental gases vs. Control (Cohen’s d > 3.1,
p < 0.006) and vs. Air (Cohen’s d > 1.1,
p < 0.04).
One of our objectives was to identify the optimal gaseous mixture (A, B, or C) by evaluating all parameters in a blind, unbiased manner. To this end, Principal Component Analysis (PCA) was conducted (
Figure 8C) using normalized values for HR, CFR, LVDP, derivatives, AUC, and infarct size.
The PCA plot represents data on a two-dimensional scale, with the X and Y axes accounting for over 90% of the variance. The plot reveals three distinct clusters: the Control group on the far left, partially overlapped by the Air group, which, in turn, intersects with the experimental groups (Gases A, B, and C). The experimental groups form aggregated but visually distinct clusters. Euclidean distances were calculated and compared across all observations, yielding significant differences between the Control and experimental groups (
p < 0.04 for all comparisons). The Air group, as expected, showed no significant differences when compared with either the Control or experimental groups, reflecting partial cluster overlaps. Detailed PerMANOVA output with summary of test statistics is shown in
Table S2.
4. Discussion
Previous research on gaseous organ perfusion, or PSF, has focused primarily on the liver, pancreas, and heart, establishing its utility in organ reconditioning and storage [
15,
18,
21,
22,
24,
36]. These methods typically involve perfusing organ vasculature with a gaseous mixture (or pure O
2) under a pressure differential, while the organ is immersed in saline or preservation media. In this study, we demonstrated a novel HIPPER approach, which uniquely employs elevated gaseous pressure within a sealed chamber as the sole driver of a closed PSF circuit. This method excludes fluidic preservation media and is integrated into a semi-automated rig.
The core hypothesis of the HIPPER method is that the oxygen-rich microenvironment in a capillary creates a steep O
2 gradient in the surrounding myocardium, which facilitates efficient oxygen diffusion into cells, thereby preventing the shift to inefficient, acidifying anaerobic metabolism. Calculations of O
2 molarity in an 90 fL capillary volume (capable of holding one red blood cell), based on known data [
37,
38], demonstrate that even at atmospheric pressure, the number of O
2 molecules in gas is almost 10 and 100 times higher compared to blood and to water (note, that SCS is based on aqueous preservation solutions), respectively. Considering that gas diffusion rates are four orders of magnitude higher than in liquids [
38], the difference in gas exchange efficiency between gas and liquid becomes enormous.
Likewise, of crucial importance was the need to consider adjuvant gases because of the ambiguous role of pure oxygen as a sole fuel for HIPPER. To date, numerous gaseous modalities are known which modulate multiple steps within cell signaling cascades. These can be divided into gasotransmitters (including nitric oxide, hydrogen sulfide, sulfur dioxide, and carbon monoxide) and noble gases (such as argon, helium, and xenon (Xe)) [
26]. We chose Xe as an adjuvant gas because it exerts modulation at various biological levels. For example, Xe has demonstrated organ and tissue protection, including greater recovery of left ventricular systolic function when combined with hypothermia [
39]. Likewise, Xe acts on molecular levels; PKC-Ɛ serves as a key mediator of xenon-induced cardioprotection [
40], and further downstream, Xe regulates p38 MAPK and MAPKAPK-2, linking its preconditioning properties to the regulation of the cardiac cytoskeleton and actin stress fibers via HSP27 [
41]. Our preliminary experiments using Xe:O
2 mixture demonstrated promising results. Hearts preserved under high-pressure gaseous perfusion remained viable and exhibited sustained beating after heterotopic transplantation to the abdominal aorta, unlike control, where no activity was observed even after electrical stimuli [
File S1].
Based on these findings, a rigorous experimental plan was developed prioritizing well-defined control parameters and clinical relevance and minimizing confounding variables. To ensure robust analysis, we included an Air group to serve as a “semi-control,” enabling differentiation of effects from supplemental gases like Xe or its synergetic interaction with O
2. We also standardized measurements using the Langendorff technique. One of the undeniable advantages of this technique is the decades of experimentation it provides. This includes the harmonization of individual elements such as left ventricular ballooning, the use of standard buffers (e.g., Krebs–Henseleit solution), and the pre-experiment stabilization phase for the heart. The clear benefit of this standardization is the strict control of experimental conditions, minimizing potential confounders that could impact the outcomes. Despite the Langendorff method developed over 120 years ago, it has continuously evolved to include new metrics and modes, solidifying its status as the standard for acute preliminary experiments in animal models [
42,
43]. We also applied a blind, algorithmic protocol for analyzing data. This approach aimed, first of all, to compare all experimental gases and find out whether a specific gas composition is particularly beneficial with a focus on Xe:O
2 mixtures varied in their gas ratios.
All experimental gases demonstrated superior performance compared to both Control and Air, suggesting that both the Xe additive and its interaction with O
2 contribute to preservation efficacy. AUC and pressure derivatives correlated closely with HR and LVDP, indicating consistent trends. The estimated infarct area size generally aligned with these results, with control hearts exhibiting the largest infarct areas, experimental gases showing the smallest, and Air group falling in between. To justify potential concerns regarding sample size, we point out that the design of the present study followed a proof-of-concept principle, and thus a small sample size was approved by our local ethical committee (described in methods). We also highlight the asymmetry of statistical inference, meaning the difference is considered established once statistical significance is achieved. Furthermore, a rigorous, standardized data analysis algorithm not only revealed statistically significant differences between the Control and HIPPER groups but also demonstrated the superiority of HIPPER. It was indicated by the large Cohen’s d values, which highlighted the magnitude of these differences. To further address potential reproducibility concerns, we calculated the statistical power of the present study and conducted a second validation experiment using a selected pair (Control vs. Gas B) after the necessary time gap for breeding and raising new rats. Consistent trends were observed in this replication (see
Appendix A).
Heart resuscitation results revealed significantly fewer successful launches in the Control group compared to all experimental gases. Two hearts in the Air group also failed to beat. Although a sample size of four animals per group was initially deemed sufficient to demonstrate the HIPPER concept, only one of the four hearts in the Control group was successfully stabilized. Consequently, the number of animals was adjusted to ensure that an adequate number of hearts completed the 1-h reperfusion period, which was essential for assessing cardiac kinetics. Ultimately, only four out of ten hearts in the Control group were resuscitated raising concerns about both two cardioplegias and the six-hour preservation period in HTK. We extensively discuss the limitations of it in corresponding section below. Although potential shortcomings of these limitations exist, exactly similar conditions (including the equal storage time) across all study groups justify the conclusions of this study.
The secondary goal was to identify the optimal gas composition in a blind manner by comparing all metrics simultaneously. Therefore, we intentionally avoided a common trait/character matrix approach and instead deployed PCA. This analysis also yielded consistent results, yet it showed complications upon differentiation between the experimental and air clusters. This could partly be attributed to the well-behaved organs. These organs exhibited noticeable but not distinctly superior benefits across other kinetic variables as well. It can be attributed either to quality of those organs themselves or optimal gas distribution within them. Therefore, methods for measuring gas flow properties may be of special importance. For instance, valves could be calibrated to release excess gas once the desired pressure is reached in the aortic bulb, or other algorithmic approaches can be implemented. Nonetheless, the minimum pressure threshold in organ vasculature has yet to be determined, likely contingent upon organ anatomy. In this study, the pump protocol was tailored to the organ’s requirements and set a priori to operate intermittently (1 s every 2 min), which maintained the pressures in the aortic bulb below 100 mmHg.
Noteworthy, three out of seven hearts in Gas A group were inadequately preserved on occasion. With a 9:1 Xe:O
2 ratio, Gas A contained sufficient Xe to form gas hydrates (clathrates) within the organ, provided appropriate thermobaric conditions were met [
44]. These conditions were easily achieved with a three-bar pressure of the gaseous mixture and storage temperature maintained near 1 °C [
Figure S2]. Despite their iced appearance reflecting formation of Xe-water clathrates, these three clathrated organs were able to regain function and beat within one hour upon Langendorff reperfusion, albeit depressive. This was in stark contrast to the lack of rhytm observed in the six hearts preserved using HTK-SCS. Nevertheless, we excluded them from assessment of organ kinetics.
Although gas bubble (embolism) formation is a potential concern persisting among clinicians, a systematic investigation of it during Langendorff reperfusion was beyond the scope of this study. Since it focused on the feasibility of the HIPPER method itself. Nevertheless, we propose at least three mechanisms that might account for their removal: self-dissolution, capillary force, and the Bernoulli effect. Due to the technical complexities involved in such measurements, we considered this a separate research question requiring dedicated hypothesis testing. Future investigations could employ precise gravimetric analysis (comparing heart weights pre- and post-reperfusion) or quantify residual insoluble gas tracers following HIPPER. Regardless of the outcome of such experiments our findings substantiate HIPPER’s therapeutic potential, even if gas bubbles remain.
Further optimization of technical precision—particularly in valve sealing and gas delivery protocols—would improve therapeutic outcomes and enhance the translational relevance of the method. Crucially, such refinements are essential to convince clinicians of its adoptability in real-world practice. The implementation of a disposable sealing circuit and an automated pressure control system, which standardizes compression and decompression steps, would allow for the accurate a priori setting of these parameters and reduce the failure rate. This integrated solution, if designed to be neither complex nor bulky, would present a more compelling alternative to SCS, offering comparable convenience with improved quality.
In conclusion, this study evaluated the efficacy of the HIPPER approach and demonstrated its adaptability to various O
2 concentrations. A key question arising from our findings pertains to the necessity and optimality of supplemental gases. We incorporated the well-studied Xe gas as an additive, given its established benefits in organ protection [
25]. Numerous studies have elucidated its mechanisms at subcellular, biochemical, and molecular levels, confirming its utility in protecting against IRI [
32]. While this proof-of-concept study did not delve into the underlying mechanisms, the compelling results suggest that conducting omics studies would be a logical next step to further explore and understand the observed effects. Specifically, spatial transcriptomics could be deployed across various regions of preserved hearts to reveal specific gene expression signatures, followed by gene set enrichment analysis to identify pathways that are significantly over-represented (or underrepresented) in particular preservation methods, whether gaseous or SCS [
45]. Similarly, metabolomics studies could provide valuable data on compounds involved in various cell death pathways, helping establish distinct patterns among differently preserved hearts [
46]. Additionally, targeted molecular studies would offer insights into specific mechanisms while remaining rapid and cost-effective. In this context, qPCR analysis of ALOX15 or lactylation-related genes (AMPD2, PYGL, SLC7A7, SAT1) might provide preliminary insight on mechanisms of myocardial alteration during storage [
46,
47].
