1. Introduction
In the past decades, Thailand has experienced impressive social and economic development which has allowed its economy to become the second-largest in Southeast Asia. With its sustained growth and successful poverty reduction, the population’s energy demand is increasing as well [
1]. In the past 10 years, annual residential electricity consumption has risen by 54%p to 38.500 GWh in the provinces [
2]. This trend was further amplified by COVID-19 when it rose extraordinarily by 6% to 9% on a year-on-year basis between 2018 and 2021 [
2]; see
Figure A1 in
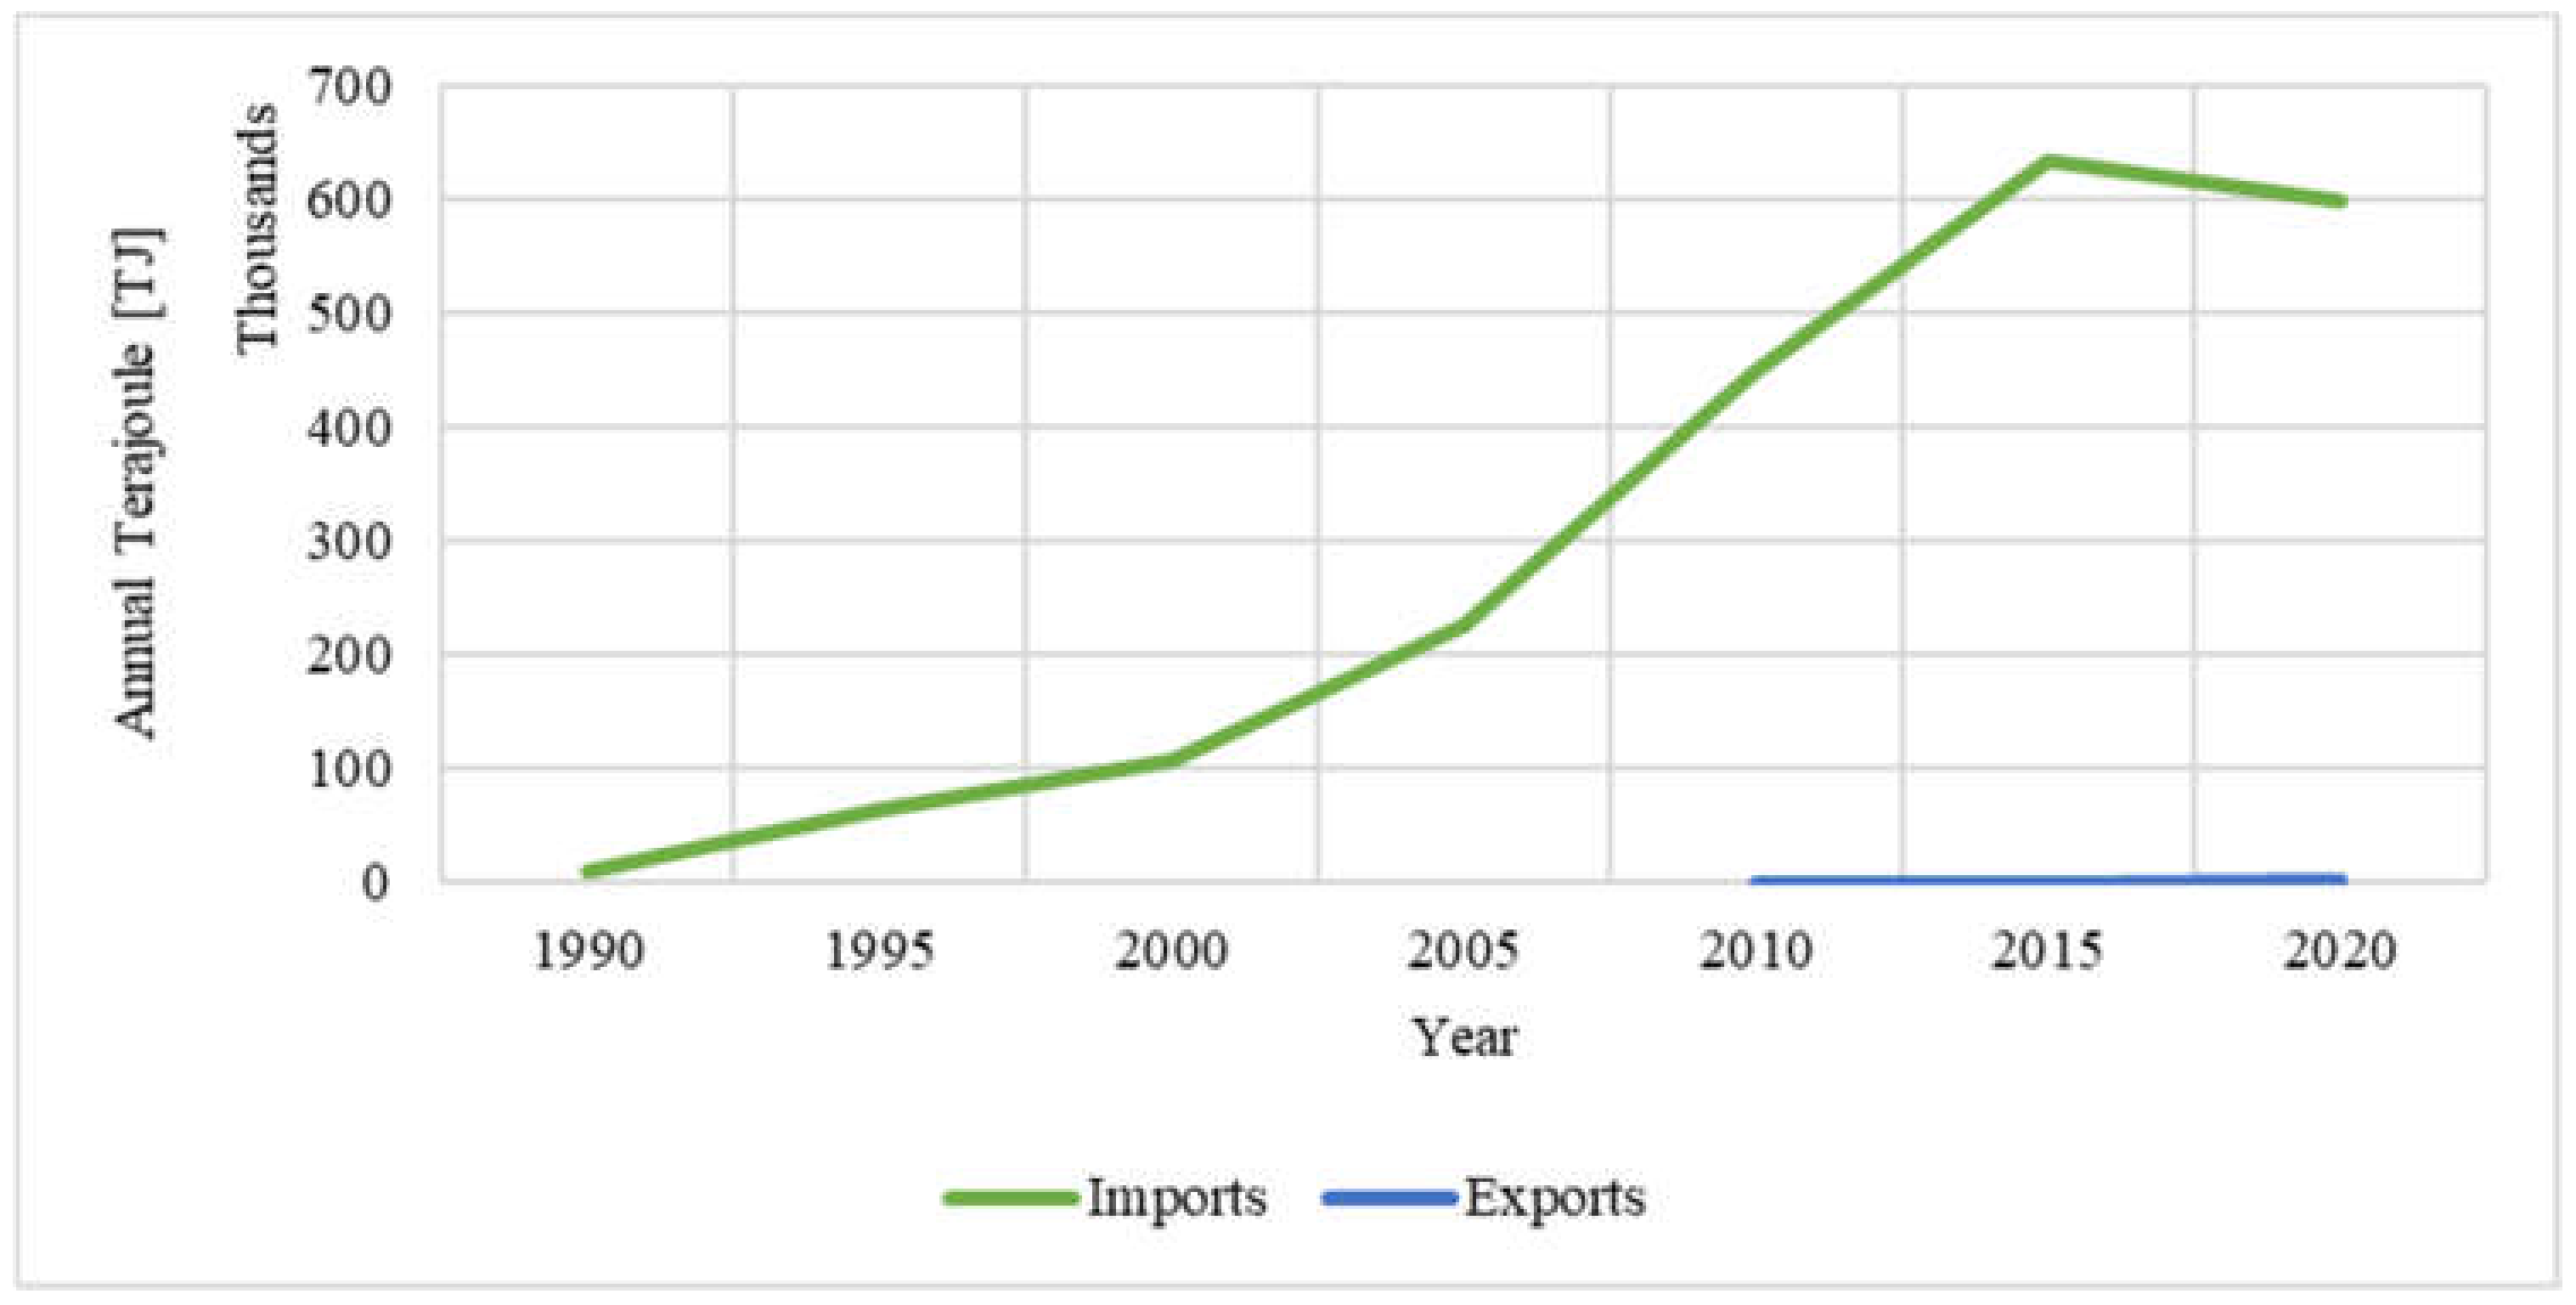
Appendix A. These increasing demands are mostly satisfied by higher fossil fuel production and imports, of which the latter has risen tenfold since 2009; see
Figure A2 in
Appendix A [
3]. As a result, carbon emissions increase, which negatively affects the environment and people’s health [
1]. Apart from an ecological perspective, these strong dependencies on other countries, political market risks, and the above-mentioned rising demand threaten Thailand’s energy security and resilience [
3,
4]. Specifically in the past two years, the interlocking disruptions in global supply chains, Russia’s invasion of Ukraine, increasing global fuel and LNG prices, and the adverse effects of the COVID-19 pandemic demonstrate that such energy market dependencies can severely jeopardize a country’s economy and its people’s overall well-being. Driven by these risks and further motivated by international agreements such as Paris 21 and the Sustainable Development Goals, the Thai government has set its focus on increasing the energy system’s resilience with locally produced, clean energy [
5]. One of its tactics is to support communities to become electricity prosumers by producing and utilizing small-scale renewable energy technologies (RET); see Tactic 2.1 in the Alternative Energy Development Plan [
5]. Specifically for remote areas, renewable energy systems (RES) should be developed, awareness raised, and supporting policies designed [
5].
However, planning resilient RES is demanding: The choice and size of RETs are dependent on the geographic and climatic conditions, technological possibilities, and cognitive capacities at the site. Crucial information, such as detailed electricity demands, is often lacking in developing countries. Future price developments, RET efficiency, and consumption further influence the suitability of RES in the long-term and increase planners’ uncertainties. Social factors, such as including locals in the planning process, behavioral change to electricity prosumers, and ethics further influence the resilience of RES [
6]. To plan resilient RES and define policies that provide efficient and effective support, a deep understanding must therefore be provided.
Despite these needs, there is little research in the last 10 years regarding distributed RES in rural Thailand. The Provincial Electricity Authority (PEA) has conducted two simulations in rural off-grid villages. They find that RETs are an adequate, but still costly, means to secure electricity supply [
7,
8]. Others have also chosen simulation approaches and found similar results for remote areas of Thailand [
4,
9,
10,
11,
12,
13]. However, these studies often use generic technical data, omit time variations, or disregard hourly climate data. We found no study that addresses on-grid villages measuring their degree of independence through RETs and the impact of becoming prosumers. Furthermore, they often use estimated averages or outdated load demands which have great influence on the sizing, and, thus, environmental and economic impact. Only Apichonnabutr and Tiwary [
14] and Jeenthanom et al. [
13] synthesize detailed energy demand from survey data. However, due to the small sample size, these load profiles are site-specific. The high volatility of electricity prices, demands, and innovations further require new research with updated data.
Thus, we identify the research need to conduct new studies on the design of resilient RES to support the formulation of appropriate policies and promotion of RET usage in rural Thailand. We aim to answer the following research questions:
Research Question 1. How can representative detailed load profiles be created for rural Thai communities?
Research Question 2. What is a suitable design of a resilient renewable energy system for rural Thailand?
Research Question 3. Which policy measures are needed to promote the use of renewable energy technologies in rural Thailand?
To address these research questions, we simulate various RES comprising a photovoltaic system (PV), wind turbine (WT), and battery electric storage system (BESS) for a remote model community in Northeast Thailand. We use up-to-date technological and market information as well as site-specific climate and geographic time series data. To reach a sufficient level of detail on electricity demand, we evaluate the 10-year history of appliance ownership, household characteristics, and housing conditions of rural households using the representative Thailand Vietnam Socio-Economic Panel (TVSEP). We use the simulation software NESSI4D which is specifically designed for use by local stakeholders in developing countries, allows the consideration of time variations, and is available without costs for the users.
The study is structured as follows: First, the methodology and model development are presented to ensure a thorough set-up of the various simulations. We proceed by introducing site-specific climate and geographic conditions. Then, load profiles are synthesized with the software RAMP by evaluating historic data from the TVSEP. The third section presents the results and findings, followed by their discussion. Lastly, the limitations of the study are outlined before concluding the paper.
2. Methodology and Model Development
To assess a resilient RES for the Thai rural population, we simulate, compare, and interpret multiple scenarios. The simulations are carried out with the Nano Energy System Simulator for Development (NESSI4D). Over several design cycles, this multi-energy software has been specifically developed to support decision-making by in developing countries, such as policyholders, NGOs, village heads, and energy planners. Its applicability has been tested in several peer-reviewed publications as well as discussions at national and international conferences; see, e.g., Kraschewski et al. [
15] or Eckhoff et al. [
16]. NESSI4D simulates thermal and electrical energy yield of several conventional and renewable energy technologies, energy-consuming components, and two- and four-wheeled fuel-based and electrical vehicles. To allow for a sufficient level of detail, all scenarios are simulated on an hourly basis, subject to system constraints, and use realistic market and climate time series data (
Appendix C). Based on Delina et al. [
6], we consider an energy system resilient when it enhances economic feasibility, ecological sustainability, and independence from the power grid compared to the business-as-usual scenario, i.e., sole supply by the central power grid. Thus, we evaluate the simulations based on several measures: For the economic analysis, we compare the total annual costs. The software first calculates the net present value (NPV), considering investments based on future cash flows and discount rates.
where
CK = implementation costs [USD].
BK = benefits [USD].
Comk = operation and management costs [USD].
I = discount rate [%].
T = component service life [year].
K = current year.
t = project start [year].
The operation and management (O and M) costs comprise the annual fixed and variable costs. The benefits are the cost-savings through generating electricity as well as the income from feeding electricity in the power grid. NESSI4D then calculates the average annual total costs to allow for scenario comparison by using the annuity approach that spreads the calculated NPV over the project length [
15].
For the ecological analysis, NESSI4D calculates the total and annual emitted GHG per kg
CO2-eq. by the components and the power grid [
15]. The independence of the RES from the power grid is evaluated based on the degrees of autarchy (DoA) and self-consumption (DsC). The former represents the ratio of total output used through self-generation to the total demand, whereas the latter represents the ratio of output used for self-consumption to total output [
15]. As is common for energy system planning, we choose a project length of 10 years. The assessed RETs are PV, WT, and BESS. The following subsection describes the model components used for the simulation as well as the subjective energy yield calculations.
2.1. Photovoltaic System
Solar PV systems operate both grid-connected and disconnected, with bi-directional inverters allowing them to feed excess generated energy into the power grid. To calculate the energy yield, NESSI4D uses a three-step procedure. First, as the PV system can only convert energy that reaches its surface area (
EG,tilt), its value is calculated using and transforming direct (
Edir), diffuse (
Ediff), and reflected (
Erefl) solar radiation time series data as well as the location’s geographic coordinates; see Formulas (A1)–(A5) in the
Appendix B. Second, the PV system’s nominal power (
PMPP) is calculated; see Formula (3). As shown in Formula (4), the hourly energy yield (
EPV) is then obtained which is influenced by several losses, i.e., degree of pollution or shading.
where
We use monocrystalline PV modules with an installed surface area of 174 m
2 and without a tracking device. Following Chaianong et al. [
17], we choose 15% nominal efficiency and 20-year service life. As PV cells typically lose efficiency due to, e.g., irradiation, temperature, or rain, we include an annual degradation rate of 3% [
18]. Corresponding to studies conducted by IRENA [
19], the average investment and replacement costs for the PV System are set to 995 USD/kW
p with 9.5 USD/(kW
p/a) O and M costs. Due to the fast-changing costs of RETs, we further assume an annual decrease in installation costs of −4%.
2.2. Wind Turbine
The total power produced (P
wind) by a WT depends on the velocity of the wind speed flowing through the rotor swept area. As wind speeds are typically measured with an anemometer whose height does not necessarily correspond to the WT’s hub height, NESSI4D first calculates the wind speed at hub height (
vhub).
where
van = wind speed at anemometer height [m/s].
zan = installation height of the anemometer [m].
zhub = hub height [m].
srl = the surface roughness length [m].
Specific for each WT is its power curve which is presented in Formula (4). The WT starts working when the wind speed reaches an amount equal to or higher than its cut-in wind speed (
vci). The amount of generated electric energy rises exponentially until it reaches the WT’s rated wind speed (
vr), see Formula (7). At rated wind speeds, the WT produces rated power (
PWT,rated). At the cut-out wind speed (
vout), the WT turns off to avoid destruction.
where
Cp = coefficient of power [%].
srl = surface roughness length [m].
AWT = wind turbine’s rotor-swept area [m2].
ρ = air density [kg/m3].
ηWT = efficiency [%].
For our model, we choose a 10 kW WT with a service life of 20 years and technical specifications based on a design for low wind speeds [
20]. Thus, the hub height and rotor radius are 24 m and 3.5 m, respectively. We set the cut-in wind speed at 2.4 m/s, cut-out wind speed at 16 m/s, and rated wind speed at 6.8 m/s. As investigated by IRENA [
21] and further strengthened for the Thai economy by Apichonnabutr and Tiwary [
14], we set the WT’s investment costs to 2500 USD/kW and O and M costs to 35 USD/a. As RETs are gaining popularity we choose a decrease in investment costs of 1%/a [
22]. Due to climatic influences and aging of the technologies used, we assume a decrease in efficiency of 1.5% [
23].
2.3. Battery Electric Storage System
To smooth fluctuating yields and shave peaks, we consider the option to include a BESS. Due to their high and rising market share, we choose a lithium-ion BESS with a usable capacity of 26 kWh. As they inhibit high power discharge capabilities and round-trip efficiency, we choose a charging and discharging capacity of 15 kWh. We set the initial charge ratio to 0%. We follow IRENA [
24] and Chaianong et al. [
17] and impute an efficiency of 91% with a degradation rate of 5%/a. Following IRENA [
24], we set the costs to 210 USD/kW for installation and 0 USD/(kW×a) for O and M. Due to heavy investments and the fast-growing market for their stationary applications, we set the installation cost development to −5%/a [
24]. The service life of our BESS is 12 years [
17].
3. Simulation and Modeling
For a thorough simulation, we collect local information from recent peer-reviewed research, market trends, and statistical as well as meteorological institutes. First, we obtain detailed energy demand and housing data, analyze multiple waves of the TVSEP, and generate hourly time series data. Second, we collect time series data on local geographic conditions, including hourly and average solar radiation and wind speed. Third, we present local financial market data relevant to our simulation.
3.1. Evaluation and Generation of the Energy Demand
Several works have evaluated electric appliance ownership and electricity consumption, and some generated load profiles, for Thai residents. However, they often do not differentiate between urban and rural residents [
25,
26,
27,
28], focus solely on urban households [
29,
30], industries [
31], educational institutes [
32,
33] or the whole country [
34], were conducted with a small sample size [
7,
14,
35,
36,
37], or a combination of all of the above. Thus, we aim to close this gap and apparent research need in the following sections.
3.2. TVSEP and Model Community
The TVSEP includes information of about 2200 rural households spread across 220 villages in three provinces in Thailand, namely, Buriram, Nakhon Phanom, and Ubon Ratchathani. Survey participants were selected based on a three-stage cluster sampling procedure. To gain representativeness for the rural poor in Thailand, sub-districts and villages were chosen using the Probability Proportional to Size weighting method, and random households within these sub-districts were selected [
38]. The survey instrument, a comprehensive household questionnaire, includes information on demographics, the households’ socio-economic situation, well-being, and shocks. For this study, detailed data on housing conditions, member characteristics, energy source, household appliance ownership, and financial situation are drawn. As the cluster size comprises 10 households per village, we model a representative community. Due to its remoteness and distance from the capital, we choose Nakhon Phanom as a suitable location. We explore the datasets for typical local characteristics and their development over time by analyzing the waves in 2008, 2010, 2013, 2016 and 2017. Due to data limitations, we omit the waves 2011 and 2019.
3.3. Household Characteristics, Housing Situation and Appliance Ownership Development
As the RES planning process is subject to considerable uncertainty over time, we analyze the development of the housing conditions, household dynamics, and appliance ownership over a 10-year period. This allows us to make inferences about future developments, and supports the appropriate selection and sizing of RETs to reduce the risks of unreliable electric supply, avoidable high costs and environmental hazards in the short as well as the long term. Between 2008 and 2017, the mean annual income per capita of the rural households in Nakhon Phanom increased from around USD 2000 to almost USD 6000. Most households live in houses with an average floor size of 130 m
2, an increase of 30 m
2 compared to 2008, and two or three rooms. The average nucleus household size stayed constant between three and four, with mainly households of two or three adults with up to two children. Most households were grid-connected in 2008 and used their electricity for lighting, whereas cooking was mostly done with firewood. The latter gradually shifted to bottled gas in recent years. The amount spent on electricity increased from 2008 to 2017 by 30%p.
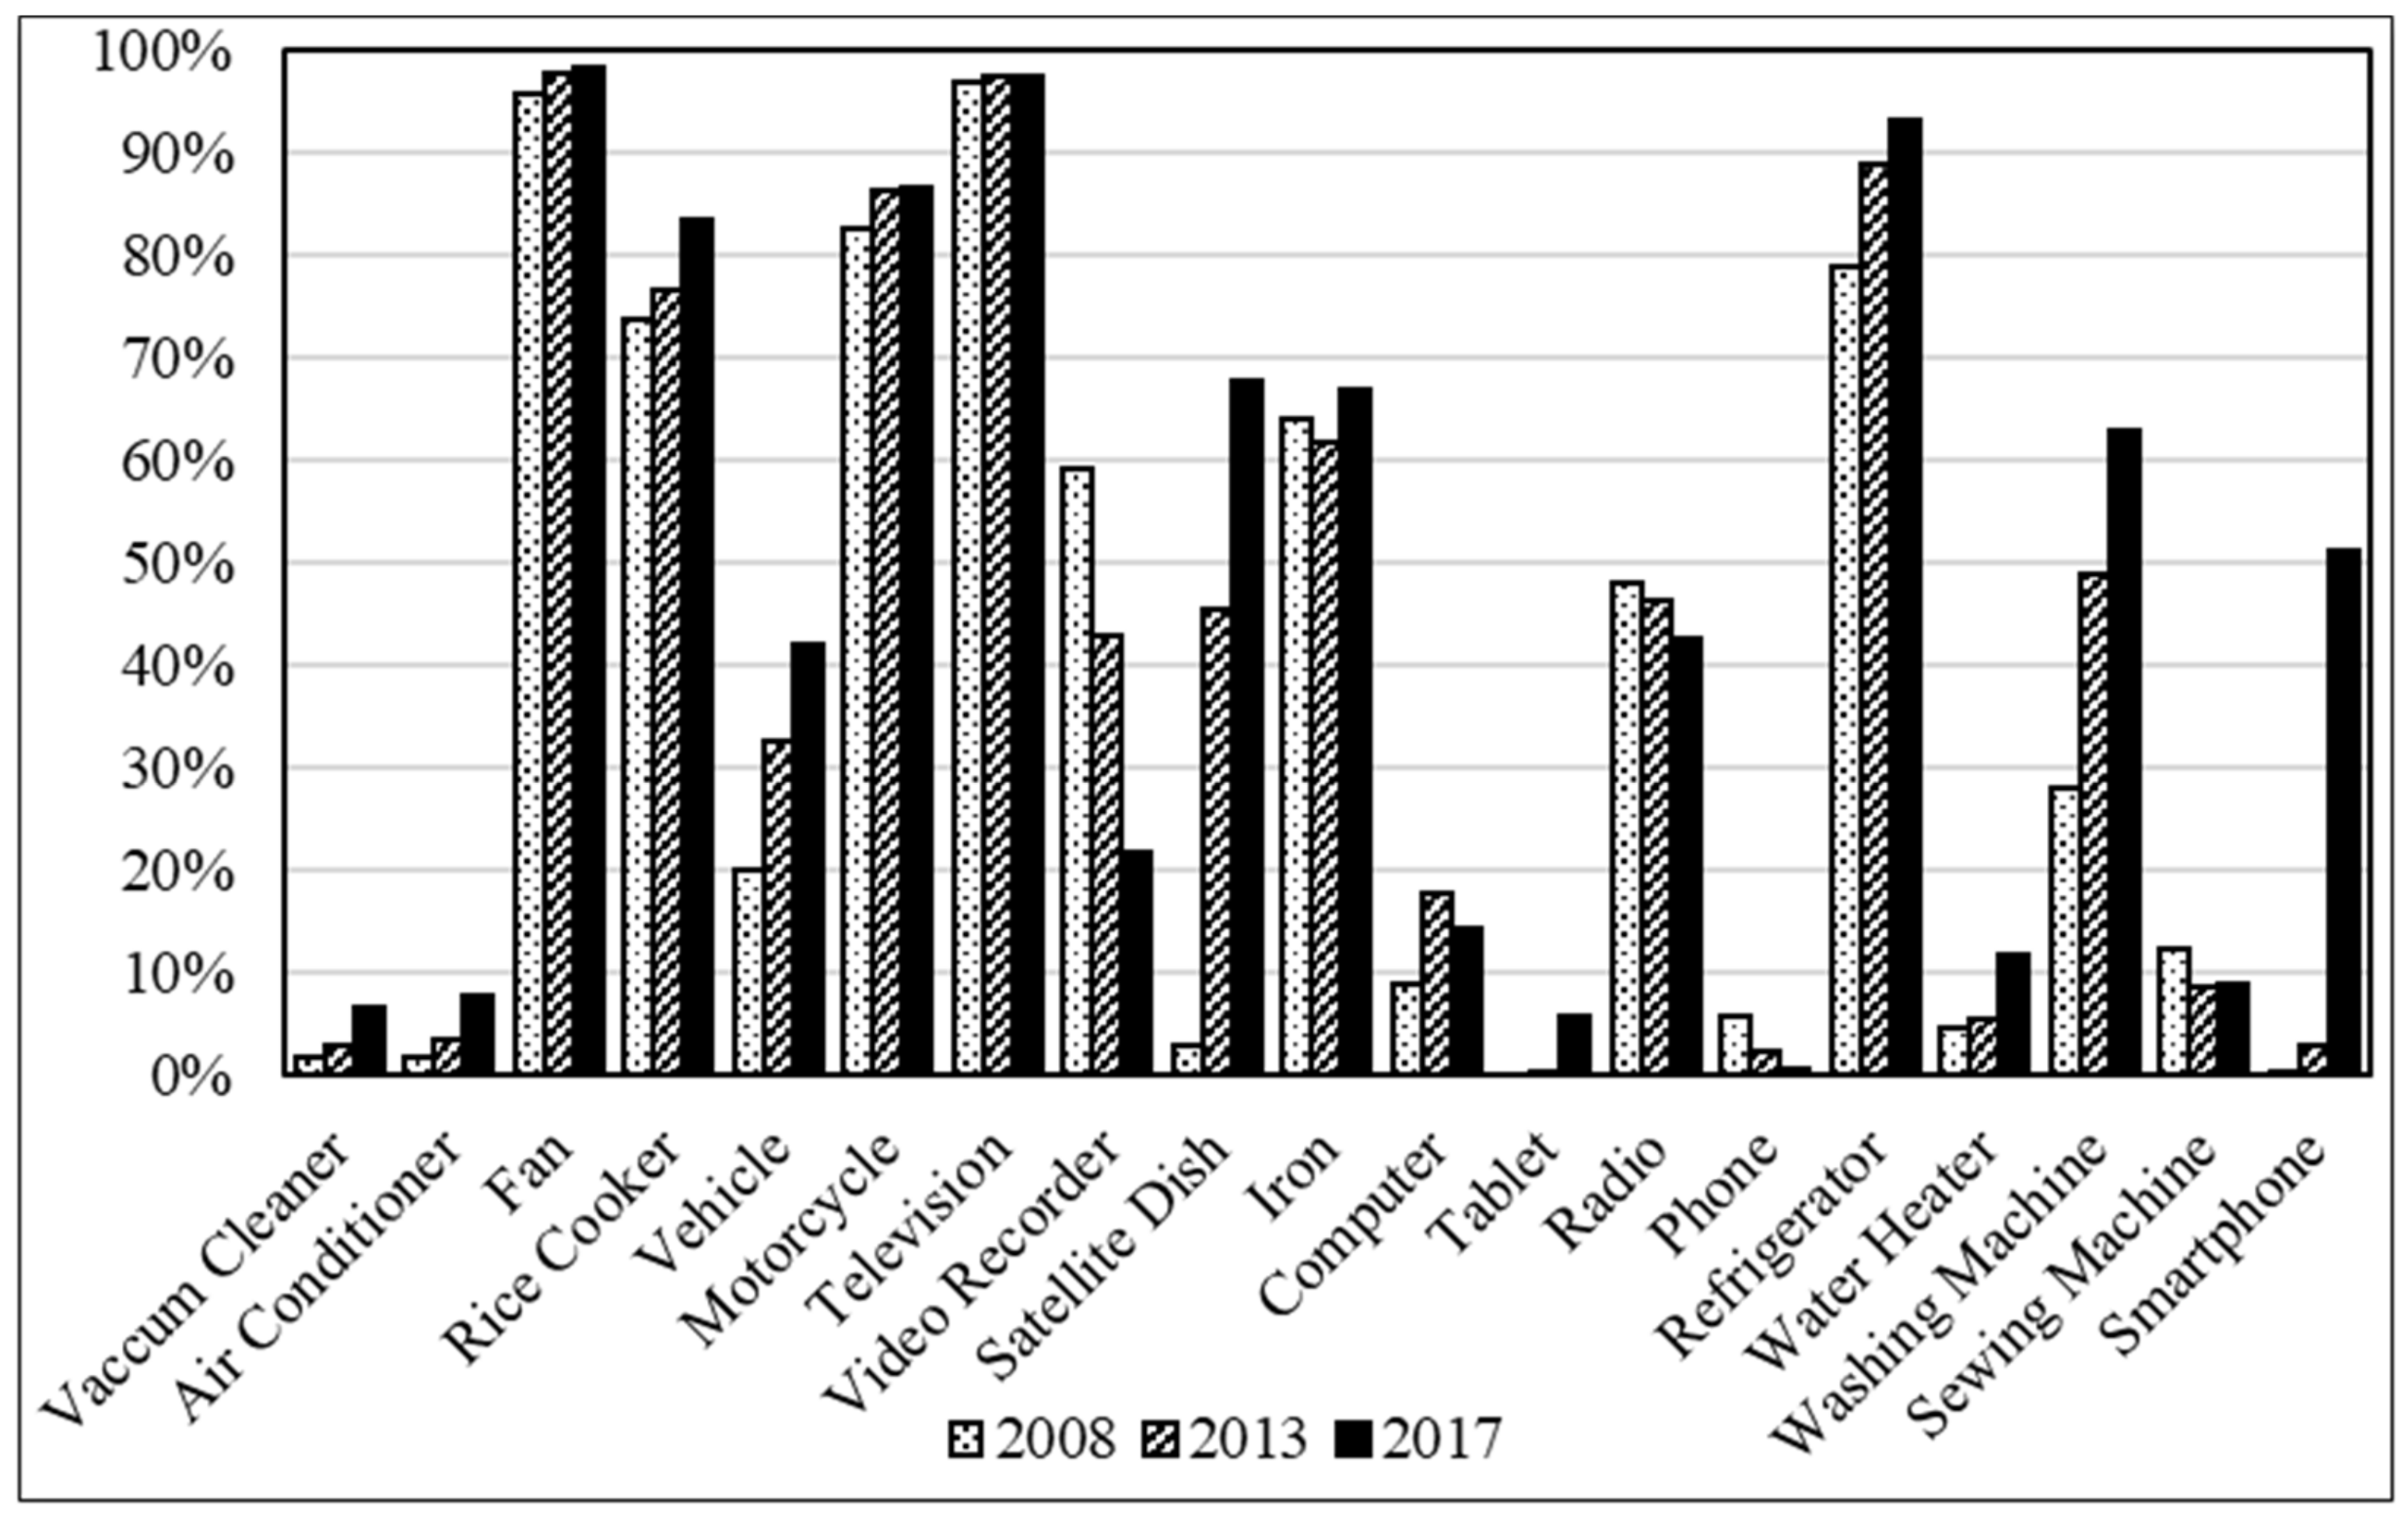
Figure 1 shows that fans and televisions are the appliances owned most often and with a constant share of 96% to 98% over the 10-year period. In 2017, refrigerators (93%), rice cookers (83%), and washing machines (63%) experienced considerable increases of 14%p, 9%p, and 35%p, respectively. The highest values are found with satellite dishes and smartphones which range from 3% to 68% and 0% to 51%, respectively. Video recorders (22%), phones (1%), and sewing machines (9%) are the only appliances whose shares decreased, decreasing by 37%p, 5%p and 4%p, respectively. The share of computers rose from 2008 to 2013 by 9%p; however, their share dropped again to 14% in 2017. These developments are in line with the global development of appliance usage, where the popularity and necessity of old-fashioned technologies have decreased and modern innovations have become more desirable. The generally low share of, but slight increase in, vacuum cleaners (2% to 7%), air conditioners (2% to 8%), and water heaters (5% to 12%) reflects the positive financial means of the households as well as their energy-intensive, and thus, costly, characteristics. In conclusion, the data shows that not only the number of electrical appliances in the households increased but also the share of energy-intensive technologies. The data, thus, reinforces the importance of considering appliance ownership developments to the design of a long-term sustainable energy system.
3.4. Synthesizing Energy Demand
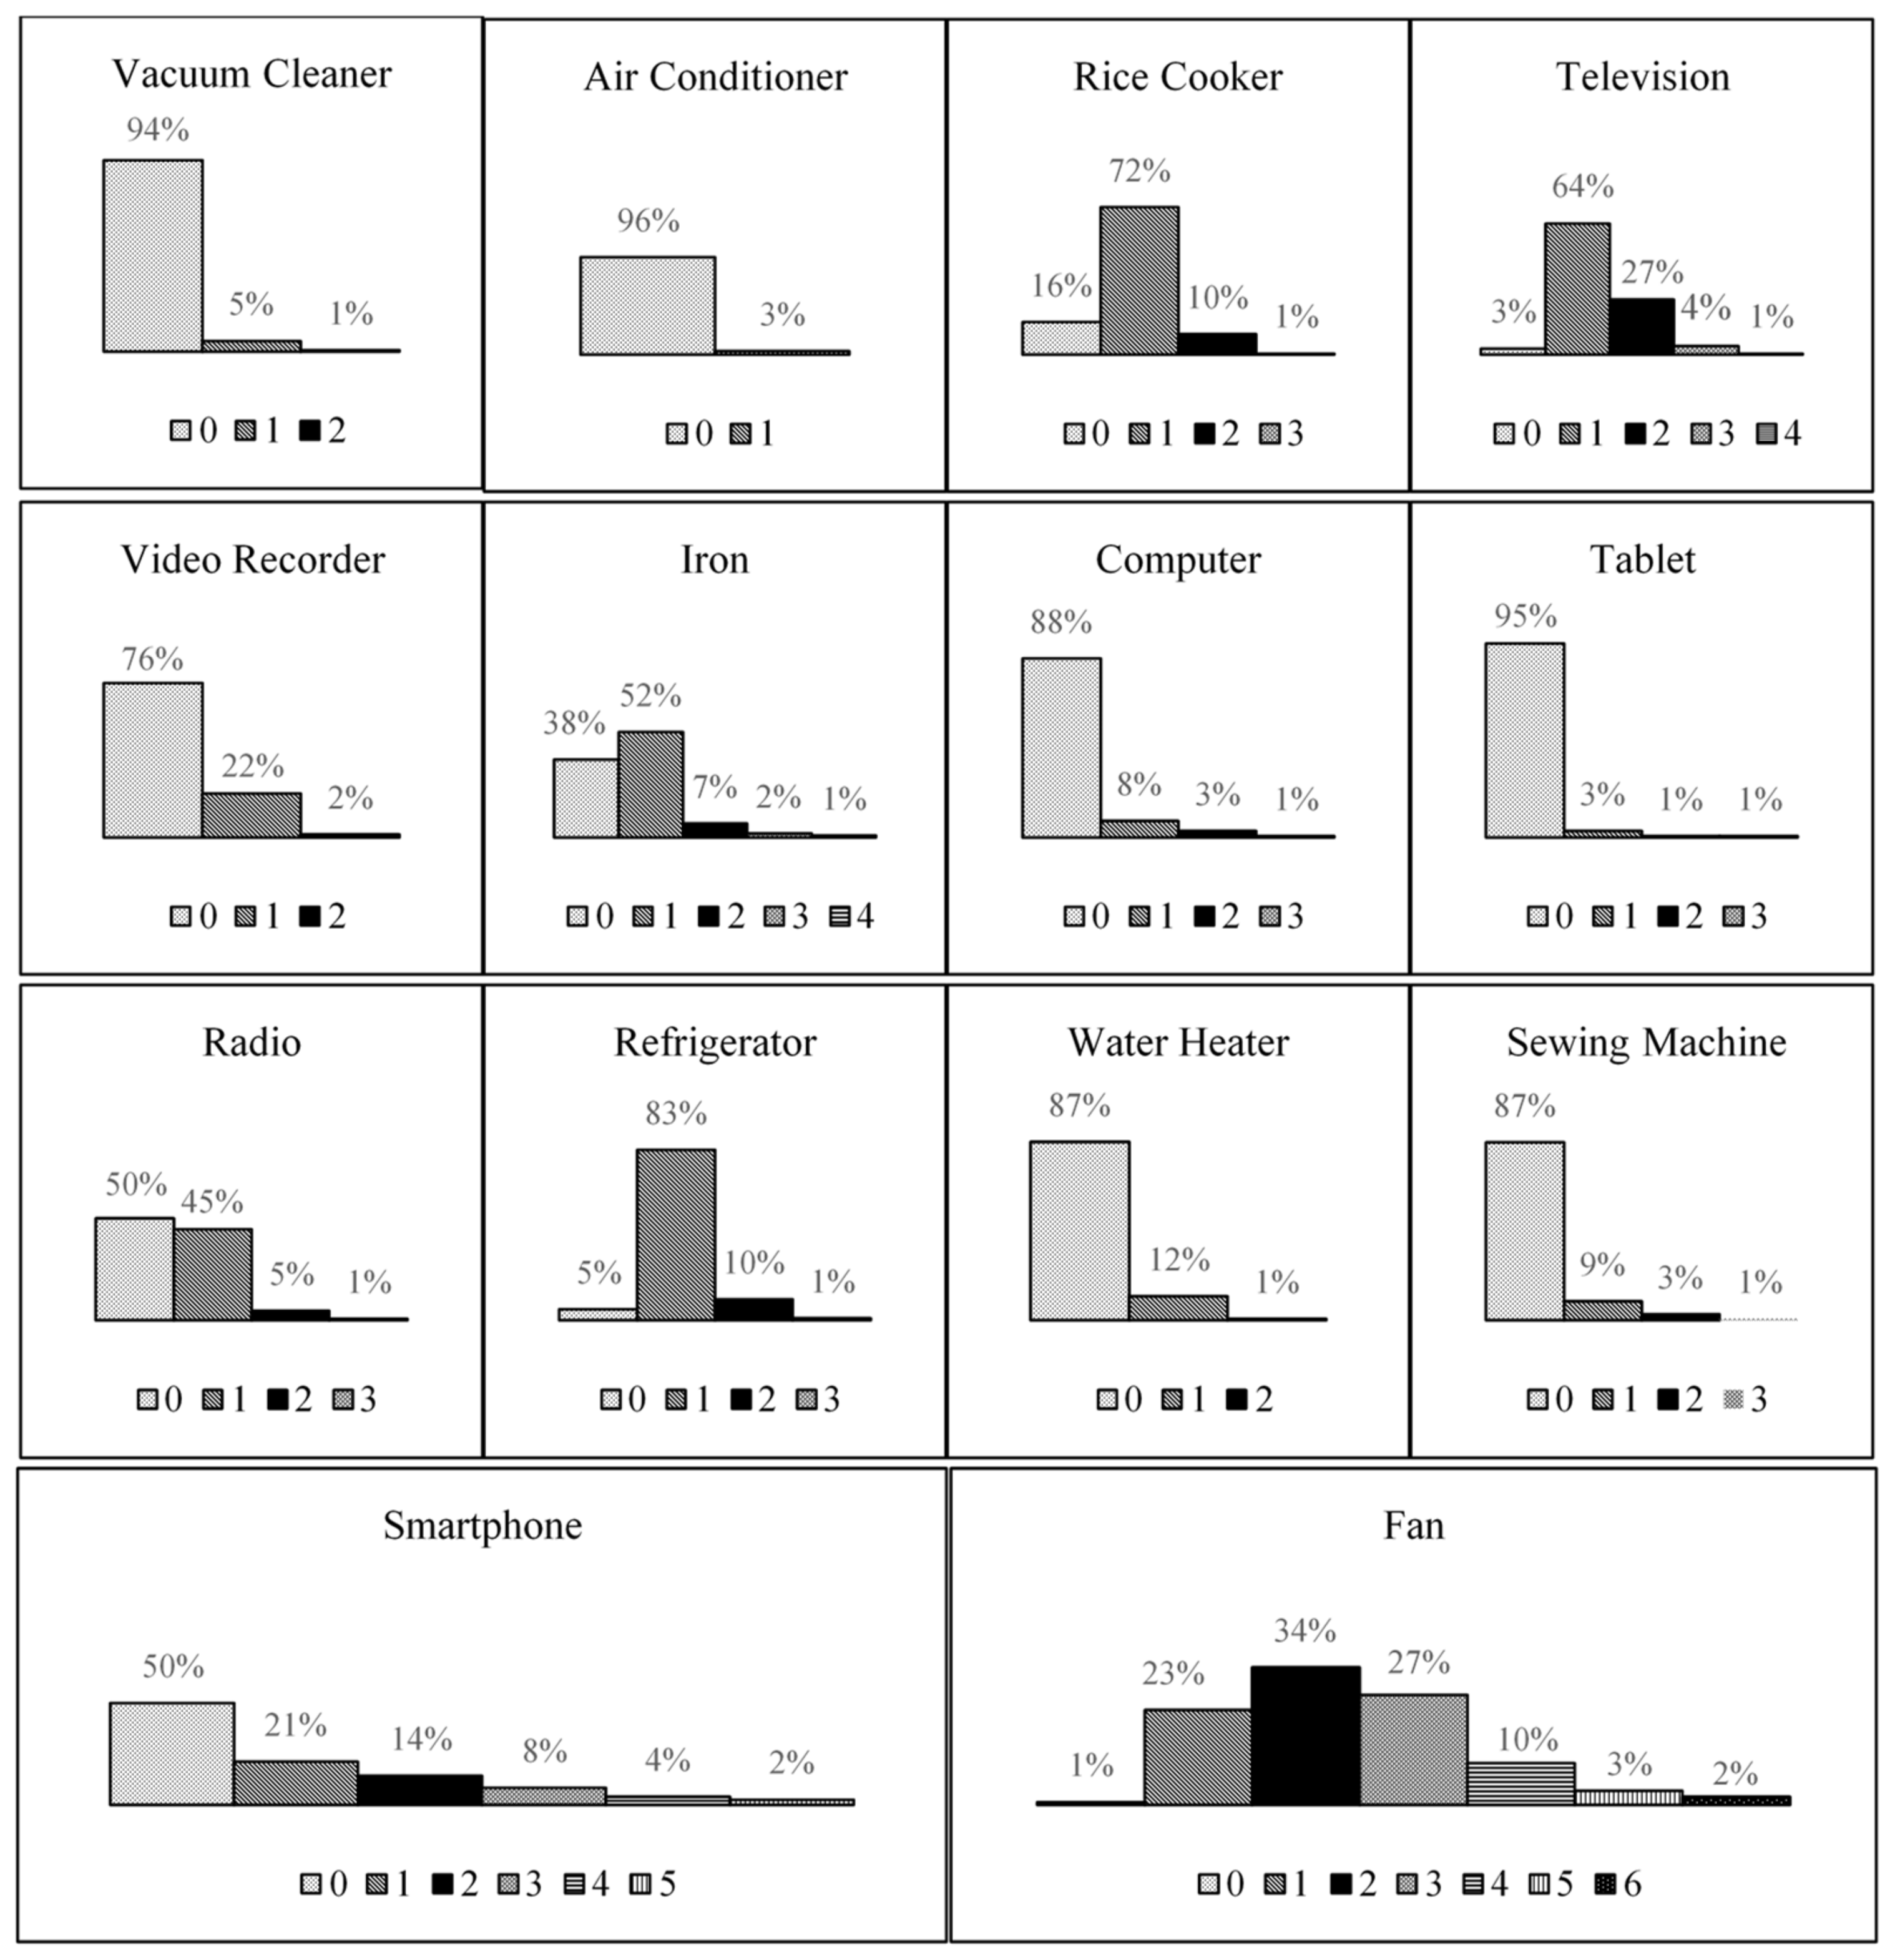
As the survey data is considered representative for the rural areas in Nakhon Phanom, we assume the same appliance ownership distribution for the model community. Because we found no information about the households’ lighting systems, we assume that basic visual demand is fulfilled with one indoor light per room and one outdoor light for all households. The distribution of the number of appliances owned per household, as depicted in
Figure 2, is applied to the community’s overall appliance ownership. The appliance-usage behavior is constructed from the information of similar case studies, market data, and the authors’ assumptions [
37,
39,
40]. The time of usage is chosen to correspond to assumed working hours as well as the times of sunrise and sunset. We omit weekends, vacation days, and the differentiation between seasons. The final energy demand profile including the total number of appliances, electricity consumption, and usage behavior for the thirty households is shown in
Table 1.
Subsequently, these demand profiles are used as inputs for the software RAMP by Lombardi et al. [
42] to generate minute-by-minute load profiles. The open-source, python-based software was specifically developed to generate high-resolution load profiles from inexact data. It has been applied to several case studies;—see, e.g., Balderrama et al. [
39] and Lombardi et al. [
42]—and, thus, is deemed suitable for our case. A graphical representation of the electricity consumption in hourly time steps on a random day for the whole community is presented in
Figure 3. The figure depicts the importance of considering hourly data, as there are clear peak loads in the morning and the afternoon that deviate by up to 7 kW compared to the low load-demands from midnight to 5.30 a.m. and 8 a.m. to 6.30 p.m.
3.5. Geographic Conditions and Climate
The Global Wind Atlas provides an average mean wind speed in Nakhon Phanom of 3.2 m/s and 4.6 m/s at a height of 10 m and 50 m, respectively [
43]. The daily direct normal, global horizontal, and diffuse horizontal irradiation sit on average between 3.5 kWh/m
2 and 3.7 kWh/m
2, 4.8 kWh/m
2 and 4.9 kWh/m
2, and 2.3 kWh/m
2 and 2.4 kWh/m
2, respectively. This totals an estimated PV power output of 4.0 kWh/kW
p to 4.1 kWh/kW
p. The optimal orientation of the PV module is south and tilt angle between 19° and 21° [
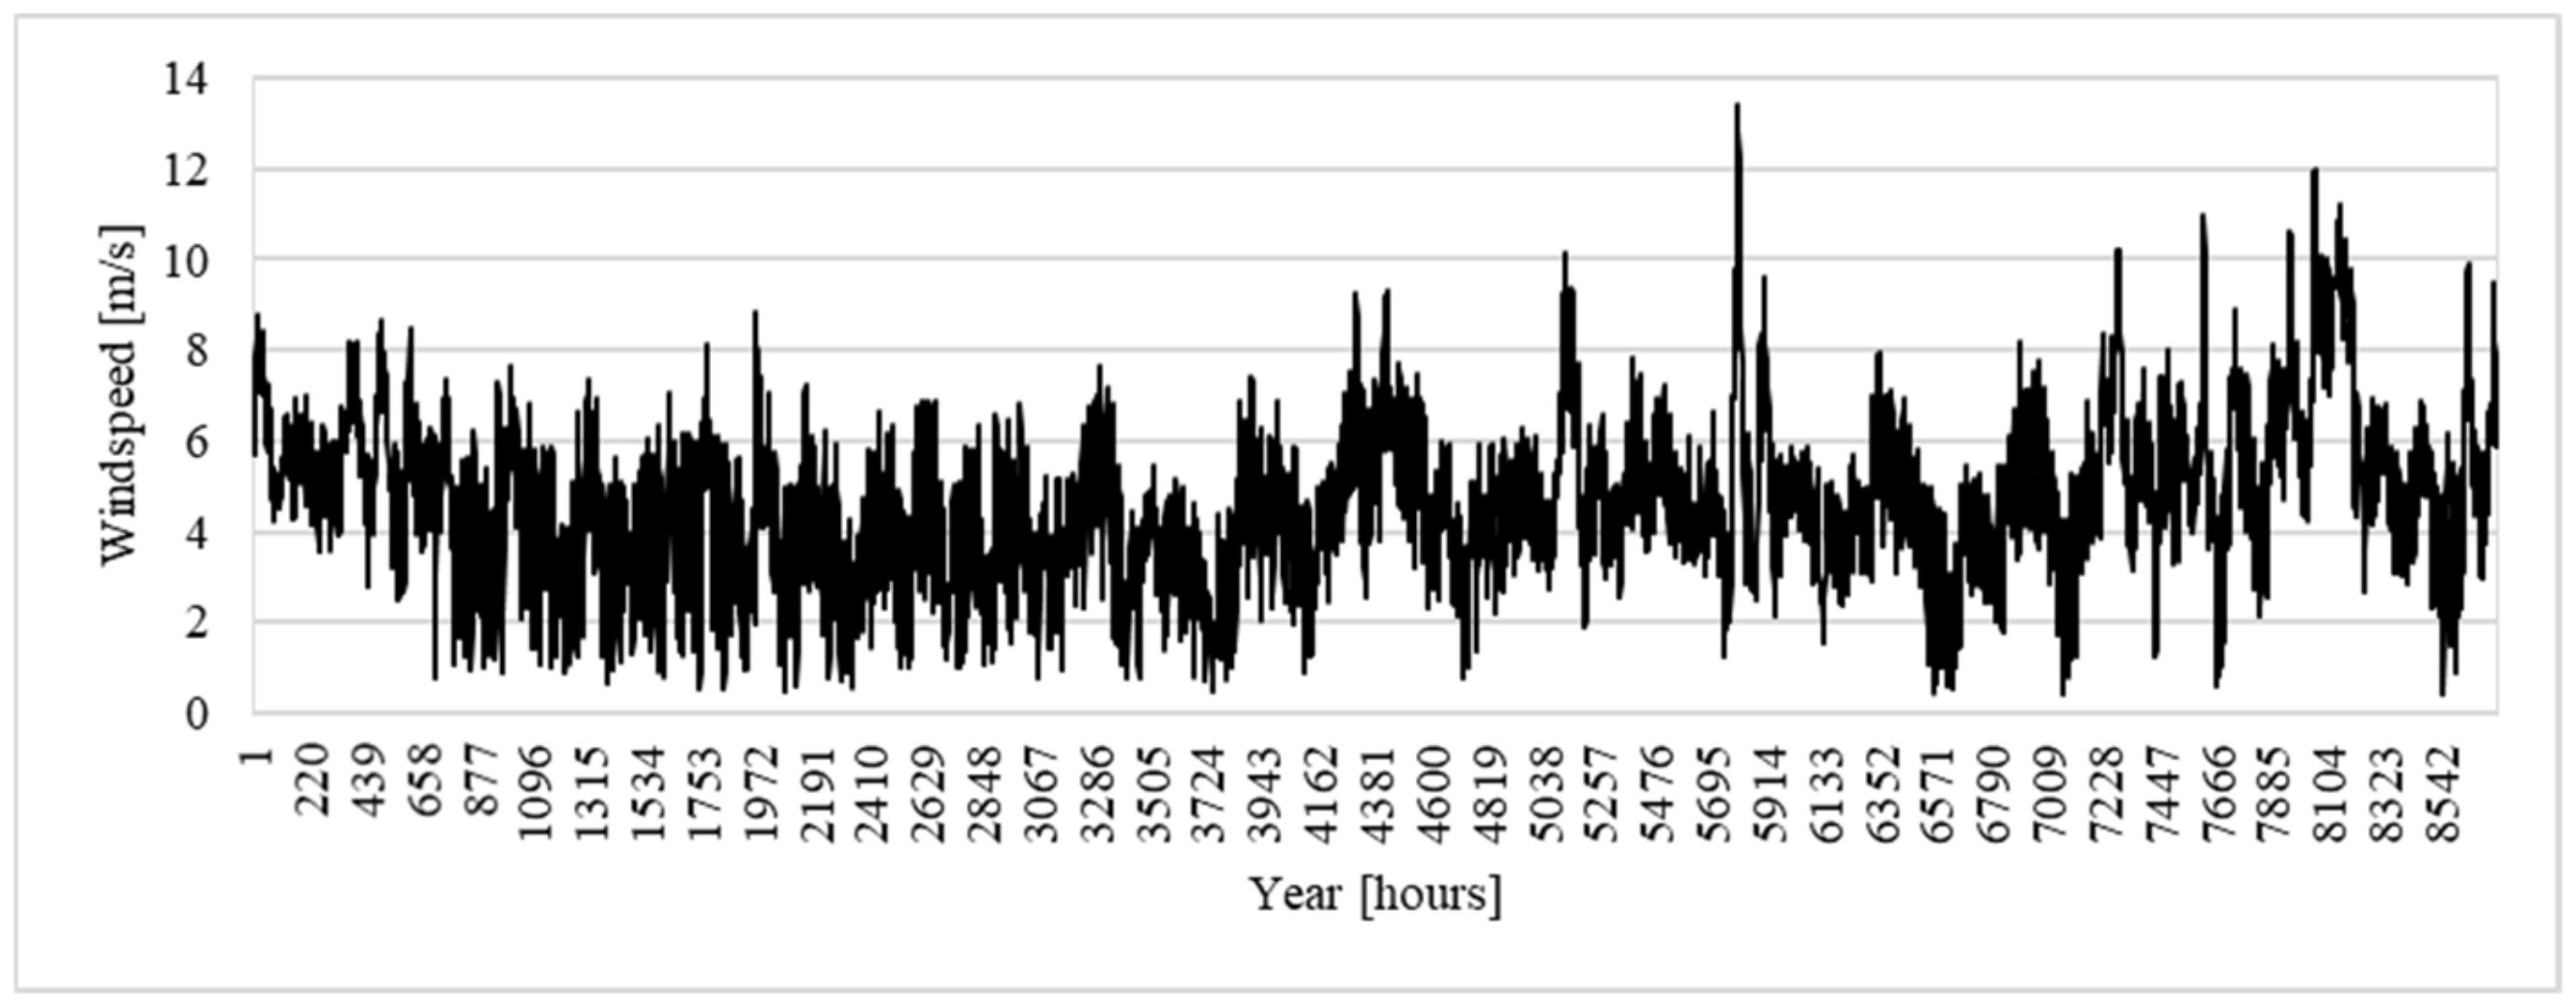
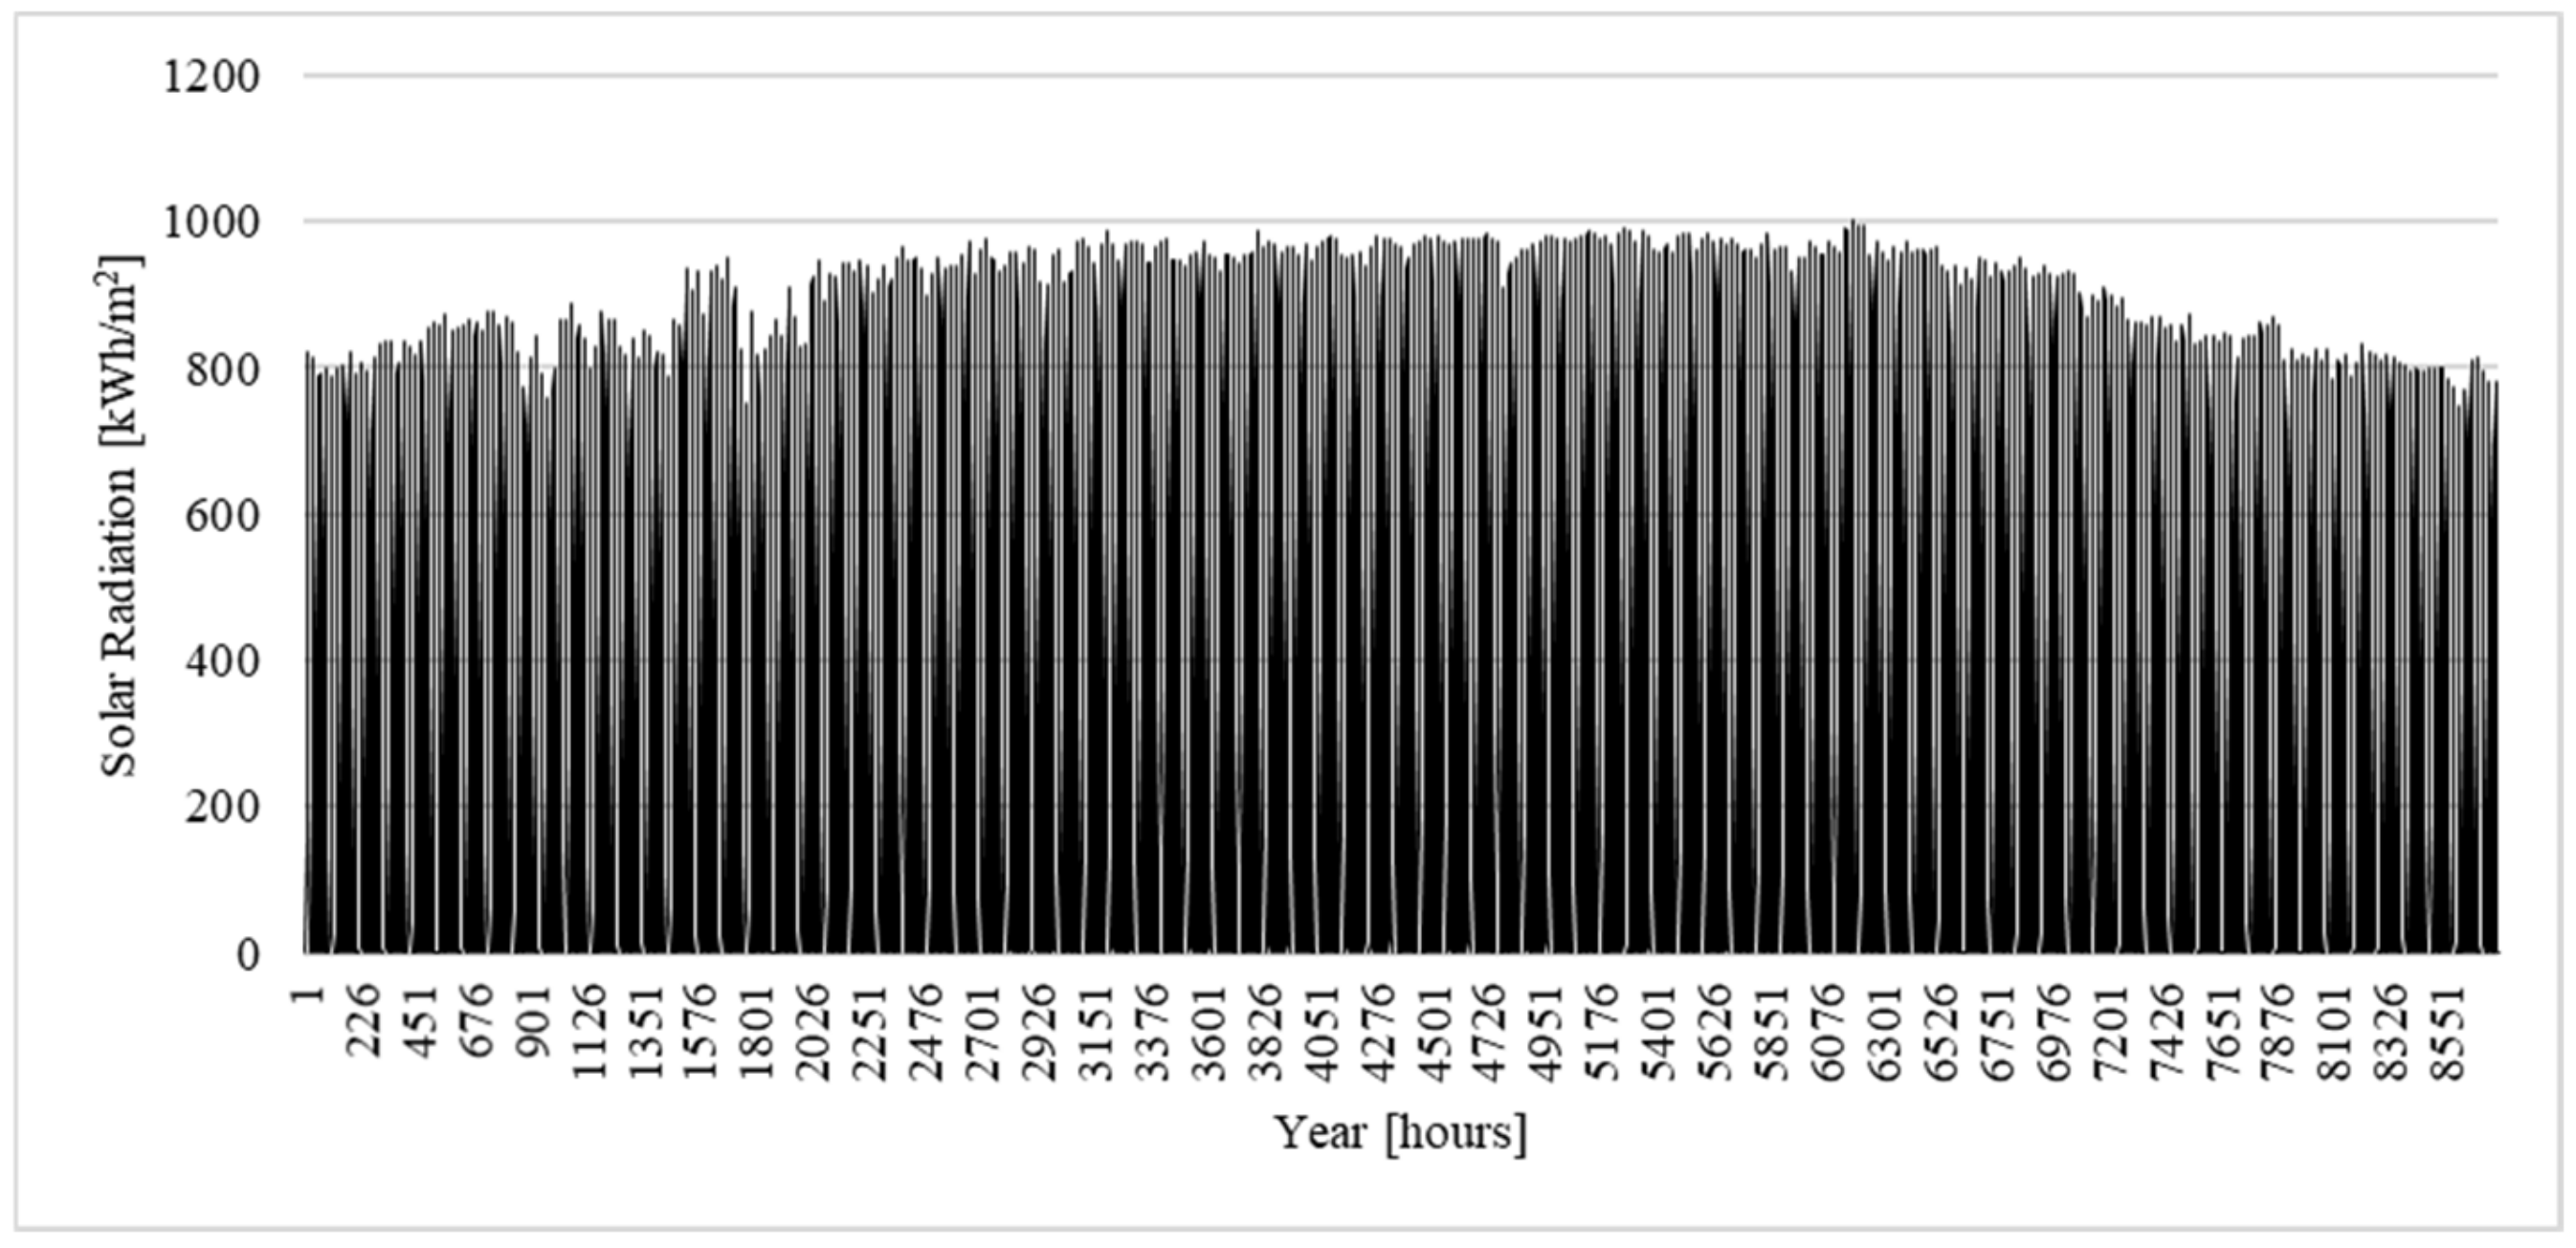
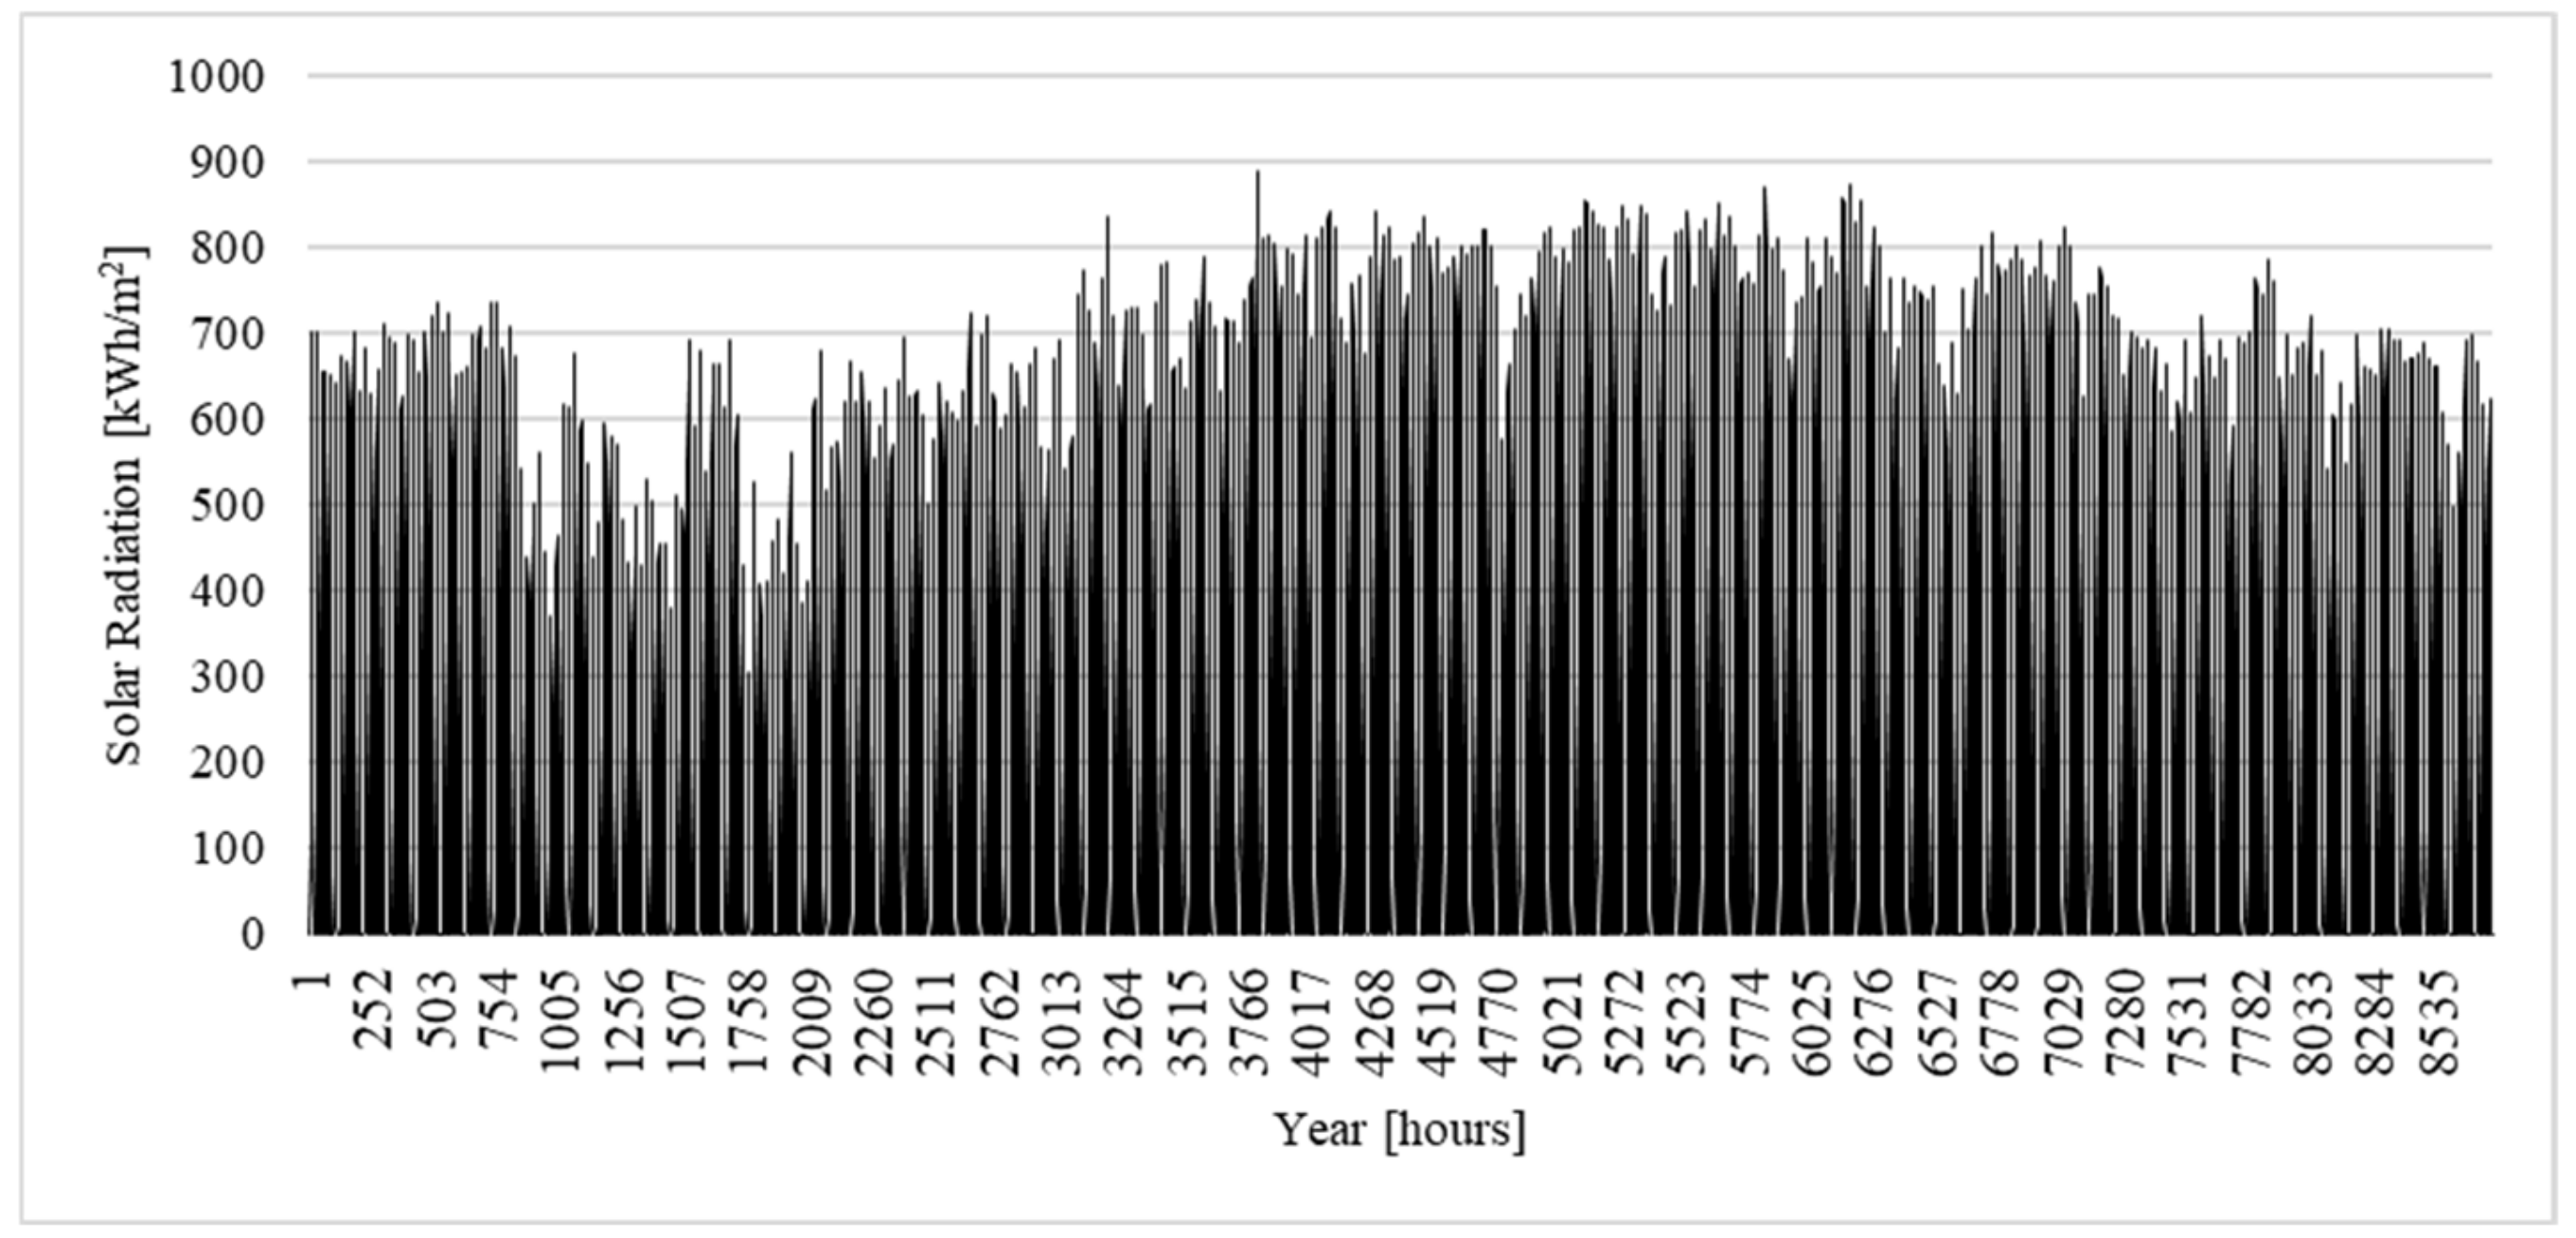
44]. Thus, we deem the locations suitable for PV and WT installations. For more detailed inputs, we select hourly solar and wind time series data from the year 2019 originally extracted from the NASA Merra2-dataset [
45,
46].
Figure A2,
Figure A3,
Figure A4,
Figure A5 and
Figure A6 in the
Appendix A and
Appendix B show their graphical representation.
3.6. Further Project and Market Data
For a thorough analysis, further economic and ecological data regarding the Thai market structure is needed. To put a value on time preference on the economic data, a discount rate must be chosen carefully. We follow Apichonnabutr and Tiwary [
14] with a discount rate of 6%. Economic data further includes the electricity price and costs for grid development, 0.112 USD/kWh and 1 USD/a, respectively [
47]. The emission factor of the Thai power grid is estimated to be 0.559 kg
CO2-eq./kWh [
48]. For an overview, all inputs for the simulation are summarized in
Table A1 in
Appendix B.
4. Results and Findings
With the above-developed appliance ownership and consumption behavior, the synthesized annual average electricity demand sums to 32,000 kWh for all 30 households; i.e., one household has an average daily demand of 2.9 kWh. With the chosen electricity demand increase of 6% per year, the total amount needed to ensure a reliable supply for the model community in 10 years is 57,000 kWh. The PV system and WT produce 4200 kWh/a and 660 kWh/a with total investment and O and M costs of 2700 USD/a for both. The cost for purchase and operation of the BESS is 600 USD/a.
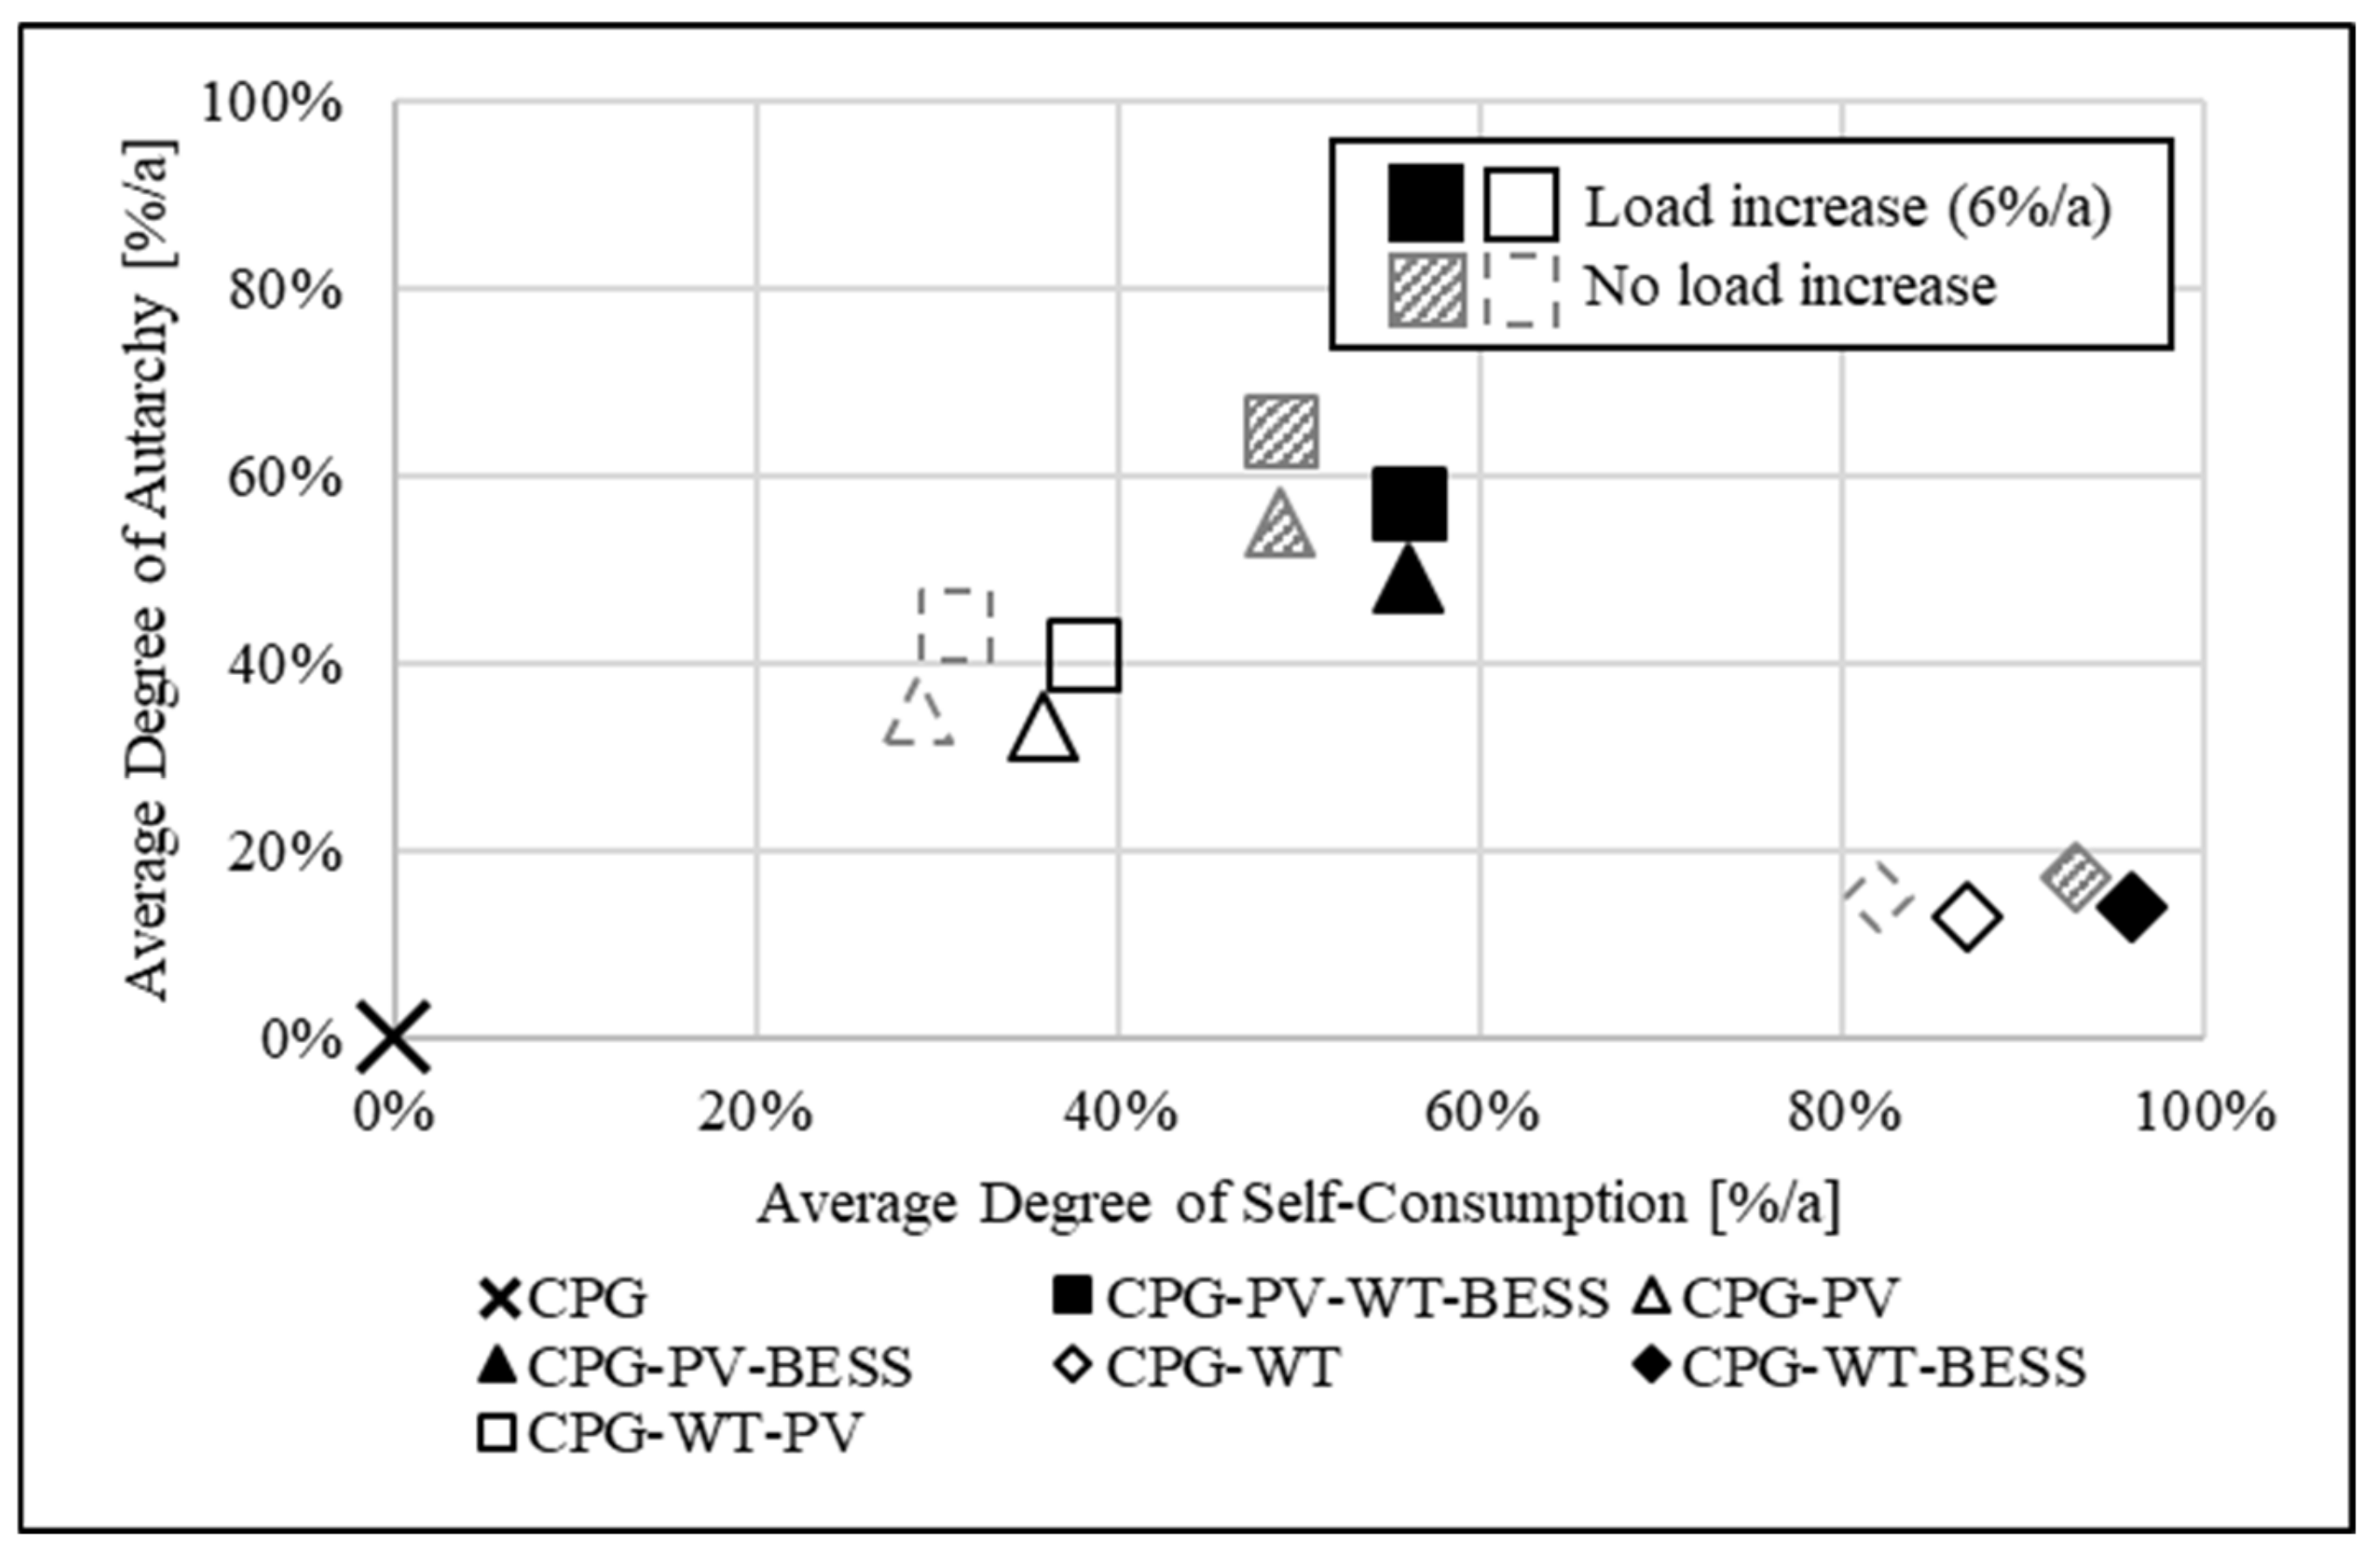
Figure 4 depicts the two independence measures and their relation to our analysis: the degrees of autarchy (DoA) and self-consumption (DoS). The DoA rises with the number of RETs added to the RES; however, PVs have a stronger impact on this value than WTs. An RES with a sole WT and BESS has a DoA between 10% and 20%, whereas the RES CPG-PV and CPG-PV-BESS show a DoA of 30% to 50%. We find that adding a WT to one of these systems increases the DoA by 10%p. However, BESS has a greater impact and increases the DoA by 20%p. Regarding the DoS, an RES with sole PV has a value of 29% that increases to 49% with an additional BESS. WTs have significantly higher DoS with a value of 80% that increases to 90% with a BESS.
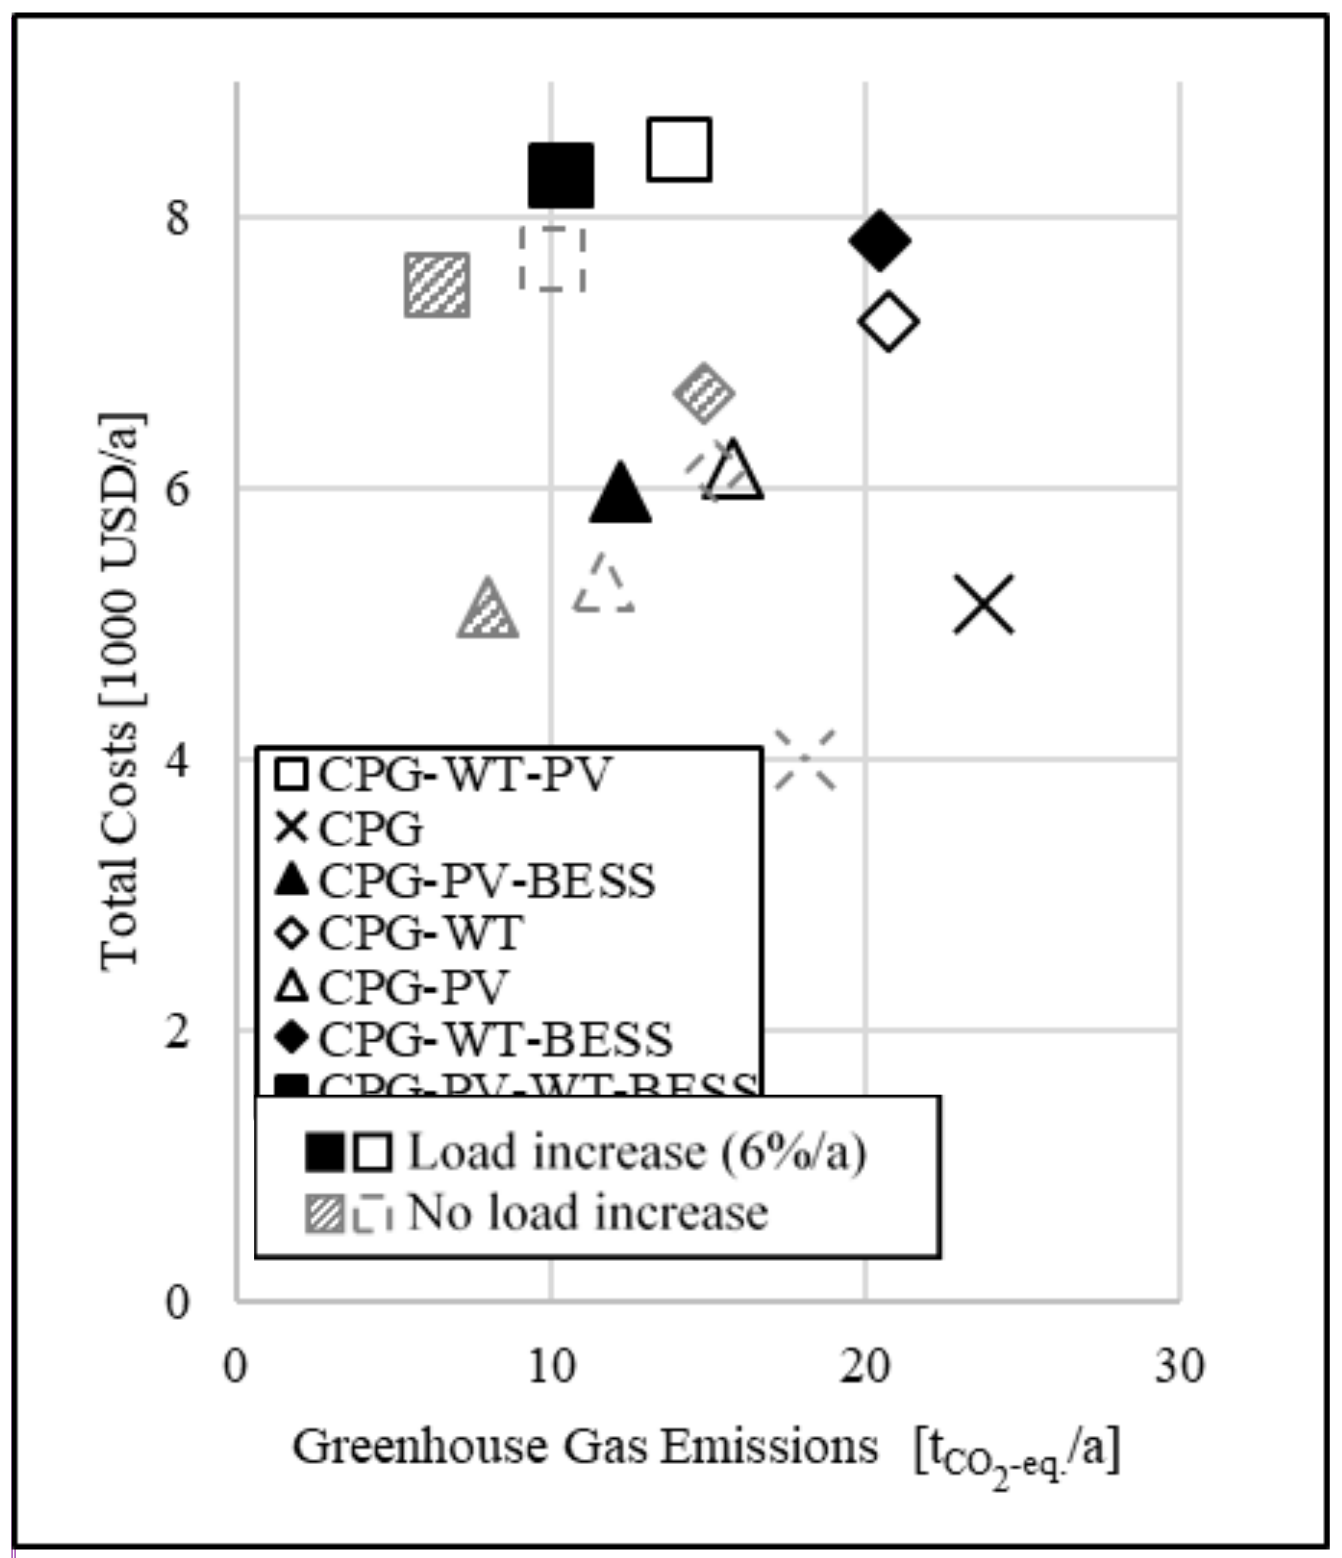
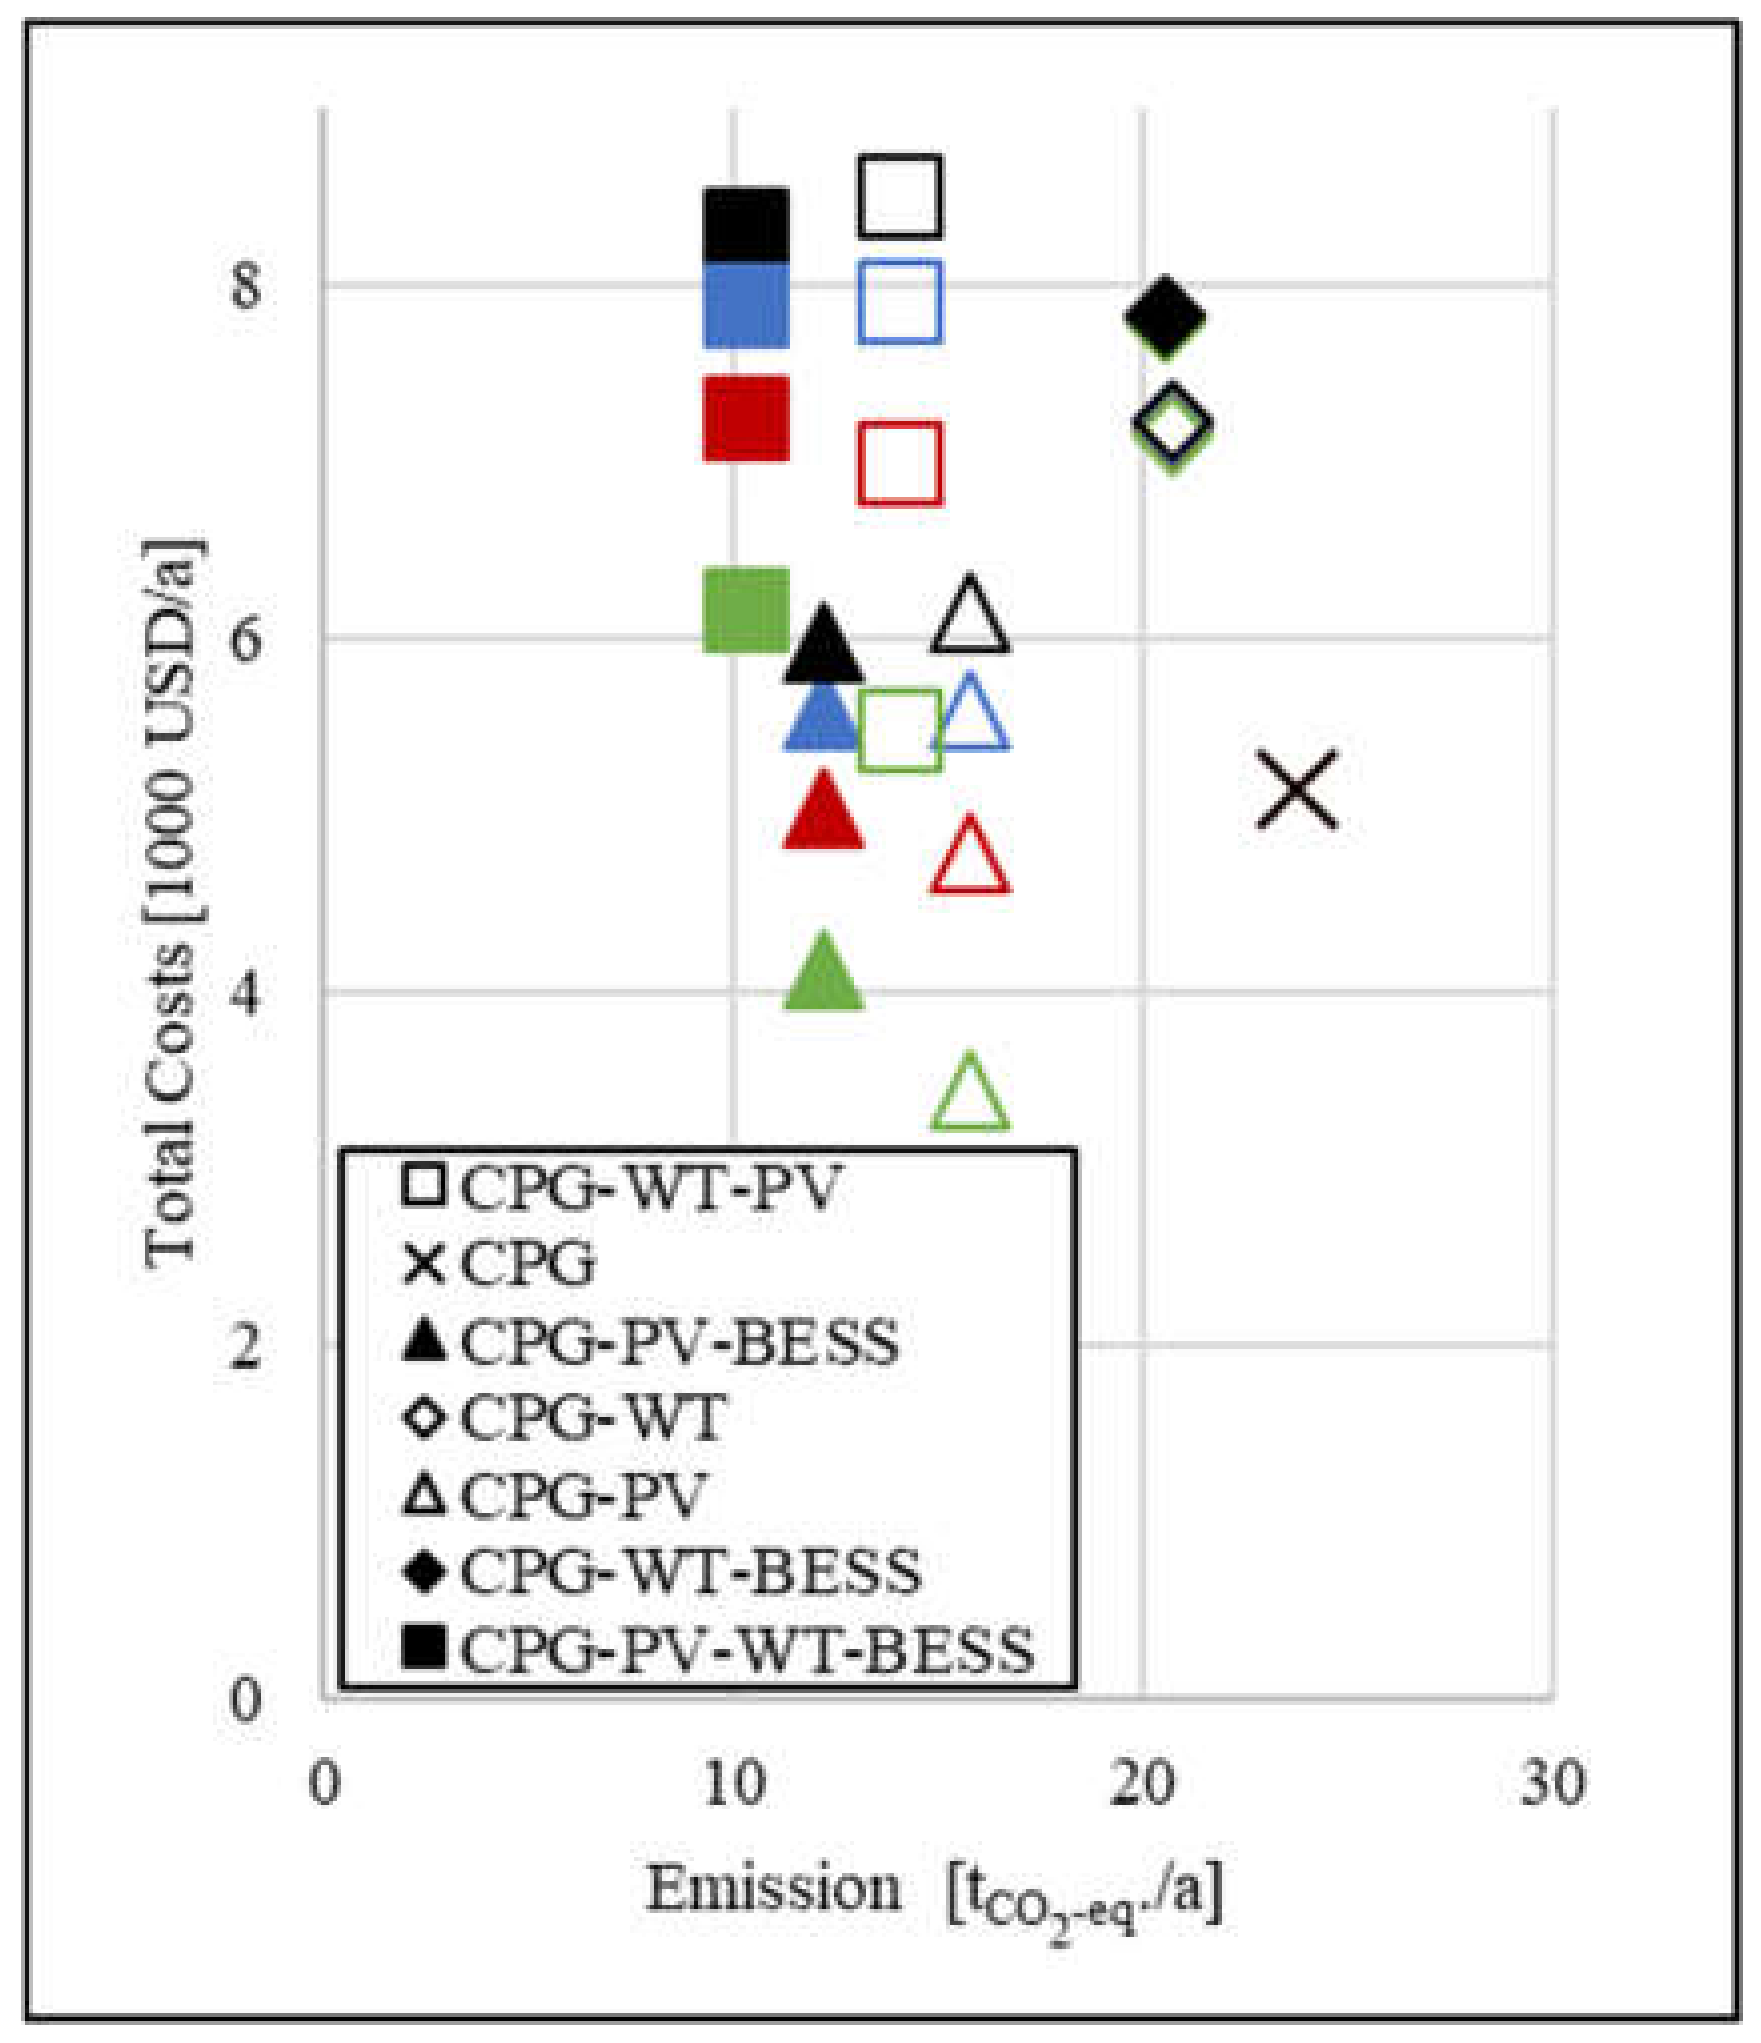
Figure 5 presents the economic and ecological outcomes of the simulated RES. The business-as-usual scenario with solely power grid supply emits 23,770 kg
CO2-eq./a. We find a significant environmental benefit with each RES, with GHG reductions of 3000 kg
CO2-eq./a (CPG-WT) to 13,500 kg
CO2-eq./a (CPG-WT-PV-BESS). The lowest GHG is emitted with RES systems including PV, with values of 15,700 kg
CO2-eq./a (CPG-PV), 14,000 kg
CO2-eq./a (CPG-WT-PV), 12,100 kg
CO2-eq./a (CPG-PV-BESS), and 10,308 kg
CO2-eq./a (CPG-PV-WT-BESS). RES with only WT as electricity-generating technology show only slight environmental benefits with values decreasing by 3000 kg
CO2-eq./a (CPG-WT) and 3200 kg
CO2-eq./a (CPG-WT-BESS). However, the independence from the power grid gained and the environmental benefits both come with financial costs. The initial project costs increase with the number of RETs included, starting from USD 25,000 (CPG-WT and CPG-PV) to USD 56,100 (CPG-PV-WT-BESS) and including USD 5000 for the BESS, whereas business-as-usual with no additional RETs has no upfront costs. Annually, the total costs increase from the initial value of 5100 USD/a (CPG) by 800 USD/a (CPG-PV-BESS) to 3300 USD/a (CPG-PV-WT). The strongest cost impact comes from the WT, solely responsible for increasing the costs by 2000 USD/a, and with a BESS by 2600 USD/a, to total annual costs of 7100 USD/a and 7700 USD/a, respectively. Adding PVs to a RES has a lower cost effect, with a total cost of 6100 USD/a and 5900 USD/a when including a BESS. These results show that RESs foster resilience, as they are beneficial in terms of environmental considerations and independence. However, as the financial means are often limited, governmental incentives must be set to increase their implementation. Thus, in the following subsections, we evaluate the impact of two governmental incentives, feed-in tariffs (FIT) and carbon credits.
4.1. Carbon Emission Trading and Carbon Credits
In the past 10 years, the Thai government and Thailand Greenhouse Gas Management Organization (TGO) have evaluated a Voluntary Emission Reduction Scheme (T-VER) for renewable-energy projects including RETs, energy efficiency, and waste projects [
3]. This institutional framework allows for the obtaining of carbon credits that are tradable in a domestic voluntary carbon market with the specific goal of incentivizing residents to participate in the governement’s campaign to mitigate GHG emissions [
15]. We have first evaluated the proposed carbon credit value of 0.009 USD/kg
CO2-eq. incorporated by The World Bank and the Thai Ministry of Finance in several Thai pilot municipalities [
49]. The report showed great success regarding GHG mitigation in the long run; however, for our evaluation, we found only marginal incentives of 30 USD/a (CPG-WT-BESS) to 130 USD/a (CPG-PV-WT-BESS). Thus, we increase this value to 0.02 USD/kg
CO2-eq. based on the medium Asian Emission Trading Scheme (ETS) by Massetti and Tavoni [
50]. Accordingly, the benefits doubled with a total annual cost difference between the most cost-effective RES (CPG-PV-BESS) and business-as-usual of +800 USD/a. When tripling the carbon credit values to 0.08 USD/kg
CO2-eq., the annual costs of the RES decrease to 5500 USD/a (CPG-PV), 6900 USD/a (CPG-WT), and 7900 USD/a (CPG-PV-WT). Adding a BESS decreases the costs by 500 USD/a for the RES including PVs, but increases the costs of RES with sole WT supply by 600 USD/a. Thus, one RES—CPG-PV-BESS—becomes economically viable with total annual costs of 5,000 USD/a, which results in a cost difference of 140 USD/a compared to business-as-usual. All results are graphically depicted in
Figure 6.
4.2. Feed-In Tariffs
The Thai government had implemented FITs in the past; however, for residential and community projects, these ran out in 2014 [
3]. As FITs have shown great success in promoting RETs in Thailand, we evaluate three tariffs for excess wind and solar electricity: 0.02 USD/kWh, 0.05 USD/kWh and 0.1 USD/kWh.
Figure 7 shows that FITs generally have a significant influence on total annual costs. FIT values of 0.02 USD/kWh reduce the cost of RESs including PVs by 300 USD/a (CPG-PV-BESS) to 400 USD/a (CPG-PV-WT-BESS), whereas the incentive for RESs CPG-WT-BESS and CPG-WT are only marginal, with 6 USD/a and 17 USD/a, respectively. However, business-as-usual remains more economical in all scenarios. Increasing the FIT to 0.05 USD/kWh results in RESs that include PVs becoming economically attractive. This tariff translates to financial incentives of 900 USD/a, 1300 USD/a, and 1000 USD/a for the RES CPG-PV-BESS, CPG-PV, and CPG-PV-WT-BESS, respectively. With annual costs of USD 5000 (CPG-PV-BESS) and USD 4700 (CPG-PV), these RESs are more attractive than solely CPG supply. To evaluate the FIT where RESs that have the highest environmental impact also become economically attractive, we increase the FIT to almost equal the electricity price from the CPG. The cost differences reduce from 3000 USD/a when not including any FIT to 1000 USD/a.
5. Discussion
The above results emphasize the two opposing forces of environmental sustainability and independence versus economic attractiveness for a resilient RES. First, we have presented the results of two independence measures, i.e., DoA and DoS. We found that RETs have considerable influence on both. However, as the generated electricity either does not sufficiently meet demand or is produced at times not needed, the community is not able to be autarkic for more than 50%. Combining WTs and PVs in RESs results in a considerably higher DoA, indicating their complementarity. Generally, BESSs increase the value of both measures, implying they are crucial for an independent energy supply. Interestingly, the DoS does not increase with an additional WT when a BESS is already included. Thus, we conclude that the BESS is sufficient to shift the electricity to a time when it is needed.
We have further found that, ecologically, RESs are strongly preferred compared to a sole power grid supply. Driven by the environmental costs, i.e., emission factor, of every kWh obtained from the power grid, the emissions decrease the more electricity is generated and used for self-consumption. As the PV system generates more electricity than the WT, the amount obtained from the power grid is relatively lower and, thus, the emissions are as well. Accordingly, better ecological outcomes are present in a hybrid RES that uses WT and PV systems. However, the strongest impact stems from, again, BESS combined with WT or PV. These values strengthen the argument for a hybrid RES—and, especially, BESS—to decrease environmental burdens. However, in our simulations, we have neither included emissions generated during production nor waste management. BESS might decrease the emissions while operating; however, they are currently made from rare materials and require specific waste management. The cells of PV systems can only be produced with high-technology and often rare materials that are usually not found at project sites. Another aspect is the land-use for the RES, as deforestation and land preparedness should concur with local and environmental needs. When choosing RETs, energy planners should, thus, consider local production, waste management, the construction site, and the total emissions of RETs in their decision process.
Regarding the economic impacts of the RES, we have found that including RETs is not economically attractive. BESSs have a strong influence by shifting generated electricity, resulting in less purchased electricity. However, with the high investments in BESS, this is only true for RESs that generate sufficient energy to offset the costs of electricity from the grid, i.e., the PV system. Nevertheless, with no governmental subsidies, even the most cost-effective RES exceeds the sole CPG supply. We have, thus, evaluated two exemplary measures to incentivize RET implementation. For carbon credits, we found that incentives as set by the World Bank in pilot projects, as well as the average ETS denoted by Massetti and Tavoni [
50], do not set sufficient economic incentives for implementing RETs. Only when increasing the carbon credits tenfold to 0.08 USD/kg
CO2-eq. did one RES—CPG-PV-BESS—become economically attractive for the model community. However, the results indicate that BESSs play a crucial role in cost-effectiveness, as omitting them would lead to greater costs than business-as-usual. These results indicate that carbon credits are indeed an incentive to implement RETs, but only for communities that are willing to pay higher prices or at values unusually high by global standards for carbon credits. Similar effects are found with the FITs. We show that FITs have the greatest impact on RESs including PVs, as these produce a considerable amount of electricity when it is not needed. Vice versa, FITs, in general, do not have a significant influence on the financial viability of RESs including WTs, which concurs with the relatively high DoS of these RESs. With low FITs, all RESs are more cost-intensive than business-as-usual, but increasing this value results in the RESs CPG-PV and CPG-PV-BESS being more attractive scenarios than business-as-usual. To find a FIT that allows the most environmentally friendly RES, i.e., CPG-PV-WT-BESS, to also be economically attractive, we increased the FIT value to the Thai electricity price. However, this is not sufficient to offset the need for financing initial investments. Thus, considering governmental incentives, the only economically attractive RES is the CPG-PV-BESS scenario. However, questions remain about financing the costs at the beginning of the project. With the evaluated annual income of USD 6000 per household, funding the project within the community would put a heavy economic burden on the households. We, thus, recommend additional policies tackling the initial cost barriers such as low interest rates on loans.
To underline the importance of detailed load profiles as well as the consideration of their future developments,
Figure 4 and
Figure 5 additionally depict the results when electricity demand developments are not considered. The former shows that the DoA would be overestimated, whereas the DoS would be underestimated. For policymakers that focus on building energy resilience through independence, small deviations could have a significant impact on reaching the anticipated goals. Similar results are presented in
Figure 5. Through annual demand increases, the amount of purchased electricity rises significantly, and with it, the GHG emissions. Thus, not considering these developments would mean underestimating future GHG emissions significantly. As Thailand has set a strict and ambitious target for emission reduction, these effects could be amplified with the number of miscalculated projects. Regarding the costs, the figure further strengthens the importance of implementing RETs. We show that the cost increase for RESs with RETs is relatively smaller than that of business-as-usual. As discussed in the TVSEP data, electricity expenditure has already increased by 54%p with business-as-usual in the last 10 years. With the increasing importance of electrical appliance ownership to economic growth, this development will most likely continue in the future. By implementing RETs, the rising costs and, consequently, also the risks of energy-induced poverty mitigated.
Pointing out the economic, ecological, and independence impacts of RES, several studies have emphasized the importance of including the local community in the decision-making process for the long-term success of RES projects. They further point out the importance of creating job and business opportunities, knowledge transfers, and considering existing capacities [
6]. Meeting this need, several pilot projects have developed RETs producible from local materials, indicating the possibility of local manufacturing. Existing local knowledge could be an influencing factor as it ensures continued operation in case of failures and break-downs. One option would be car batteries as second-life BESSs. They already have an existing market and have proven to be an inexpensive solution to shave load peaks [
51]. Thus, not only quantitative measures but also soft social factors should also be included in the decision for a RES design and the choice of RETs.
Considering the results above, we can, thus, conclude that for the model community, RESs with a PV would be ecologically beneficial whilst also increasing the households’ independence from the power grid. We further found that BESSs are crucial for all evaluated factors and their inclusion is, therefore, strongly recommended. However, this system is only economically feasible with FITs of 0.05 USD/kWh or carbon credits of 0.08 USD/kgCO2-eq.. Due to low wind speeds and high initial costs, including WTs is not viable at the model community’s location in any scenario.
We, therefore, recommend that policymakers implement and promote PVs and BESSs to foster energy resilience. Transparent and stable subsidies that investors can rely on in the long-term need to be offered to ensure the economic attractiveness and feasibility of RETs, both at initial investment and during operation. We have shown that carefully designed FITs and carbon credits are sufficient ways to foster the implementation of RETs. To overcome the initial investment barrier, we further advise the implementation of energy policies that offer particular financial and technical support targeted toward the most disadvantaged population. One option is reduced interest rates of loans for small-scale PVs and BESSs. However, citizens need to be supported in applying for these subsidies and loans, as the financial literacy of the rural population is limited. Reducing investment costs of the RETs is another option to mitigate the investment issues. However, using innovative technologies such as second-life batteries should be done with care. Their implementation must be preceded by the formation of regulatory frameworks clarifying the product’s liability and capacity. Policymakers should consider developing clear regulations as a long-term goal that companies and industries can rely on for an extended period. As communities should be involved in the decision-making process to include social factors, we further recommend tailored energy projects or better access to educational programs. We also propose considering local production and manufacturing options to foster entrepreneurship, employment, and knowledge-transfer. Further, waste management, construction impacts, and global emissions must always be considered for the long-term sustainable success of projects. In light of the Sustainable Development Goals, these implications do not only address Thai stakeholders, but also international organizations and developed countries. Lastly, to formulate suitable policies and integrate the appropriate energy systems, we advise stakeholders to conduct further analyses following our, or related, methods.
6. Limitations and Further Research
In the process of conducting this case study, we have simulated 56 different RES scenarios with detailed input data collected from the market, synthesized from household panel data, and retrieved from related-research studies as well as national and international governmental and statistical institutions. However, as is common in simulations, simplifications regarding the RES’s set-up were unavoidable. Thus, we have assumed the technical and economical specifications of inverters and converters to be included in the RETs. We have further used a simplified approach towards governmental incentives, e.g., omitting administrative costs or non-linear structures. Further, even though we have imputed and highlighted the importance of variations over time, our inputs are still subject to considerable uncertainty. As data in Thailand is not always up-to-date, all inputs may deviate from the chosen values; hence, the outputs, too, may deviate. The results we present should therefore be seen only as an initial guide for future policy action.
As this study was rather theoretical, we advise conducting case studies with locals in existing Thai communities. This allows for the collection of technical and economic data on RETs, specific household characteristics, local market data, and RET availability. Regarding the imputed energy demand, we have taken appliance-usage behavior from related literature. Surveys at the site would allow for the evaluation of these inferences and possibly lead to more-accurate load profiles. Expanding this data to businesses, as well as governmental, educational, and medical institutions, that are commonly found in rural communities would further enable the simulation of communities that go beyond a household-only structure. More case studies would further pave the way for the design of policies that are better adapted to the local context, needs, and preferences of the community to support the long-term success of energy projects.
Next to including more RETs such as hydroelectric power plants, we advise implementing social measures of a RES in the simulation. In this study, we have discussed this factor qualitatively, but quantitative results would enhance the comparability of RESs. We propose the implementation of more financial measures, such as interest rate reductions on loans, to enable more thorough analyses of governmental subsidies. Outputs such as an IRR would also allow a more thorough assessment of the different simulations. We further advise including more resilient measures, such as adjustments towards climatic conditions and shocks, to enable a multi-level analysis on RES resilience.
7. Conclusions
As Thailand is facing risks to energy resilience, the government is promoting the implementation of distributed renewable energy systems. To properly design and support resilient systems, we identify the need for a comprehensive understanding of the impact of renewable energy technologies. We, therefore, analyze the influence of a wind turbine, a photovoltaic system, and a battery storage system on the energy resilience of a model rural community. To measure resilience, our indicators are economic feasibility, environmental benefit, and independence from the central electricity grid. Because the inputs significantly affect the outputs of simulations, we put a strong emphasis on detailed data by collecting topical local market data, hourly weather times series, and detailed technical information. We close the gap of missing information by evaluating historic data on appliance ownership from the TVSEP and, subsequently, synthesizing hourly load profiles. We find that adding a photovoltaic system and battery storage decreases emissions by 11,500 kgCO2-eq./a and increases independence, measured by the degrees of self-consumption and autarchy, by 50%. As this system is not economically feasible, two governmental subsidies are evaluated. The results indicate that feed-in tariffs of 0.05 USD/kWh or carbon credits with a value of 0.08 USD/kgCO2-eq. allows these renewable energy systems to become more financially attractive than sole supply from the power grid over a 10-year project period. Our study further shows that it is essential to consider the development of electricity demand, highlighting its impact on greenhouse gas emissions and the risks of energy-induced poverty. We discuss the importance of considering local conditions, capacity building, and job opportunities. We urge decision-makers to design policies fit for local contexts, needs, and preferences and, thus, recommend further case studies at the site. With our study, we show that carefully considered policy programs are a key tool to support energy resilience in Thailand by supporting independence from fossil fuels and reducing environmental hazards.

