1. Introduction
Many educational reforms have happened in Saudi Arabia during the last four decades, with the adoption of 5-year development strategies, which started in the year 1970, as the primary motivator for these reforms [
1]. The majority of Saudi cities have experienced very quick changes in ground use, urban expansion, and inhabitants increase, putting greater pressure on current educational services [
2]. In many circumstances, the capacity of current services is insufficient to satisfy the rising population demand, particularly in the absence of pre-planning for the quantity and distribution of services [
3,
4]. Many challenges have developed because of these developments and pressures on educational services. One of these challenges is achieving spatial equity in educational services. This needs the participation of policymakers to implement the necessary steps to deliver the effective and high-standard educational services that citizens seek in terms of quantity and sufficient geographical distribution [
3,
5].
One of the most essential and crucial general services that residents always demand is education. Many countries have developed strategies and procedures to attain educational justice. Evaluating educational services efficiency is a multifaceted mission that covers several aspects like quality, availability, quantum, dispersal, and accessibility [
6]. Nonetheless, the most essential aspect is the spatial distribution of schools. Decision makers are tasked with ensuring that schools are distributed fairly throughout cities such that they can accommodate the current and anticipated population, enabling pupils to commute to school in safety with the least amount of money, time, and effort required. However, many public services, particularly schools, are distributed randomly and according to necessity [
1]. For instance, many schools in Saudi cities are situated close to congested roadways, highways, or other potentially hazardous areas; another issue is that some public primary schools are concentrated in specific districts [
2]. Additionally, Saudi Arabian residents of a tiny hamlet or area may persuade decision-makers to create a new school regardless of whether their demand is justified [
1].
As a result, from an urban planning, environmental and geographical standpoint, spatial analysis of school distribution has attracted considerable attention in recent decades [
7]. They have been attempting to attain spatial justice [
8]. The expectation of humans for the equitable distribution of service facilities to all pupils is known as spatial equality in educational services [
9].While spatial inequality, according to [
10], is the difference in distances across geographic areas from the house to the desired service facility. Besides, spatial inequality is unequal service distribution and it spread unfairly over a specific region [
11]. Many researchers studying some elements that can assess spatial equity of services, such as service buffers zones [
12], disparities in population across various areas [
13], and Financial support [
14], increasing teacher ratio to pupils ratio [
15], and the schools’ buildings establishment [
16]. If spatial justice is a spatially dependent issue, ref. [
11] added that it cannot be determined solely through traditional administrative indicators, but also via a variety of economical, demographical, and social aspects of inhabitants, as well as dissimilarities and similitudes between locations.
Many papers have studied spatial analysis in different cities in Saudi Arabia. In Riyadh city, ref. [
17] illustrated that 104 out of 167 districts lacked schools, with the majority of those distributed in a convergent way. Likewise, [
1] discovered a school scarcity in Riyadh’s north end, resulting in congestion in most schools in the south end. (Alharbi, 2018) found that the pattern of the spatial distribution of schools in northern Riyadh is clustered and random. Moreover, the spatial analysis clarifies why there is a concentration of schools in a tiny region and the buffer zones intersecting, when other places had a scarcity. In Jeddah city, refs. [
2,
18] found that the geographical distribution of schools revealed a significant imbalance across districts, with numerous schools concentrated in the city center, where population density is higher, and few schools in the north and south districts. In their research of primary schools in Jeddah, ref. [
19] discovered that faster commute distances to dense schools that are primarily situated in the city center, whereas other areas demand extra schools. In Abha, ref. [
17] discovered that schools were grouped in the city center and western regions, where population density is higher, and most of those schools were spread randomly. (Alqahtani, 2018) observed similar results, and he stated that the city still needs a lot of primary schools because the present ones only cover 8% of the Abha region. In Buraidah city, ref. [
20] investigated the equity of the spatial distribution of schools and discovered that schools were unevenly dispersed, with many clustered towards the city center. In addition, the number of schools and population density had a favorable link. In the Hail Region [
17] study found that schools were scattered randomly, and some densely inhabited areas were not served by schools. Geographic Information Systems (GIS) were used to model the distribution of primary schools in Al-Fallujah city in order to investigate the spatial distribution efficiency planning of primary schools and to identify the optimum locations for locating these services based on the criteria of distance, and population [
21].
Most earlier research has investigated the geographical distribution of schools inside cities using GIS techniques; however, none of these studies produced a model for spatial equity priority for educational services. Besides, this study is based on the hypothesis that the new technology used in the domain of urban service management and planning supplies accurate outcomes to solve the problem. Due to poor planning and the employment of antiquated planning and administration methods, the spatial distribution of elementary and middle schools in El-Taif city is unsatisfactory. To achieve spatial equity for educational services in this study, Arcgis10.5 software was applied to evaluate the current locations of schools and their patterns. Moreover, we assessed whether the distribution of girls’ elementary and middle schools is sufficient or not according to the Ministry of Municipal and Rural Affairs (MOMRA) standards for education services distribution. Finally, a model of the spatial equality priority for public elementary and middle schools in the city was built. Recommendations were sent to specialized governmental organizations to improve educational services in the city. Eventually, the findings of the study can be used as a starting point for decision-makers to use when addressing the spatial equality priority of educational service in developing nations in general, and Saudi Arabia in particular. Furthermore, this study will contribute to complying with the guidelines of the UN-Habitat sustainable development goals especially goal 4, which aims to “ensure inclusive and equitable quality education and promote lifelong learning opportunities for all” [
22,
23,
24]. In addition, this study shows how using GIS technology is a help for urban plans for educational service and management, as well as it is a method for enhancing the sustainable improvement of cities.
Study Area
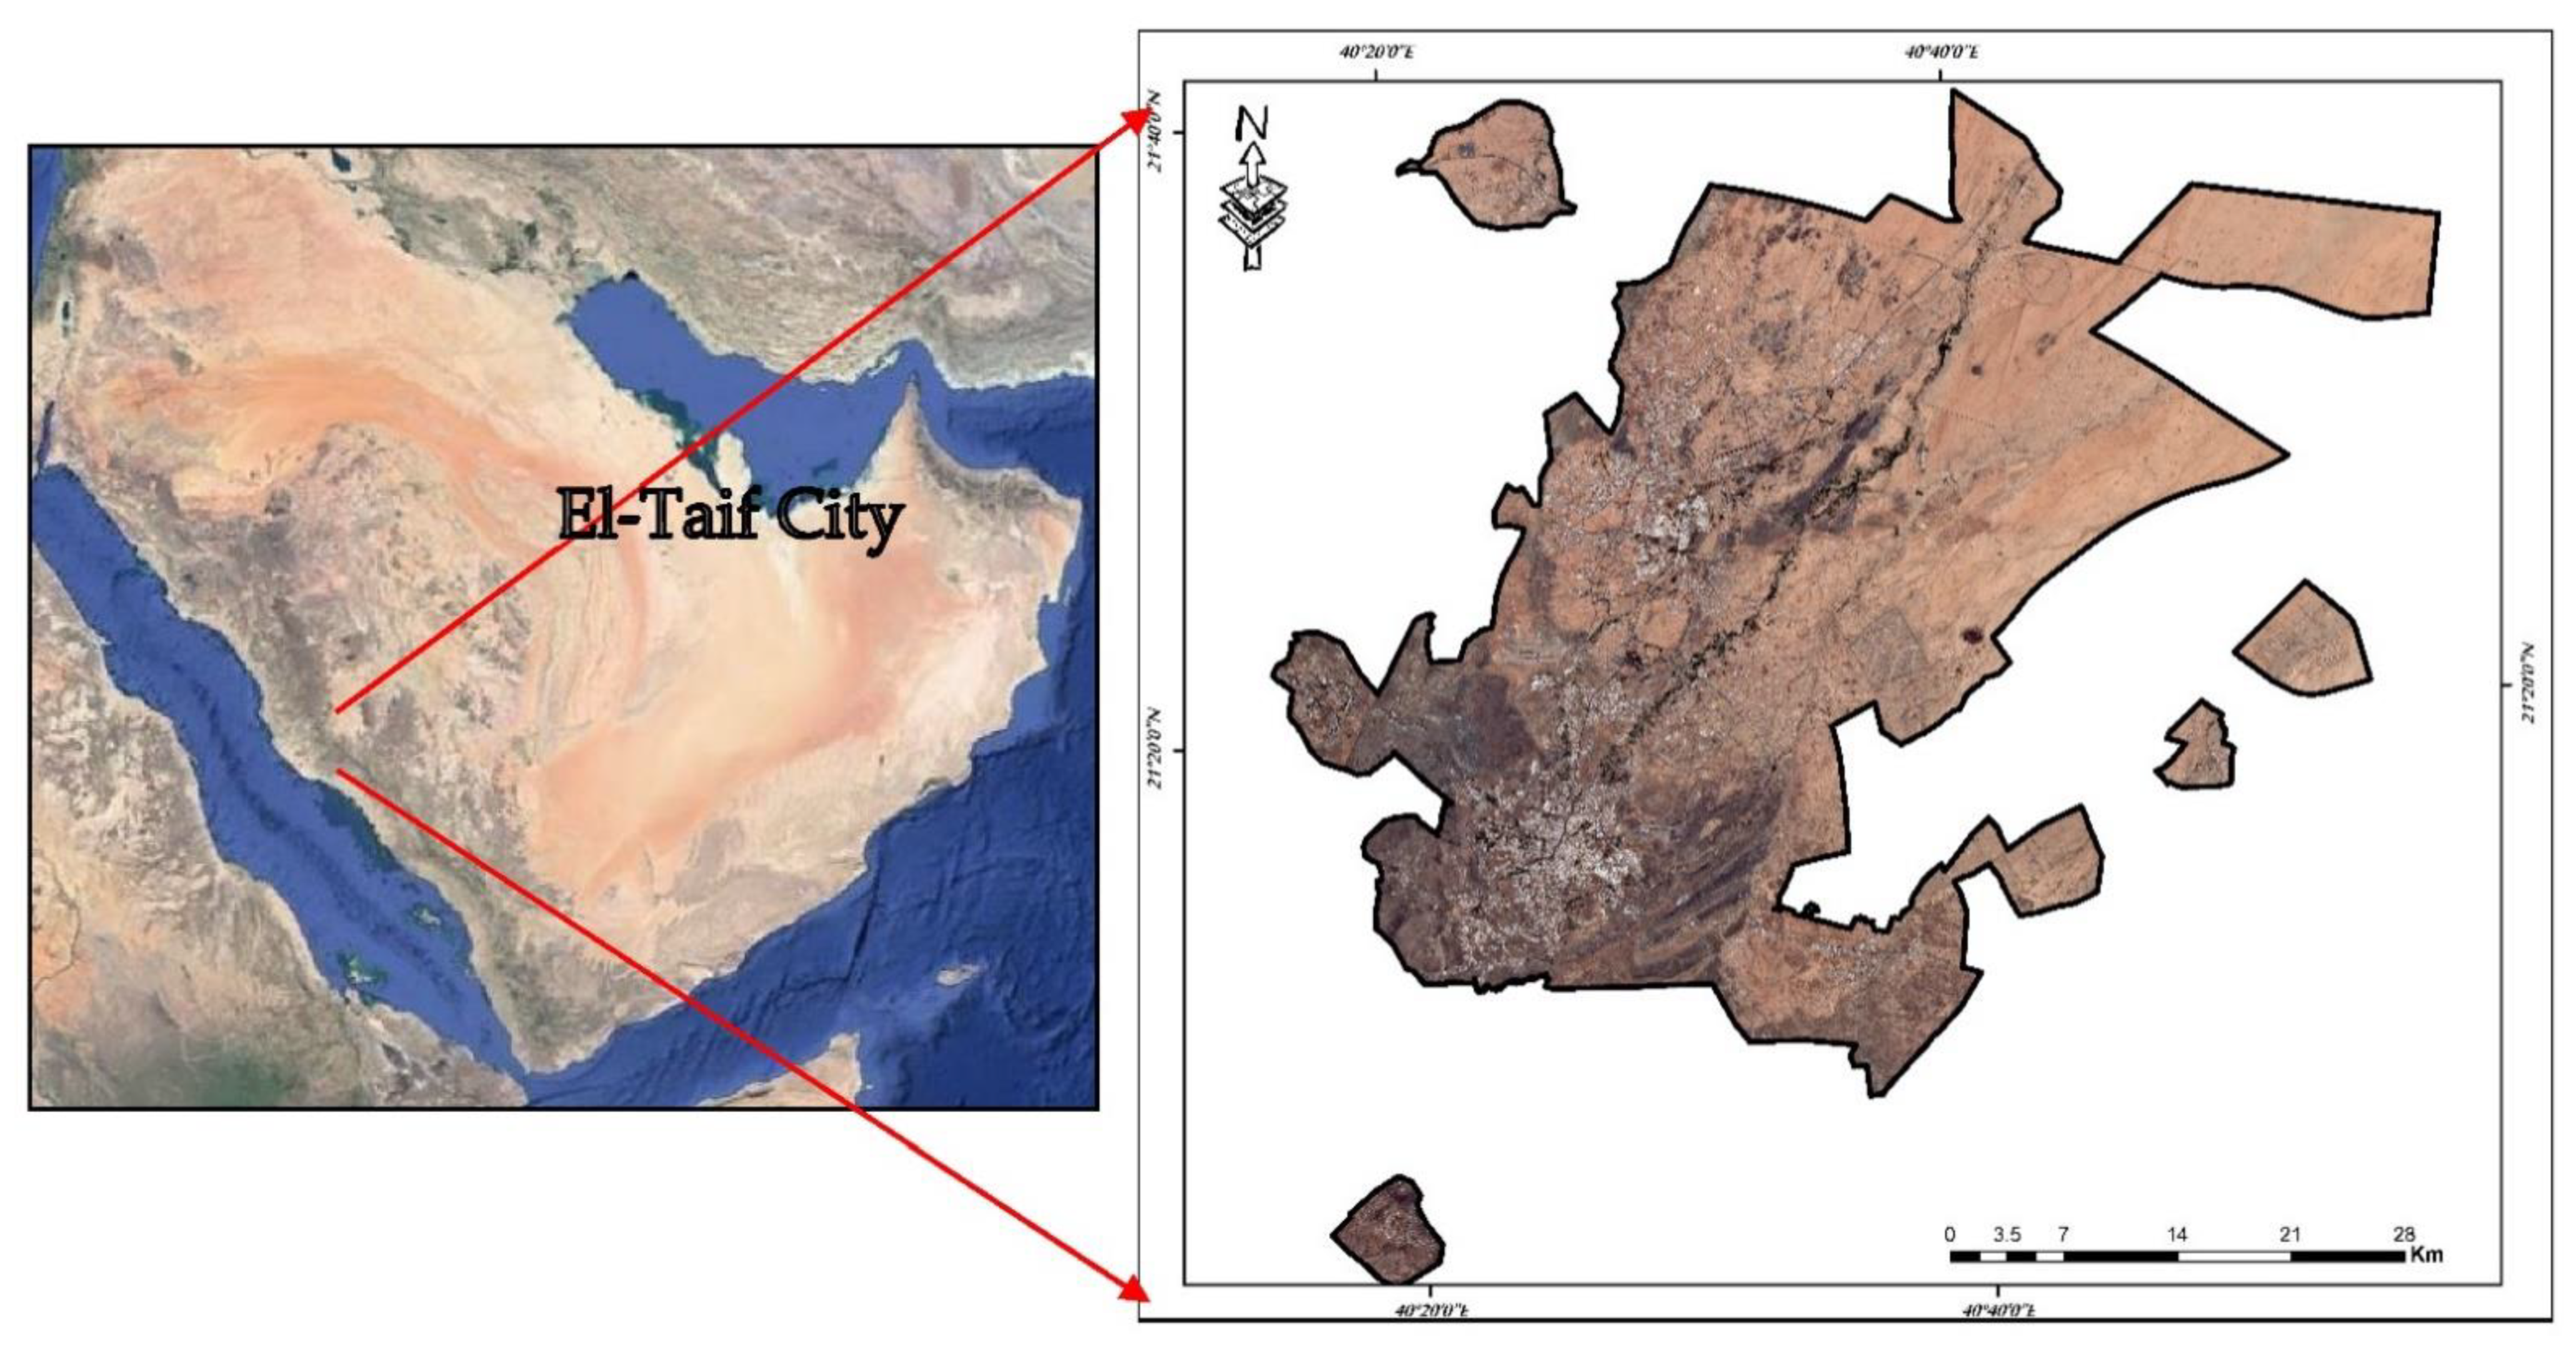
El-Taif city is in western Saudi Arabia, on the eastern slopes of the Sarawat Mountains, and is one of the Makkah Region’s largest governorates in terms of area. It is located at an altitude of 1800 m above sea level. Its geographic extent covers latitudes of 21°20′ to 21°41′ North and longitudes of 40°15′ to 40°52′ East as shown in
Figure 1. El-Taif is the Kingdom’s sixth biggest city and the third largest in the Makkah area. Taif’s population was 381,000 in 1990 and it had expanded to about 689,000 in 2020, at a rate of 2% increase per year [
25]. There are more than 1000 hamlets around El-Taif city, around 100 km south of the city. Most of their populations, particularly young people, have emigrated to cities in pursuit of economic benefits, of which El-Taif city is one. This is regarded as one of the major factors for Taif’s population growth. Hence, there is very great need to create a balance between population growth and provision of services, especially the education for sustainability.
2. Materials and Methods
Data were obtained from specialized agencies as represented in the
Table 1. All data were digitalized and stored in an Arcgis10.5 geographic database as feature layers for further analysis. The methodology is illustrated in a conceptual chart as shown in
Figure 2.
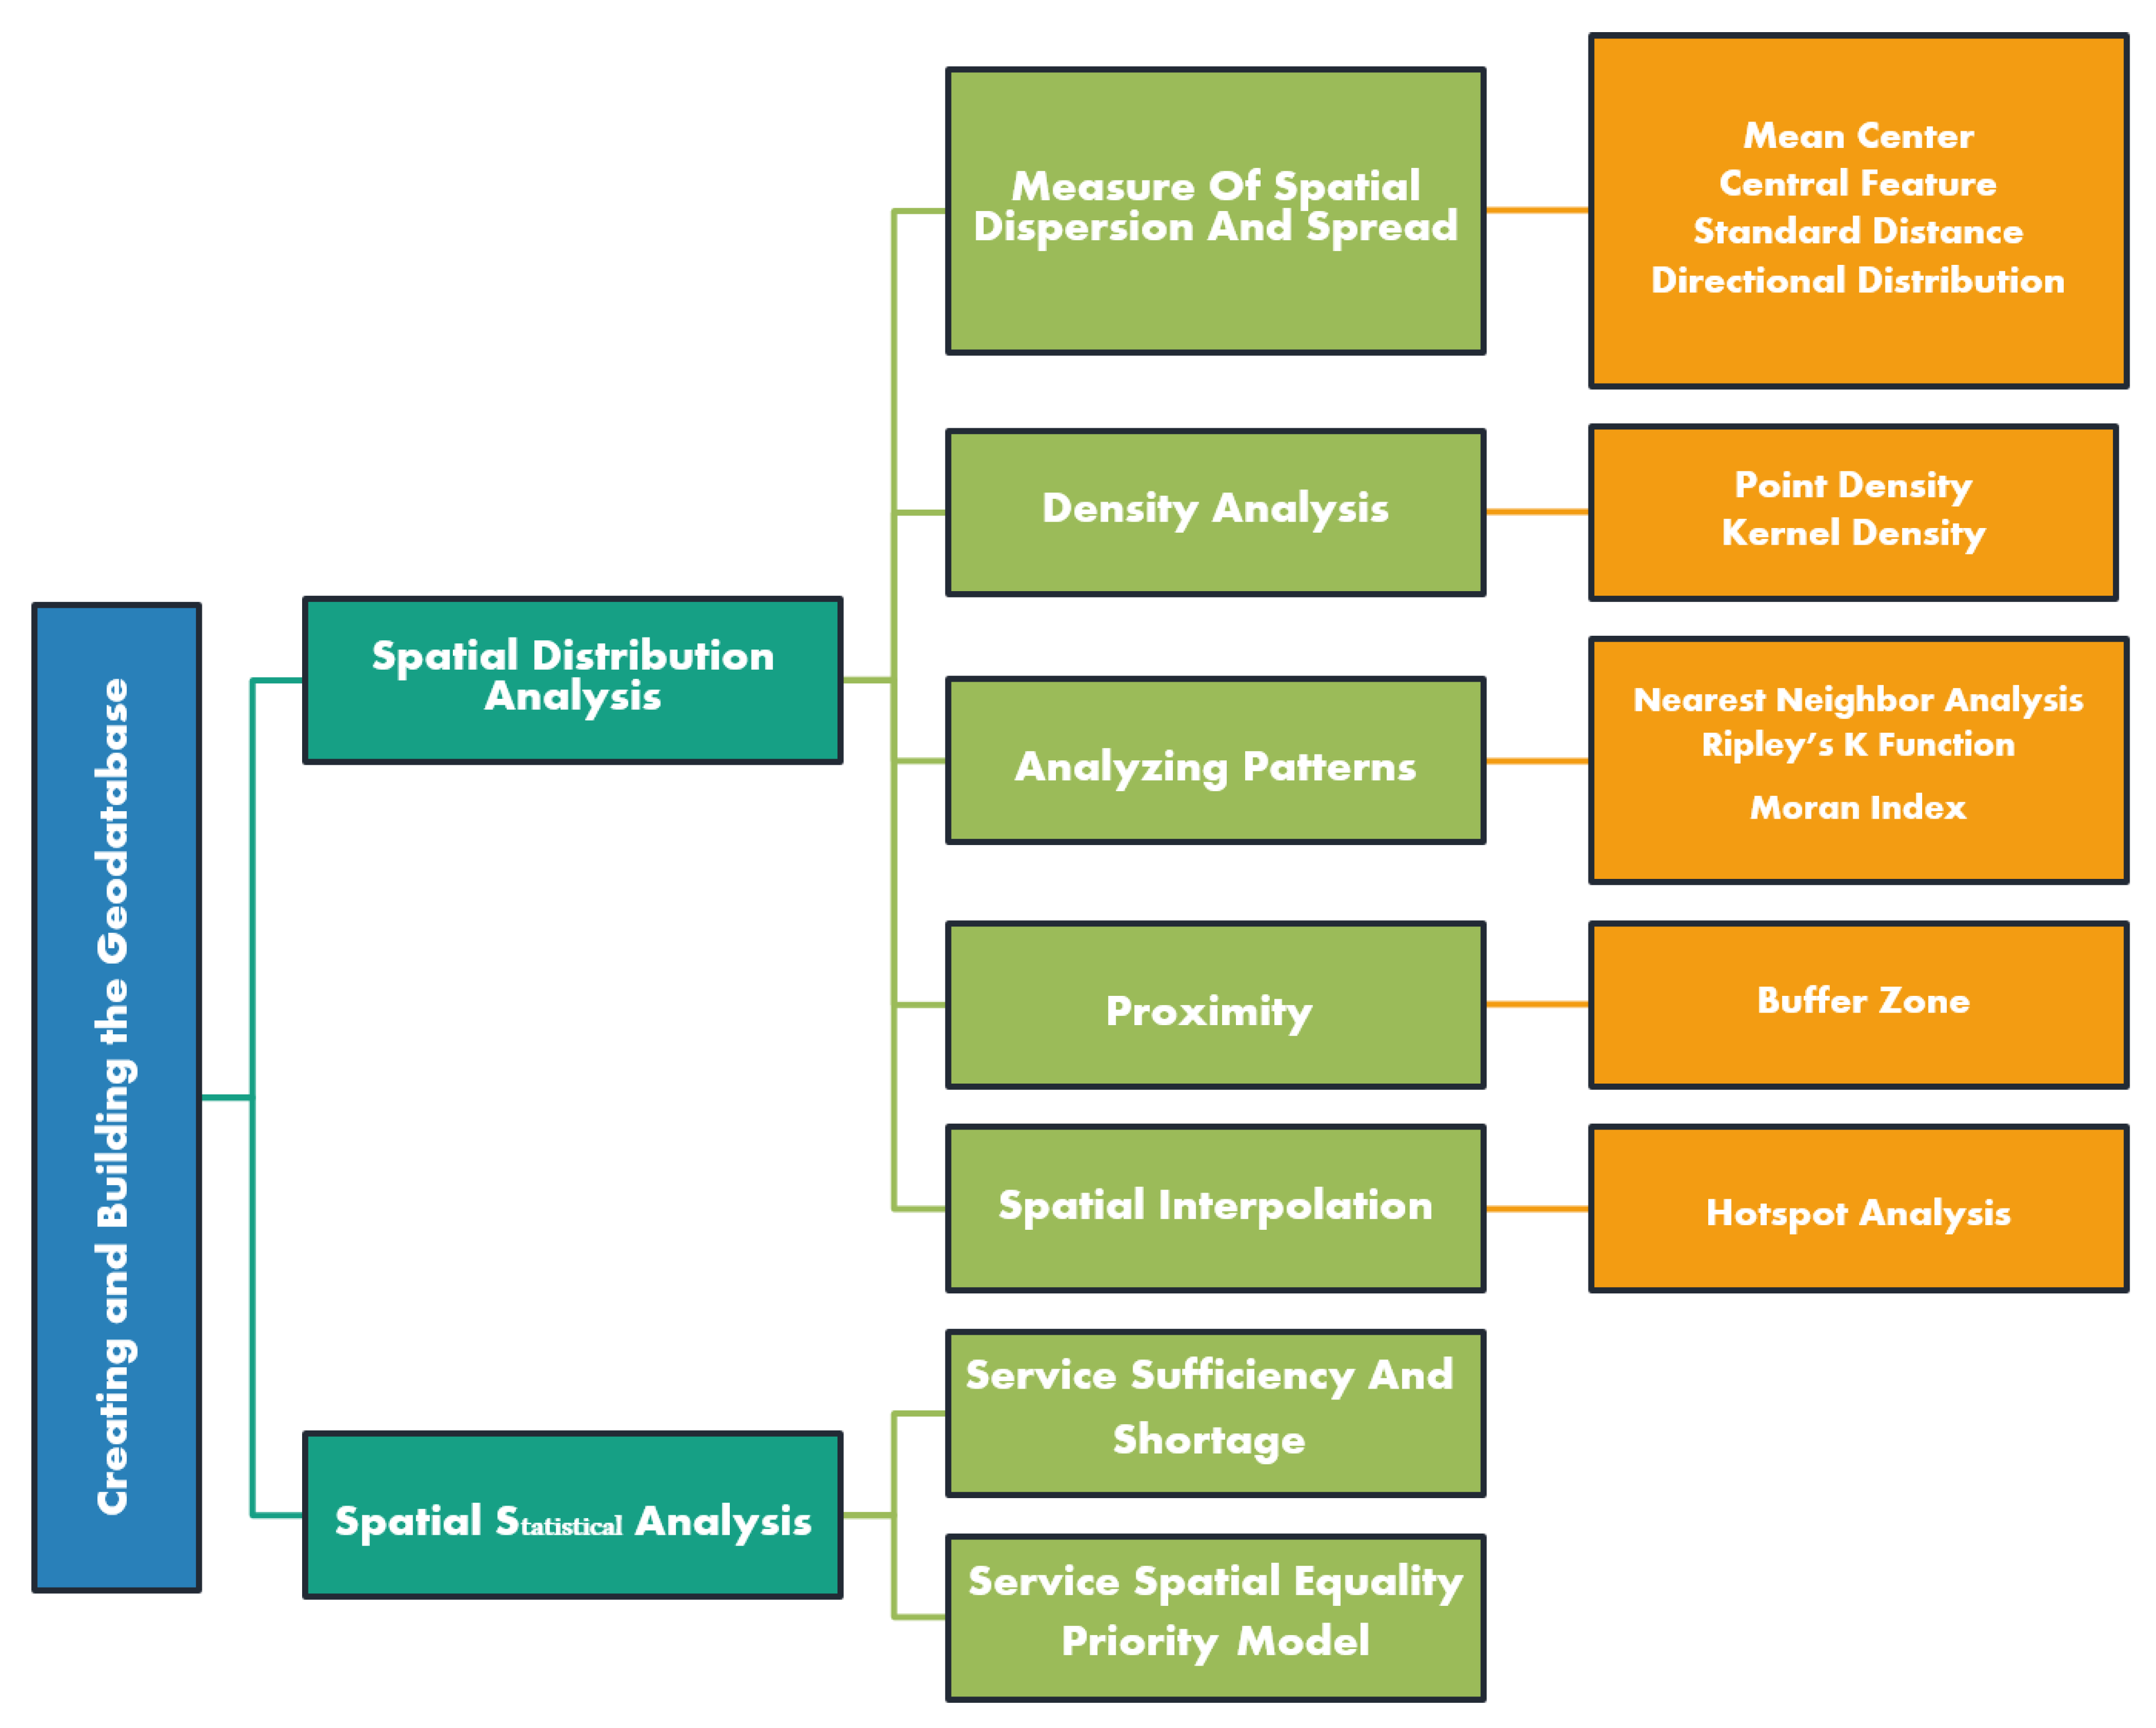
In this research, first, GIS spatial tools were used to measure spatial geographic distributions. These tools compute numbers that describe distribution properties, such as concentration, dispersion, and directions to determine and compare school distribution [
26]; they are also referred to as spatial distribution and measurement spread tools. They contain mean center, central feature, standard distance, and directional distribution, which are covered in great depth in the Results. Secondly, the density analysis method was then used to identify the variation in density of the schools over the research region [
27]. It includes two main tools, point density and kernel density, are discussed and applied below. Pattern analysis was the third GIS tool used and it is a highly effective tool for discovering school distribution types and determining if they follow a certain type or are haphazardly dispersed. It includes the average nearest neighbor, Ripley’s K function, and Moran Index. Fourthly, GIS proximity tools were used to demonstrate how close a phenomenon is to other related geographical factors such as buffer zone. In the outcomes section, such techniques are described and utilized. The five GIS procedures provide the spatial interpolation that forecasts cells values in a raster form for a delimited numeral of sample data points [
28]. This is followed by using the Hotspot analysis, which is a GIS technique that finds statistically significant geographical groupings of high values (hot spots) and low values (cold spots).
Moreover, GIS statistical tools were used to examine the sufficiency and shortage of current elementary and middle schools for girls. Ministry of MOMRA are the primary reference standards for all procedures as shown in
Table 2. Those standards investigate the educational service sufficiency and shortage according to served population number and served buffer zone.
Services sufficiency and shortage equations were applied as follows:
If the result is a positive number (+), it means it has sufficiency, while if the result is a negative number (−), it indicates a shortage.
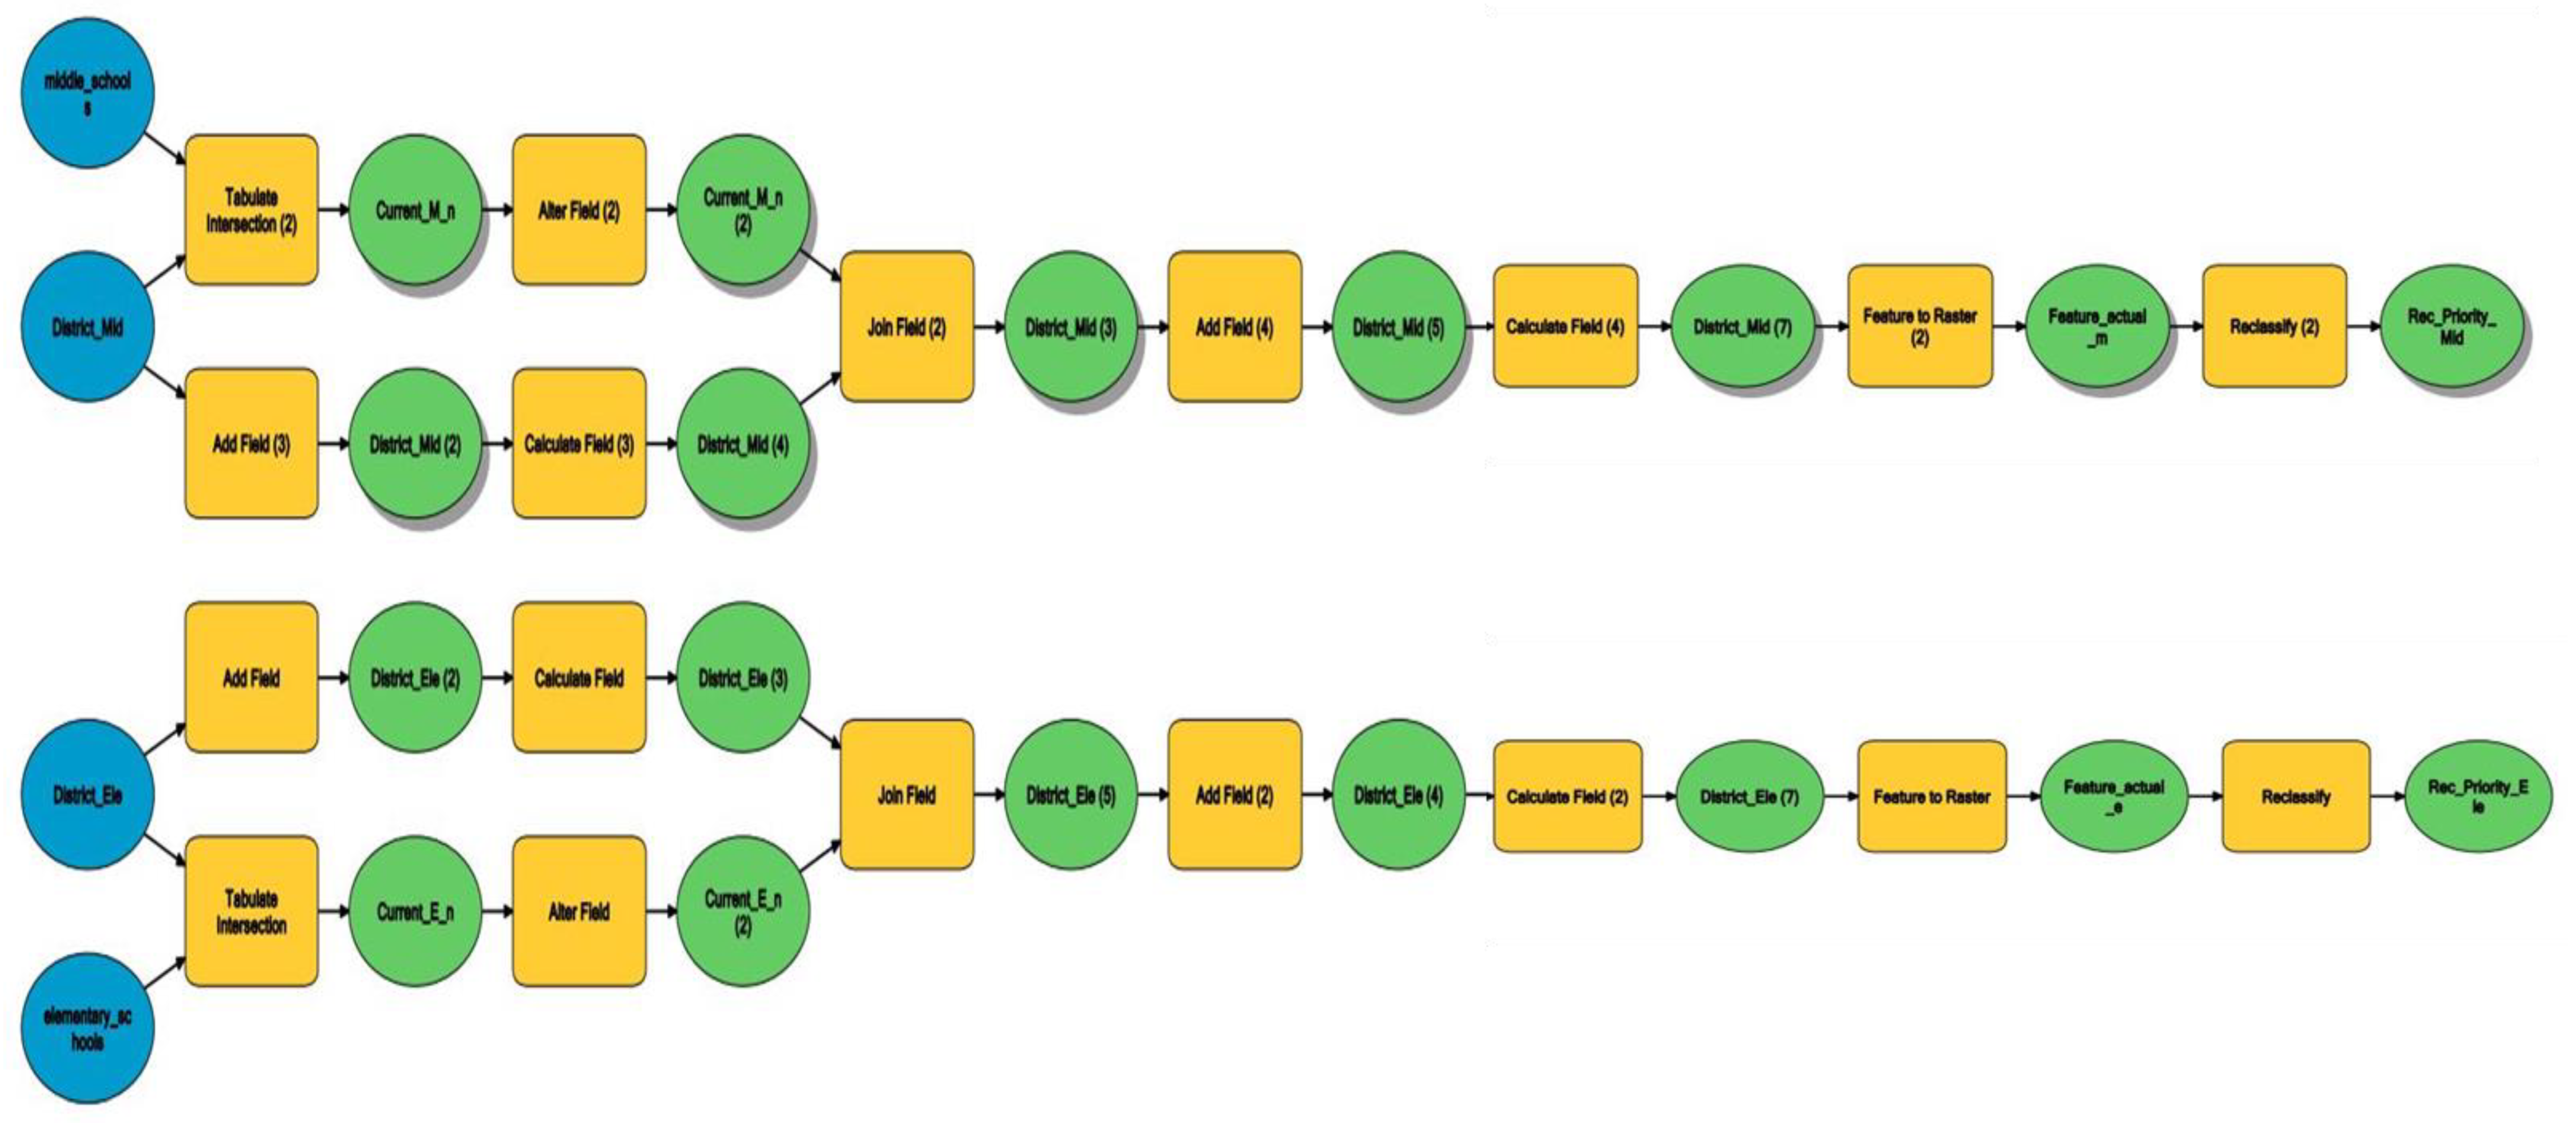
Eventually, the Modelbuilder tool in Arcgis was used to examine those standards, which were also the basis to develop suggestions for the spatial equality priority for public elementary and middle schools. Public elementary and middle schools were digitized and represented in the Arcgis10.5 platform. The tabulate intersection tool in Arcmap was used to count the current numbers of public elementary and middle schools within each district. Then a new field was added to the attribute table and named optimal elementary school numbers. It was calculated through the current population number divided by served population number in the standards by calculate field tool. These optimal educational numbers were then linked to the administrative districts’ shapefile attribute table using the tool join field. The add field tool was used once again and named the actual needs of elementary school numbers. This was computed to show the difference between the current numbers of elementary schools and their optimal educational numbers using the calculate field tool. The results were then converted to the raster format by the use of the raster tool. Finally, the raster was reclassified into a numerical scale from 1 to 3, where (1) was for areas with less need and (3) was for areas with the most need for spatial equality priority for elementary schools. The same modelbuilder tool was operated again to determine the spatial equality priority of middle schools, as shown in
Figure 3.
3. Results and Discussion
Data and maps of the sites of public elementary and middle school for girls within El-Taif city districts aid in understanding their spatial distribution. As a result, this part begins by introducing various GIS spatial analysis tools that may help locate the center of schools, school distribution patterns, directional trends, and clusters of elementary and middle schools. Following that, some statistical approaches were used to demonstrate the sufficiency and/or shortage of elementary and middle schools according to the Ministry of Municipal and Rural Affairs (MOMRA) criteria. Finally, modeling the spatial equality priority for public elementary and middle schools in El-Taif city is discussed.
3.1. Geographic Spatial Distributions Tools of Elementary and Middle Schools
Finding patterns and attributes in geographic point data can be done using the tools provided by spatial statistical analysis [
29]. The extent of the distribution of characteristics in a pattern can be determined using spatial statistics from GIS. The resulting direction of the pattern can be used for several purposes, for example, this research examines the inequalities in the distribution of educational services in El-Taif districts. The direction and orientation of elements such as points, polygons, and lines can be determined via spatial statistic tools in GIS [
30]. To detect the mutual exchange between schools in the El-Taif districts, several types of statistical analysis were used, such as the mean center, central feature, standard distance, and directional distribution. The mean center test, which locates the most central point of school distribution, is one of the statistical tests for basic graphics and analogizes them to the spatial distribution of the center of spatial gravity to acquire a central point for elementary and middle schools in the El-Taif districts [
31]. Central Feature is a tool that locates the feature that is closest to the center of a point feature class and is used to calculate the average schools between phenomena in the most prevalent locations [
26]. Standard distance is calculated by absolute point dispersal in relation to the mean center and is spatially identical to the standard deviation [
32]. It is a tool for making a polygonal circle whose radius is equivalent to the value for the standard distance; if the number of points within the circle polygon exceeds the number of points outside the circle polygon, the distribution pattern of points is centered or concentrated around the center. If it is the other way around, i.e., the number of points outside the circle is more than the number of points on the inside, the pattern of distribution points will be scattered or forked. The directional distribution ellipse measures the standard deviation of the features from the mean center separately for the
x-coordinates and the
y-coordinates [
30]. The directional distribution ellipse calculates the features’ standard deviation from the mean center for both the
x and
y coordinates individually [
30]. The entire length of each axis, measured from the mean canter, is equal to twice that axis’ standard deviation.
3.1.1. Elementary Schools
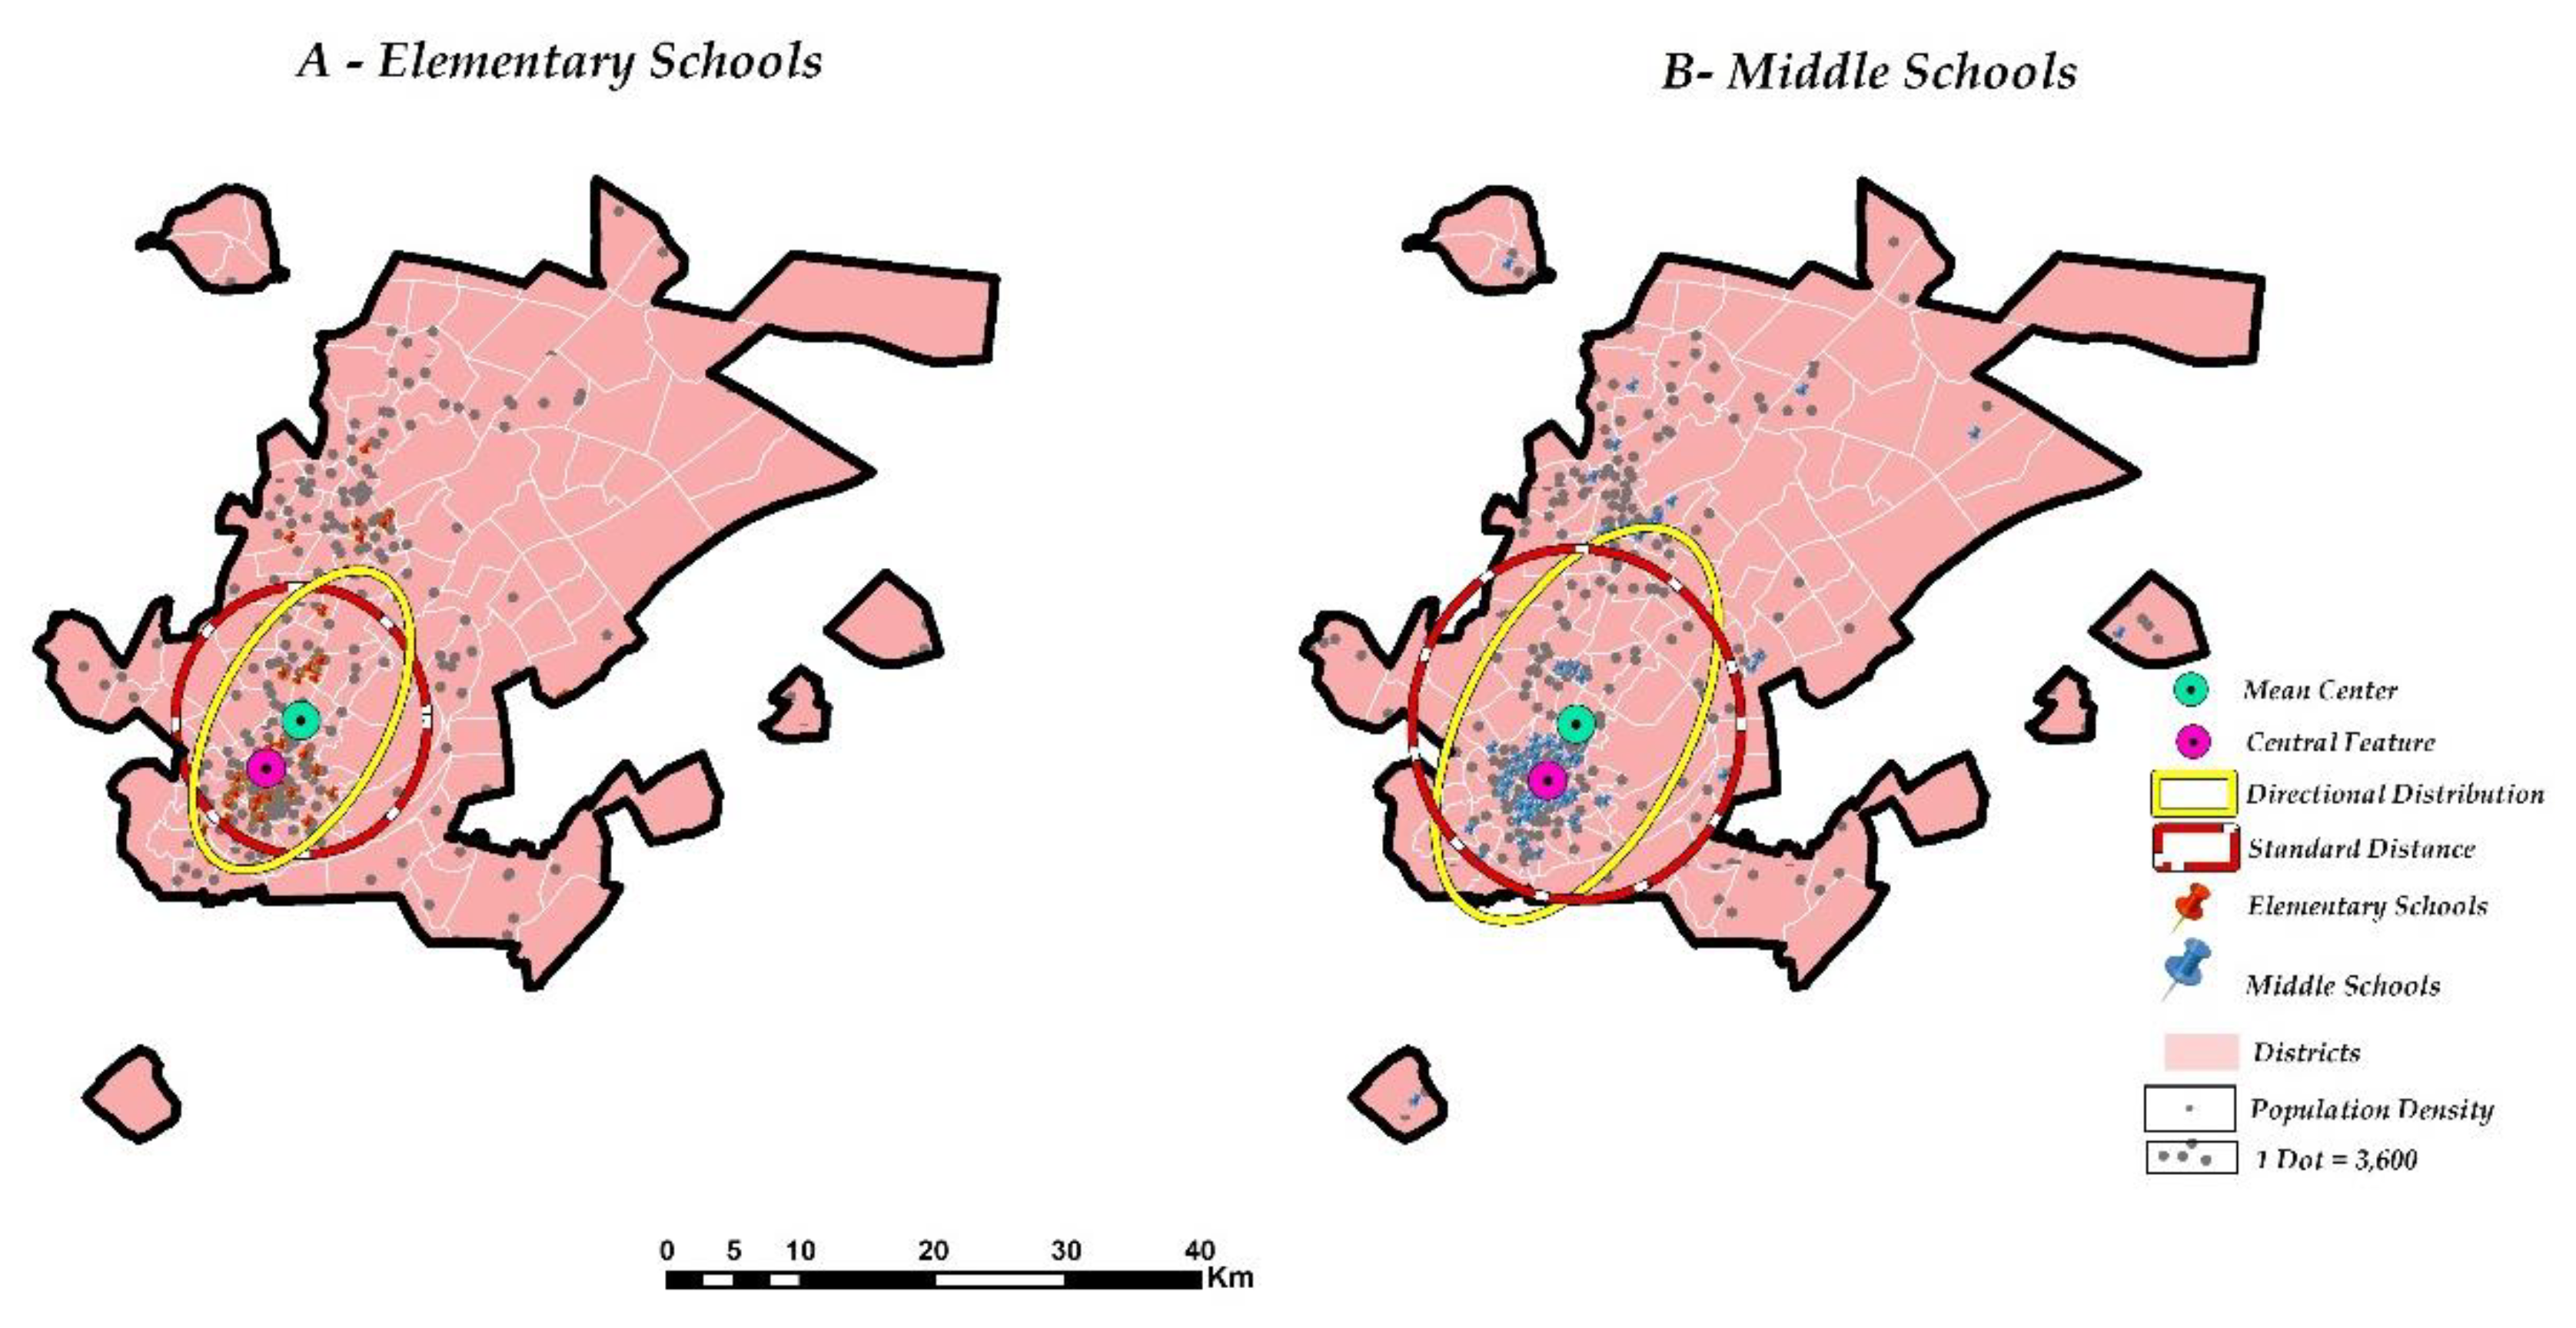
The results pertaining to the mean centers of elementary schools within El-Taif districts are also straightforward and consistent with the patterns in
Figure 4. El-kamesah asher elementary school was the actual elementary school center in the El-Taif districts, the distance between the actual center and the center was assumed to be approximately 311 m. The standard distance circle contained 27 schools and outside the circle 10 schools. The standard area totaled 298.01 km
2, accounting for 15.73 percent of the total area of the El-Taif districts (1894 km
2) for elementary schools. The number of schools within the standard distance was greater than outside. The distribution of schools was concentrated around the center. This indicates that elementary schools provide service for more than half of the neighborhood. As the standard deviation was measured in each direction from the mean center, the pull of the direction of the ellipse towards the north-south tendency in the city’s south-central region and the ellipse is closer to the oval shape which means that the educational services were concentrated.
3.1.2. Middle Schools
The results pertaining to the mean centers of middle schools within the El-Taif districts were also straightforward with the patterns in
Figure 4. It was found that the Talaea el-mobdeaat middle school was the center of the middle schools in the El-Taif districts and the distance between the actual and virtual centers was 524 m. The standard distance contained 62 schools and outside it 16 schools depicting 79.5% of the whole middle school’s number. The standard distance area of the middle schools was 511.72 km
2, accounting for 27.02 percent of the entire area of the El-Taif districts (1894 km
2). The concentration pattern of middle schools’ distribution within the standard distance circle was noticed. This means that middle schools provide services for more than half of the districts. The standard deviation makes the ellipse closer to an oval shape and direction of the city’s south-central region. This may indicate that schools are located in heavily populated residential districts and vital regions of El-Taif city.
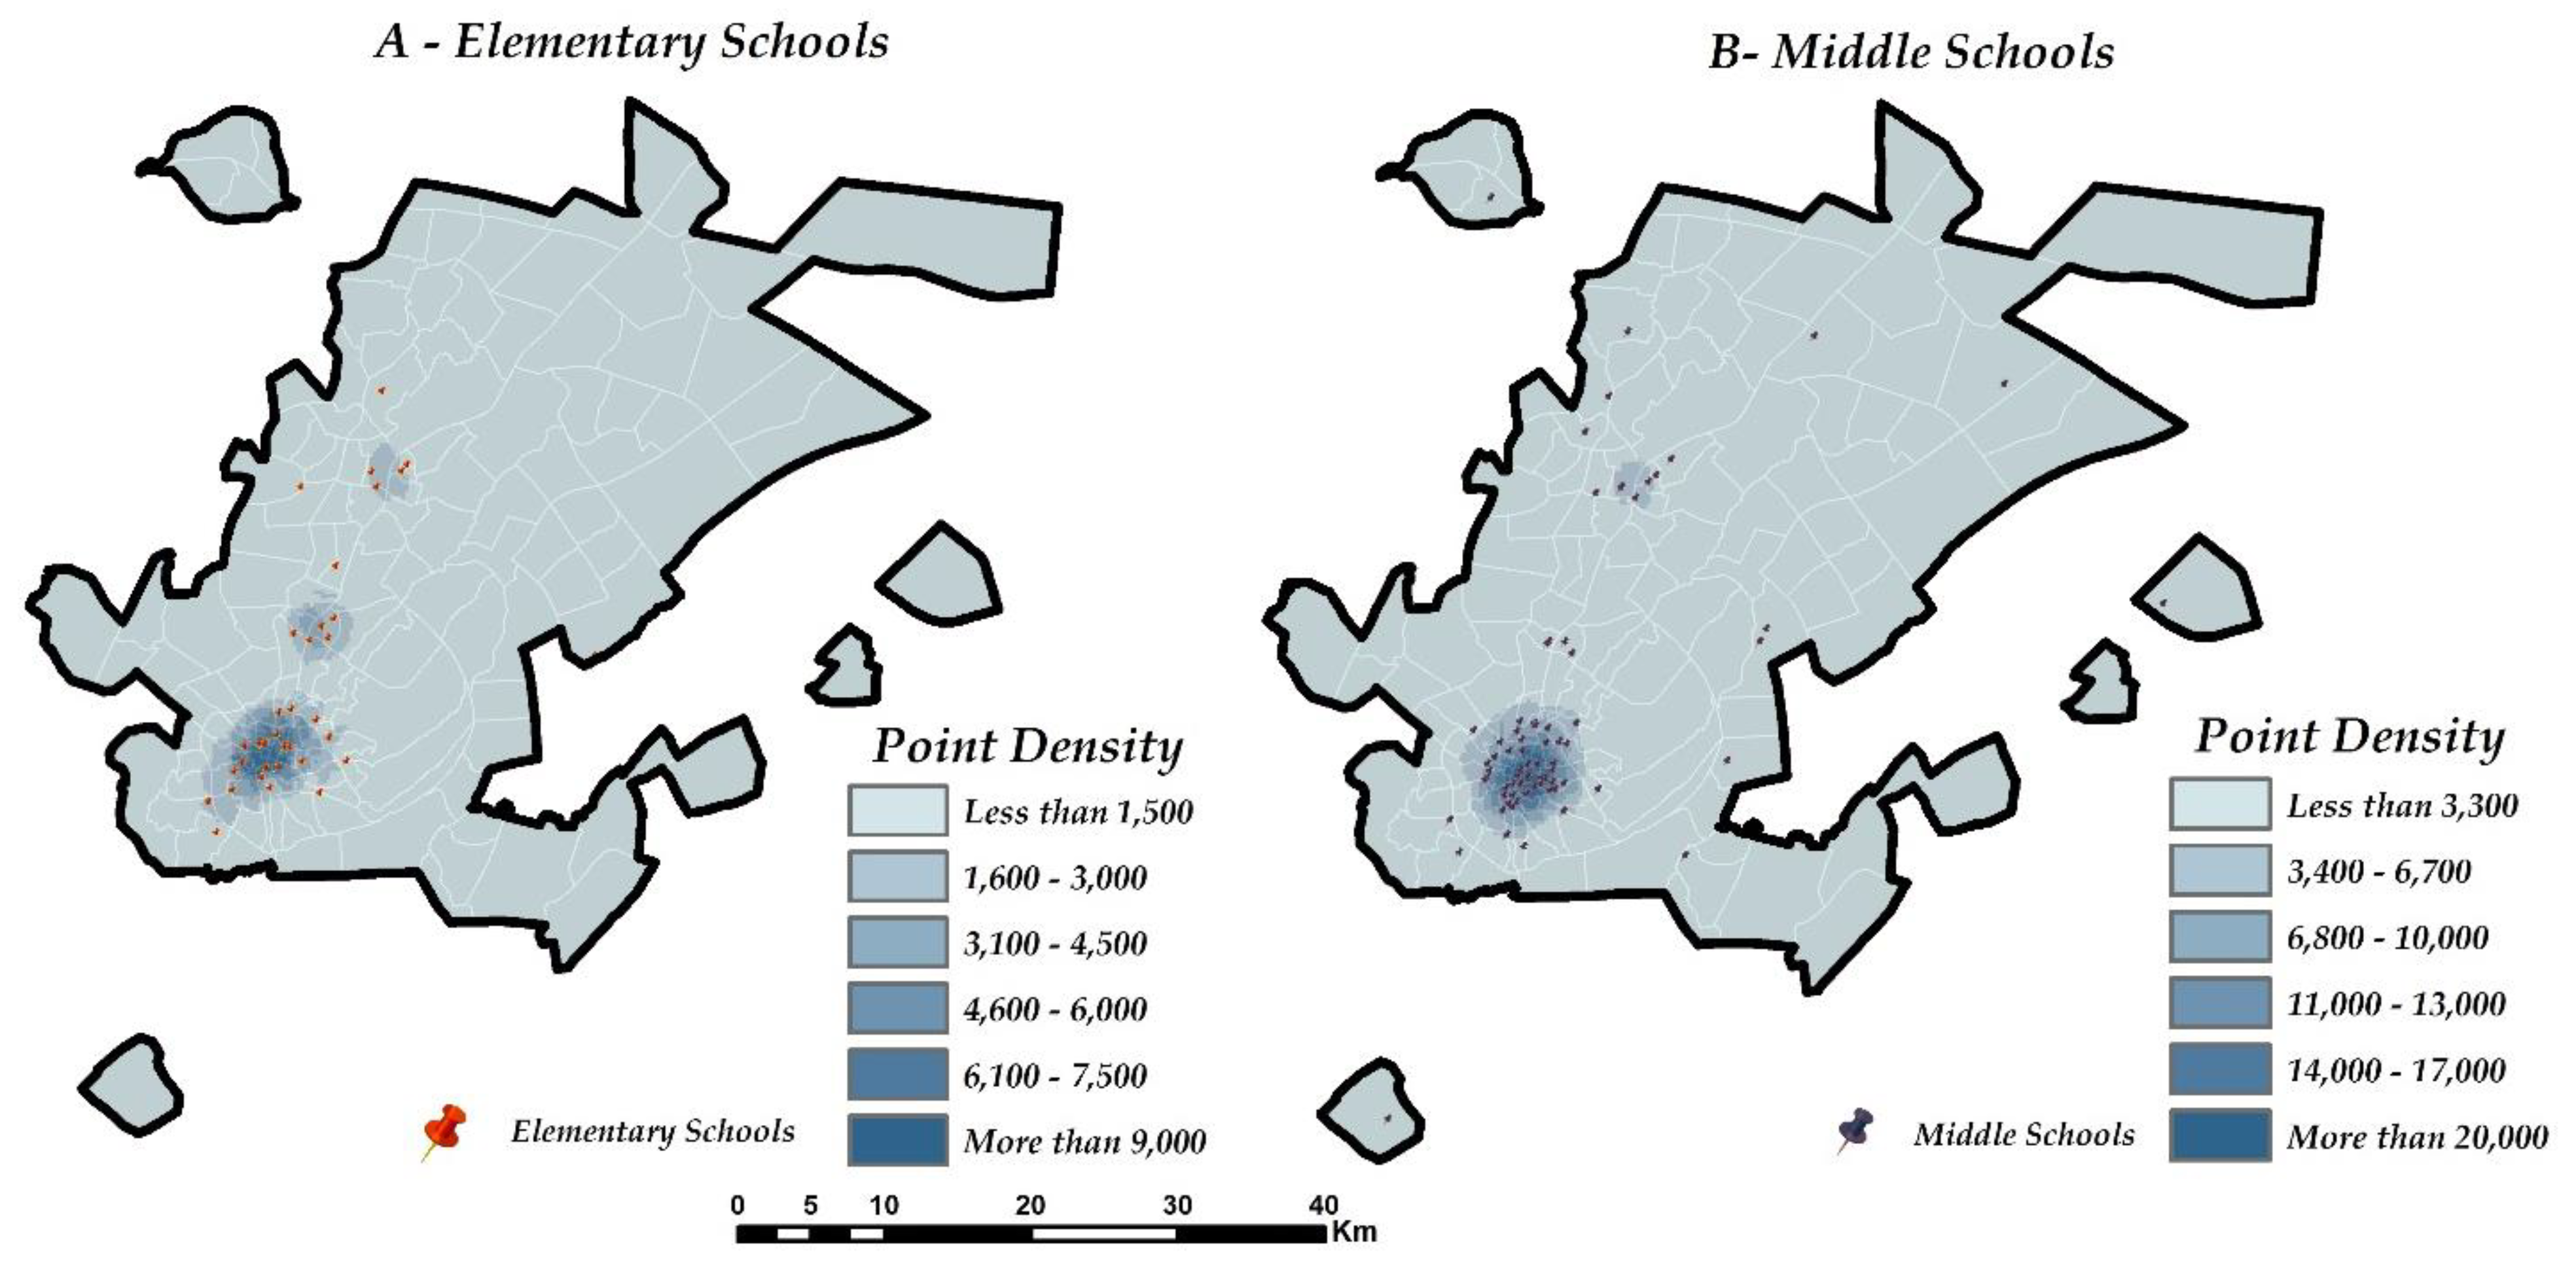
Point density is an approach that contributes to the creation of a surface map that reveals the distribution density scope to the phenomenon itself which is the public elementary and middle schools in the region [
27].
Figure 5 illustrates that the city had the largest point density for both public elementary and middle schools in two areas: the old, densely inhabited, and developed districts, and the southwestern section of the city, which has an important group of other government institutions and luxury stores that attract inhabitants. The elementary schools have an extra point density areas located in Al-Qaim Al-Asfal, Al-Halaqah Al-Ghrbiha, Al-Qaim Al-Aalaa, Al-Halaqah Al-Sharqia, Al-Aarj Al-Asfal, and Al-Aarj Al-Aalaa districts. These districts can be regarded as villages, with inhabitants able to persuade officials to build additional schools.
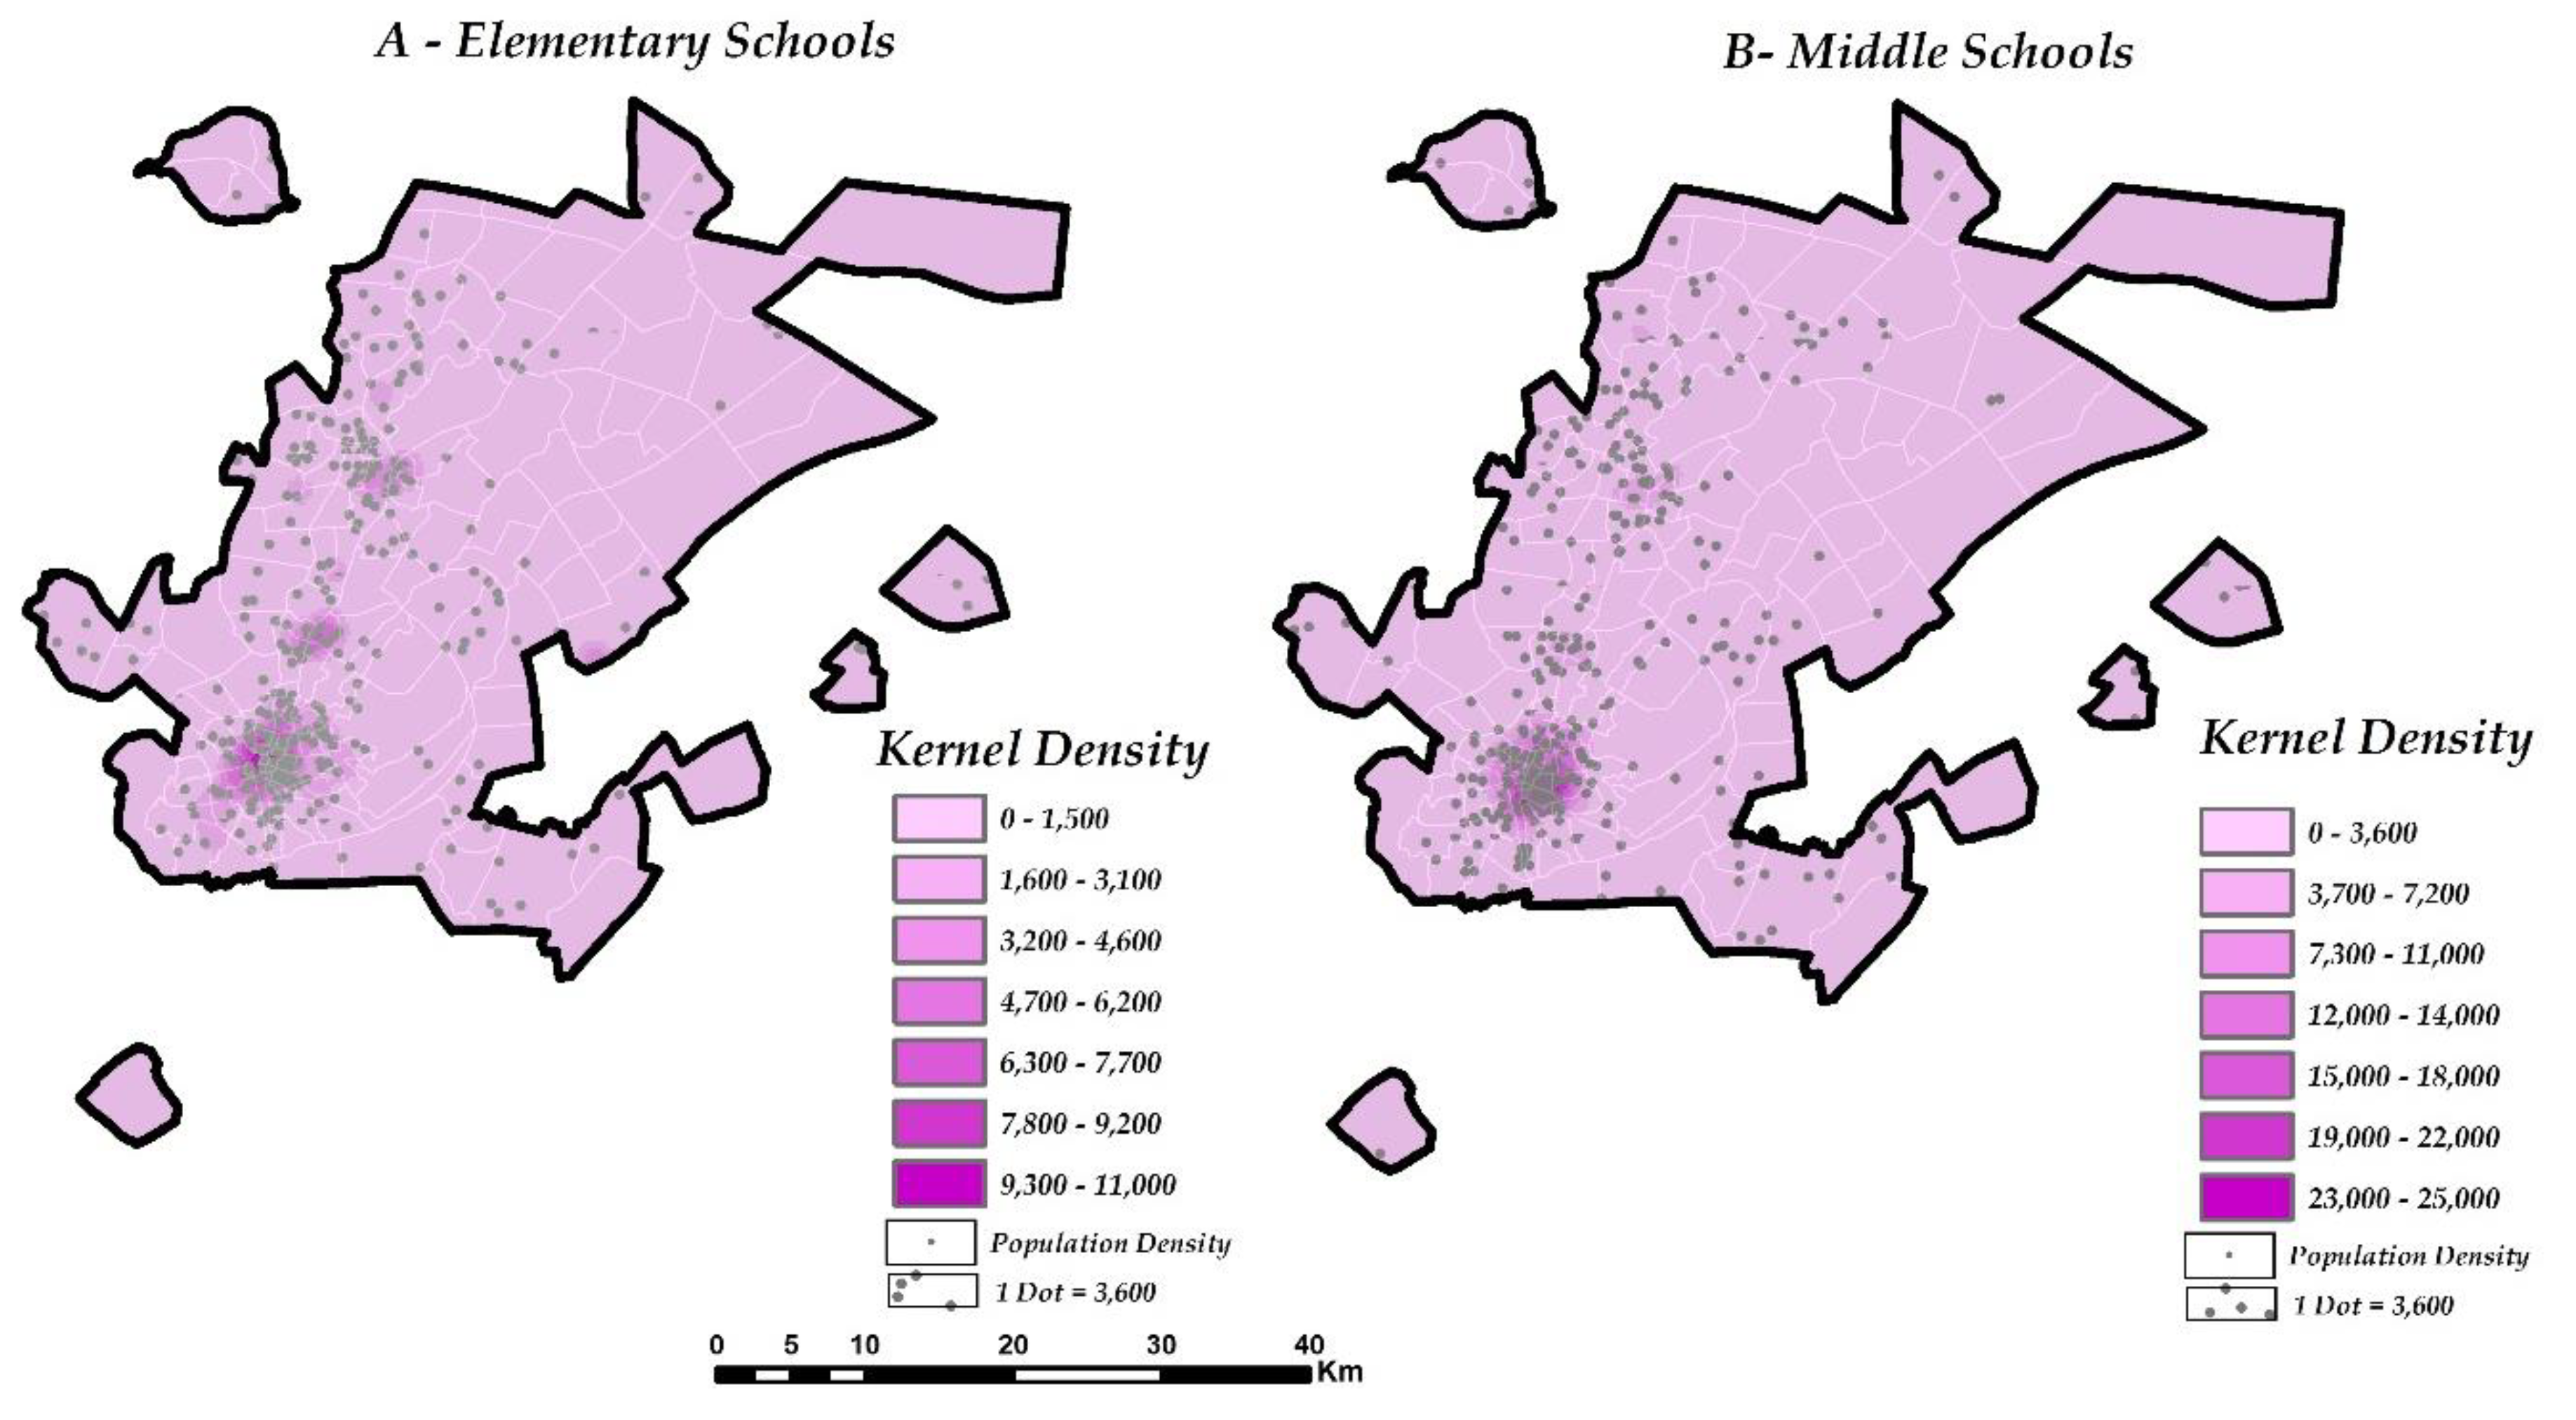
With surface trends defined according to the geographic distribution of schools, kernel density is a GIS function that shows a circular neighborhood link that represents the density of elementary and middle schools depending on population density in each district.
Figure 6 illustrates that school density was centralized in high-density areas and regresses in low-density ones. Additionally,
Figure 6 shows that the density of schools was highest in old and completely constructed areas, as well as in residential districts within the southern city center. It exhibits similarities with the point density findings. The majority of prior research has reported a higher density of schools around city centers where the districts were densely populated.
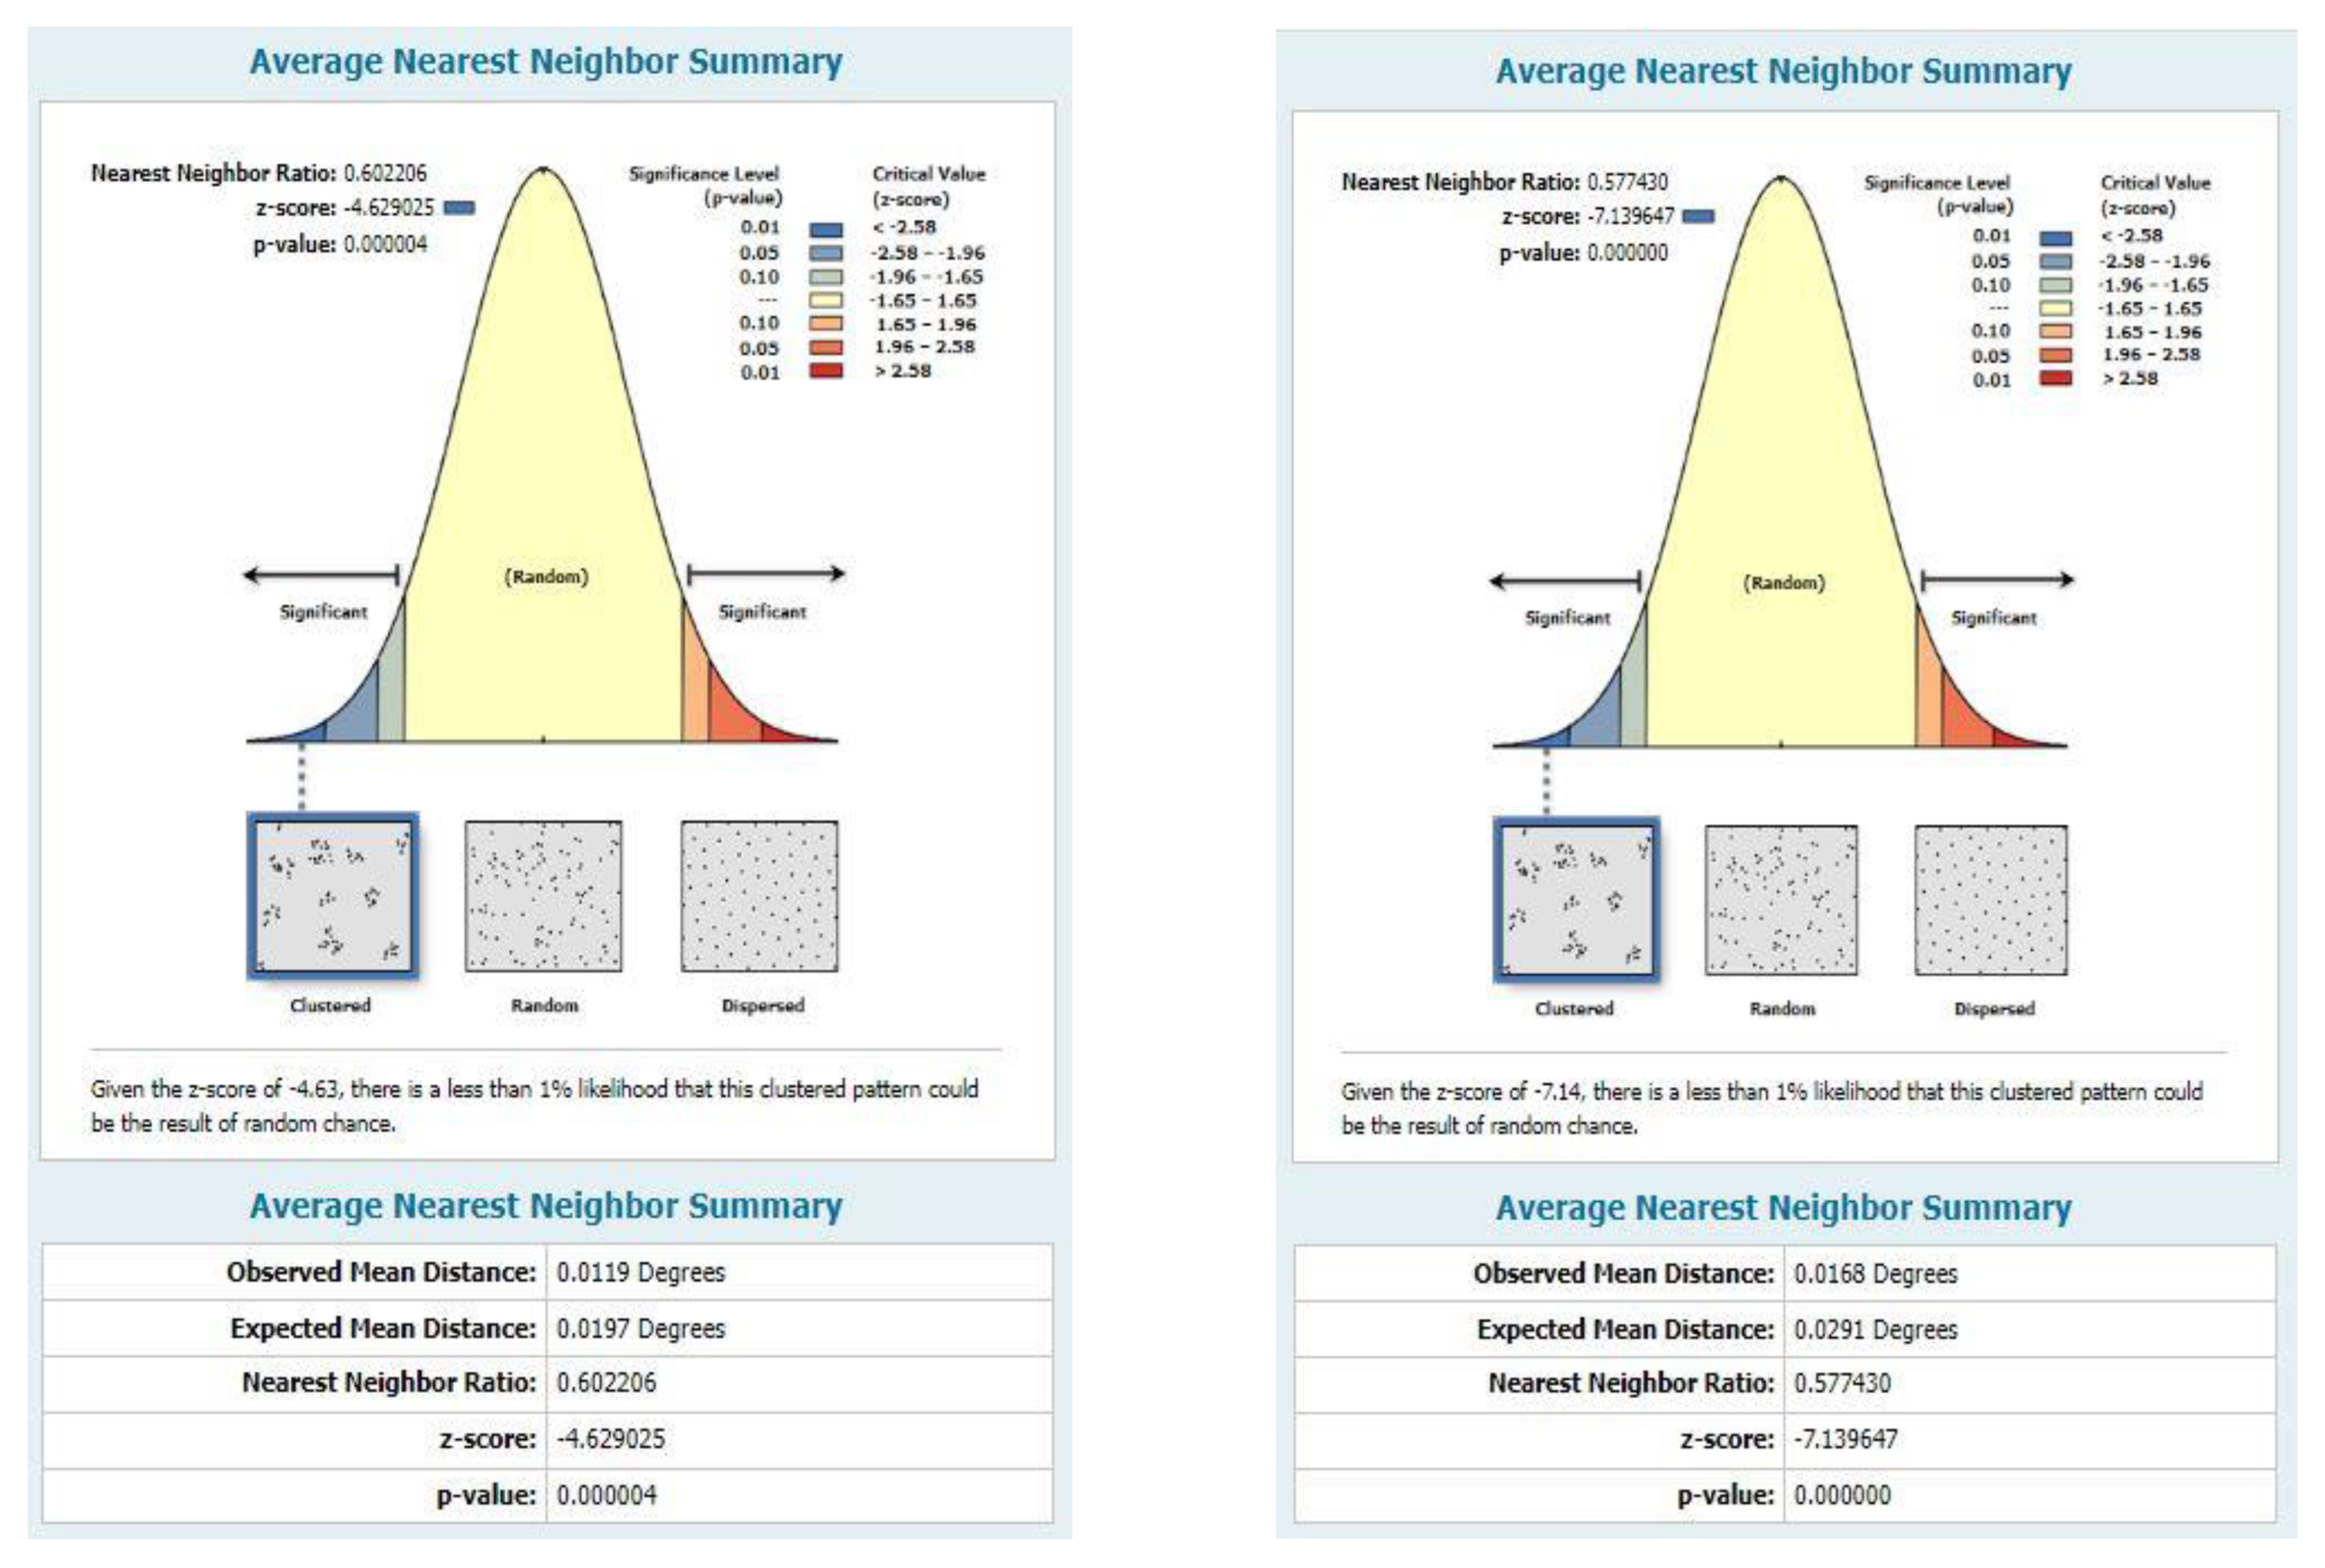
Knowledge of the distribution types of schools permits a quest for the elements that influence the creation of the distribution types or defines whether they are random or not. Some GIS methodologies aid in determining the geographical distribution type of El-Taif’s elementary and middle schools. The average nearest neighbor is a valuable and reliable quantitative tool for defining the geographical distribution types and if the distribution is randomized, clumped, or scattered. As indicated in
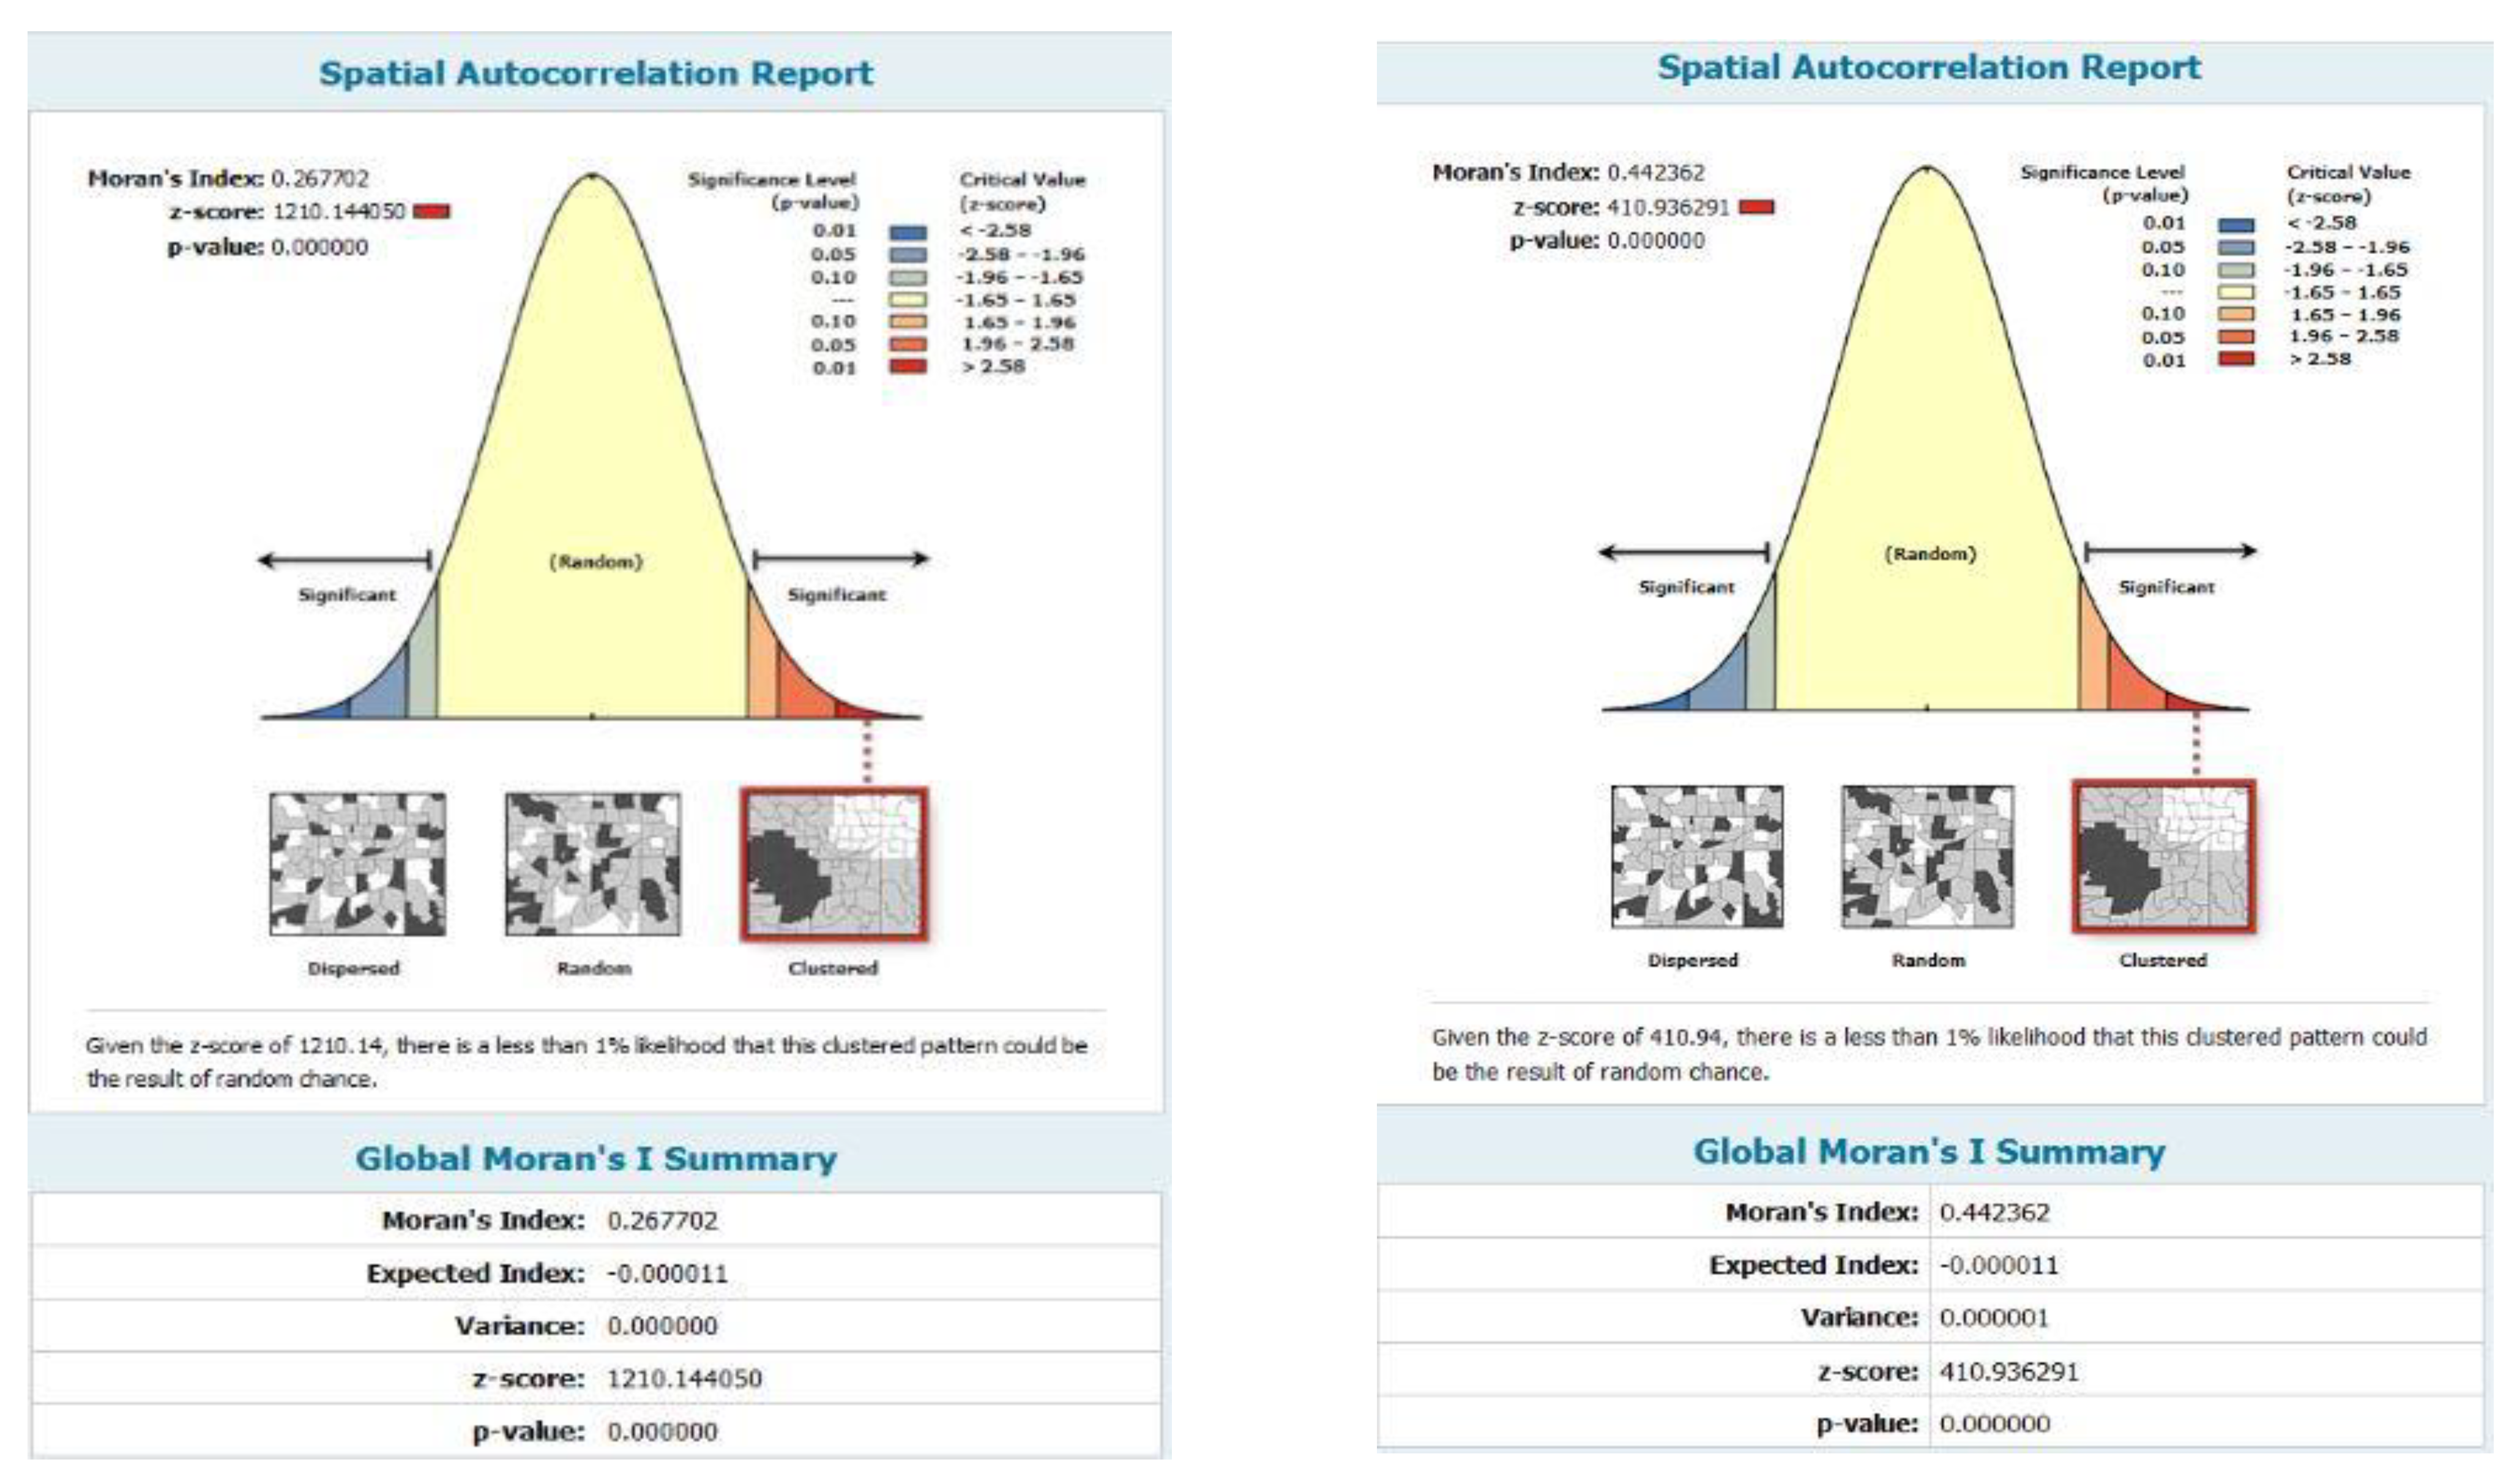
Figure 7, the average nearest neighbor proportion for elementary schools was 0.60 and 0.57 for middle schools. This denotes that the distribution pattern for both elementary and middle schools was clustered, yet it leant towards being random. There was a lower than 1% possibility such this clustered type was due to haphazard opportunity. This also implied that some schools were clustered in tiny locations with limited spaces between them whereas the remaining schools were dispersed across wide regions and were far distant from one another. This confirmed what was said in the density part (above), and in prior research, that schools are centered in old city areas. Besides there are not enough schools in some districts, and there are none in others.
Furthermore, as shown in
Figure 7, the Moran Index was +0.267 for elementary schools and +0.442 for middle schools, indicating that the distribution pattern of both in El-Taif city was clustered. This is consistent with prior findings, which demonstrate that most elementary and middle schools were concentrated in older, densely populated areas.
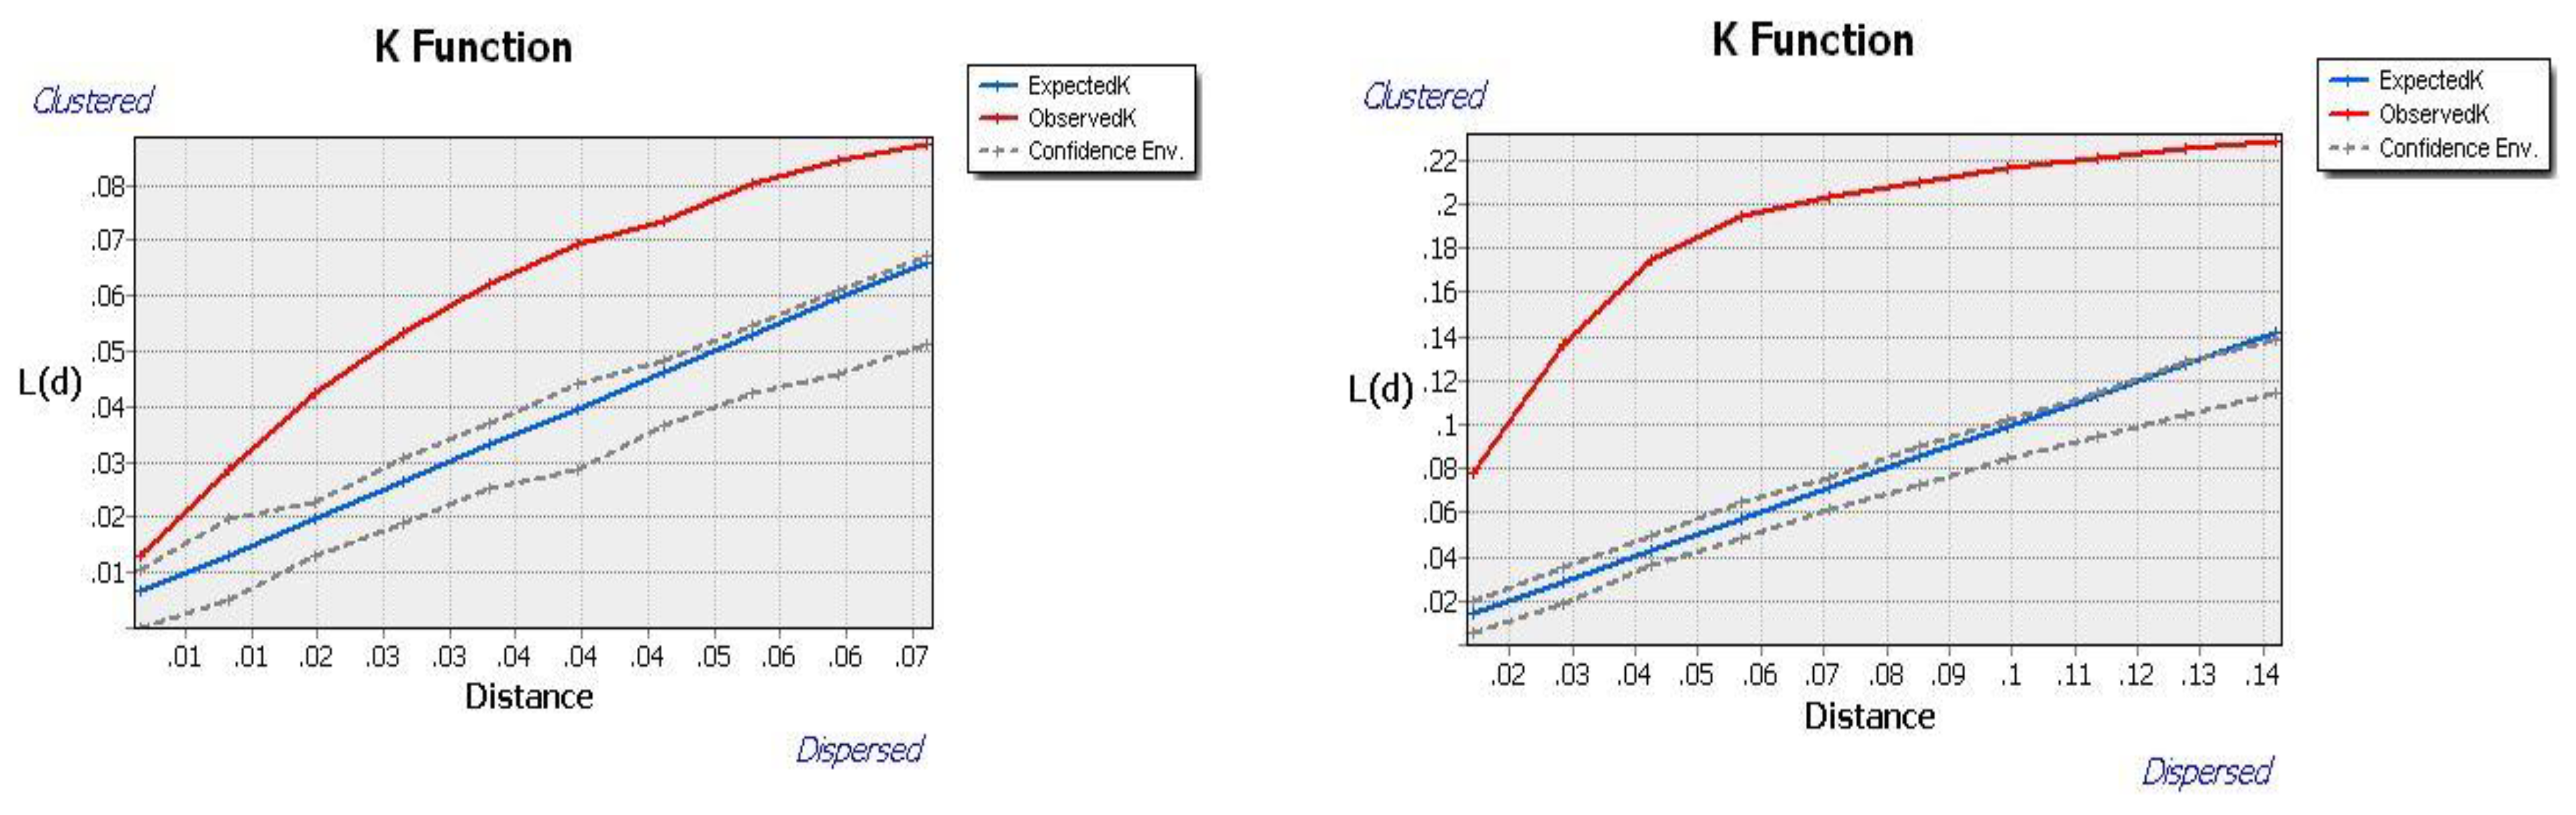
Ripley’s K function, which examines whether elementary and middle school distribution types indicate clustering or scattering across a range of distances, is another important GIS technique.
Figure 8 demonstrates that the observed K value was around 7 km higher than the expected K value for elementary schools and 14 km higher for middle schools. Furthermore, for a short distance in elementary schools and a long distance in middle schools, the observed K value was lower than the expected K value. This demonstrates that the distributions of elementary and middle schools were more clustered throughout most areas of the city. This may be congruent with the results of the average nearest neighbor analysis. Because the observed K value was more than the upper confidence envelope value, it may indicate more schools are in certain locations with an exceptionally high degree of trust. Many prior studies have revealed that the distance between pupils’ houses and schools in urban areas is less than the distance between pupils’ houses and schools in rural areas.
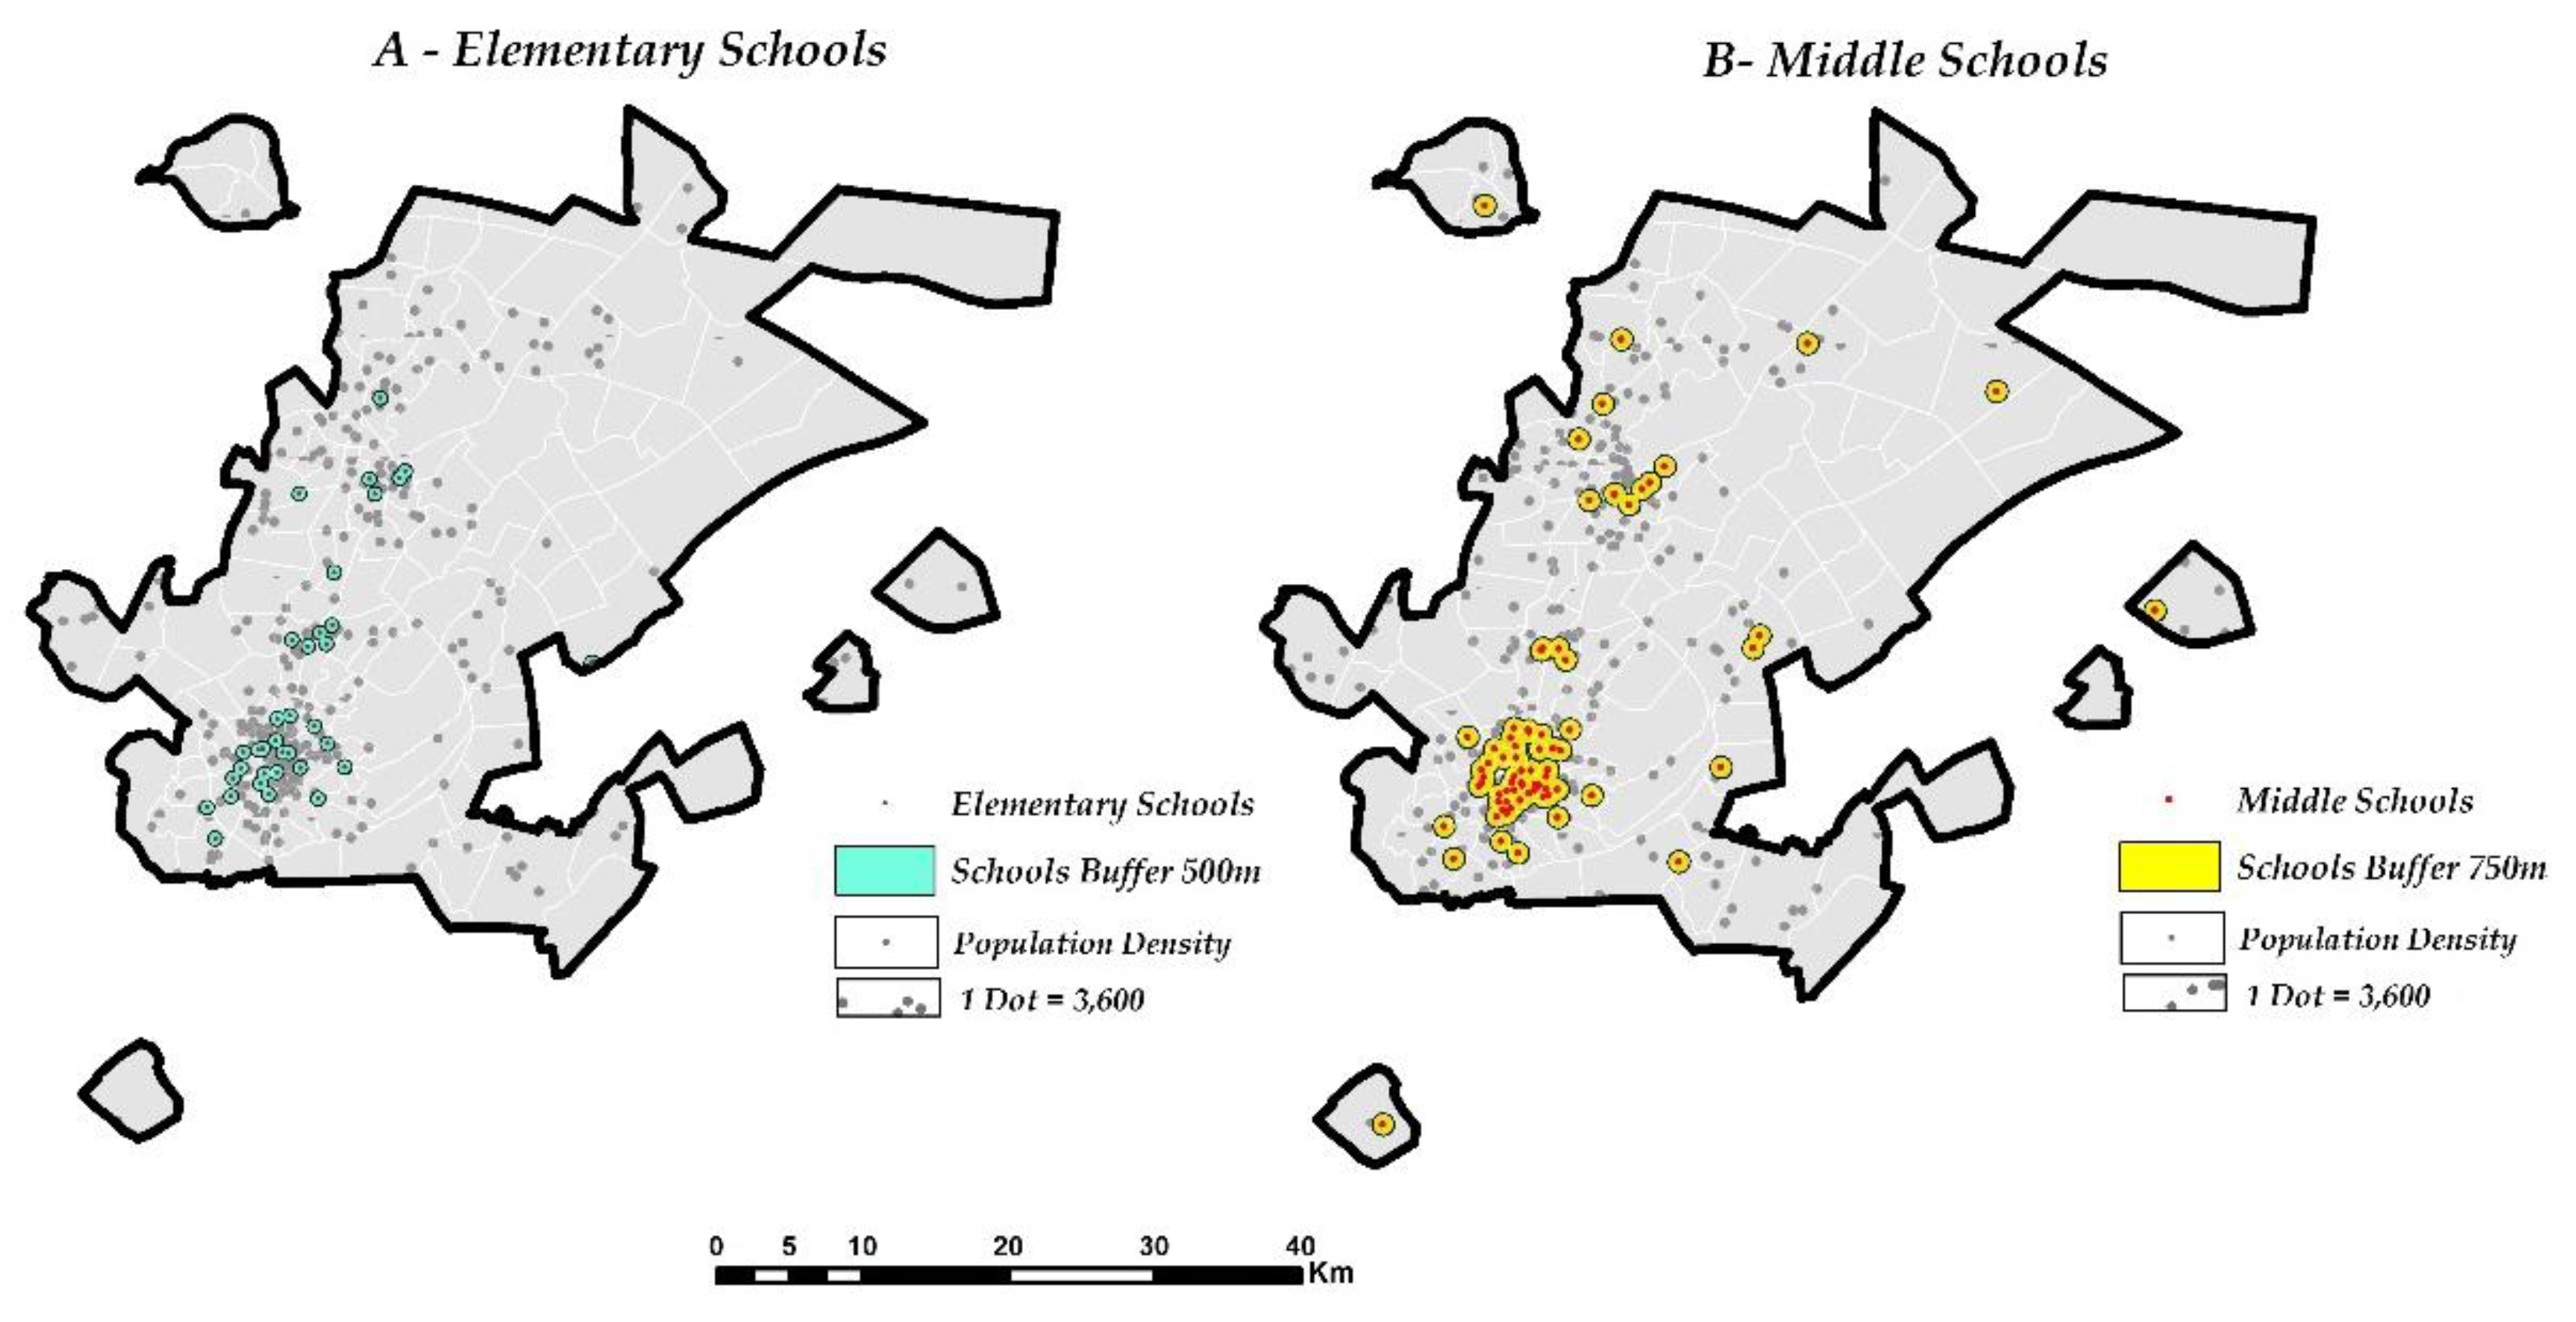
The closeness of a phenomenon to comparable or dissimilar geographic factors is determined by their proximity.
Table 2 displays the professional authorities’ criteria, as specified in the Materials and Methods section, for El-Taif elementary and middle schools for girls, in terms of population coverage and distances to other schools. The next section assesses the buffer zones, which is a different form of proximity assessment. According to MOMRA standards, elementary schools’ buffer zones should be 500 m and middle schools’ 750 m. It denotes that for pupils, this is the farthest distance they can walk. As seen in
Figure 9, the buffer zones of 15 elementary schools and 59 middle schools were overlapped with each other. This is mostly seen in older, densely inhabited areas and a few southwestern villages. Further eastward, the gaps between schools grew, implying that considerable portions of the city were not adequately covered by schools; notably, primary and intermediate schools were absent from 50% of the municipal neighborhoods. This may be a key sign of the randomization of school site choice, showing the unequal distribution of schools compared to the city’s populated areas. Prior studies have shown that some Saudi urban centers’ buffer zones of schools in the old city core frequently overlap with other schools, whilst outlying areas experienced a school scarcity [
2,
18].
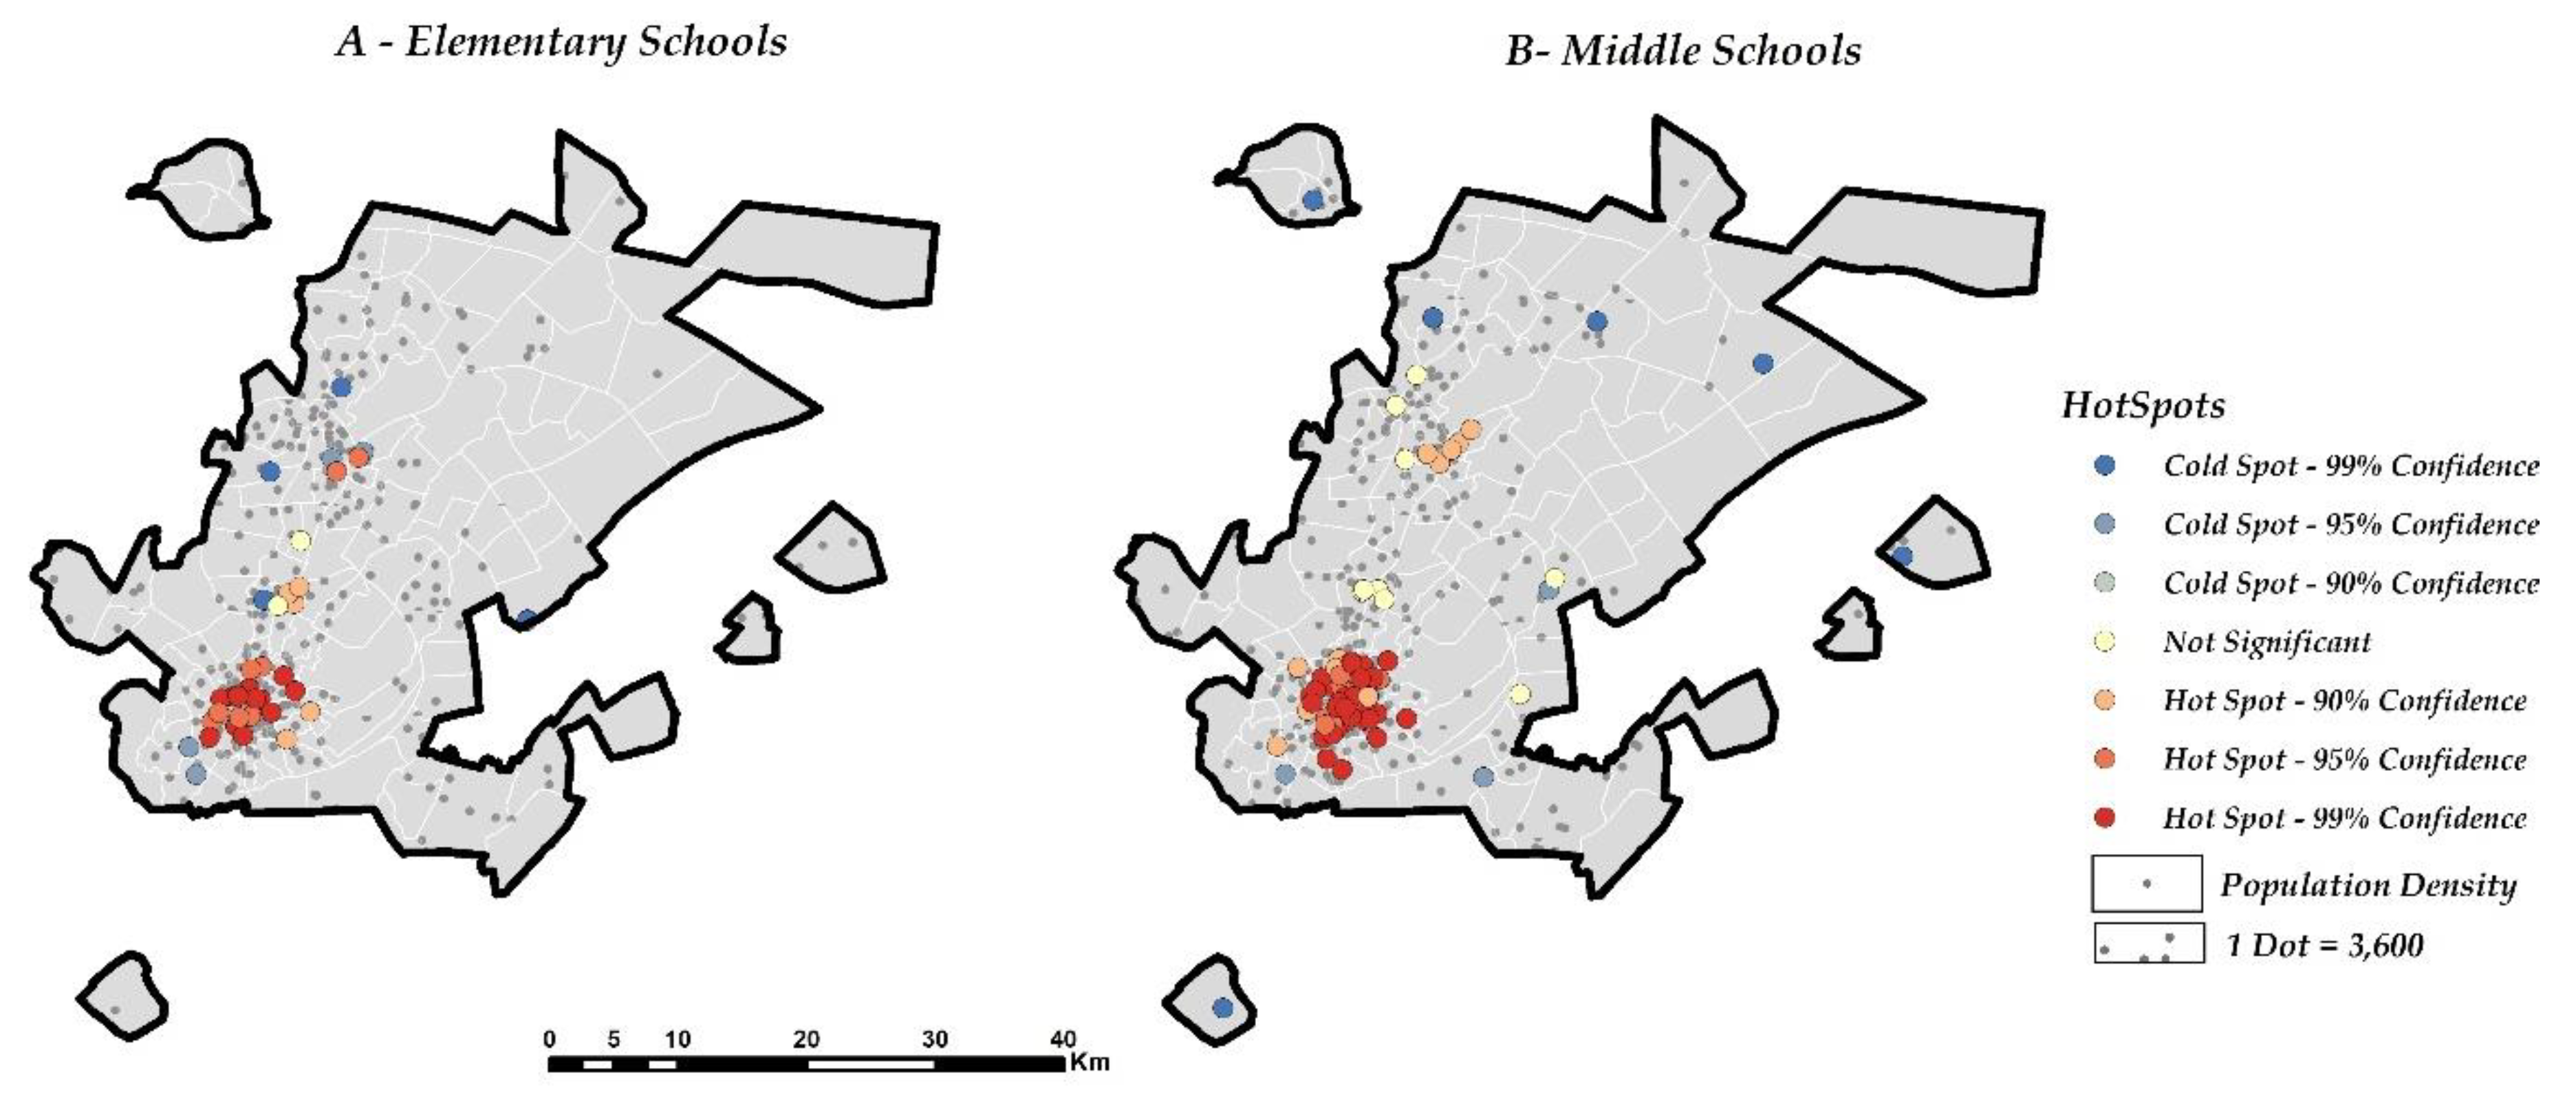
The hot and cold spots of elementary and middle schools for females in El-Taif city were determined using hotspot analysis. The findings support prior results, demonstrating that hotspots were concentrated in the city’s mid-southern areas, where the city’s oldest and most advanced communities were located (
Figure 10). The cold spot, on the other hand, expanded over the city’s newer and less densely inhabited residential zones, which were mostly located in the north for elementary schools and on the north-eastern parts of the city for middle schools. Furthermore, some cold spots were detected (90% confidence) in the districts around the old city core and towns situated in the city’s western and southwestern outskirts.
3.2. Sufficiency and Shortage of Elementary and Middle Schools According to Ministry of Municipal and Rural Affairs (MOMRA) Standards
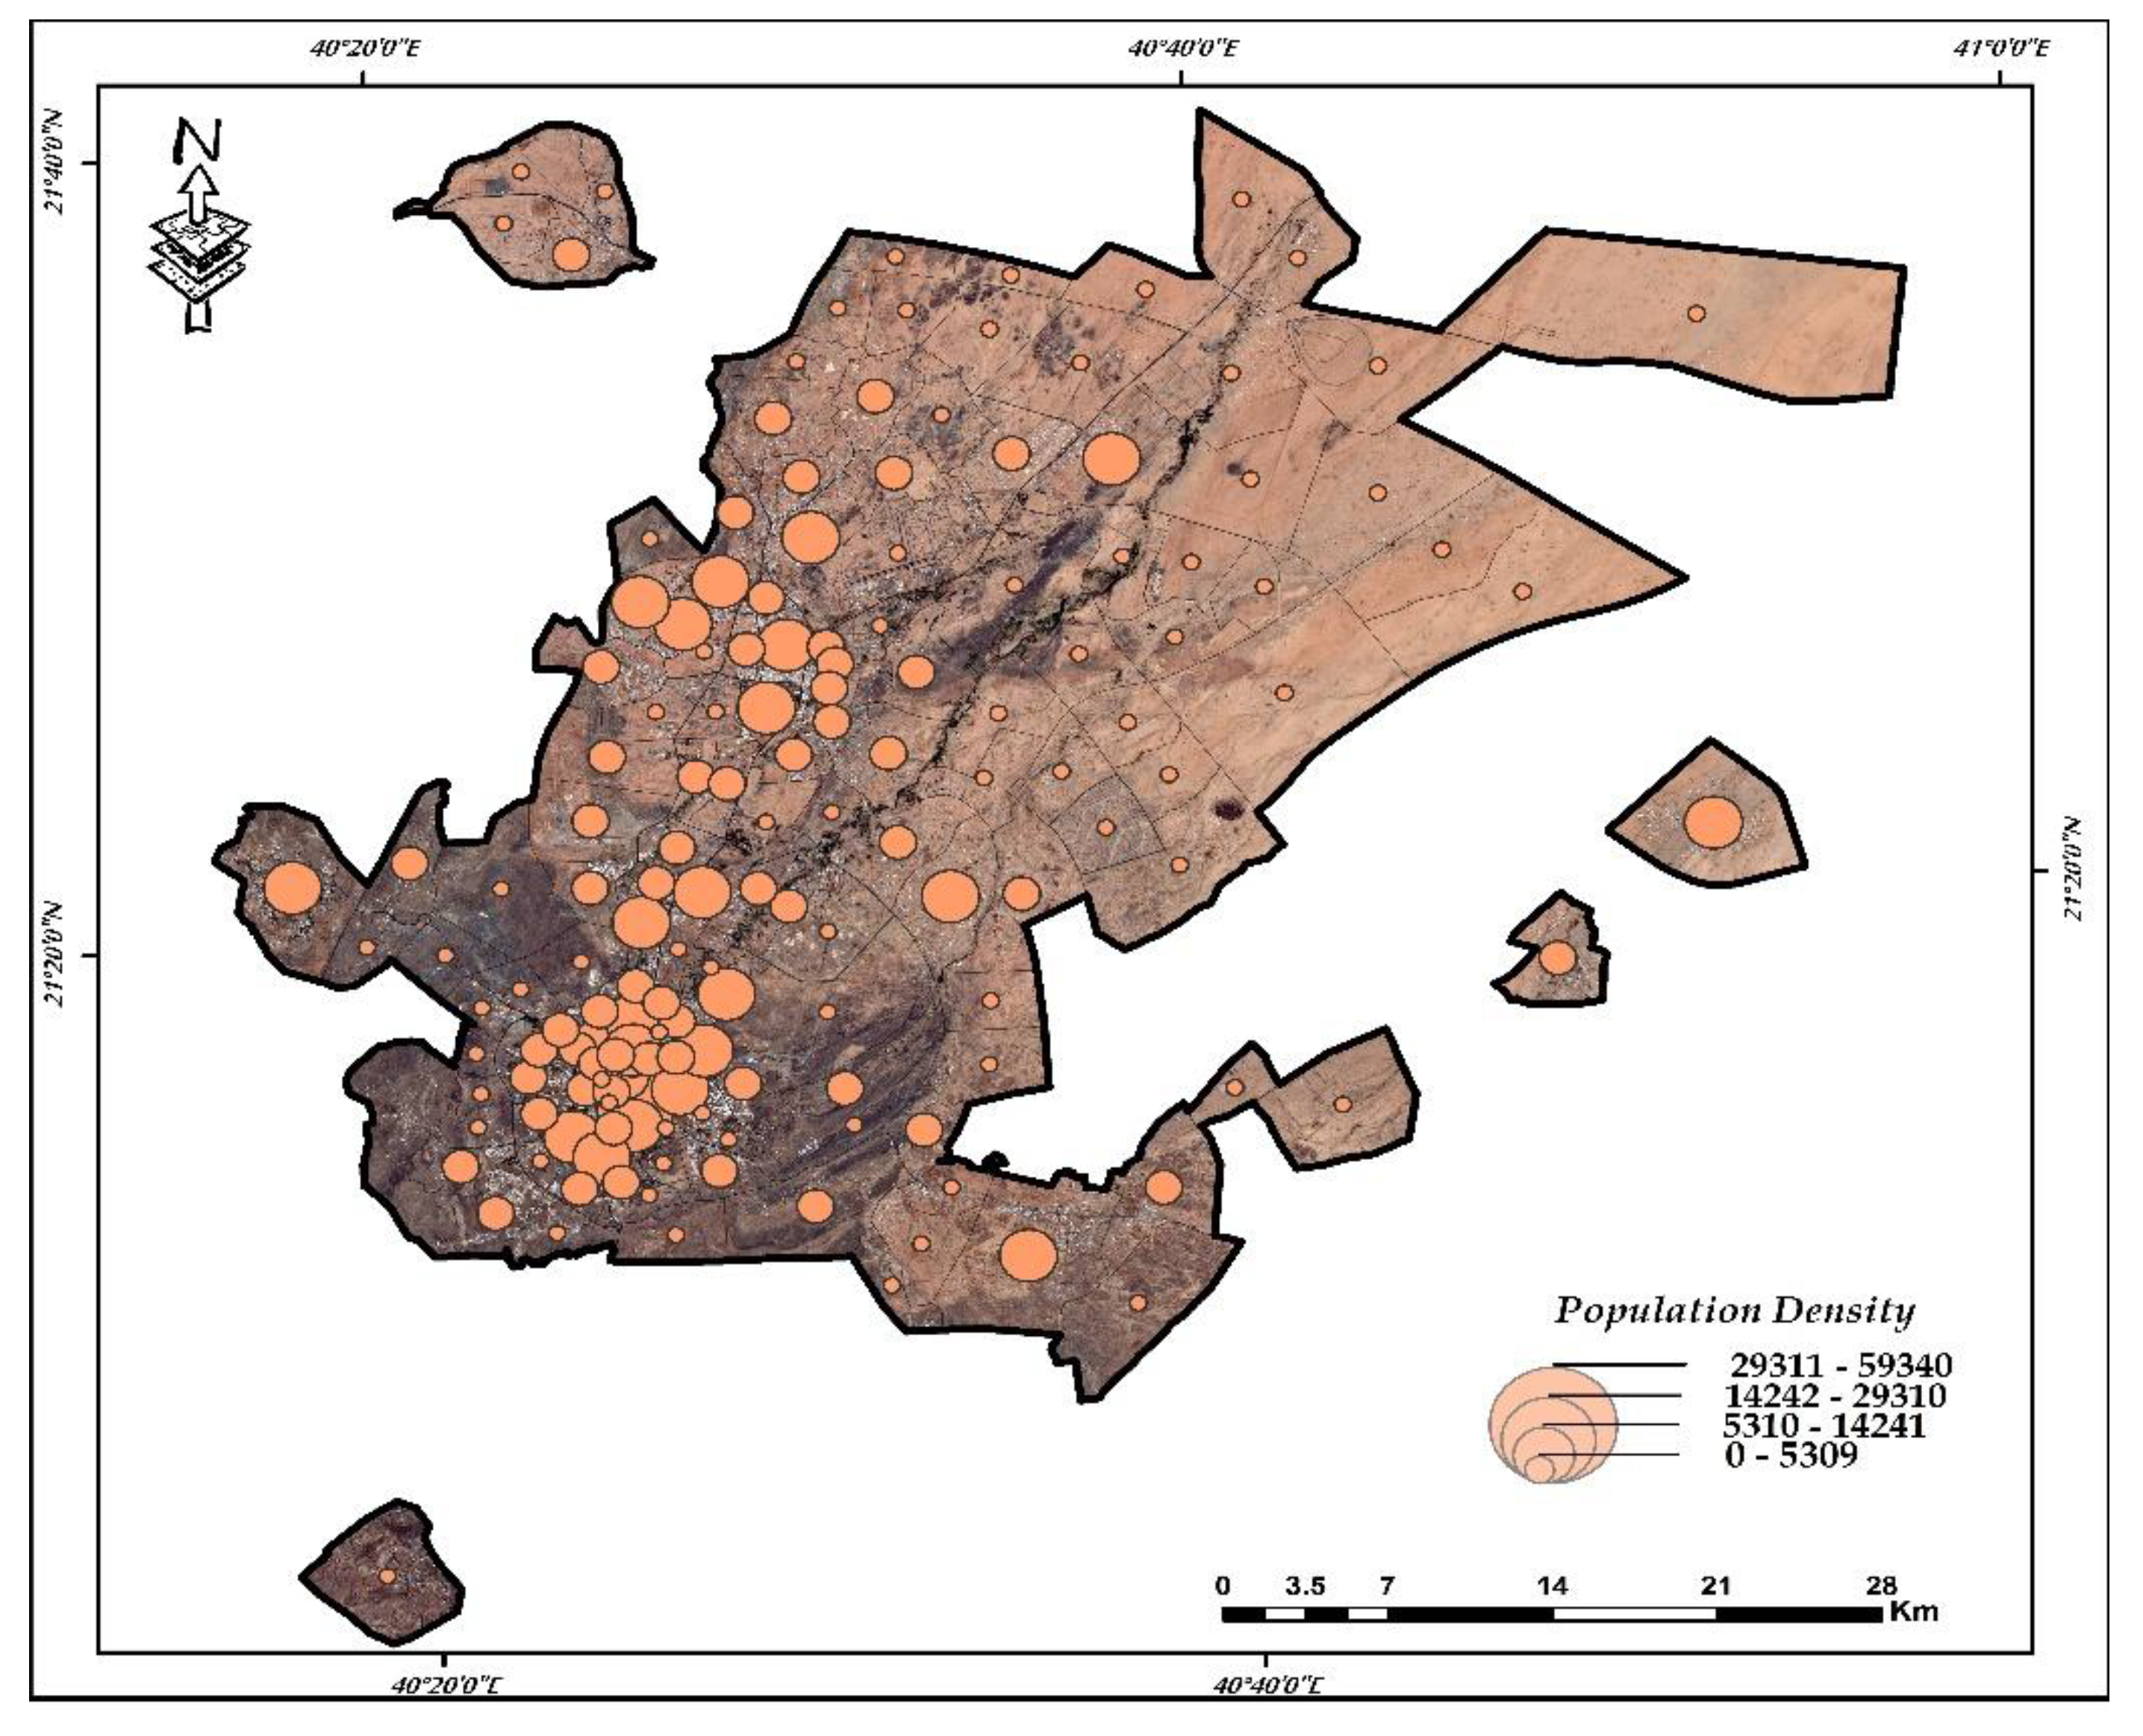
From
Table 2, perusal of
Figure 11 which shows the population density in El-Taif districts, and by applying the equations mentioned in the methodology section, we were able to determine those areas where a shortage or overcapacity was reached. As seen in the
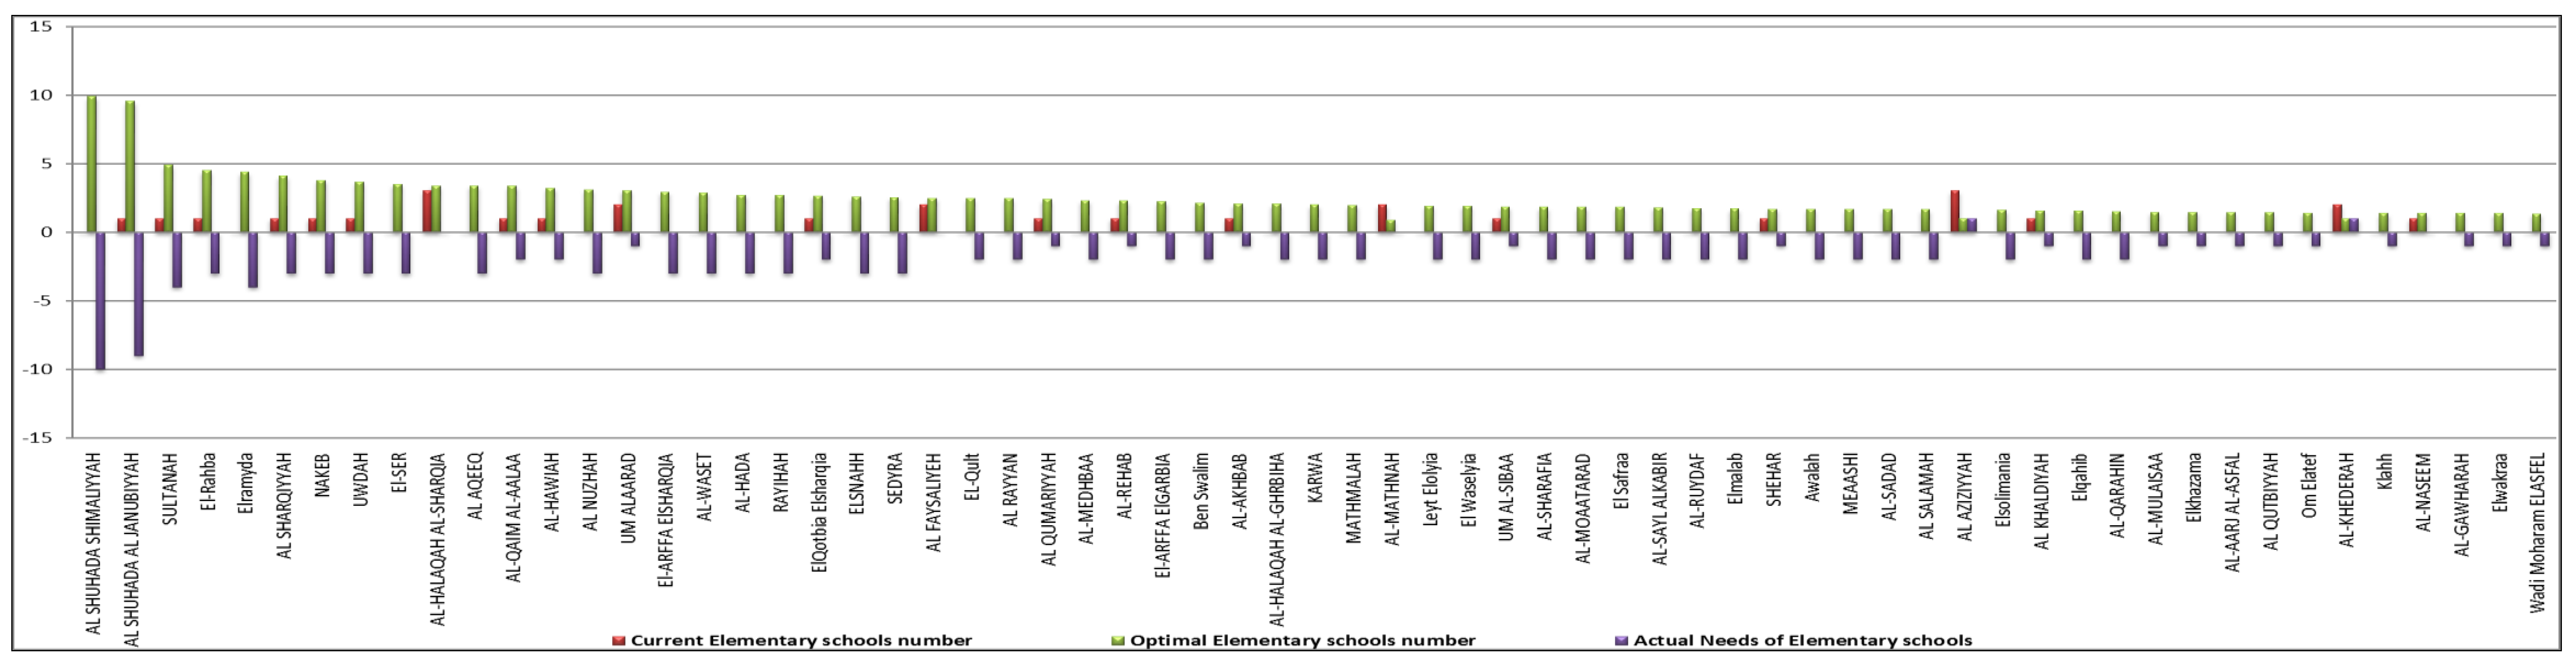
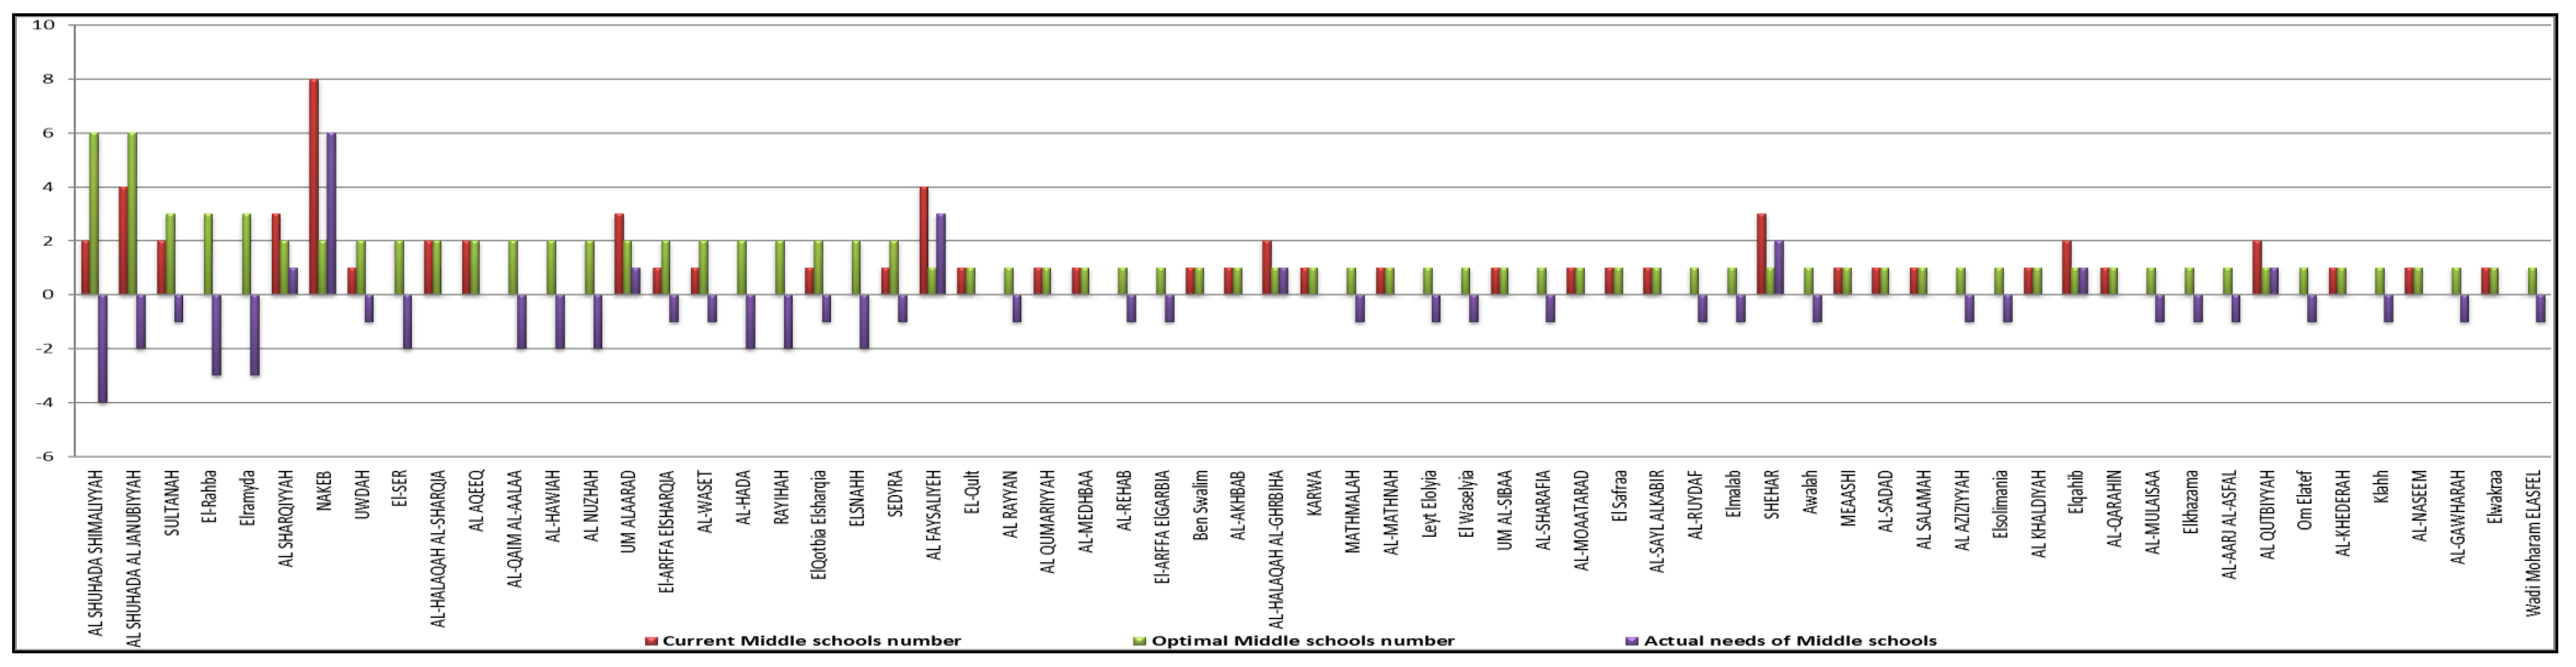
Appendix A Table A1, the number of elementary schools in El-Taif city was only 37, while the number of middle schools was only 77, which is a very small number in relation to the population of El-Taif. It was also discovered that the number of elementary and middle schools was not completely available for all districts, especially in the old densely populated districts. Furthermore, it was found that to achieve optimal numbers of elementary and middle schools, the city needs 203 elementary schools and 119 middle schools distributed over its districts. Meanwhile, the actual needs, or requirements, for elementary schools has reached 164, and 42 for middle schools to cover the service deficiency and meet the population needs. The population of these districts has reached 977,813 people, representing 79.9% of the total population of El-Taif city, which reflects the imbalance between the population number and the number of elementary and middle schools. Al Shuhada Shimaliyyah, Al Shuhada Al Janubiyyah, Sultanah, El-Rahba, Elramyda, Al Sharqiyyah, Nakeb, Uwdah, El-Ser, Al-Halaqah Al-Sharqia, Al Aqeeq, Al-Qaim Al-Aalaa, Al-Hawiah, Al Nuzhah, Um Alaaradl-Arffa Elsharqia, Al-Waset, Al-Hada, Rayihah, Elqotbia Elsharqia Elsnahh, Sedyra, Al Faysaliyeh, El-Qult, Al Rayyan, Al Qumariyyah, Al-Medhbaa, Al-Rehab, El-Arffa Elgarbia, Ben Swalim, Al-Akhbab, Al-Halaqah Al-Ghrbiha, Karwa, Mathmalah, Al-Mathnah, Leyt Elolyia, El Waselyia, Um Al-Sibaa, Al-Sharafia, Al-Moaatarad, Safraa, Al-Sayl Alkabir, Al-Ruydaf, Elmalab, Shehar, Awalah, Meaashi, Al-Sadad, Al Salamah, Al Aziziyyah, Elsolimania, Al Khaldiyah, Elqahib, Al-Qarahin, Al-Mulaisaa, Elkhazama, Al-Aarj Al-Asfal, Al Qutbiyyah, Om Elatef, Al-Khederah, Klahh, Al-Naseem, Al-Gawharah, Elwakraa And Wadi Moharam Elasfel are among the first neighborhoods that suffer from a deficit in elementary and middle schools alike (
Figure 12 and
Figure 13). Possibly, the main reason is the imbalance between the current number of elementary and middle schools and the city’s population at the district level.
3.3. Modeling the Spatial Equality Priority for Public Elementary and Middle Schools in El-Taif City
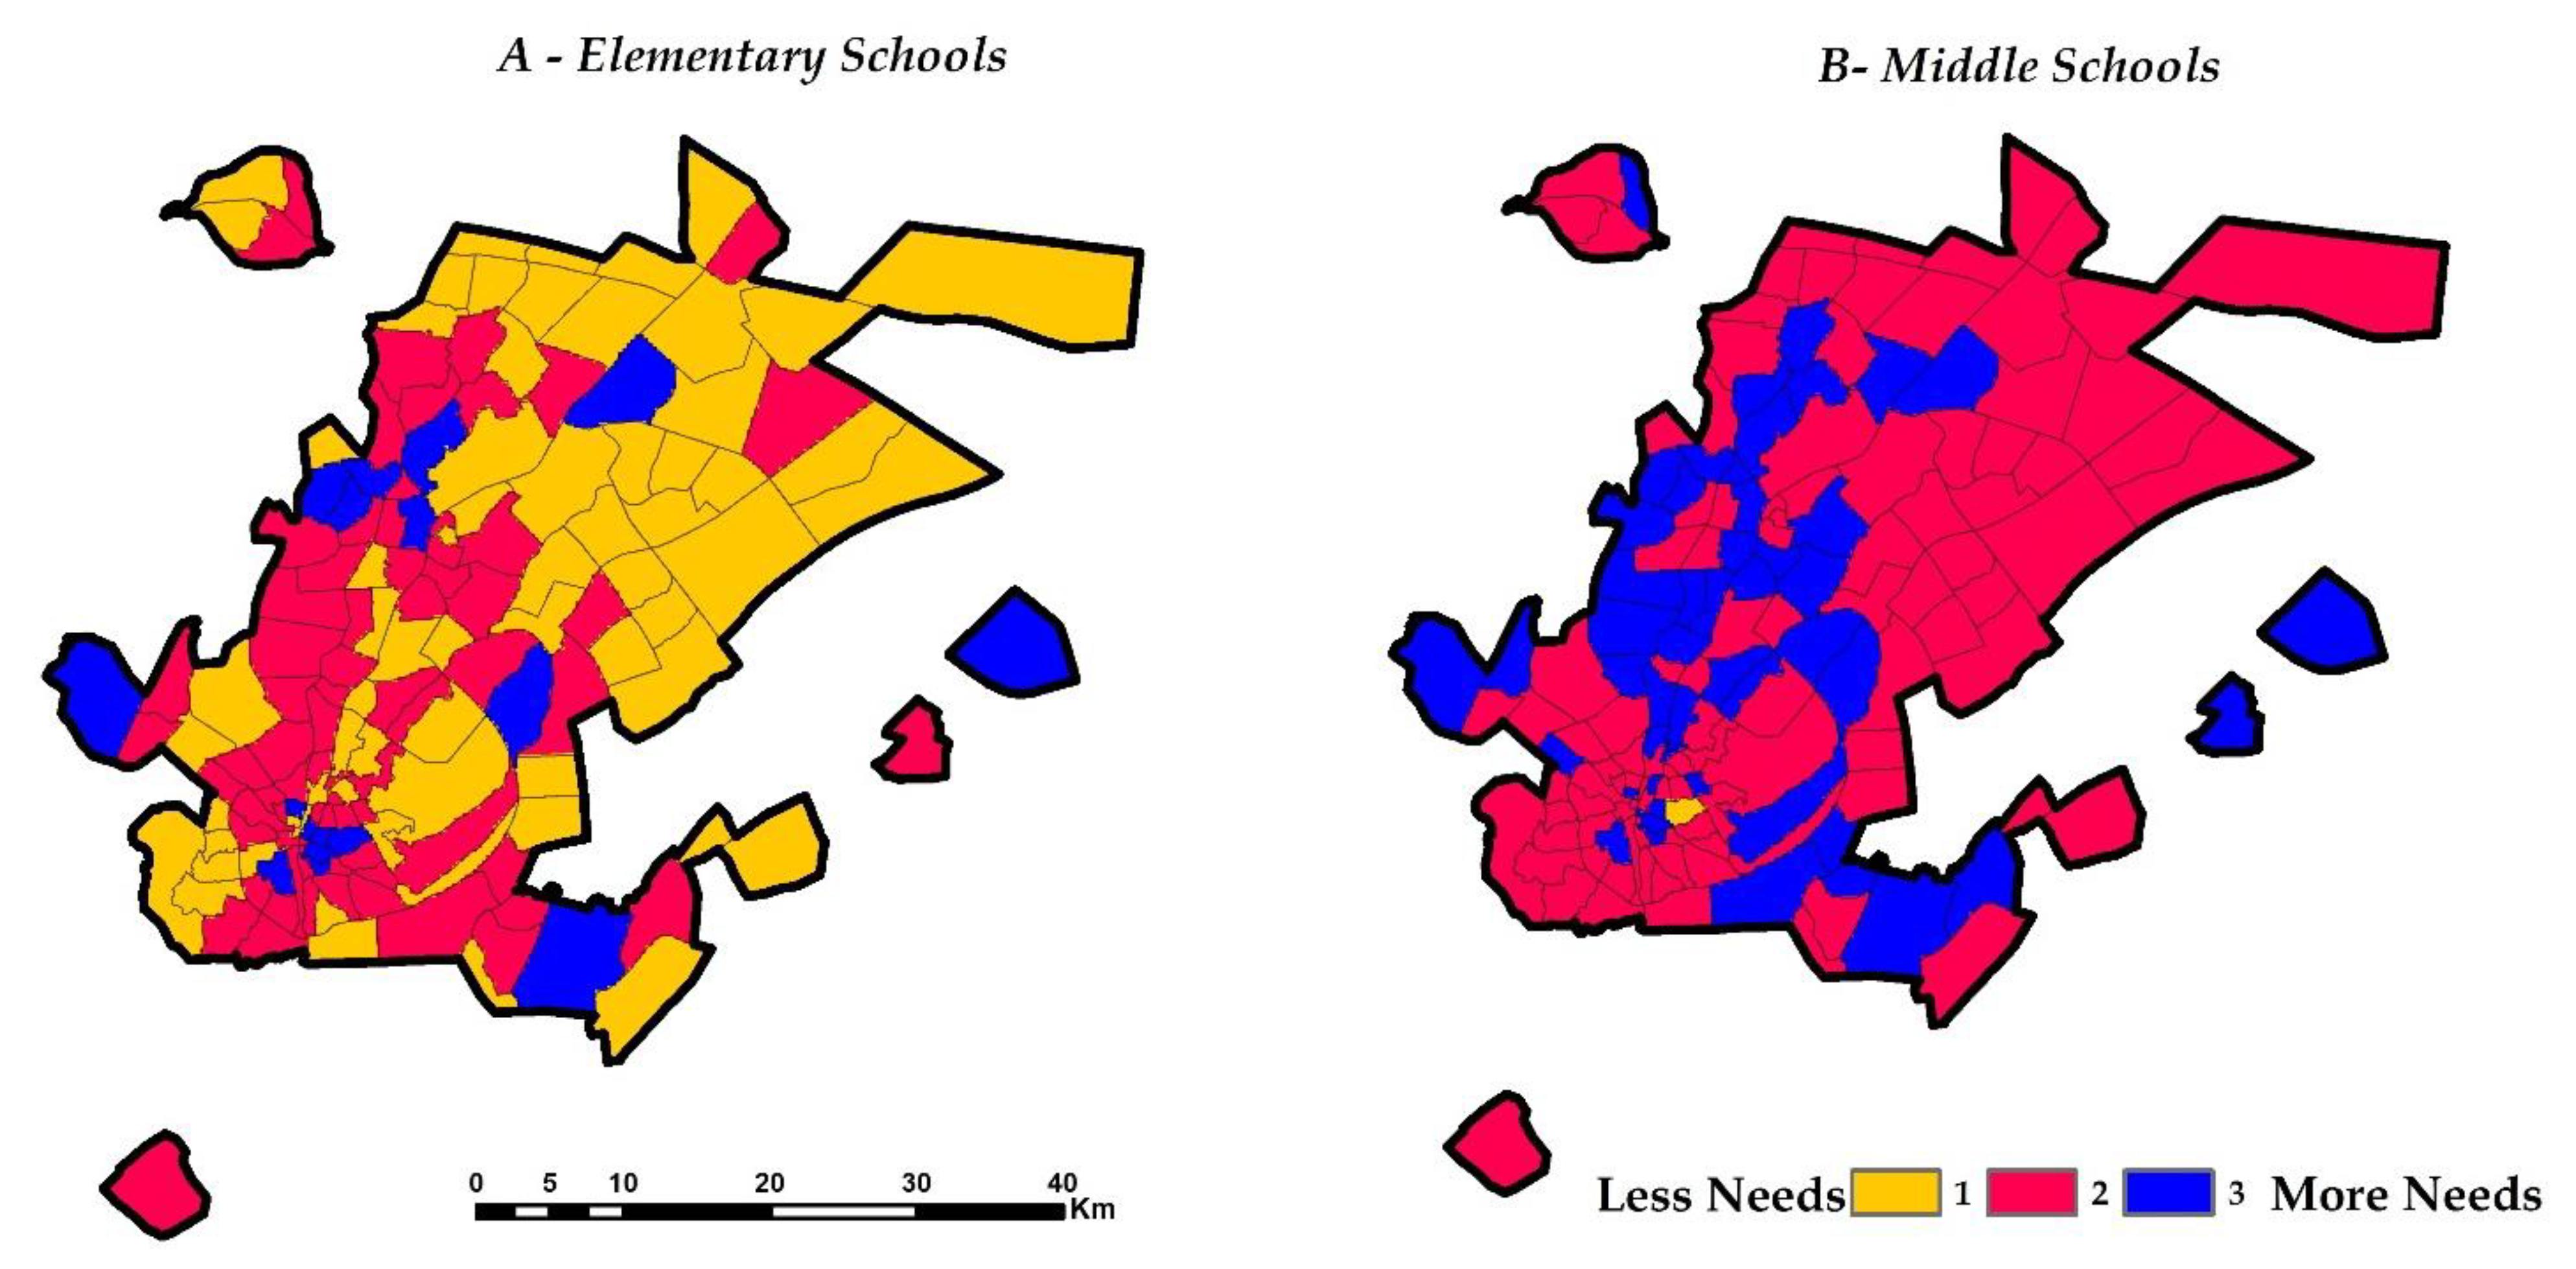
As described in the methodology section, the model was used to generate a spatial equality priority map for public elementary and middle schools based on the ideal situation for current demographics and MOMRA criteria. Then we compared it to the real conditions, finding and highlighting problem areas that require corrective action. The results of the model, as seen in
Figure 14, showed that the most needs for public elementary and middle schools, to achieve the spatial equality priority, were in the southeast district and old city center region, which are the old, densely inhabited, and developed districts. Meanwhile, young people from rural regions are migrating to El-Taif in quest of a good lifestyle, learning, and jobs. Furthermore, it was discovered that several northwest districts, due to the placements of new constructions like the King Salman bin Abdulaziz specialty hospital, Ministry of Housing projects, and an essential group of other government institutions and luxury stores, have attracted inhabitants. This trend has also appeared in the southwest, as it acts as the entry to Makkah city from the western side of El-Taif city. On the other hand, the southwest side offers citizens tourism seasonal services such as game marts and the El-Taif cable car during vacations.
High needs districts for Elementary schools:
Old city: Al Aqeeq, Al Sharqiyyah, Al Shuhada Shimaliyyah, Nakab, Al Shuhada Al Janubiyyah, Al Nuzhah and Uwdah.
North west: El-Sanah, Al-Waset, Rayihah, Al-Rahba and Sultanah.
Southeast: EL-Ser and EL-Ramida.
Southwest: Al-Hada.
High needs districts for Middle schools:
Old city: Al Rayyan, Al Aziziyyah, Elqotbia Elsharqia, Al Shuhada Shimaliyyah, Al Shuhada Al Janubiyyah, Al Nuzhah and Uwdah.
Northwest: El-Sanah, Al-Waset, Rayihah, Al-Rahba And Sultanah, El-Arffa Elsharqia, El-Arffa Elgarbia, El Waselyia, Om Elatef, Elsolimania, Mathmalah, Al-Rehab, Al-Rawabi, Elworod, Al-Sharafia, Al-Qaim Al-Aalaa, Al-Mulaisaa, Al-Syana, Jabrah, Al-Syana, Al-Qaim Al-Asfal, Al-Kederah, Al-Aarmiah, Al-Hawiah, Mathmalah, Elsolimania, Al-Ruydaf, Al-Gawharah, Awalah, Wadi El Sharb, Al-Aarj Al-Asfal and Elkhazama.
Southeast: El Hagira, Qna Wqdan, El-Ramida, Leyt Elolyia, Leyt Elsofly, Om Eldroob, El-Ser, and Elmalab.
Southwest: Al-Hada, Wadi Moharam Elasfel and El Gameer.
In contrast, the areas with least needs for public elementary and middle schools to achieve the spatial equality priority were located in separate parts of the city, but mainly in the northeast, where low-density scattered neighborhoods are growing. This was despite the fact that the northern side of the city houses development projects like the old and new El-Taif Airports, as well as the El-Taif University (TU). Additionally, just one area in the middle school model was identified to have less need, Nakhb district, which was situated in the old city region. Because that is one of the most densely populated areas, there are enough middle schools. Lastly, the model may be utilized to forecast and handle future capacity difficulties in educational services. The model was verified for public elementary and middle schools for females in El-Taif city and found to be a good instrument to assist local policy addressing educational service spatial inequity.
4. Conclusions
Public elementary and middle schools for females supply one of the essential educational phases; it is the major core of futuristic research. Thus, analyzing the existing spatial distribution of public elementary and middle schools and suggesting future spatial equality priority for them in El-Taif city is very important for decision makers. The results of this research include three parts: First, a spatial analysis using Mean Center, Central Feature, Standard Distance, Directional Distribution, Point Density, Kernel Density, Nearest Neighbor Analysis, Ripley’s K Function, Moran Index, Buffer Zone, and Hotspot Analysis tools, showed that El-kamesah asher elementary school was the actual elementary school center, while the Talaea el-mobdeaat middle school was the center of the middle schools in the districts of El-Taif. The distance between the actual center and the center was assumed to be approximately 311 m and 524 m for elementary and middle schools, respectively. The standard distance circle contained 27 schools and outside the circle 10 schools. The standard area totaled 298.01 km2, accounting for 15.73 percent of the total area of the El-Taif districts (1894 km2) for elementary schools. While the standard distance contained 62 schools, and outside it 16 schools, depicting 79.5% of the whole middle school’s number. The standard distance area of the middle schools was 511.72 km2, accounting for 27.02 percent of the entire area of the El-Taif districts (1894 km2). The number of schools within the standard distance was greater than outside. This indicates that the distribution of both elementary and middle schools was concentrated. It also was discovered that the Kernel density was concentrated in high-density regions and recedes in low-density areas. Besides, the average nearest neighbor proportion for elementary schools was 0.60 and 0.57 for middle schools. This denotes that the distribution pattern of both elementary and middle schools was clustered. Ripley’s K function demonstrated that the observed K value was around 7 km higher than the expected K value for elementary schools and 14 km for middle schools. It was also found that the Moran Index was +0.267 for elementary schools and +0.442 for middle schools, indicating that the distribution pattern of both in El-Taif city was clustered. The buffer zones of 15 elementary schools and 59 middle schools overlapped with each other. The hotspots were concentrated in the city’s mid-southern sides, where the city’s oldest and most developed residential districts were located. The cold spot, on the other hand, expanded over the city’s newer and less densely inhabited residential zones. Furthermore, some cold spots were detected (90% confidence) in the districts around the old city core and towns situated in the city’s westerner and southwestern outskirts.
Second, are the results of the statistical analysis that showed there was an urgent requirement for infrastructure, as the city needs 203 elementary schools and 119 middle schools distributed within the study area. Whereas the actual needs number for elementary schools has reached 164 and 42 for middle schools to cover the service deficiency and meet the population needs. Third, modeling the spatial equality priority for public elementary and middle schools in El-Taif city showed that the most need for public elementary and middle schools to achieve spatial equality priority was located in the southeast district and old city center region, which is the old, densely inhabited, and developed districts. Whereas the least needs for public elementary and middle schools to achieve the spatial equality priority were located in separate parts of the city, but mainly in the northeast, where low-density scattered neighborhoods are growing. The model may be utilized to forecast and handle future capacity difficulties in educational services. The model was verified for public elementary and middle schools for females in El-Taif city and found to be a good instrument to assist local policy addressing educational service spatial inequity. Thus, the model may contribute to achieving goal 4 of the UN-Habitat Sustainable Development Goals, which aims to “ensure inclusive and equitable quality education and promote lifelong learning opportunities for all. Finally, instead of schools, the model may be adapted to other service domains by supplying equivalent datasets on other services, etc.


 ,
, 