

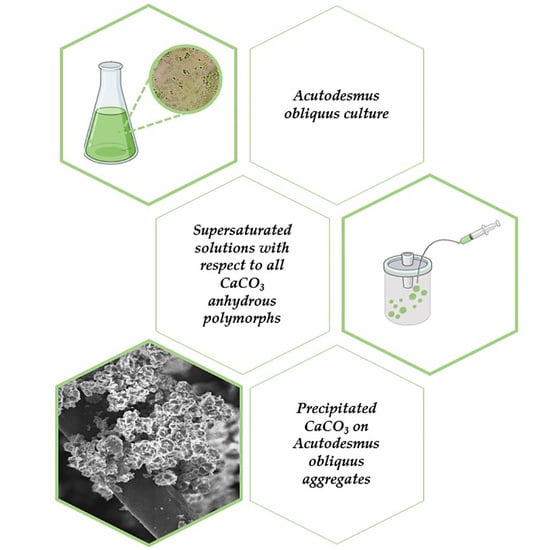
Calcium Carbonate Mineralization of Microalgae


Abstract
1. Introduction
2. Materials and Methods
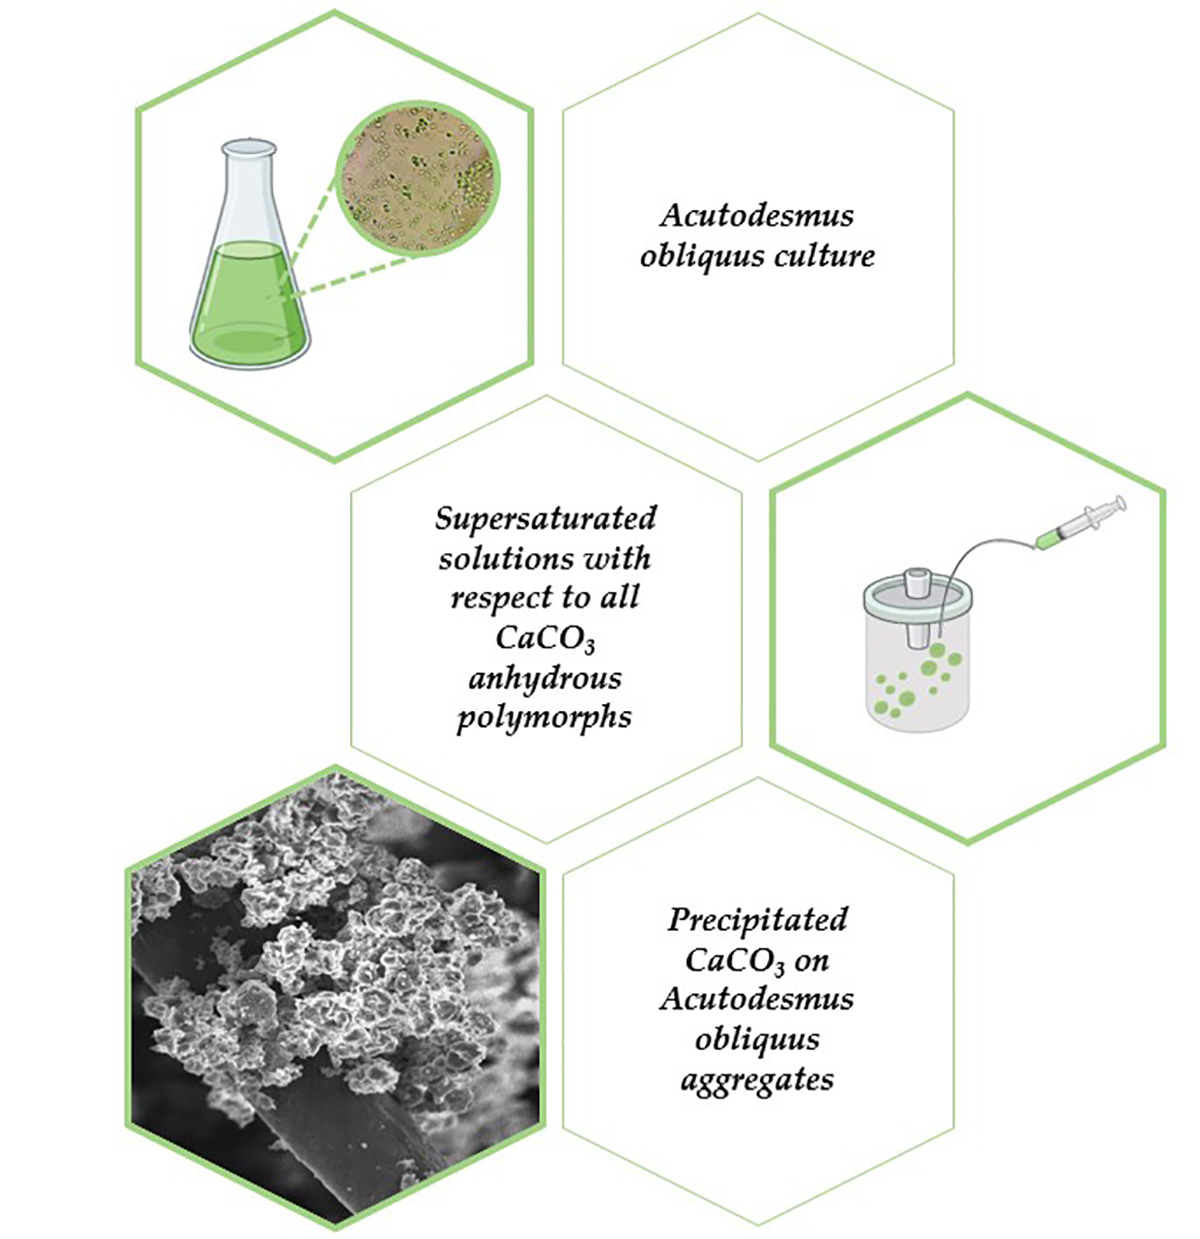
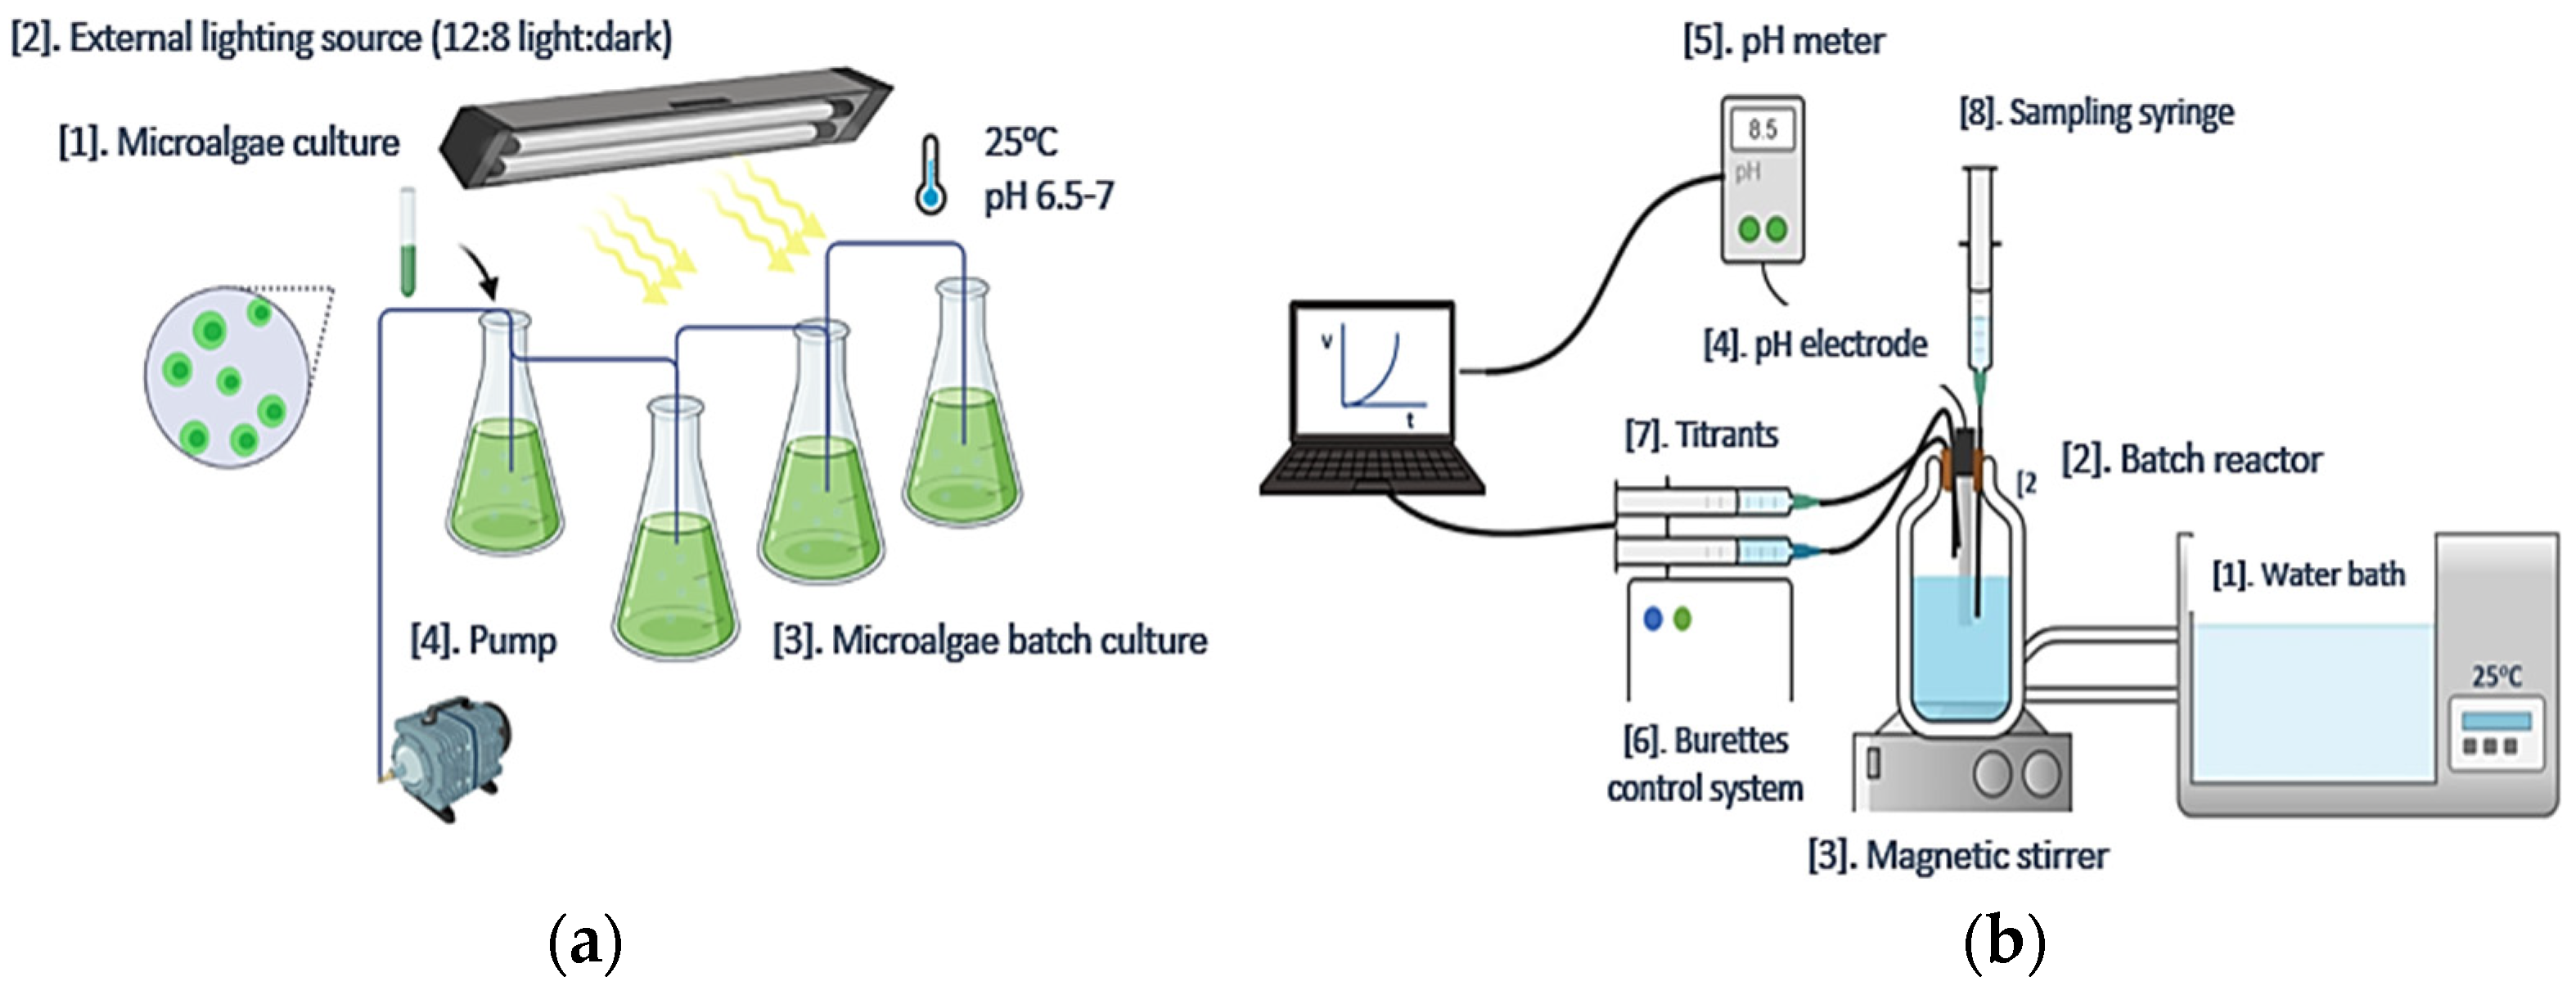
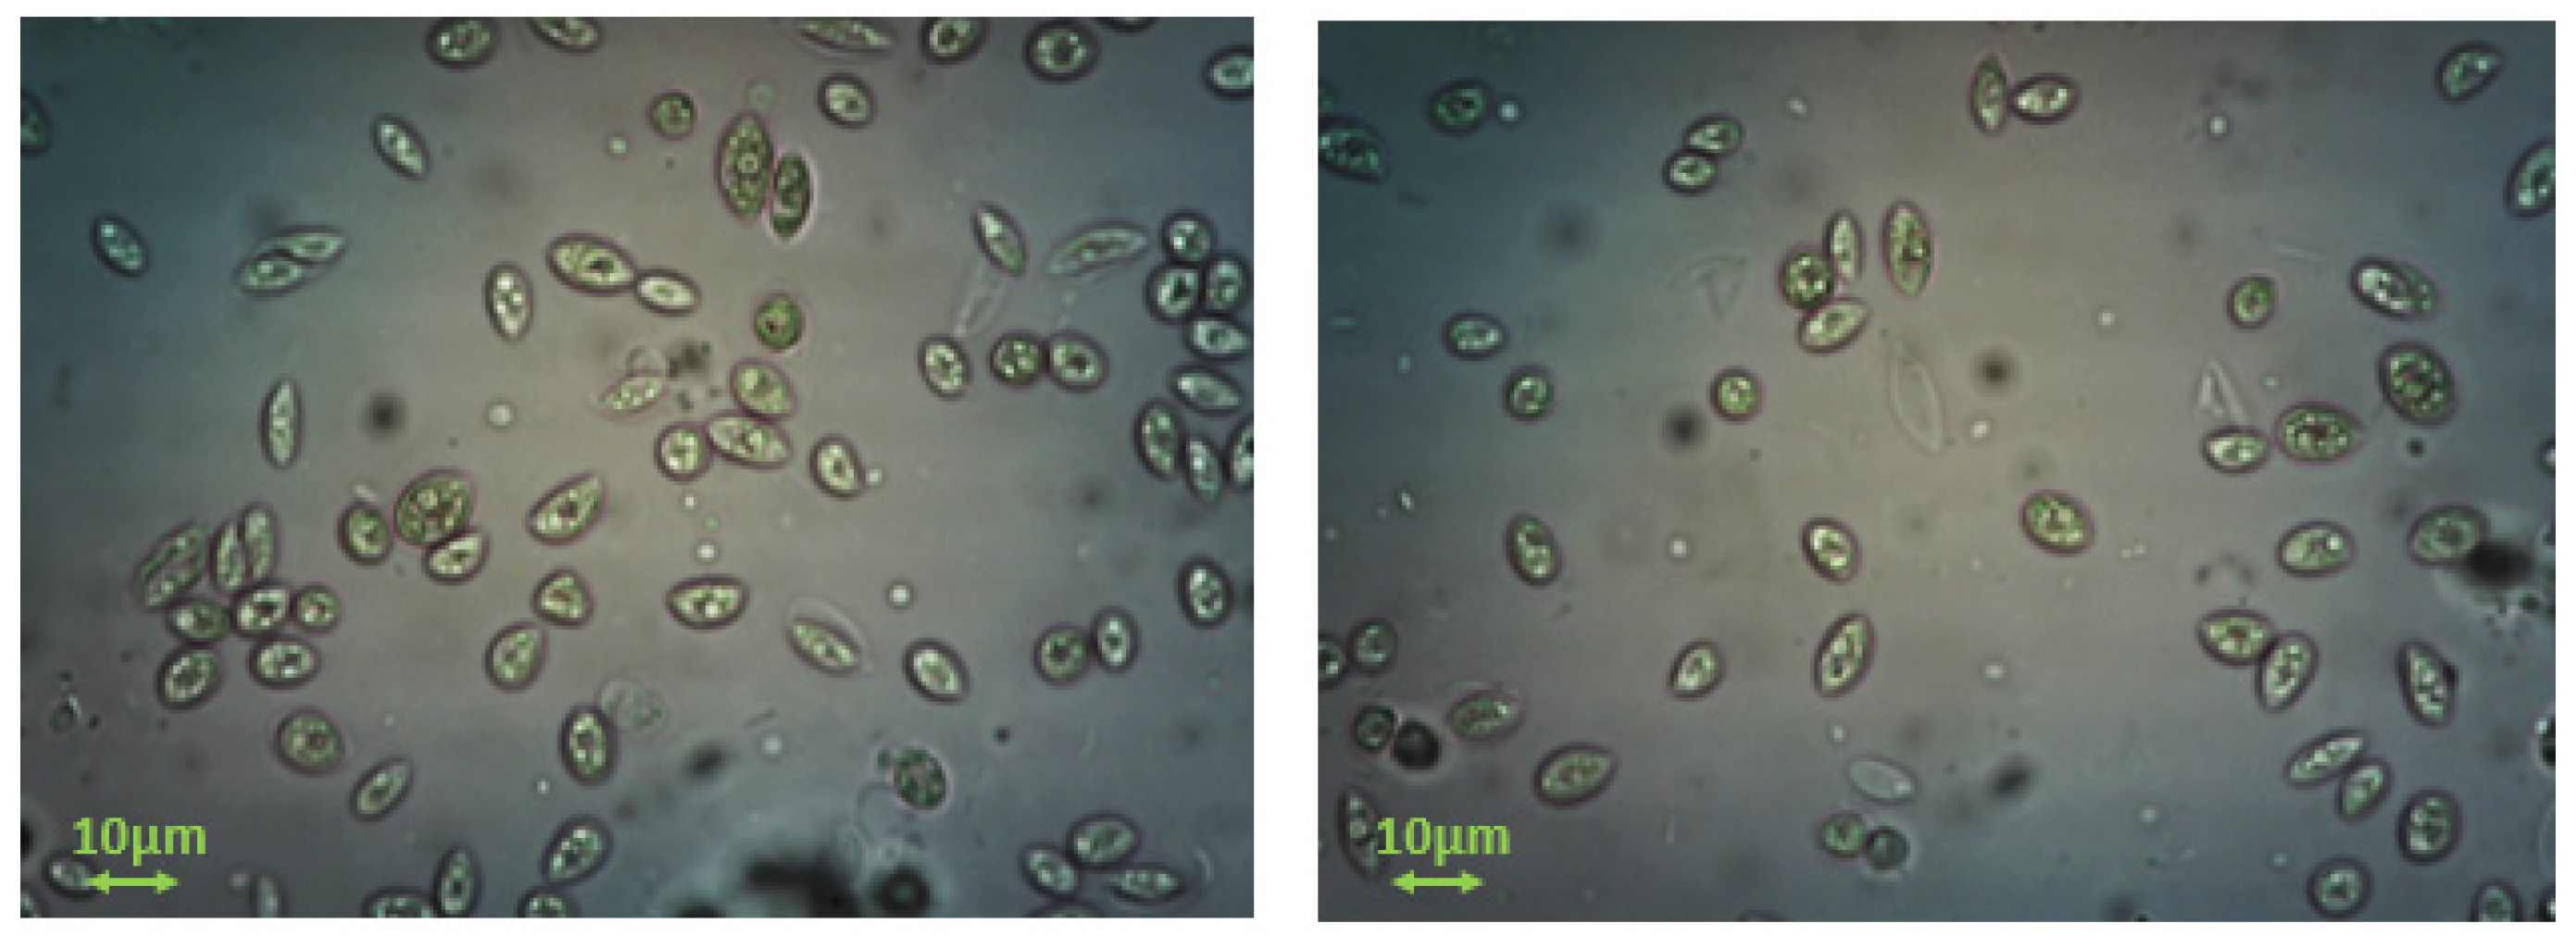
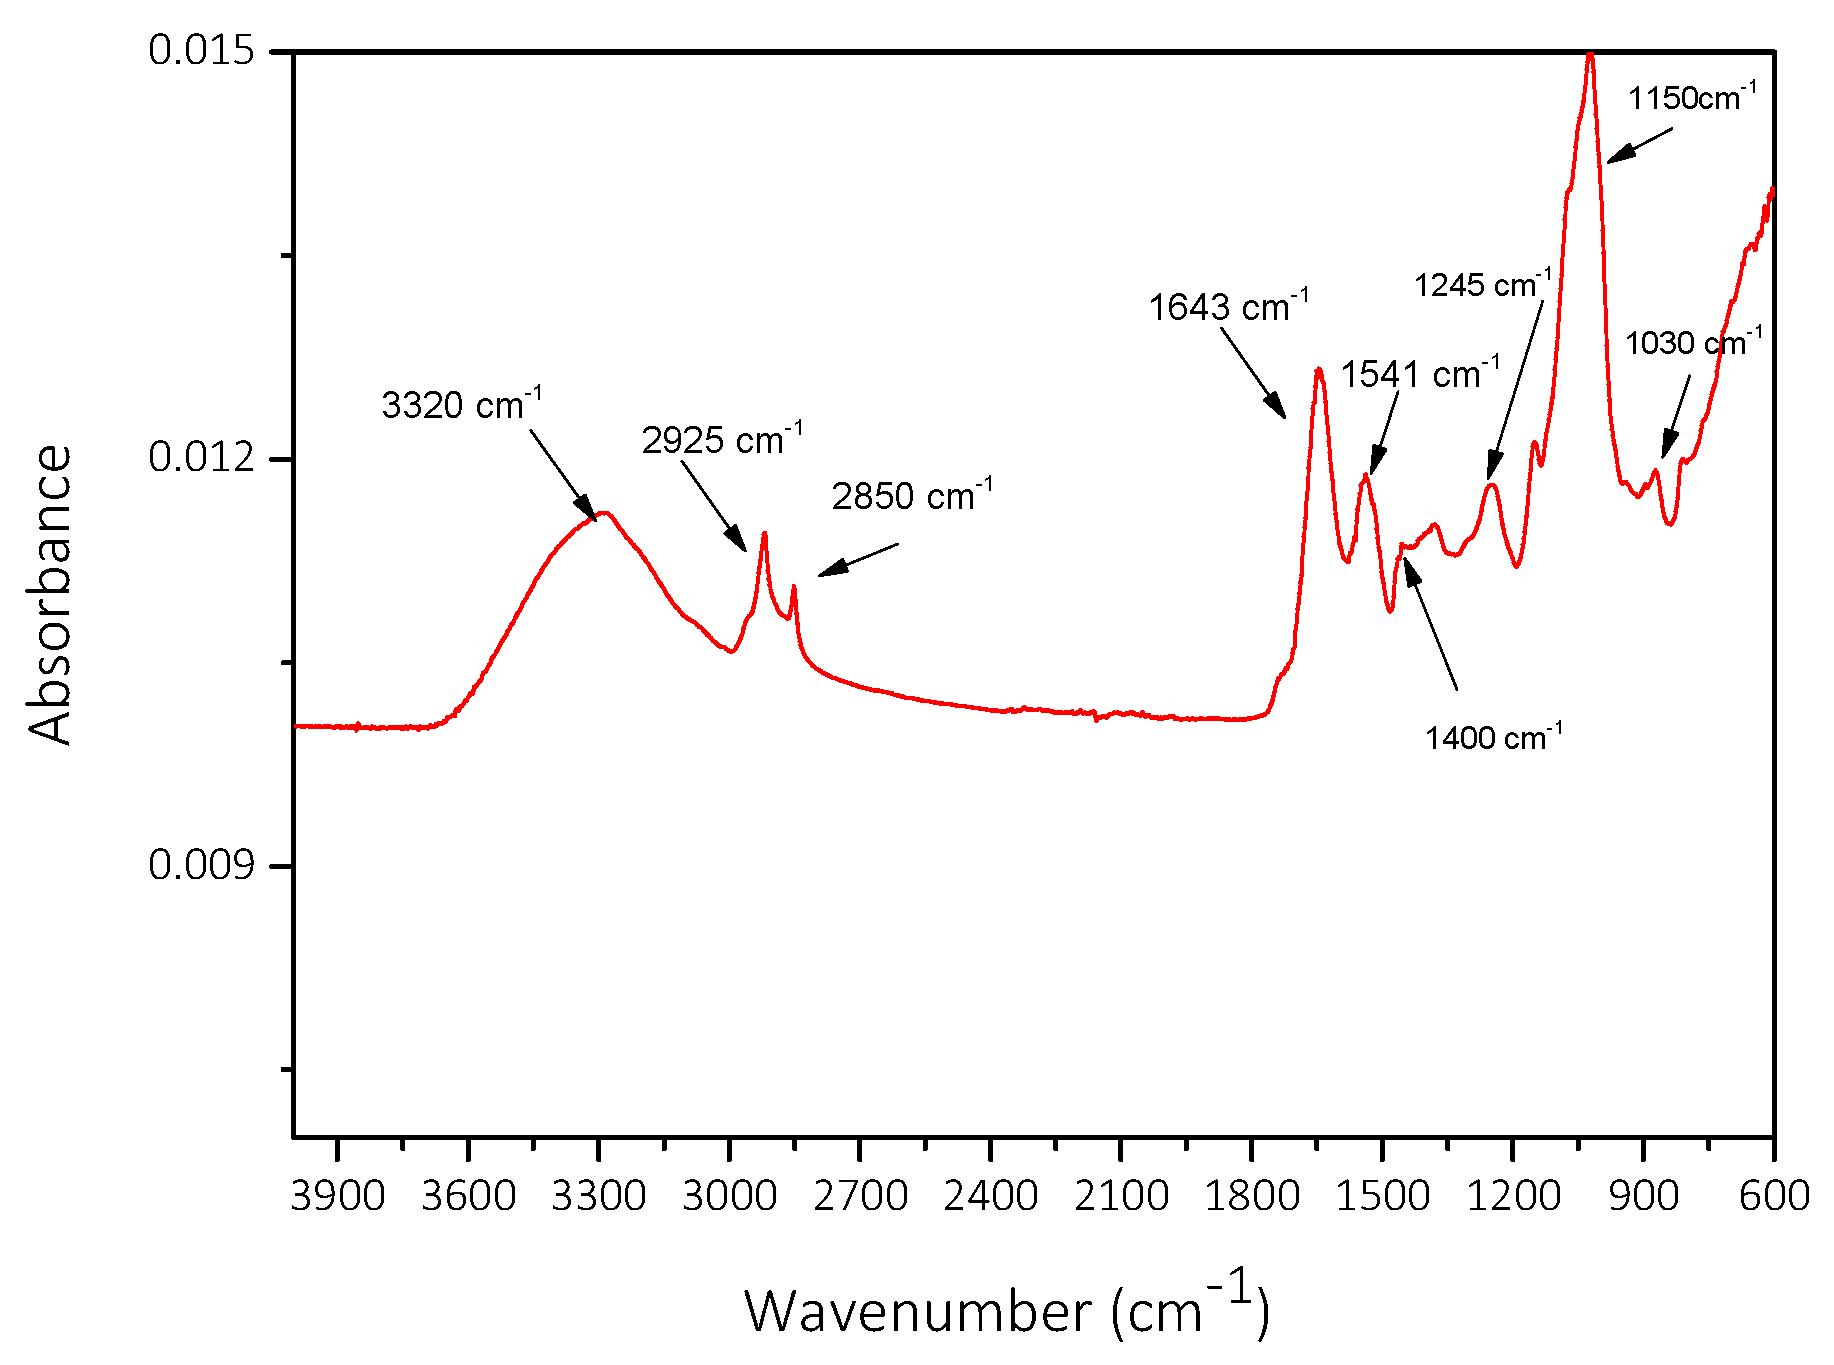
2.1. Acutodesmus obliquus (AO) Culture Development
2.2. Precipitation of CaCO3 in Supersaturated Solutions
2.2.1. Precipitation of CaCO3 from Supersaturated Solutions: Free-Drift Method
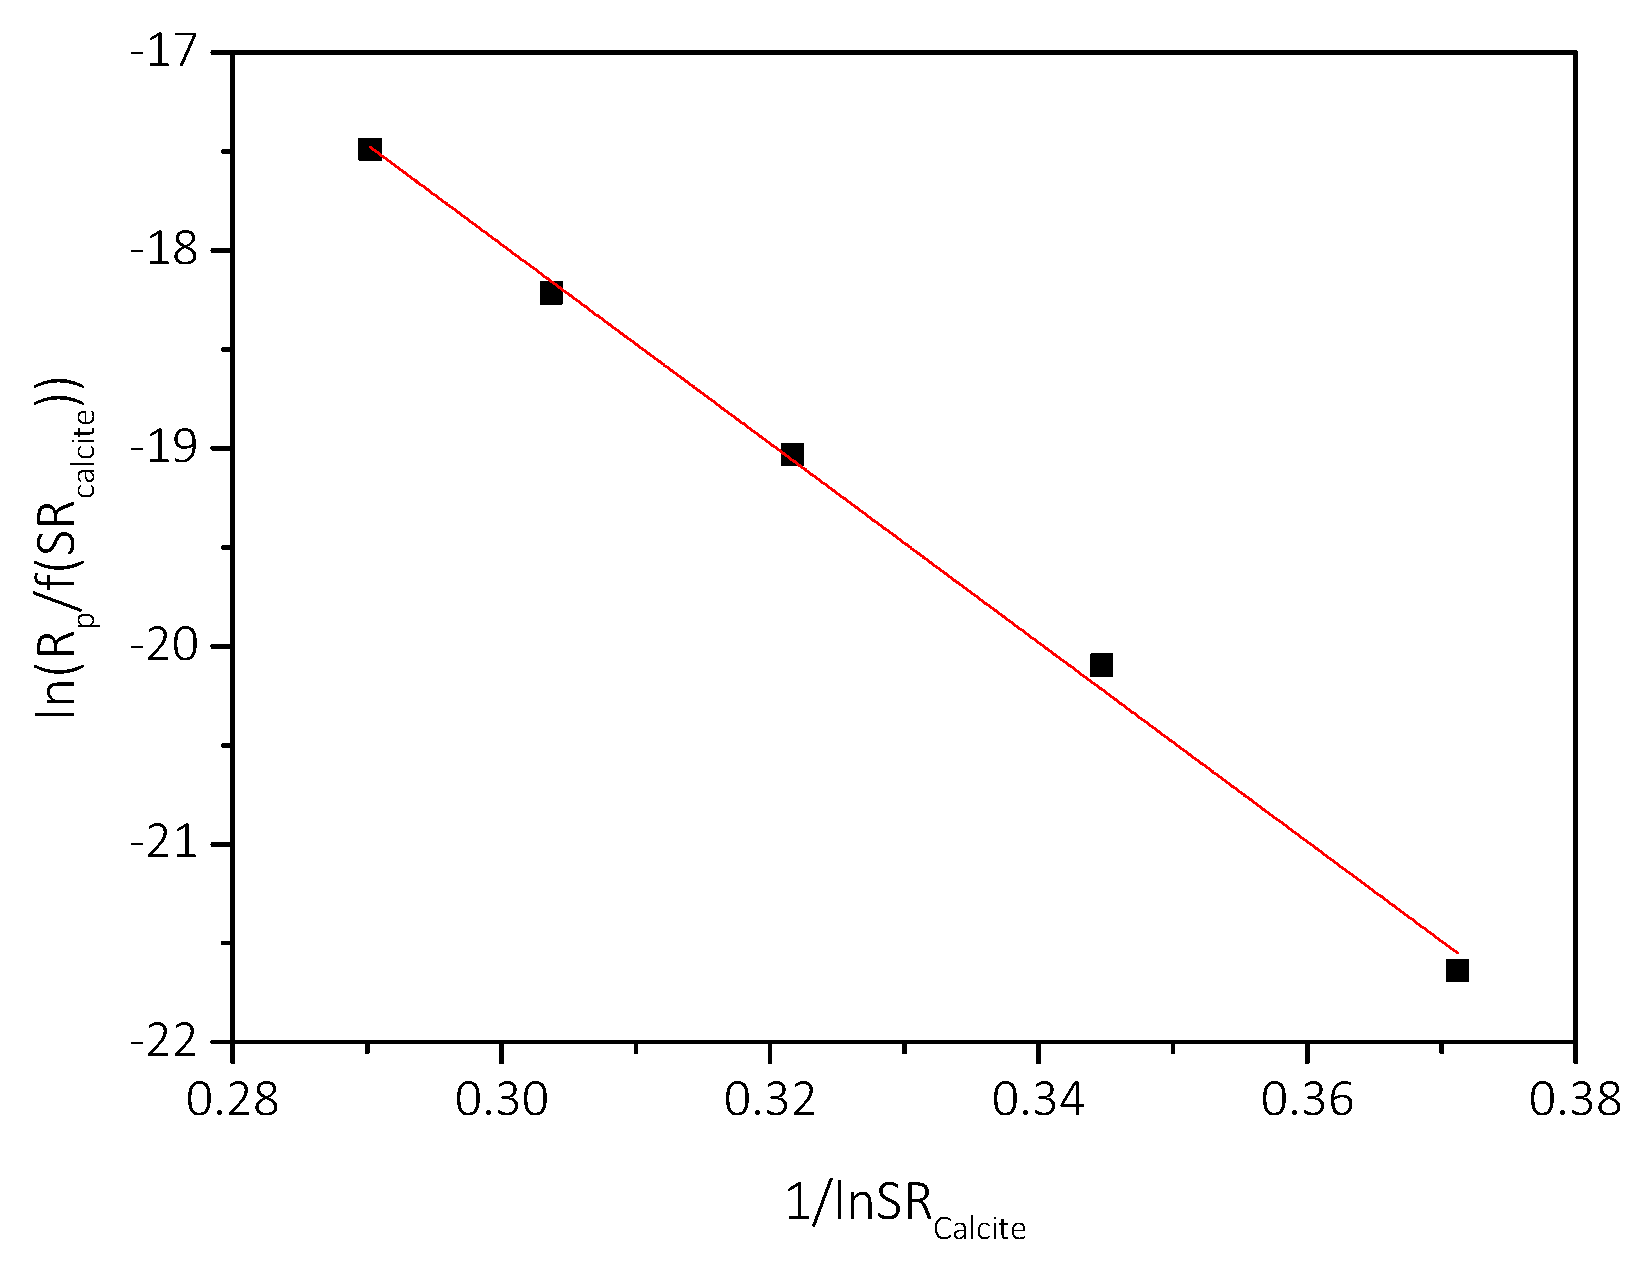
2.2.2. Precipitation of CaCO3 at Constant Supersaturation
3. Results
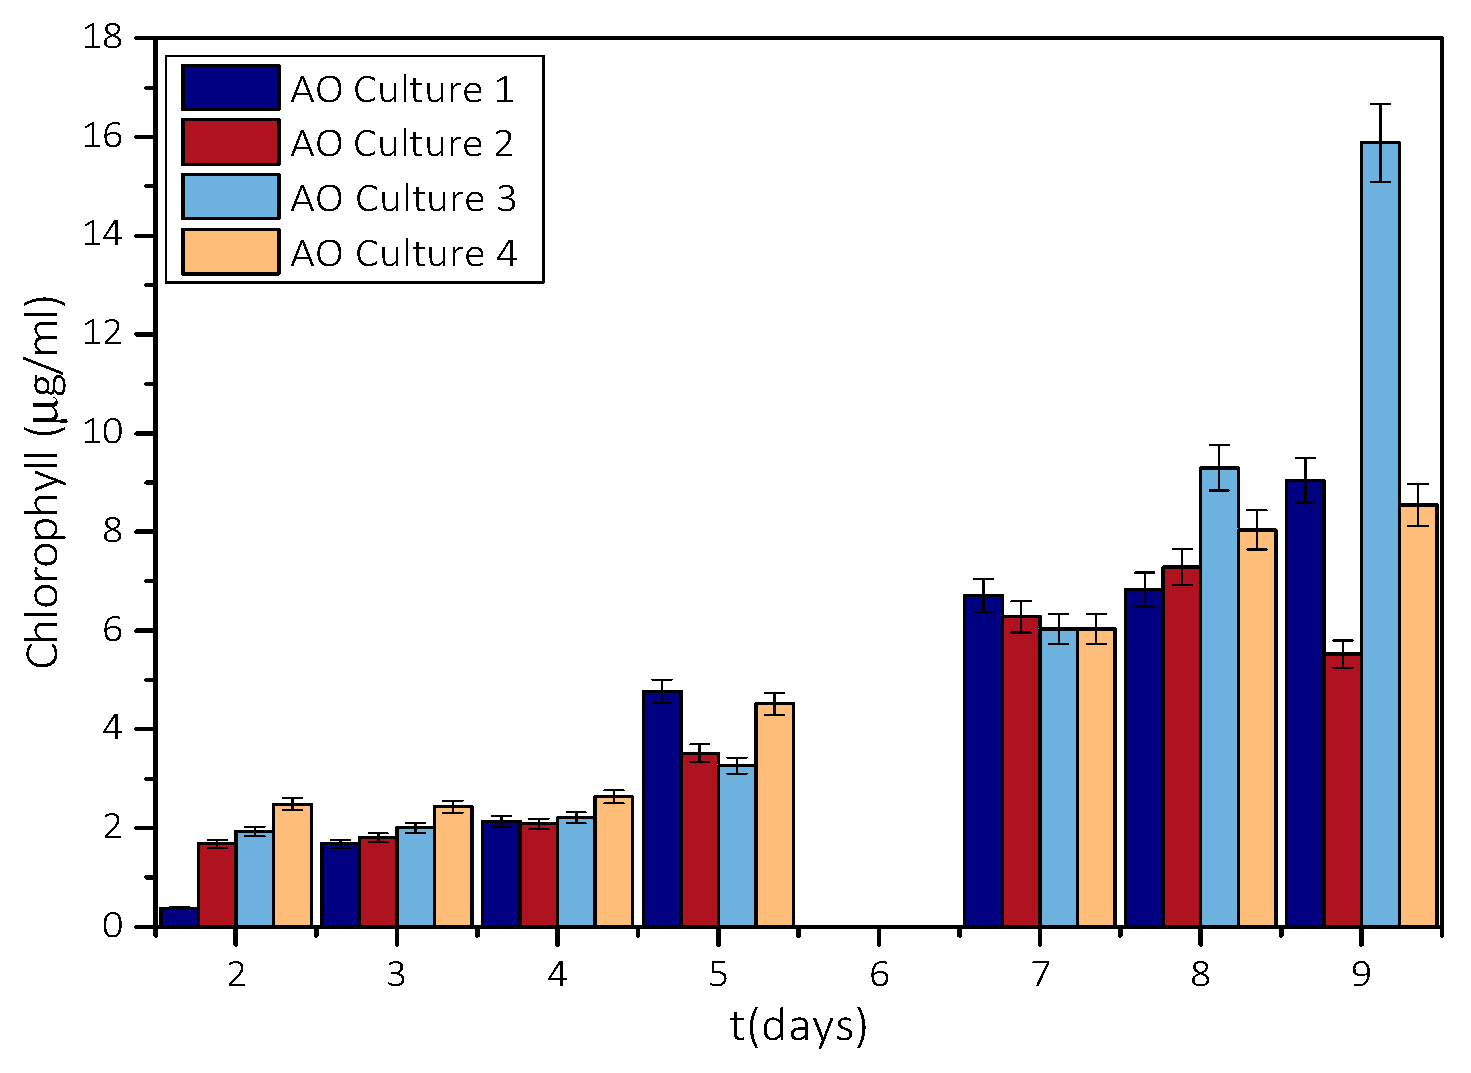
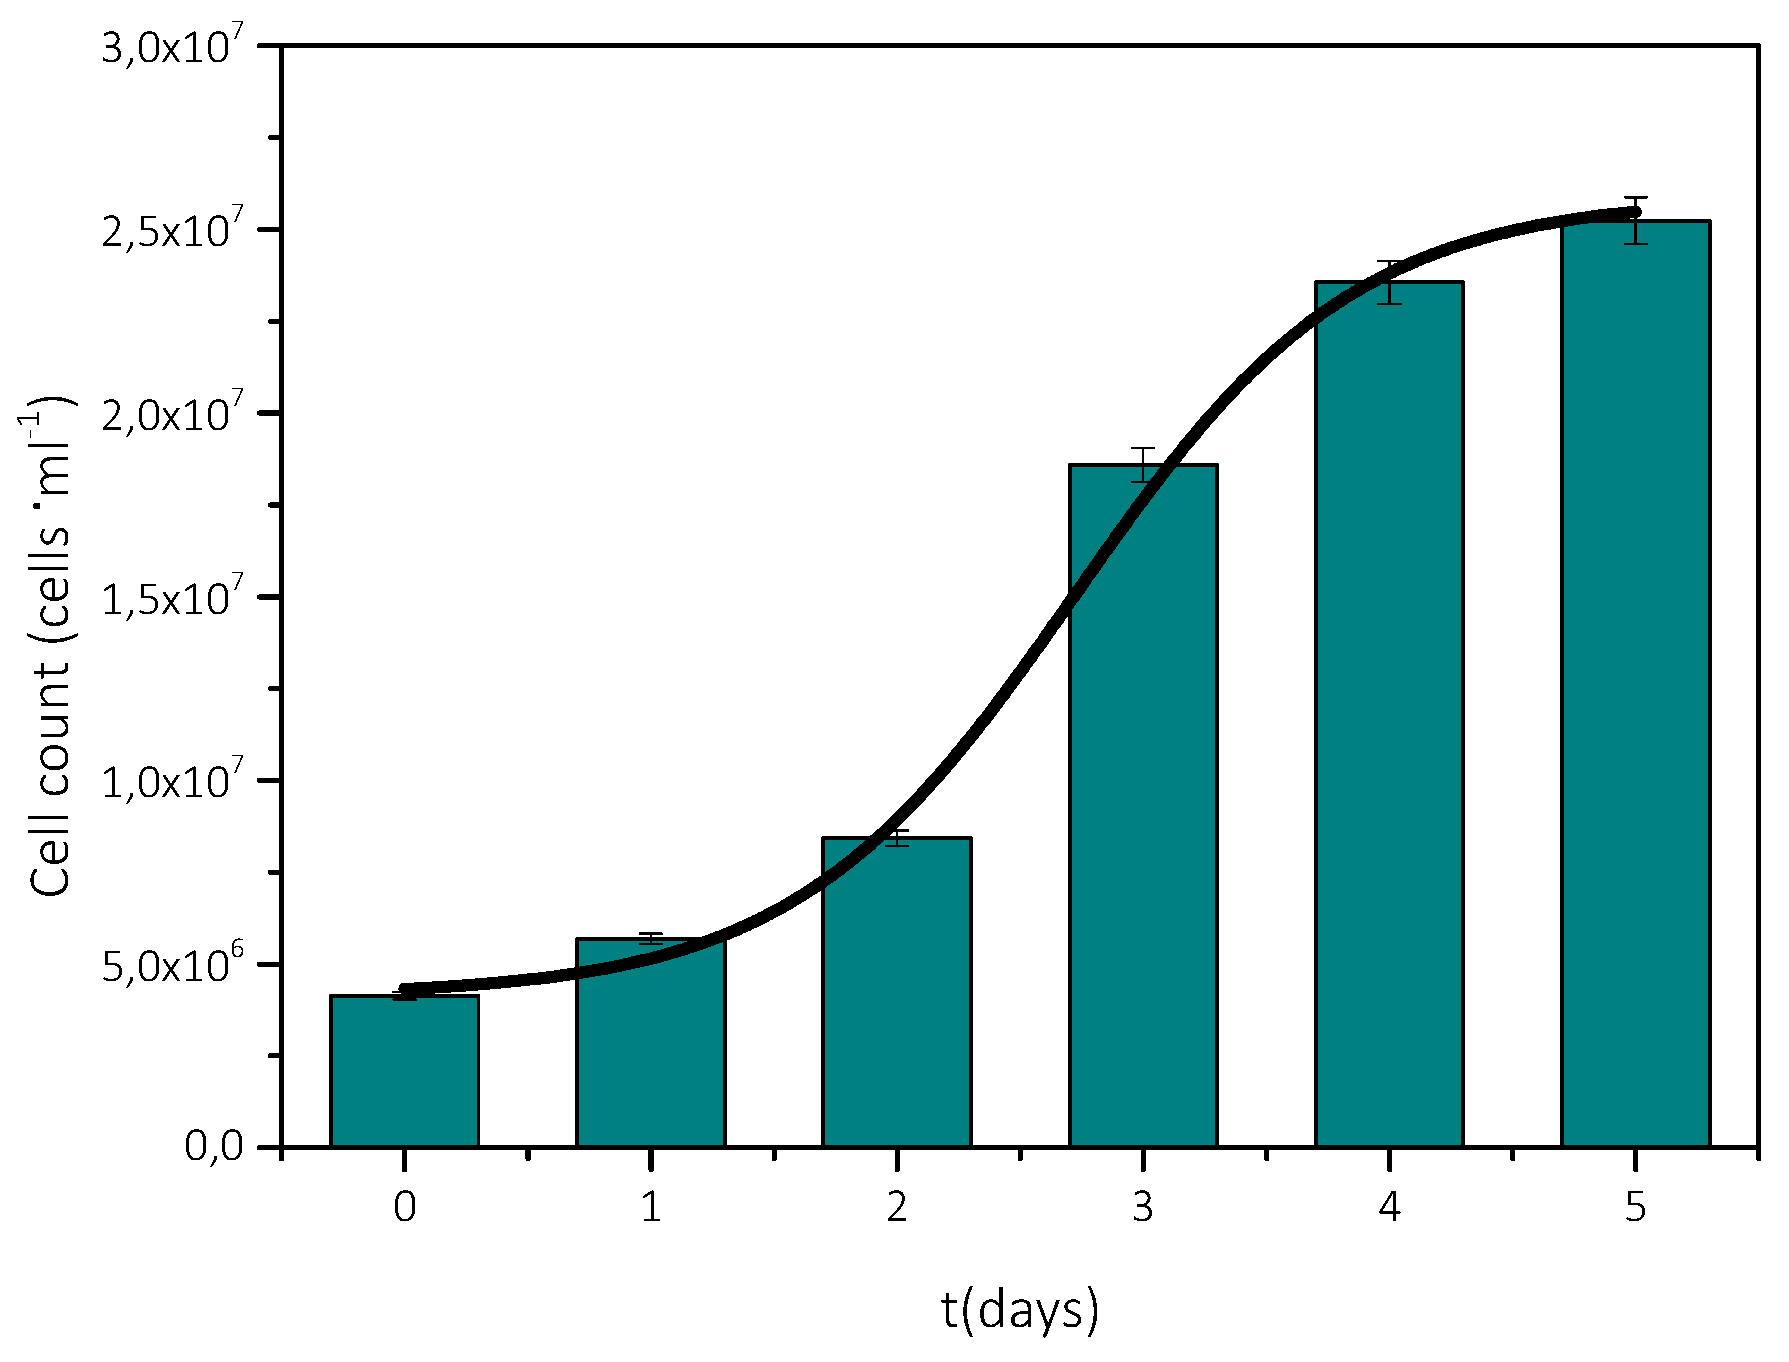
3.1. Measurement of Growth Rate of Microalgae AO
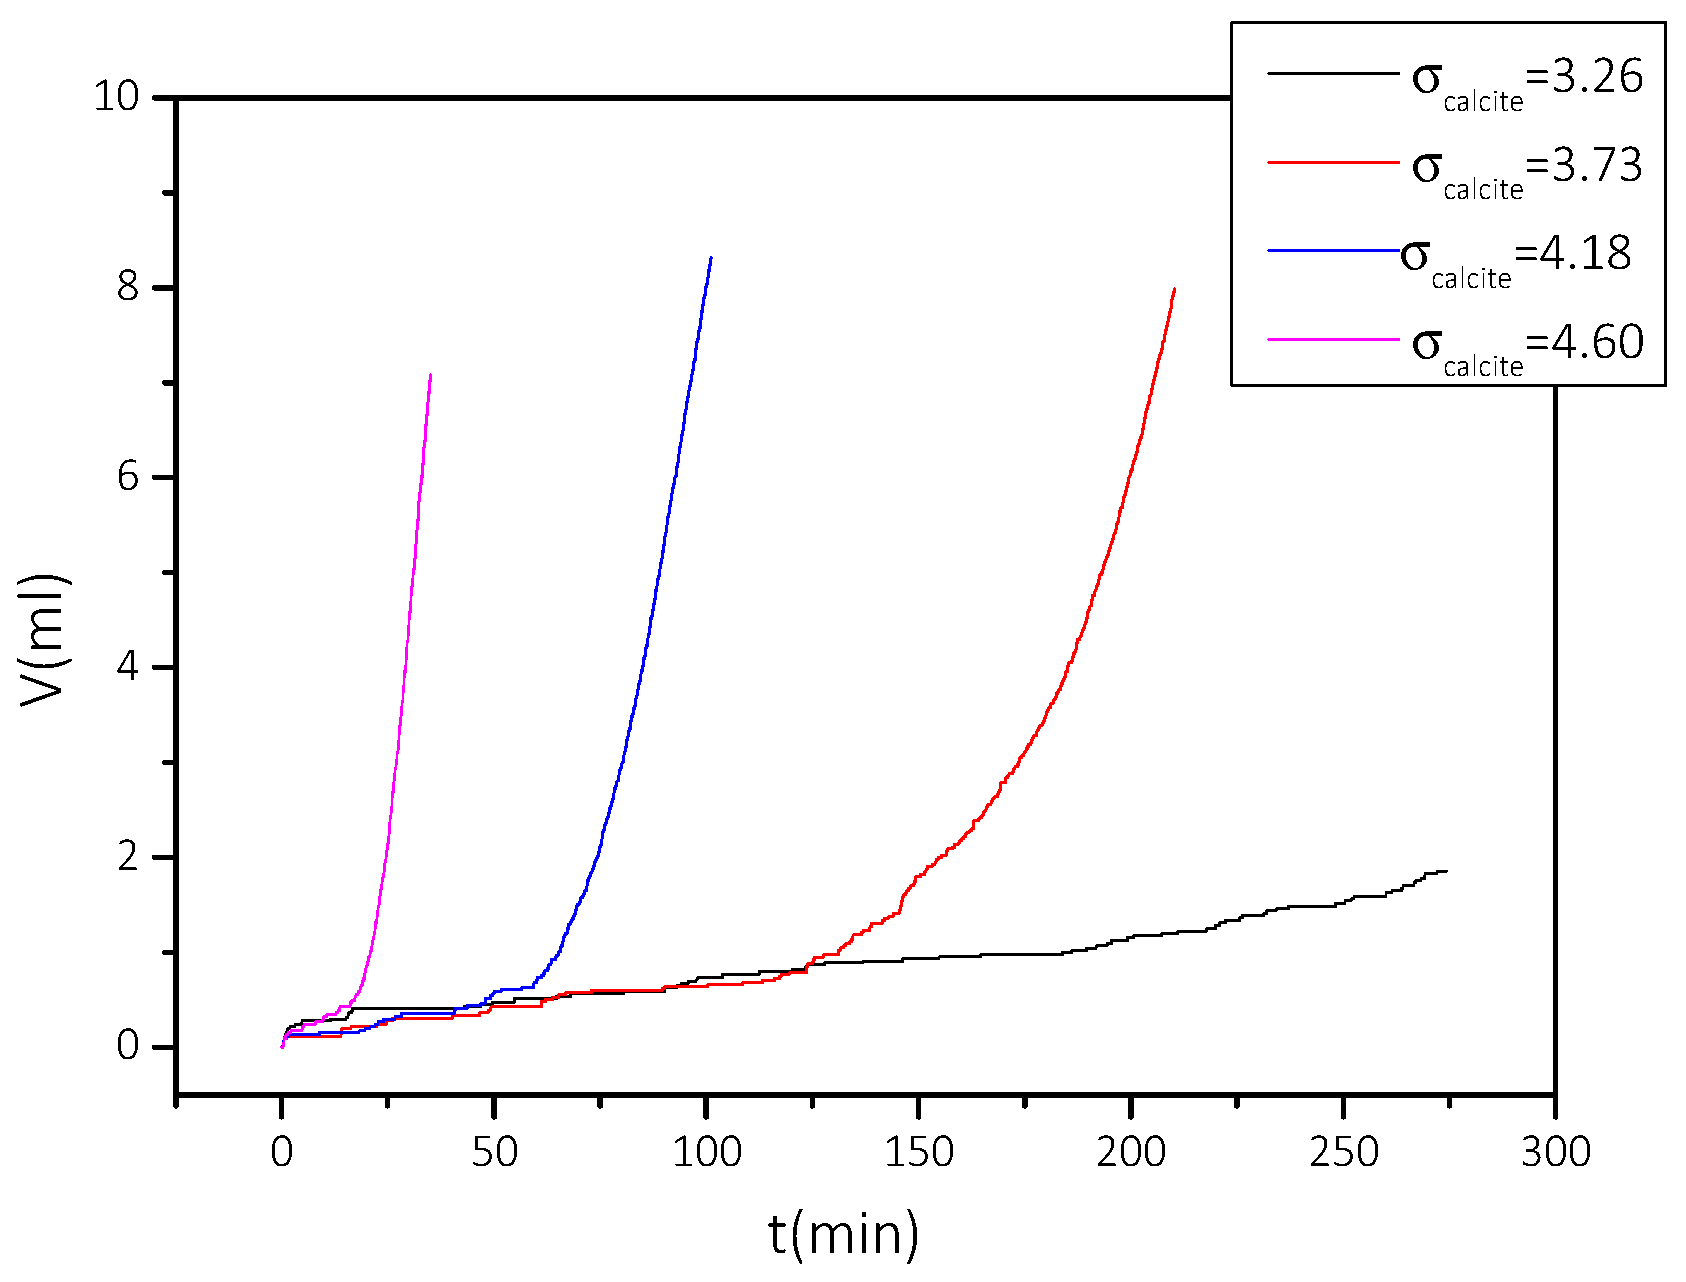
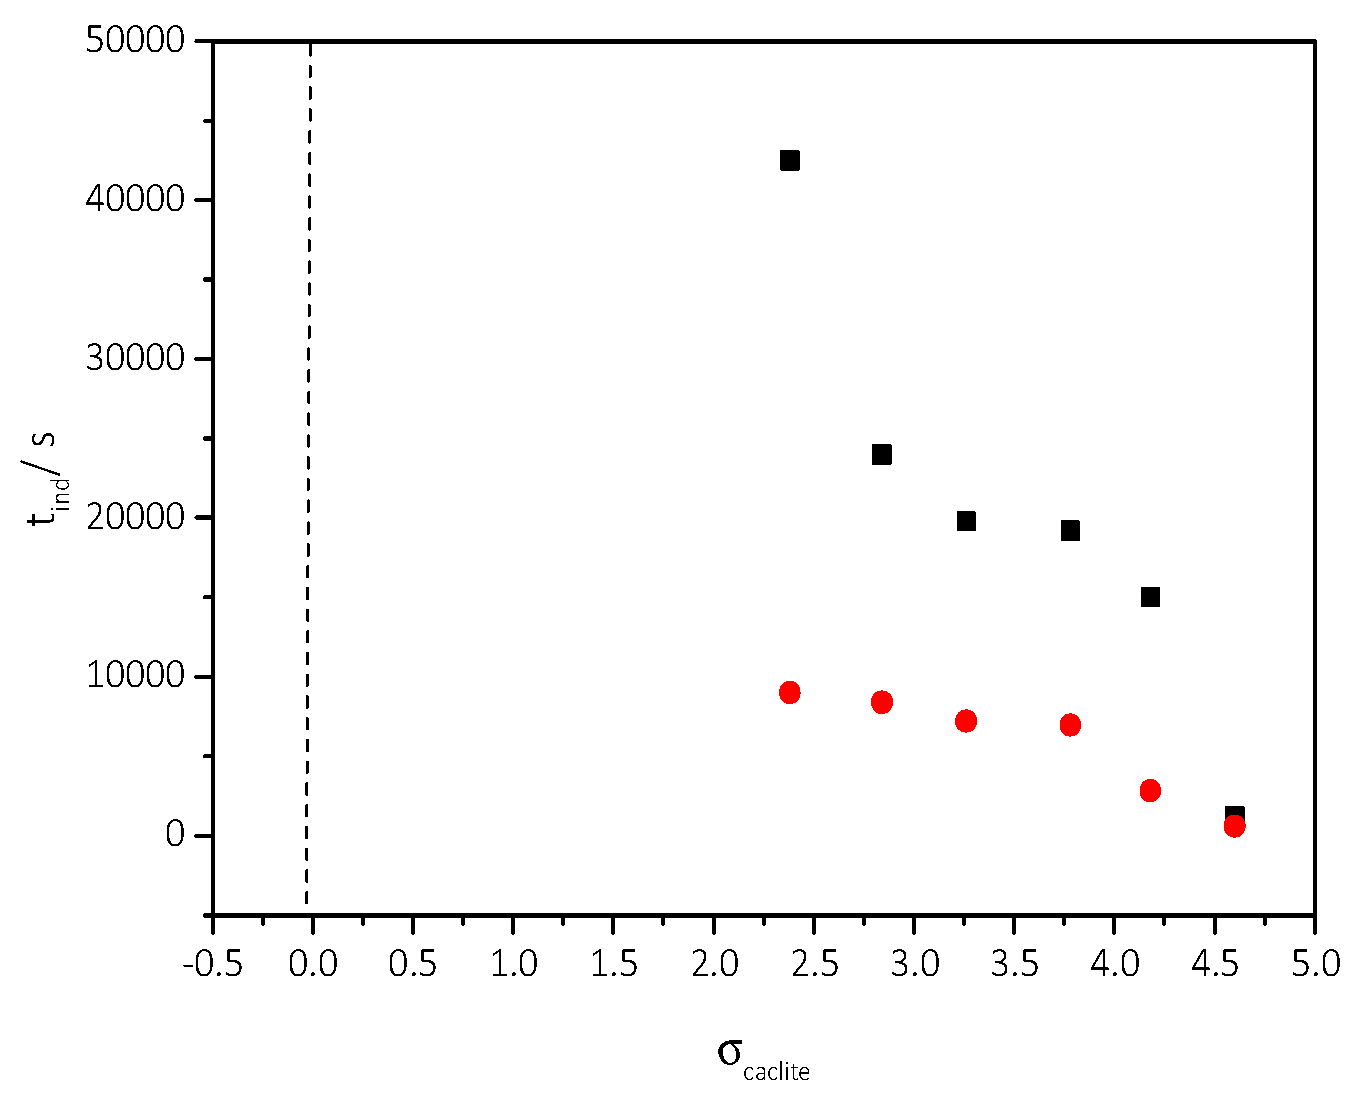
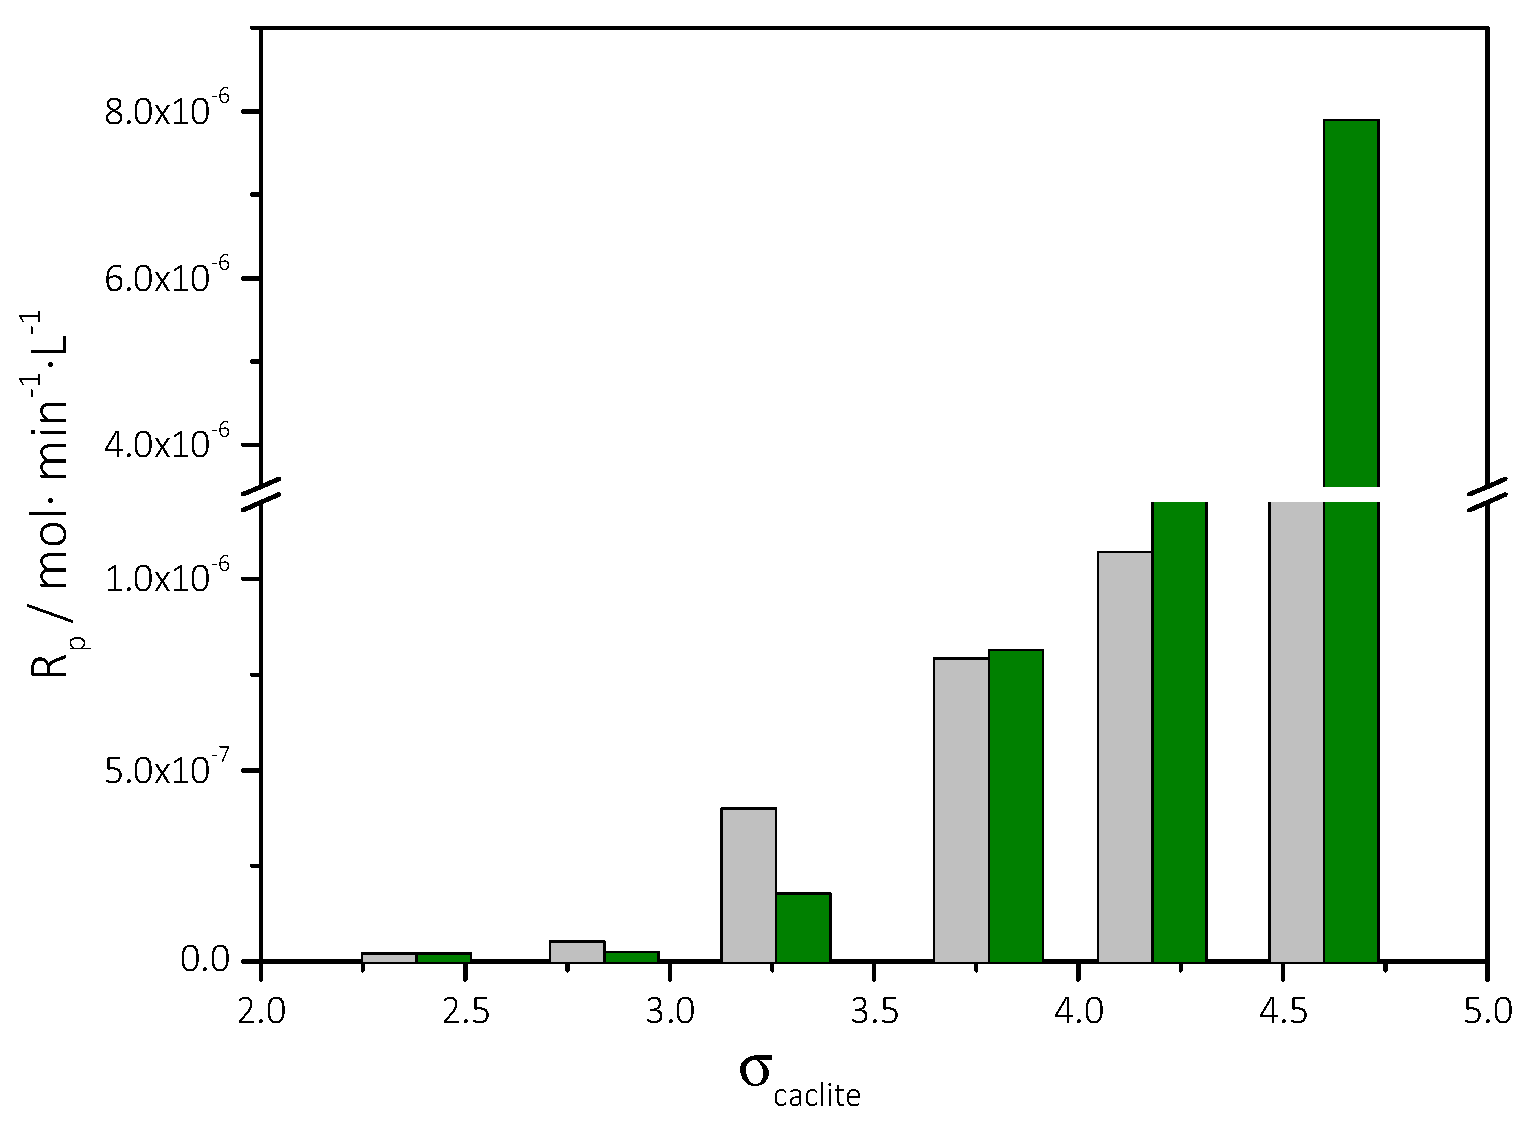
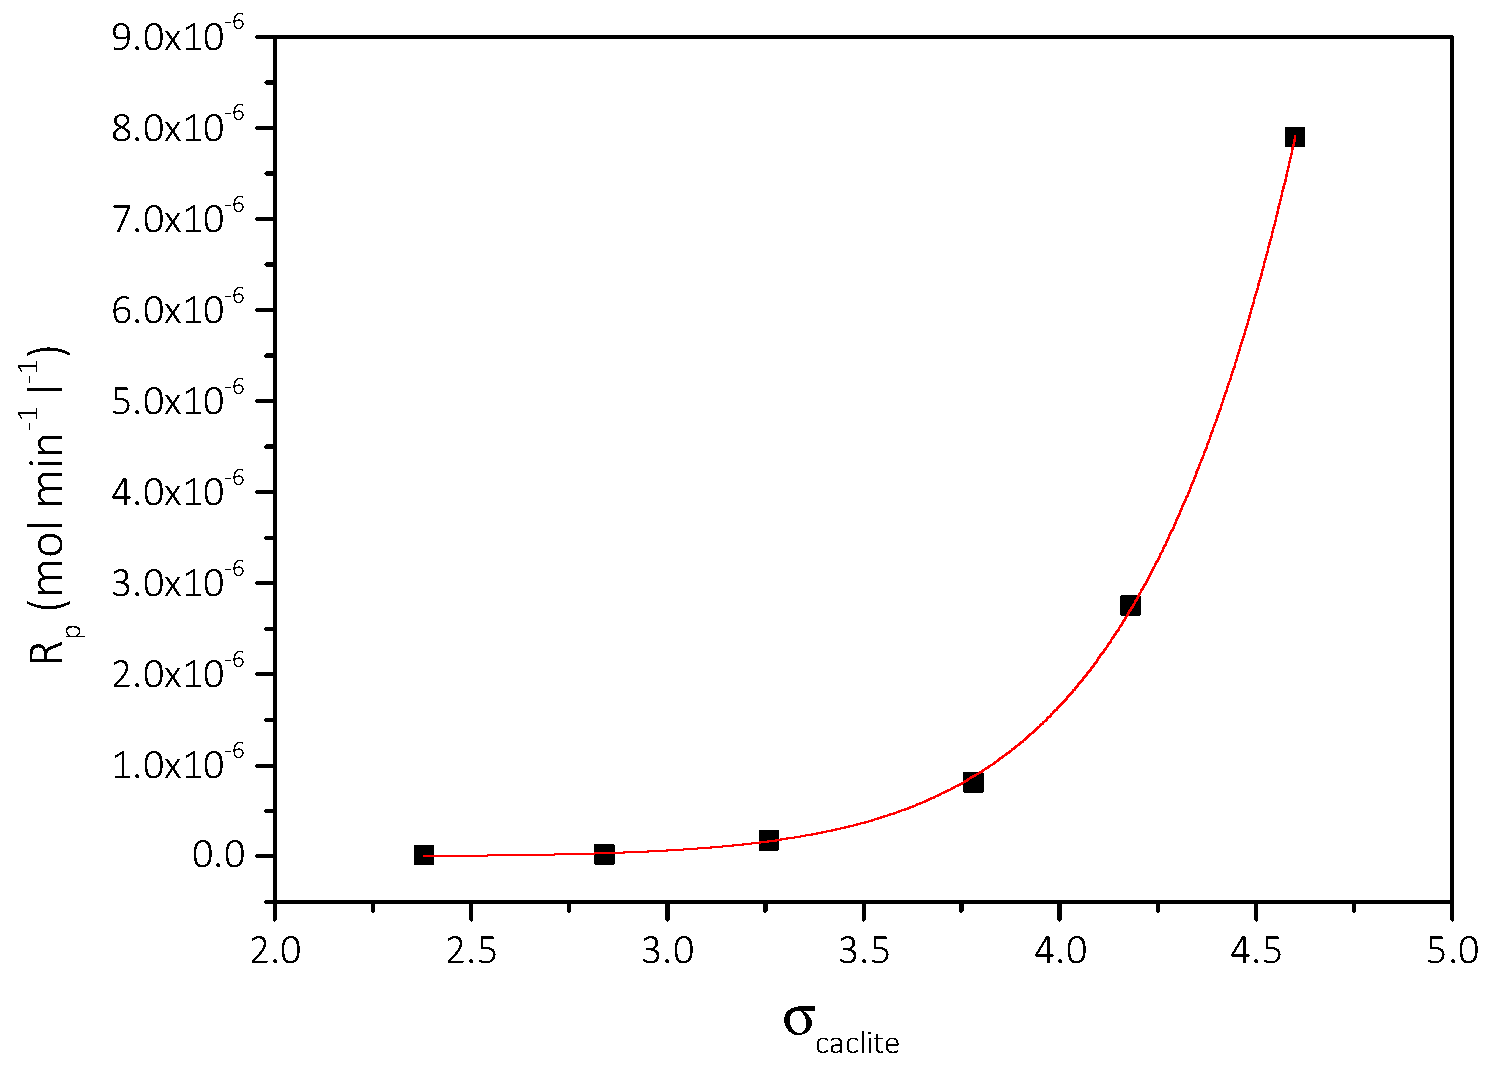
3.2. Spontaneous Precipitation of CaCO3 in Supersaturated Solutions: The Metastable Zone Width
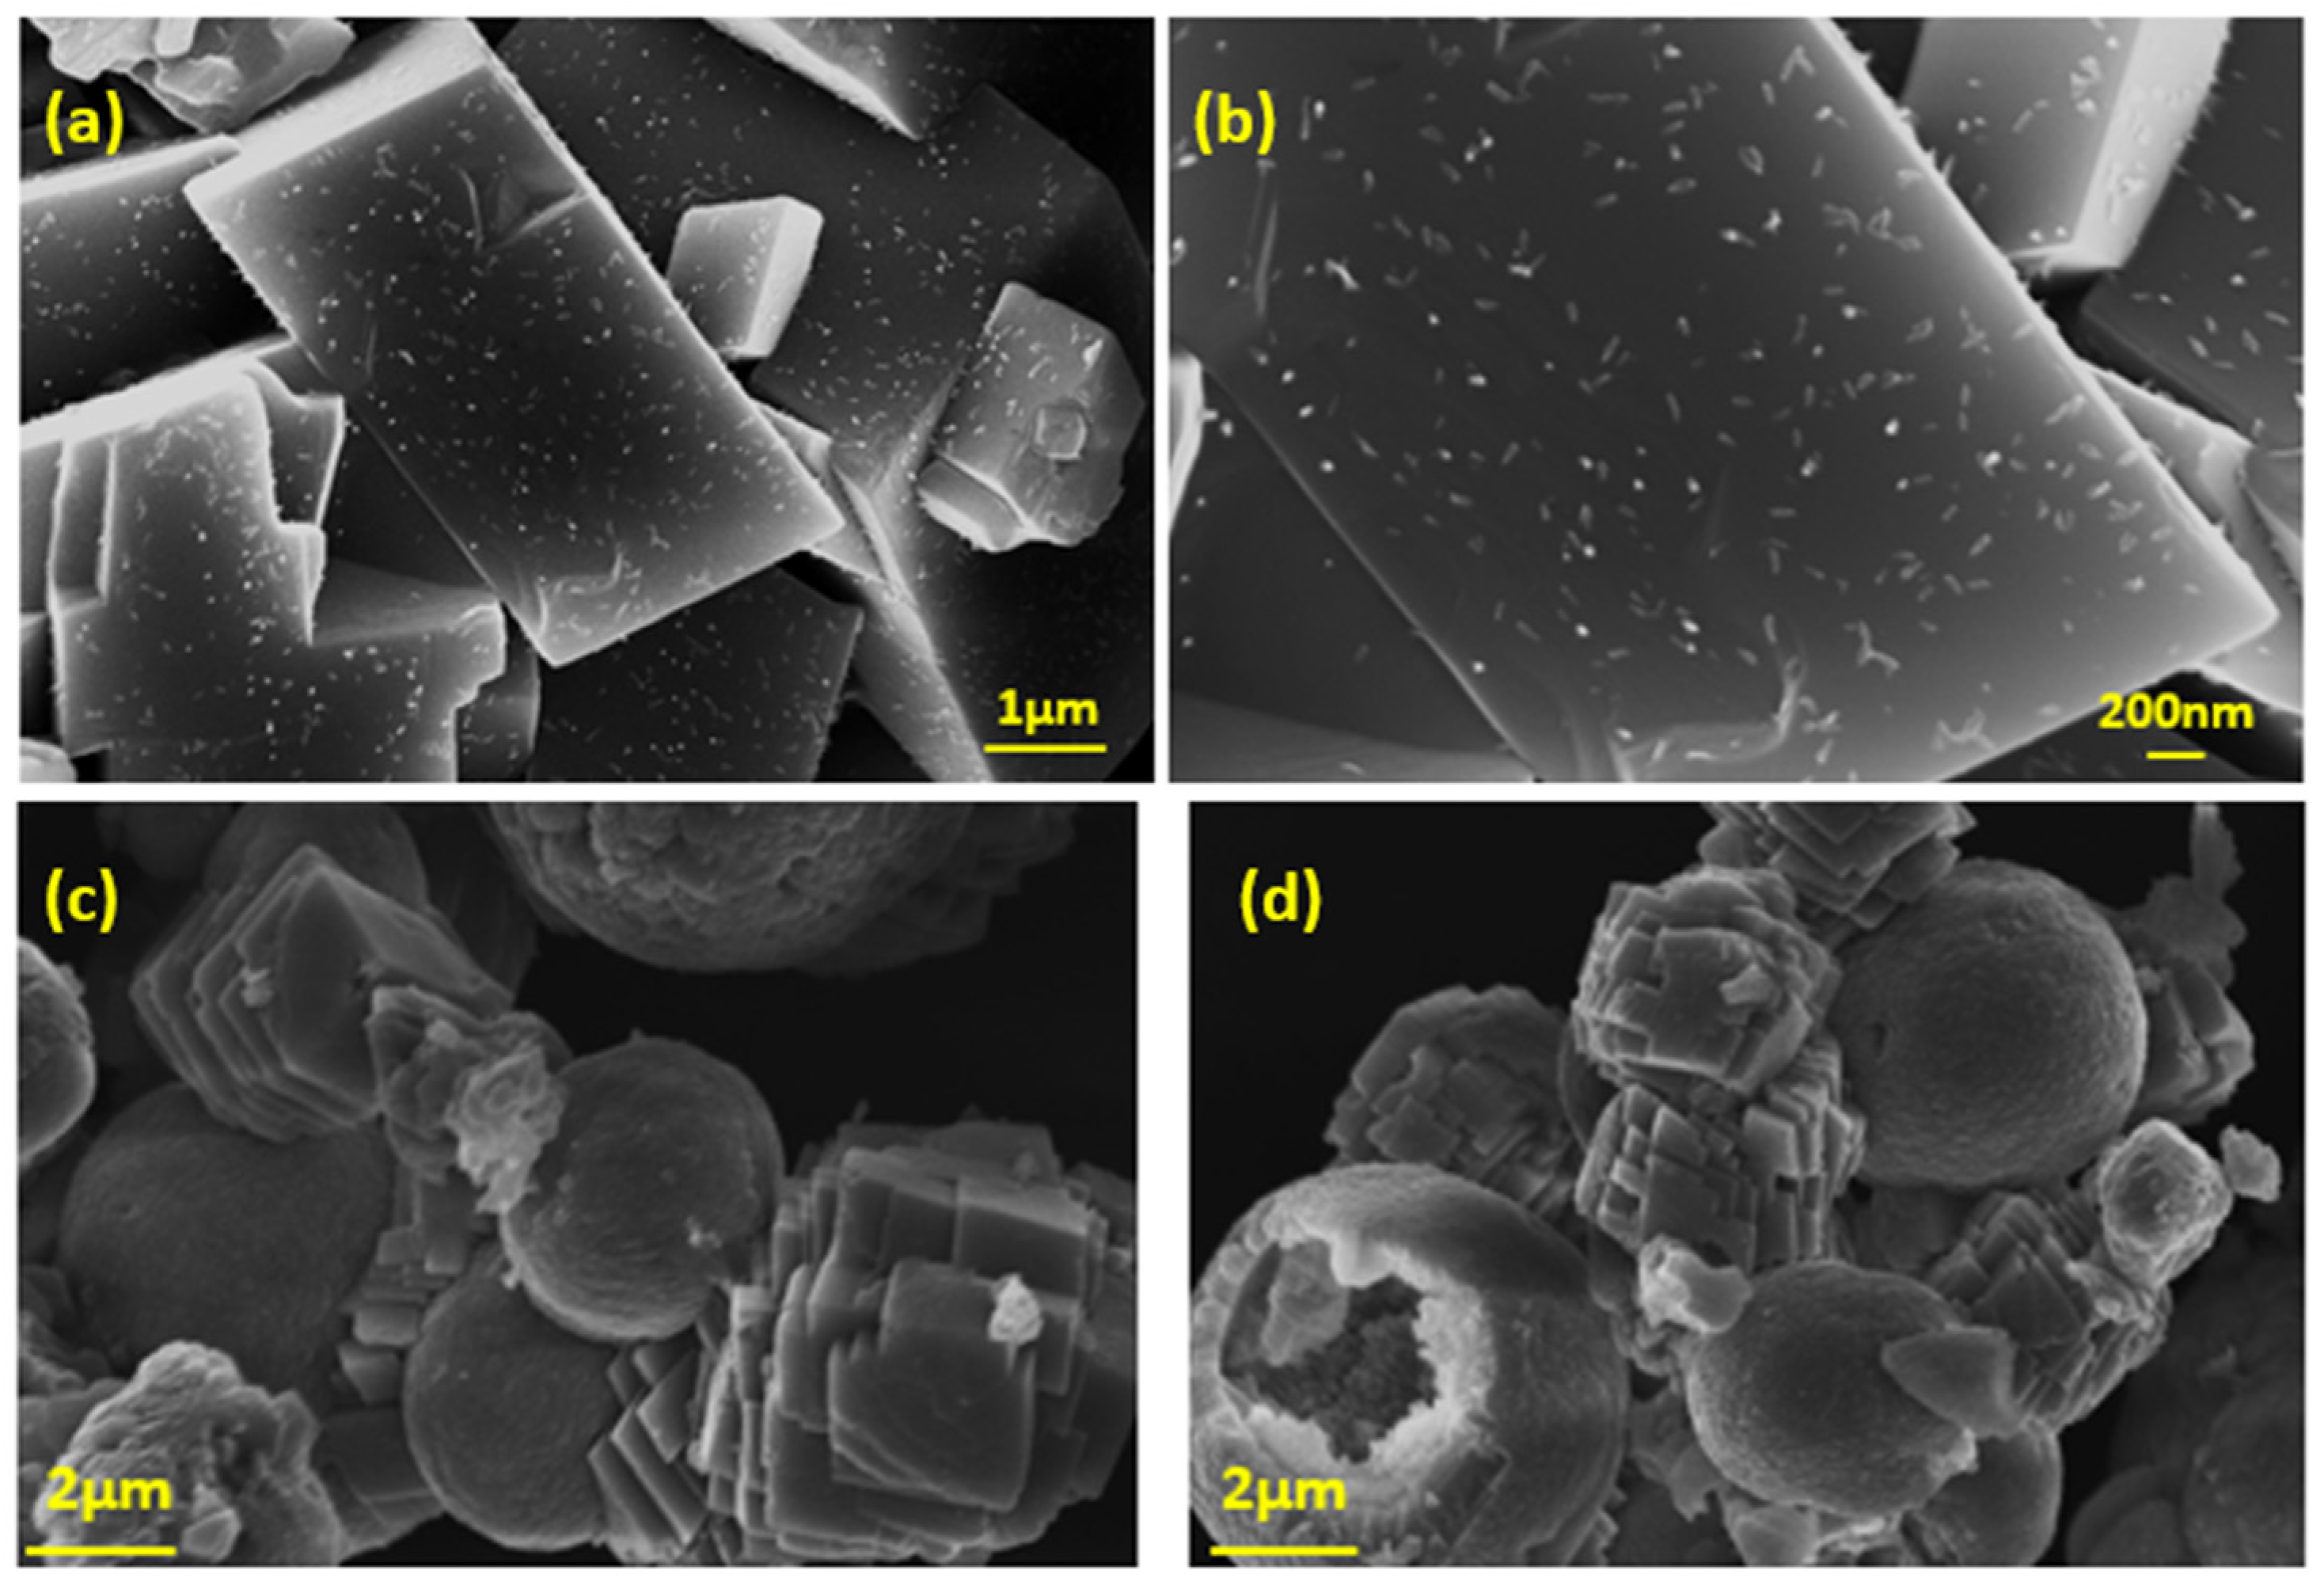
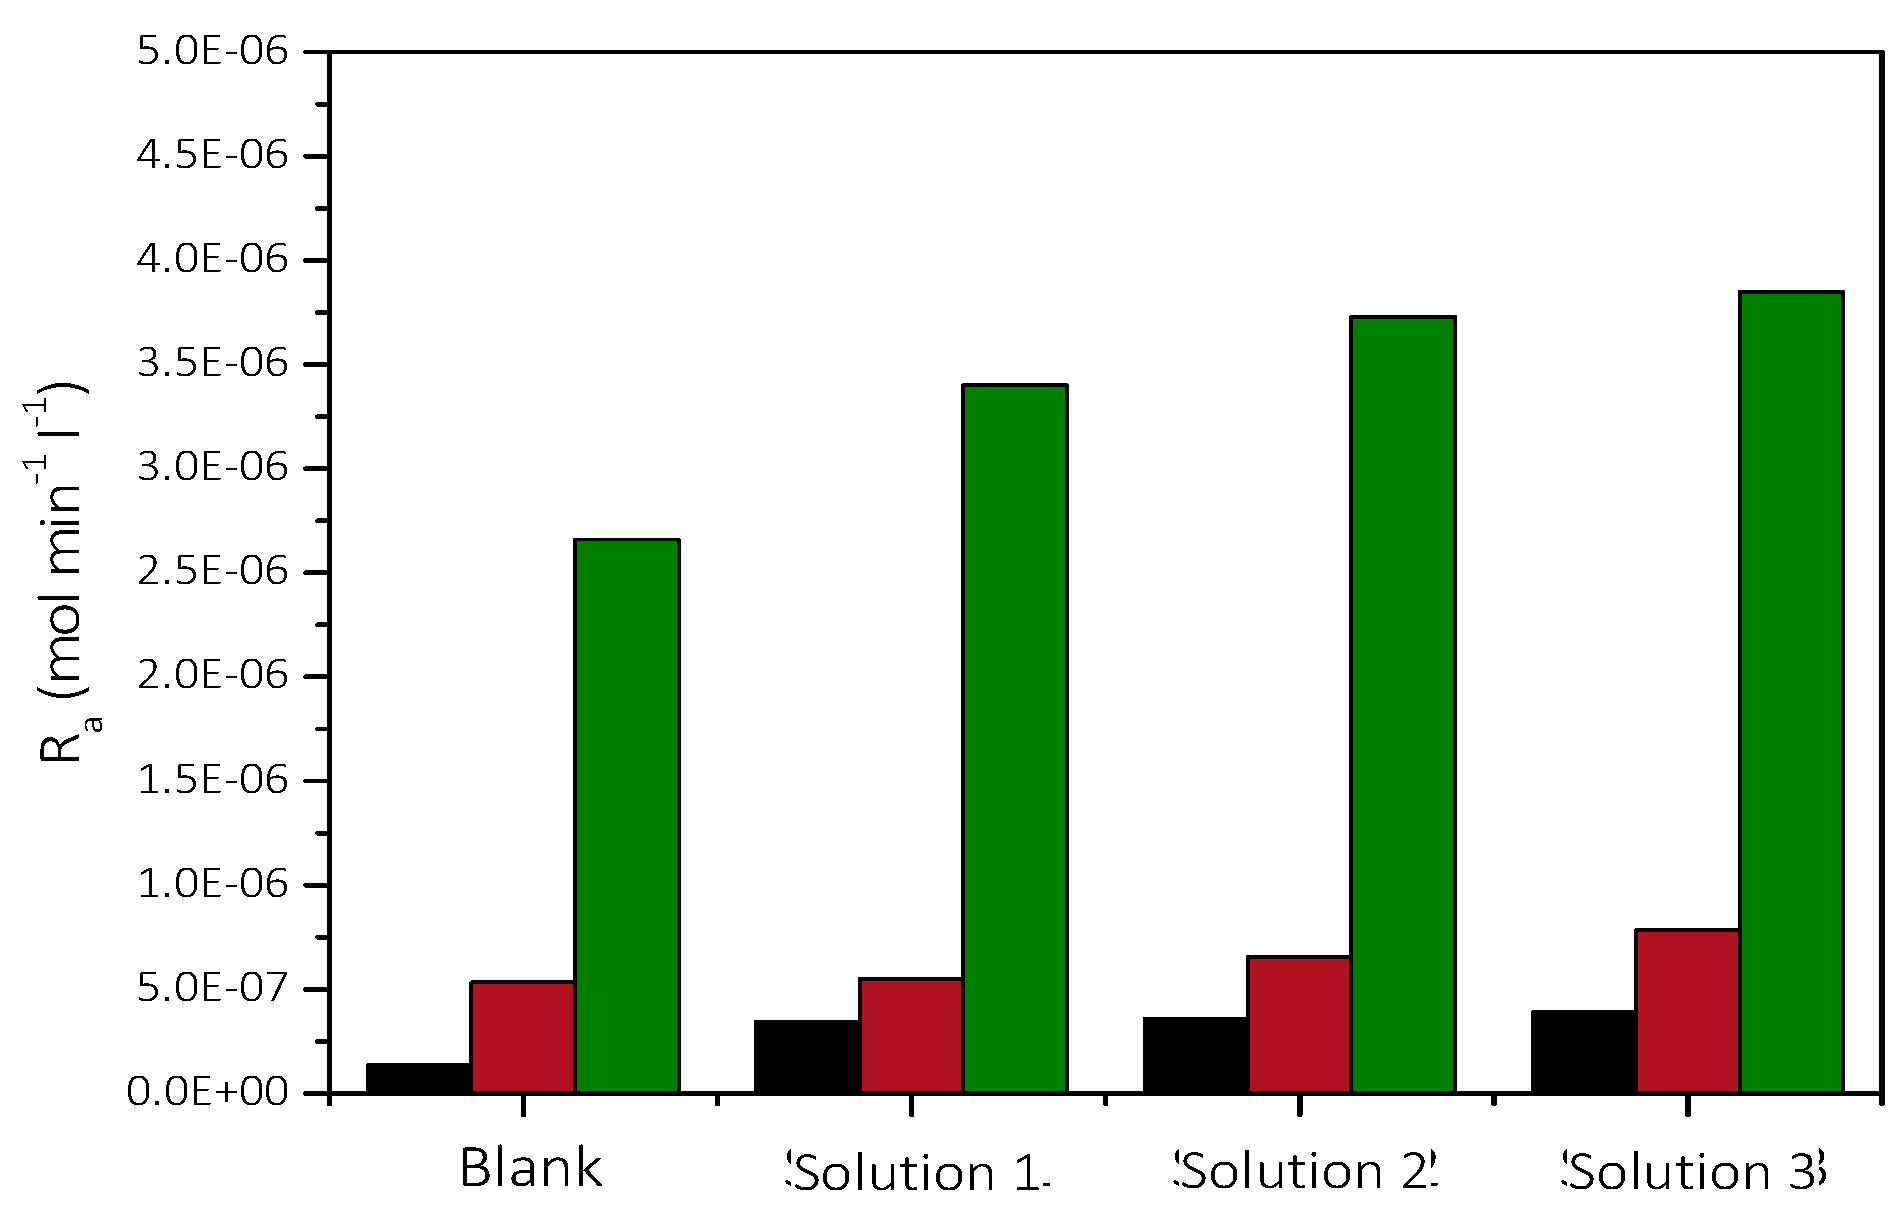
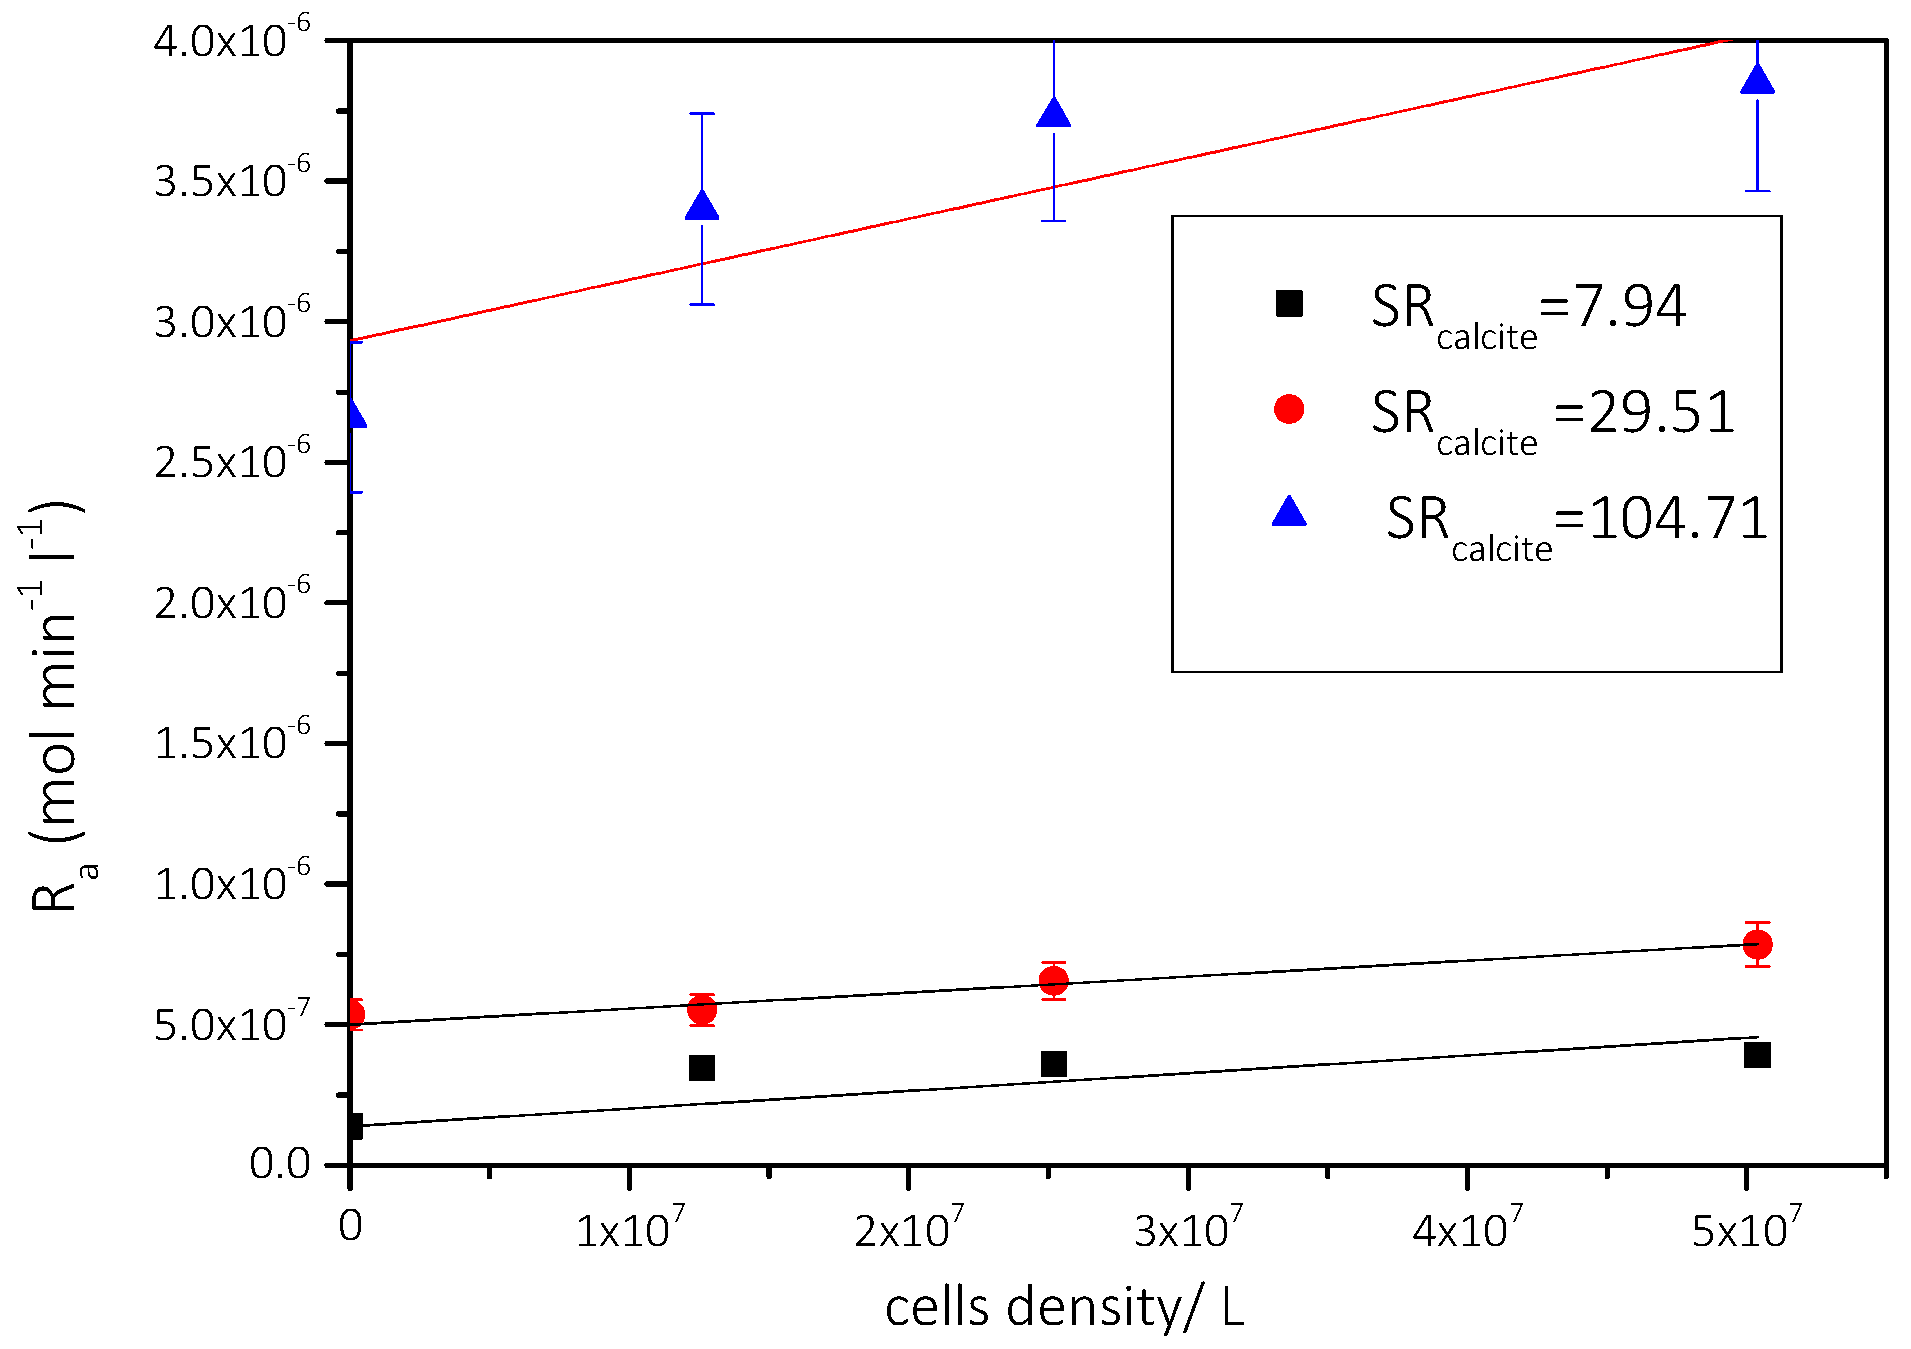
3.2.1. The Effect of the Presence of AO Culture Cells in the Supersaturated Solutions
Precipitation of CaCO3 in the Presence of Different AO Culture Mass
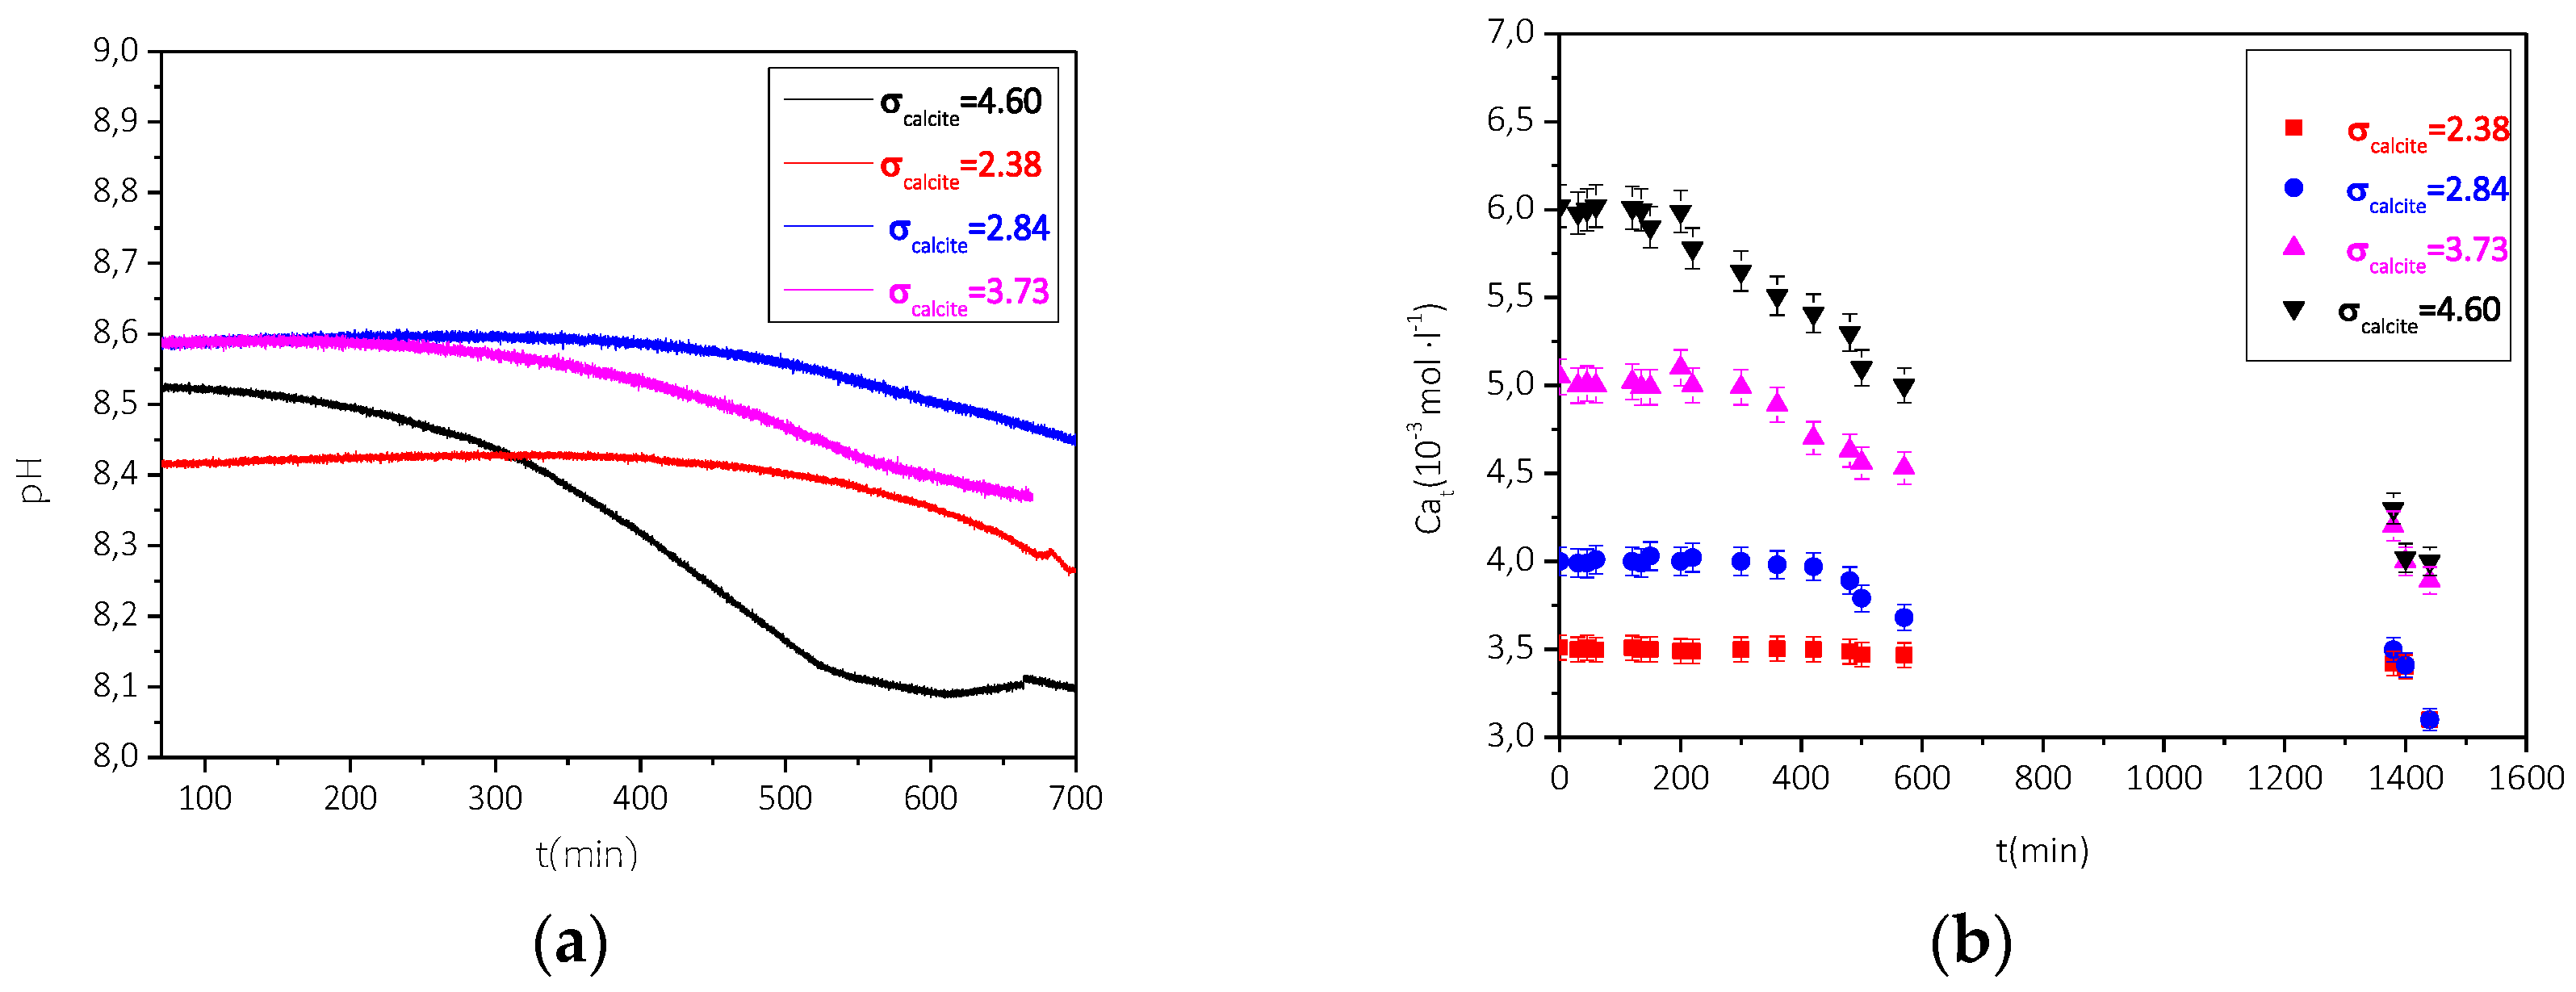
3.2.2. Precipitation of CaCO3 in the Presence of AO Culture, Illumination, and Nutrient at Constant Supersaturation
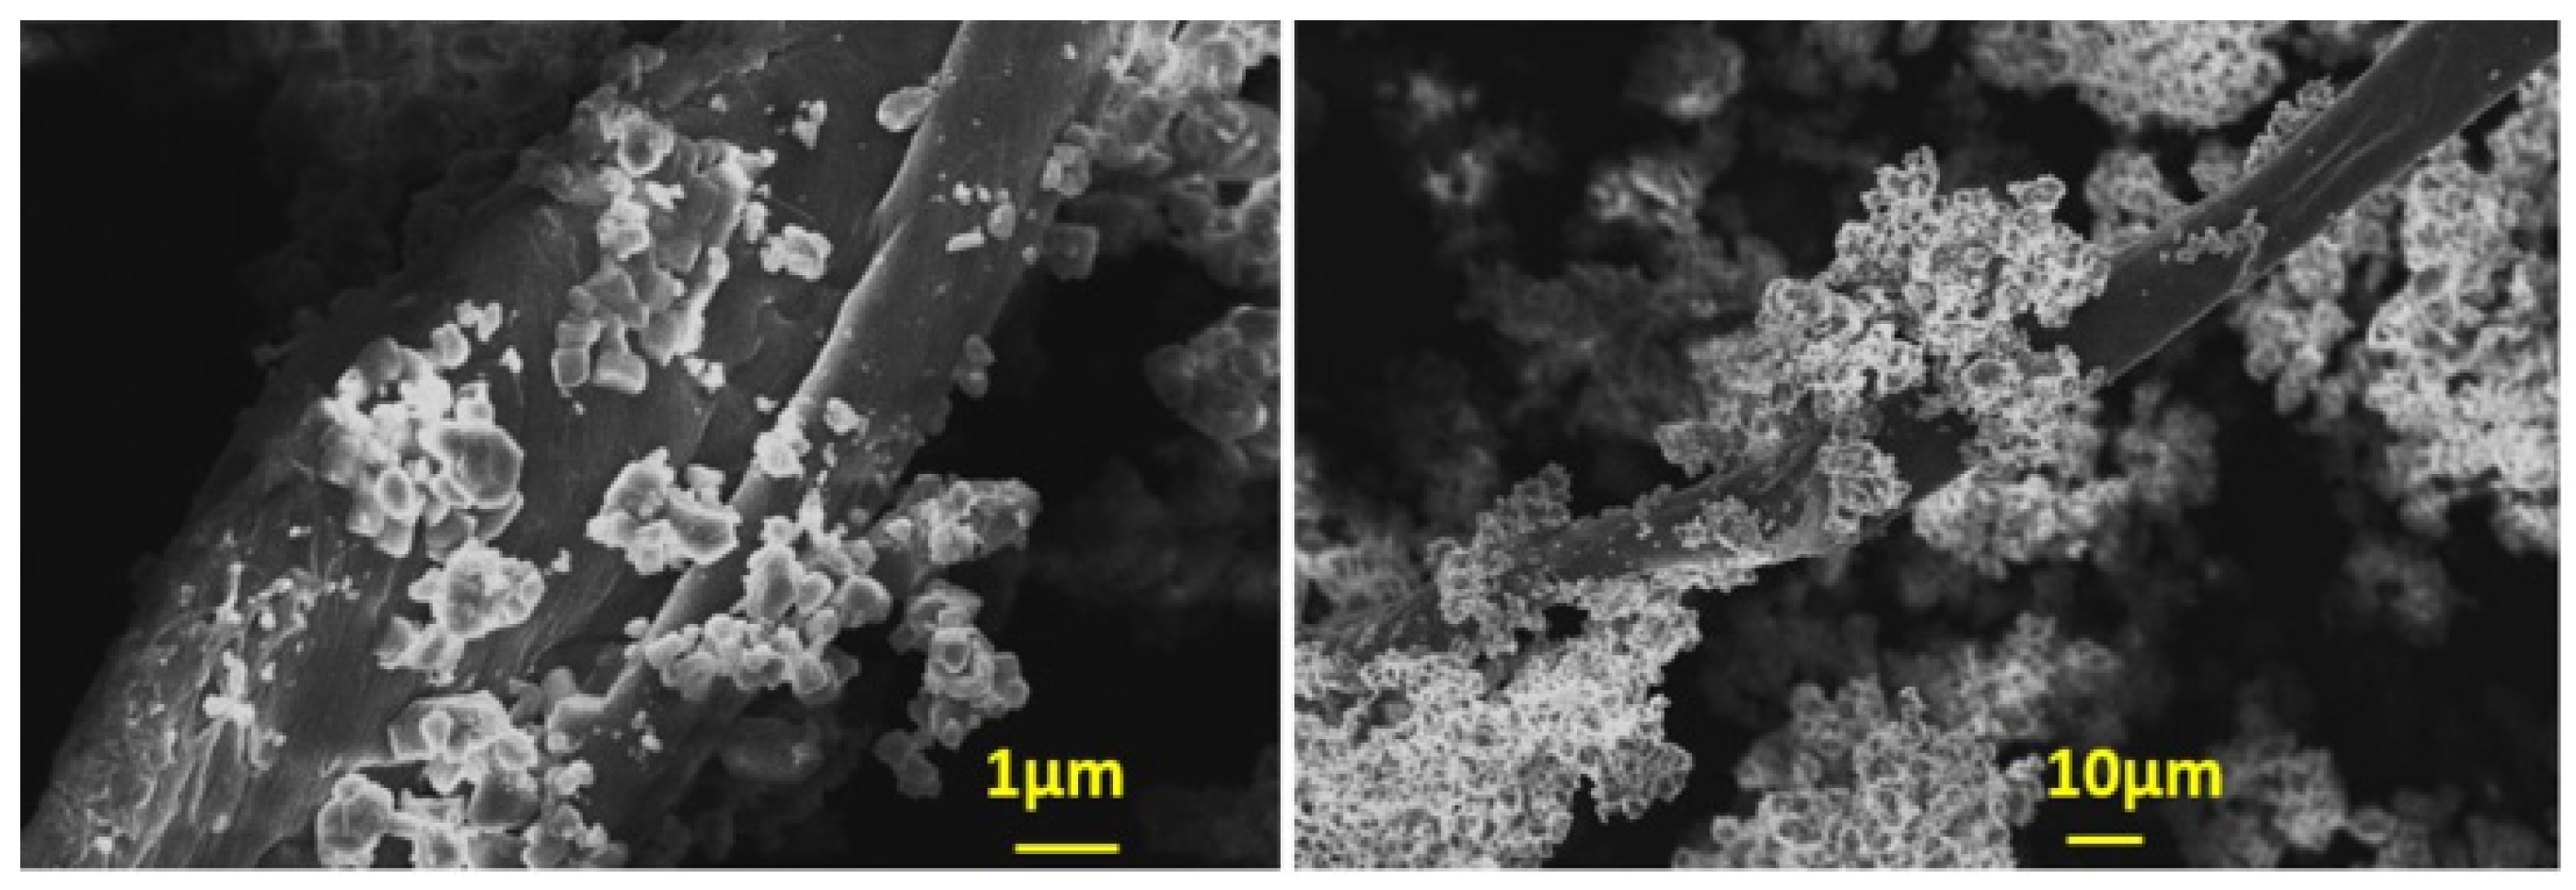
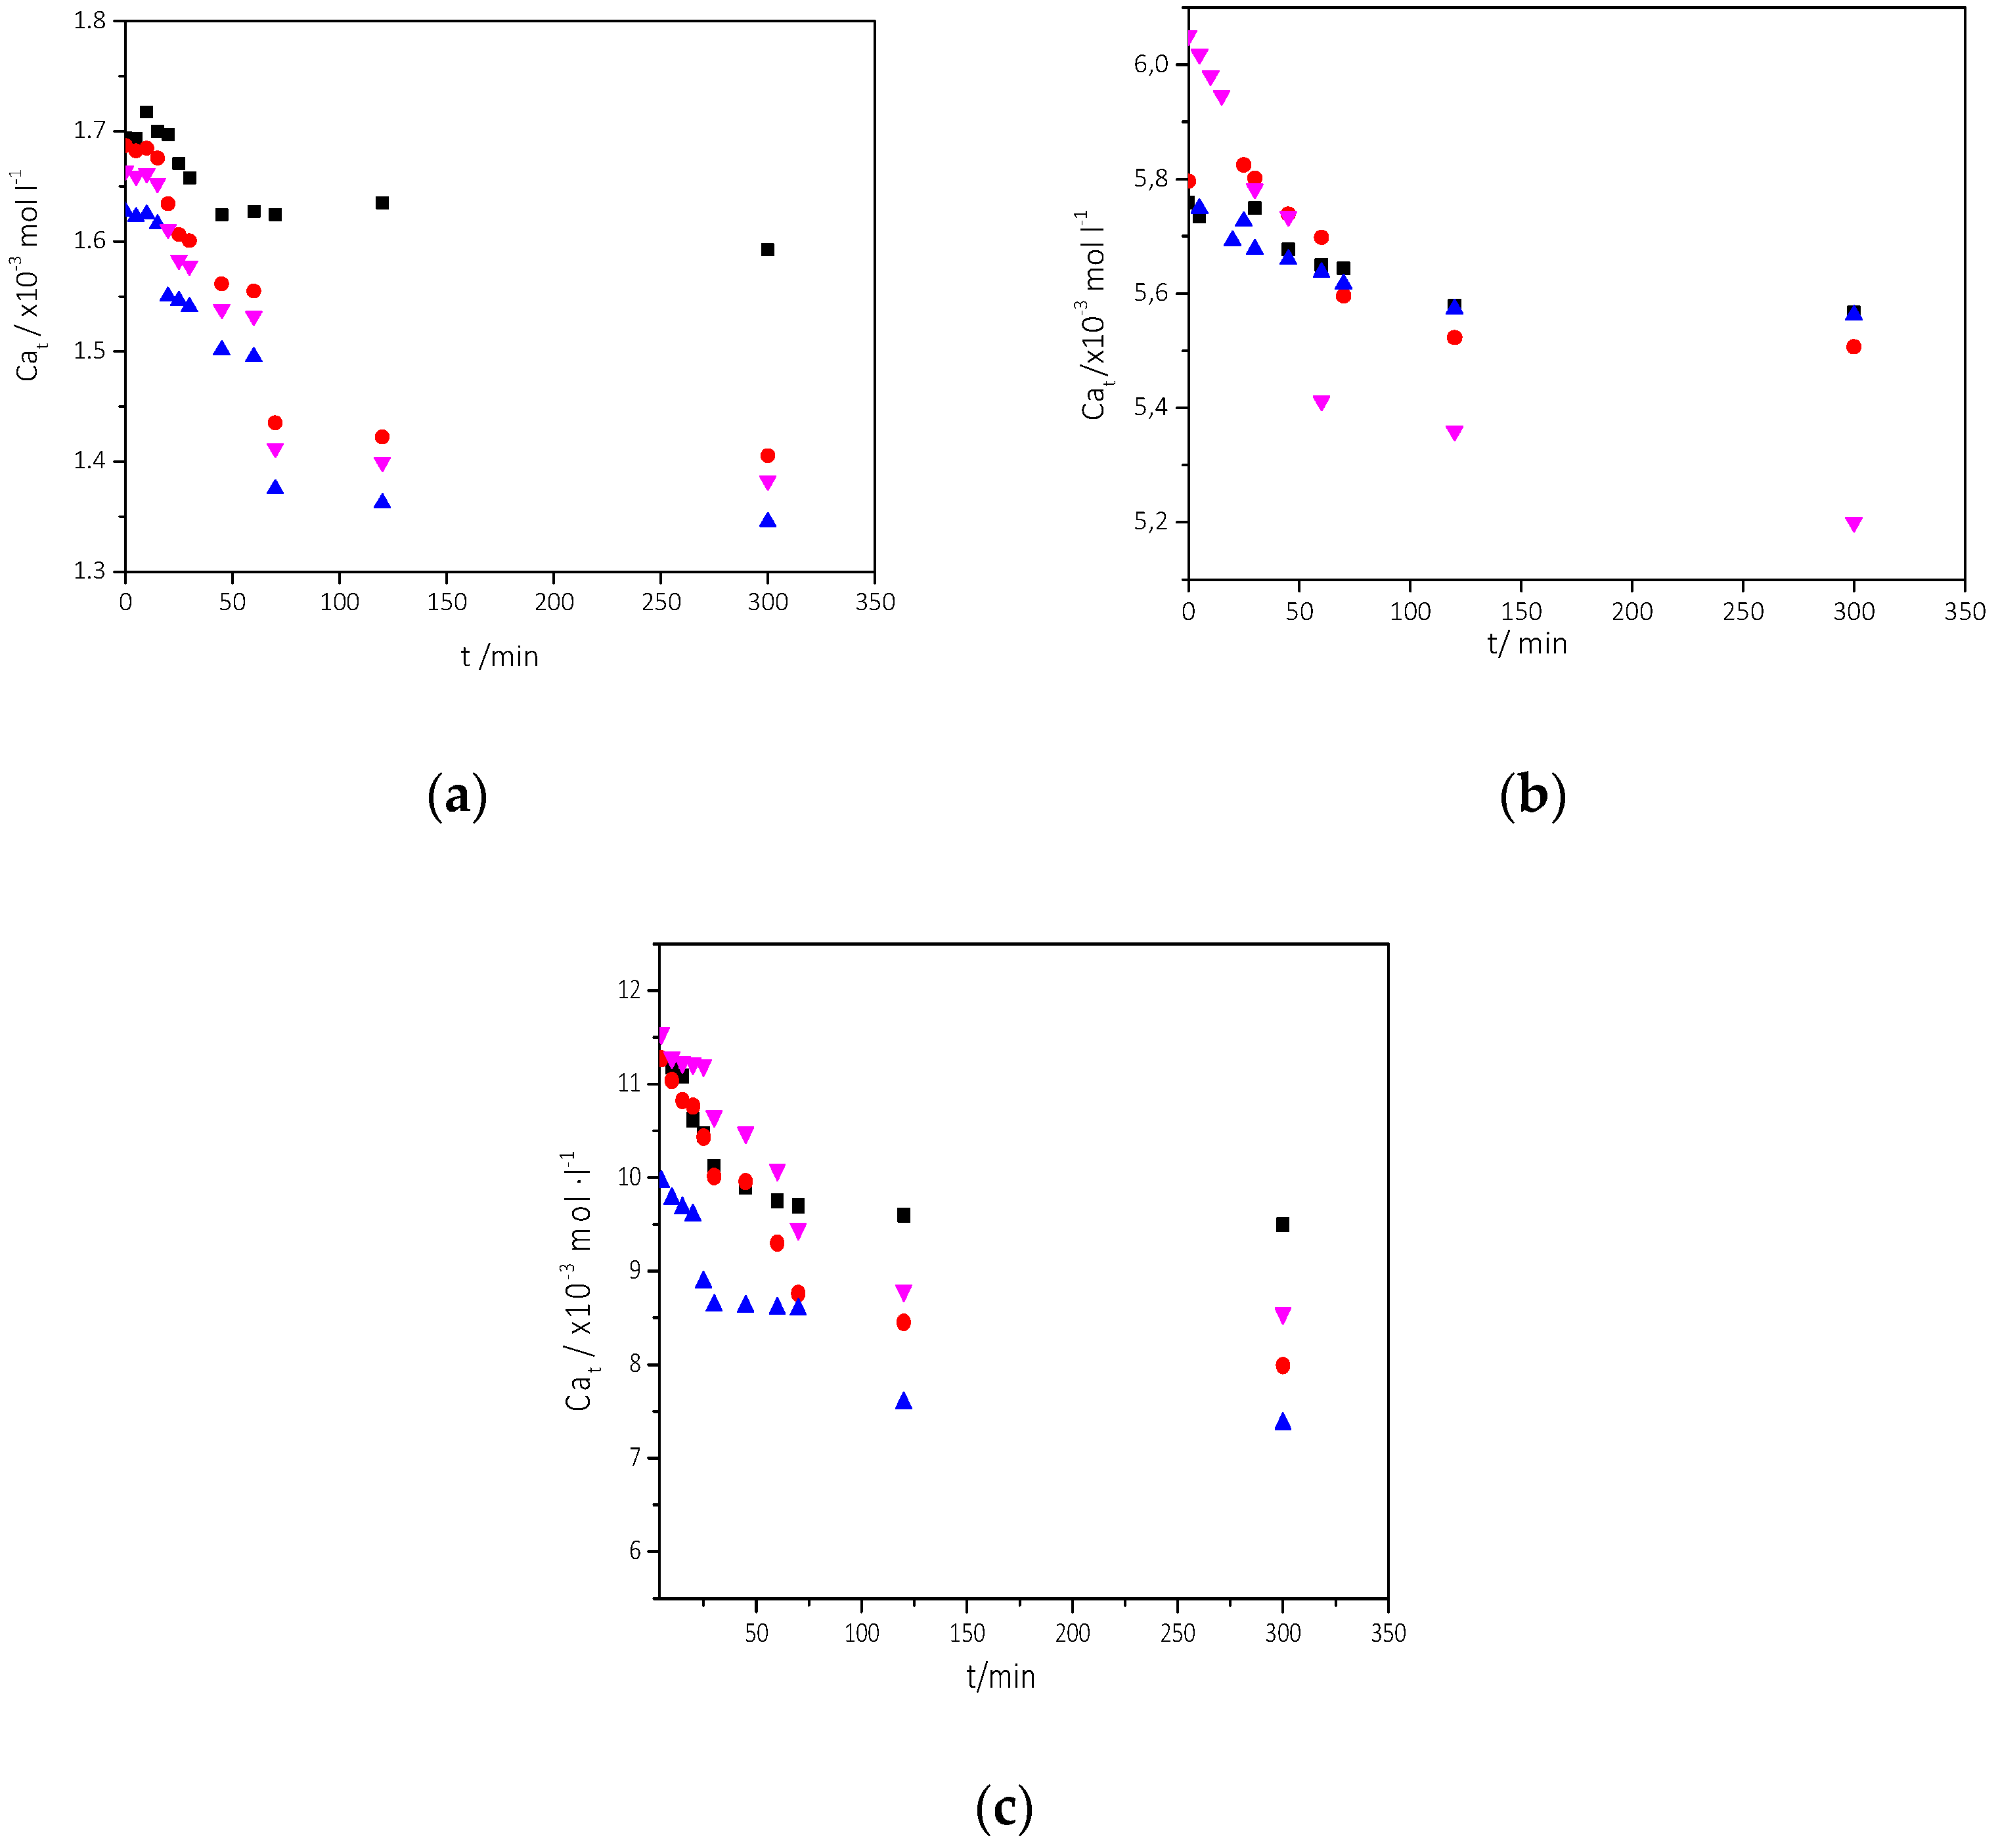
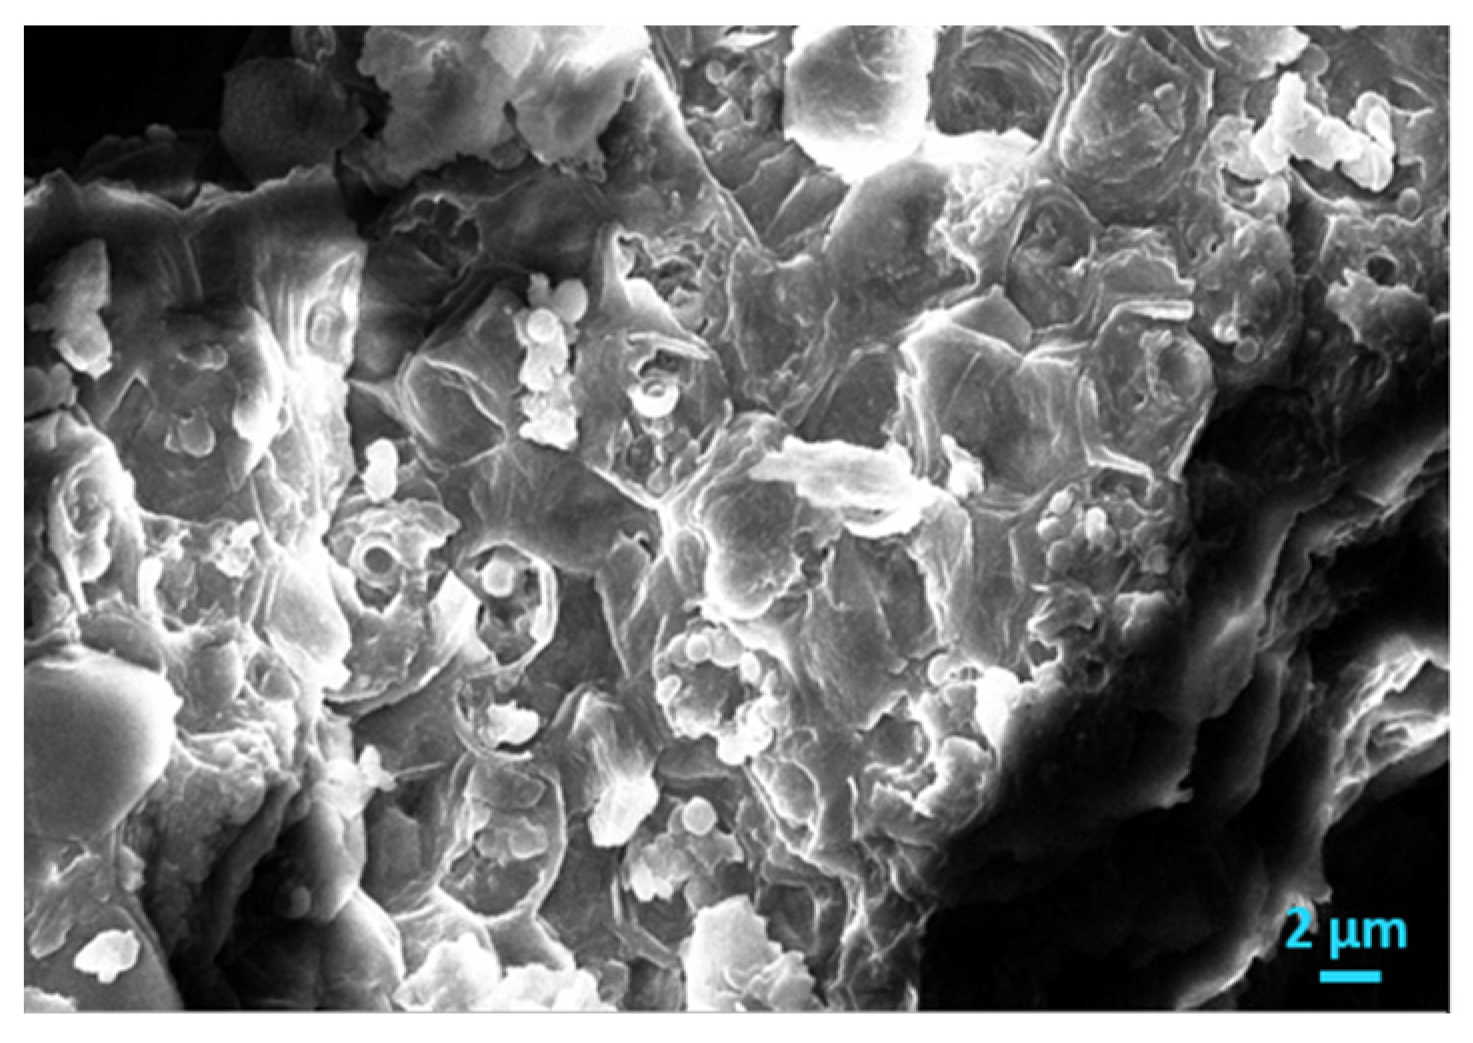
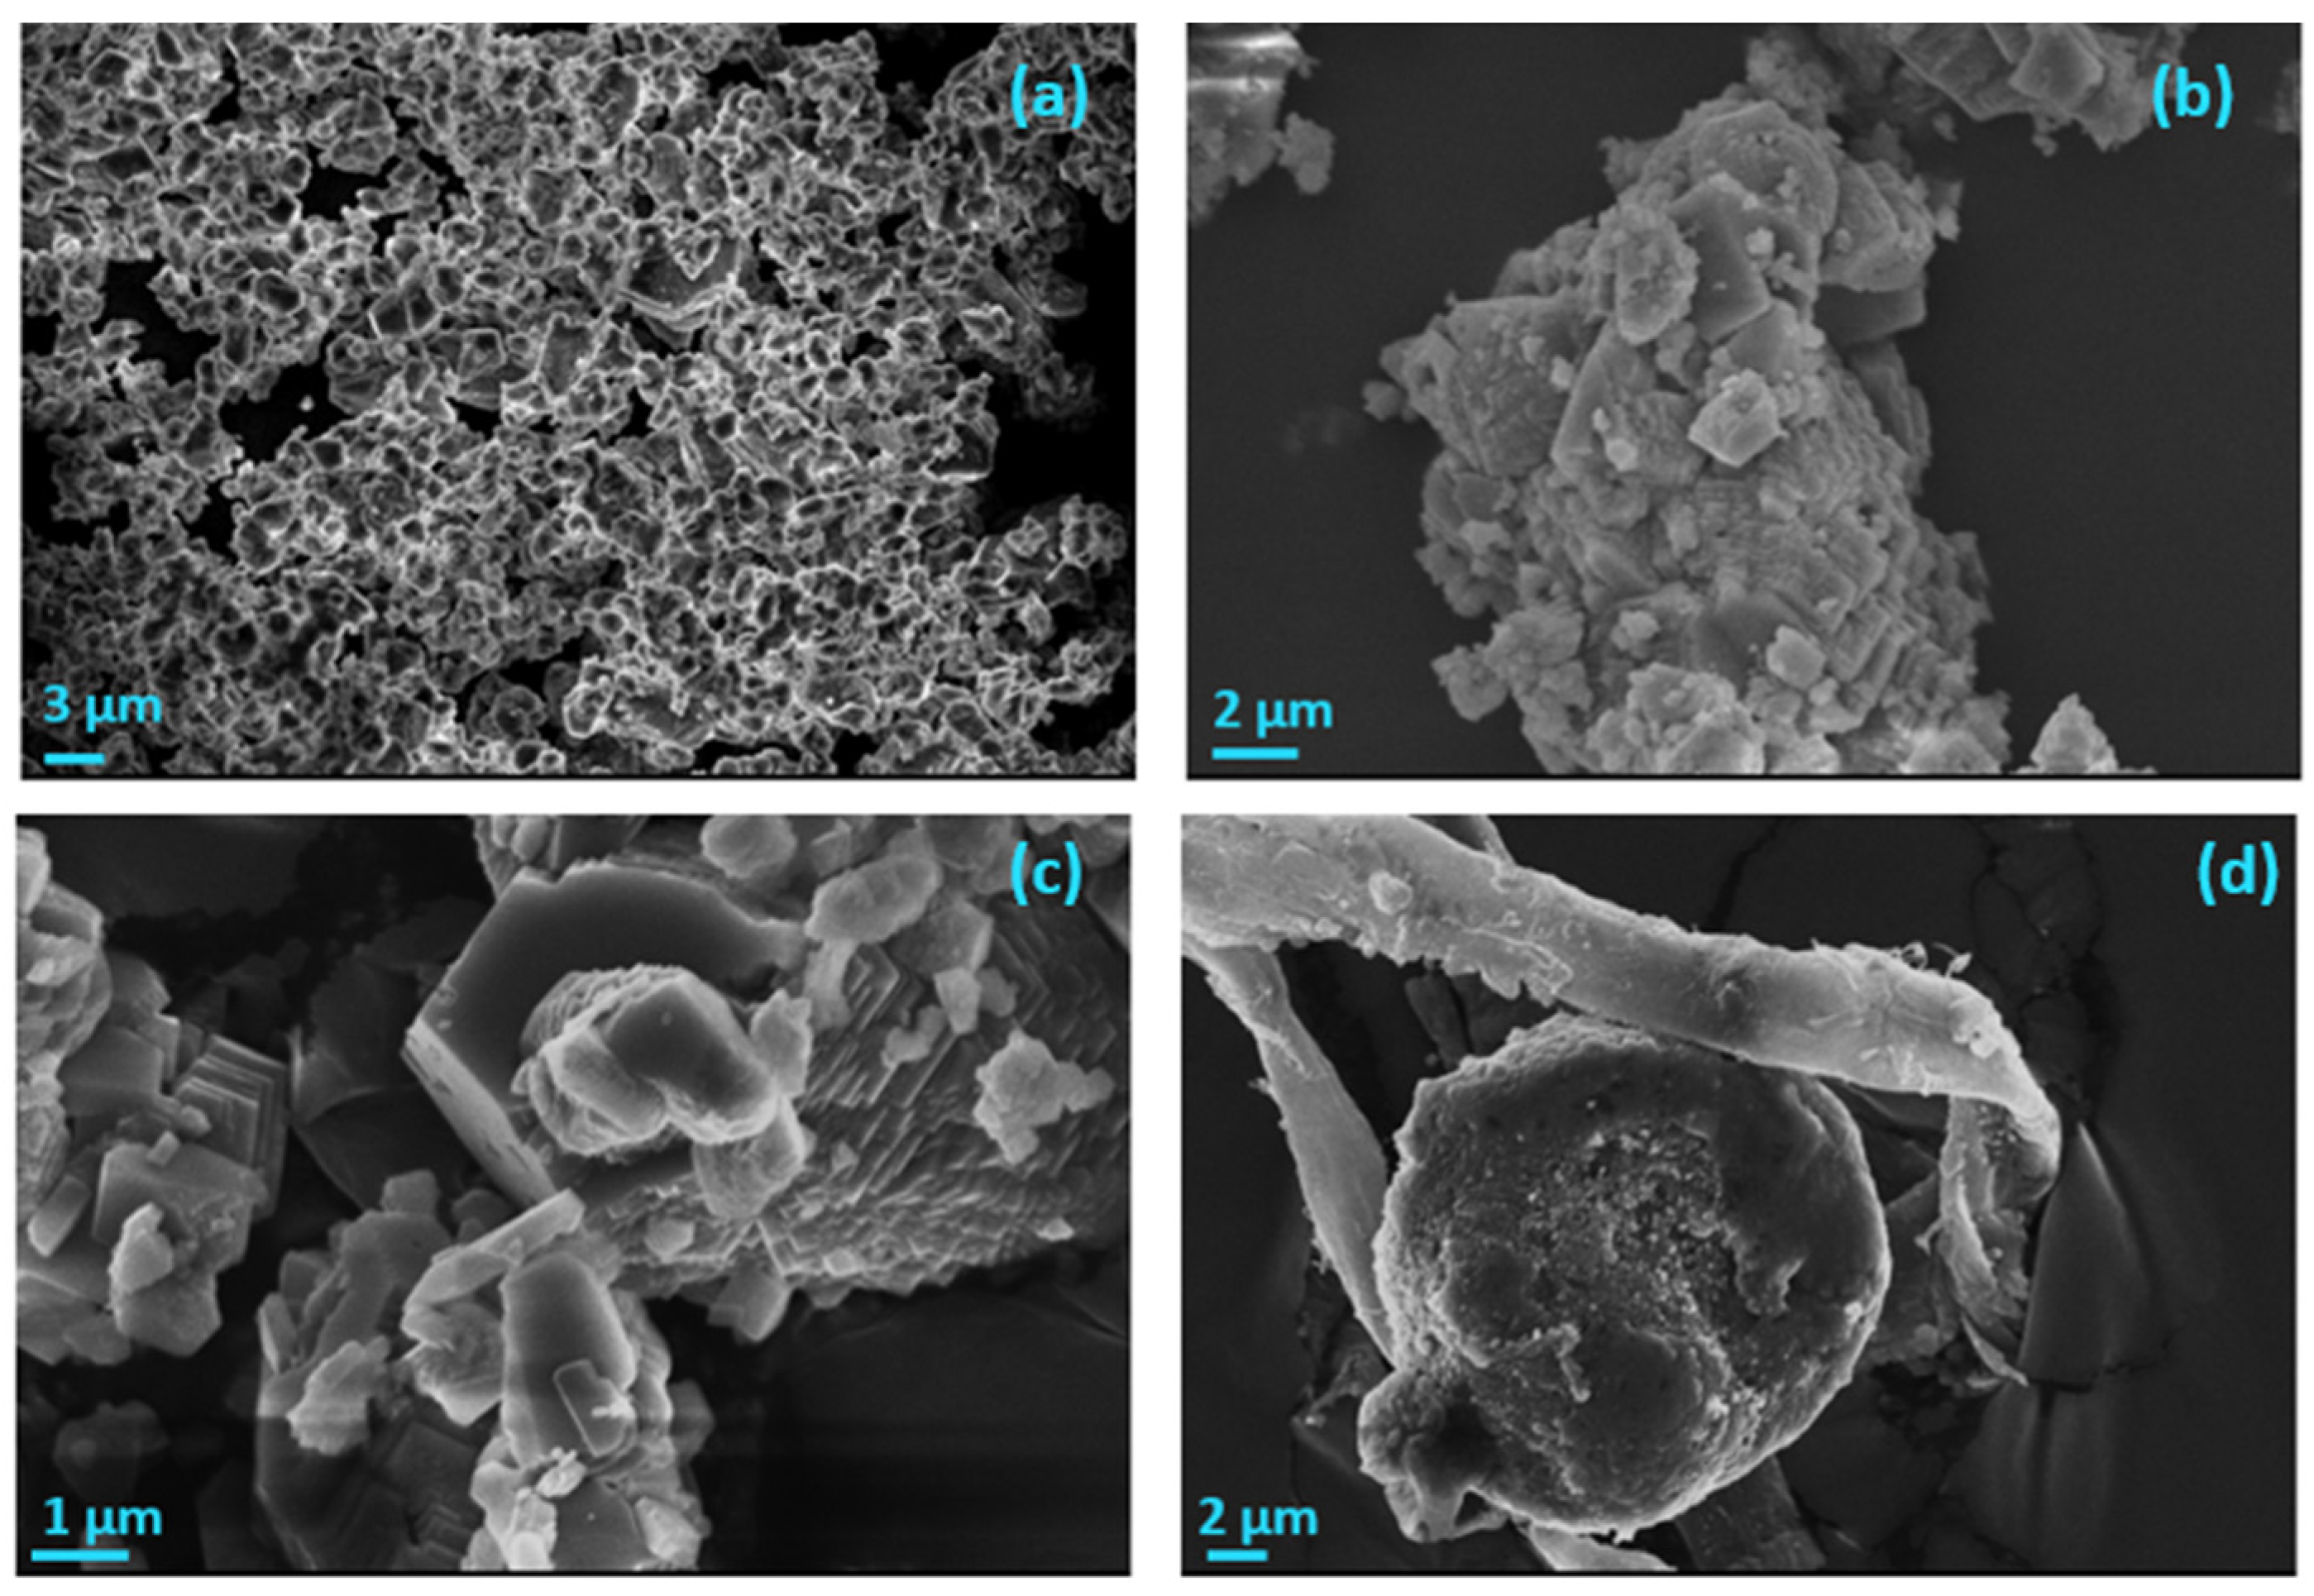
3.3. Precipitation of CaCO3 in Supersaturated Solutions Inoculated with AO Cultures
4. Conclusions
Supplementary Materials
Author Contributions
Funding
Institutional Review Board Statement
Data Availability Statement
Acknowledgments
Conflicts of Interest
References
- Walker, J.; Surman, S.; Jass, J. Industrial Biofouling Detection, Prevention and Control; Wiley: New York, NY, USA, 2000; p. 15. [Google Scholar]
- Fingerman, M.; Nagabhushanam, R.; Thompson, M.F. Recent Advances in Marine Biotechnology; Enfield, N.H., Ed.; Science Publishers, Inc.: Hauppauge, NY, USA, 1999; p. 168. [Google Scholar]
- Donlan, R.M. Biofilms: Microbial Life on Surfaces. Emerg. Infect. Dis. 2002, 8, 883–890. [Google Scholar] [CrossRef]
- Bixler, G.D.; Bhushan, B. Biofouling: Lessons from nature. Phil. Trans. R. Soc. A 2012, 370, 2381–2417. [Google Scholar] [CrossRef]
- Amy, G. Fundamental understanding of organic matter fouling of membranes. Desalination 2008, 231, 44–51. [Google Scholar] [CrossRef]
- Flemming, H.C.; Schaule, G. Biofouling on membranes—A microbiological approach. Desalination 1988, 70, 95–119. [Google Scholar] [CrossRef]
- Bendinger, B.; Rijnaarts, H.H.M.; Altendorf, L.; Zehnder, A.J.B. Physicochemical cell surface and adhesive properties of coryneform bacteria related to the presence and chain length of mycolic acids. Appl. Environ. Microbiol. 1993, 59, 3937–3977. [Google Scholar] [CrossRef] [PubMed]
- Tsuneda, S.; Aikawa, H.; Hayashi, H.; Yuasa, A.; Hirata, A. Extracellular polymeric substances responsible for bacterial adhesion onto solid surface. FEMS Microbiol. Lett. 2003, 223, 287–292. [Google Scholar] [CrossRef]
- Sheng, G.-P.; Yu, H.-Q.; Li, X.-Y. Extracellular polymeric substances (EPS) of microbial aggregates in biological wastewater treatment systems: A review. Biotechnol. Adv. 2010, 28, 882–894. [Google Scholar] [CrossRef]
- Zhu, T.; Dittrich, M. Carbonate Precipitation through Microbial Activities in Natural Environment, and Their Potential in Biotechnology: A Review. Front. Bioeng. Biotechnol. 2016, 4, 4. [Google Scholar] [CrossRef]
- Castro-Alonso, M.J.; Montañez-Hernandez, L.E.; Sanchez-Muñoz, M.A.; Macias Franco, M.R.; Narayanasamy, R.; Balagurusamy, N. Microbially Induced Calcium Carbonate Precipitation (MICP) and Its Potential in Bioconcrete: Microbiological and Molecular Concepts. Front. Mater. Sci. 2019, 6, 126. [Google Scholar] [CrossRef]
- Perito, B.; Mastromei, G. Molecular Basis of Bacterial Calcium Carbonate Precipitation. In Molecular Biomineralization: Aquatic Organisms Forming Extraordinary Materials; Müller, W.E.G., Ed.; Springer: Berlin/Heidelberg, Germany, 2011; pp. 113–139. [Google Scholar]
- Cam, N.; Georgelin, T.; Jaber, M.; Lambert, J.F.; Benzerara, K. In vitro synthesis of amorphous Mg-, Ca-, Sr- and Ba-carbonates: What do we learn about intracellular calcification by cyanobacteria? Geochim. Cosmochim. Acta 2015, 161, 36–49. [Google Scholar] [CrossRef]
- Head, I.M.; Gray, N.D.; Babenzien, H.D.; Oliver-Glöckner, F. Uncultured giant sulfur bacteria of the genus Achromatium. FEMS Microbiol. Ecol. 2000, 33, 171–180. [Google Scholar] [CrossRef] [PubMed]
- Xu, H.; Peng, X.; Bai, S.; Ta, K.; Yang, S.; Liu, S.; Jang, H.B.; Guo, Z. Precipitation of calcium carbonate mineral induced by viral lysis of cyanobacteria: Evidence from laboratory experiments. Biogeosciences 2019, 16, 949–960. [Google Scholar] [CrossRef]
- Beveridge, T.; Murray, R. Uptake and retention of metals by cell walls of Bacillus subtilis. J. Bacteriol. 1976, 127, 1502–1518. [Google Scholar] [CrossRef]
- Dupraz, C.; Reid, R.P.; Braissant, O.; Decho, A.W.; Norman, R.S.; Visscher, P.T. Processes of carbonate precipitation in modern microbial mats. Earth-Sci. Rev. 2009, 96, 141–162. [Google Scholar] [CrossRef]
- Silambarasan, T.S.; Bajwa, K.; Dhandapani, R. Optimization and mass culture of Acutodesmus obliquus RDS01 under open phototrophic pond cultivation for enhancing biodiesel production. Biofuels 2017, 8, 243–252. [Google Scholar] [CrossRef]
- Sarwa, P.; Verma, S.K. Identification and Characterization of Green Microalgae, Scenedesmus sp. MCC26 and Acutodesmus obliquus MCC33 Isolated from Industrial Polluted Site Using Morphological and Molecular Markers. Int. J. Appl. Sci. Biotechnol. 2017, 5, 415–422. [Google Scholar] [CrossRef]
- Andersen, R.A. Algal Culturing Techniques; Elsevier: Cambridge, MA, USA, 2005; ISBN 0-12-088426-7. [Google Scholar]
- Rinanti, A.; Kardena, E.; Astuti, D.I.; Dewi, K. Growth response and chlorophyll content of Scenedesmus obliquus cultivated in different artificial media. Asian J. Environ. Biol. 2013, 1, 1–10. [Google Scholar]
- Abramoff, M.D.; Magalhaes, P.J.; Ram, S.J. Image Processing with ImageJ. Biophotonics Int. 2004, 11, 36–42. [Google Scholar]
- Kenne, G.; van der Merwe, D. Classification of Toxic Cyanobacterial Blooms by Fourier-Transform Infrared Technology (FTIR). Adv. Microbiol. 2013, 3, 37921. [Google Scholar] [CrossRef]
- Chiou, Y.T.; Hsieh, M.L.; Yeh, H.H. Effect of algal extracellular polymer substances on UF membrane fouling. Desalination 2010, 250, 648–652. [Google Scholar] [CrossRef]
- Melcrová, A.; Pokorna, S.; Pullanchery, S.; Kohagen, M.; Jurkiewicz, P.; Hof, M.; Cwiklik, L. The complex nature of calcium cation interactions with phospholipid bilayers. Sci. Rep. 2016, 6, 38035. [Google Scholar] [CrossRef] [PubMed]
- Parkhurst, D.L. User’s Guide to PHREEQC: A Computer Program for Speciation, Reaction-Path, Advective-Transport, and Inverse Geochemical Calculations; Earth Science Information Center, Open-File Reports Section [Distributor]; US Department of the Interior, US Geological Survey: Lakewood, CA, USA; Denver, CO, USA, 1995.
- Amjad, Z.; Koutsoukos, P.; Tomson, M.B.; Nancollas, G.H. The Growth of Hydroxyapatite from Solution A New Constant Composition Method. J. Dent. Res. 1979, 58, 1431–1432. [Google Scholar] [CrossRef]
- Nielsen, A.E. Electrolyte crystal growth mechanisms. J. Cryst. Growth 1984, 67, 289–310. [Google Scholar] [CrossRef]
- Kazmierczak, T.F.; Tomson, M.B.; Nancollas, G.H. Crystal growth of calcium carbonate. A controlled composition kinetic study. J. Phys. Chem. 1982, 86, 103–107. [Google Scholar] [CrossRef]
- Mathur, S.; Agrawa, D.; Jajoo, A. Photosynthesis: Response to high temperature stress. J. Photochem. Photobiol. 2014, 137, 116–126. [Google Scholar] [CrossRef]
- Pearcy, R.W. Acclimation of Photosynthetic and Respiratory Carbon Dioxide Exchange to Growth Temperature in Atriplex lentiformis (Torr.) Wats. Plant Physiol. 1977, 59, 795–799. [Google Scholar] [CrossRef]
- Wang, D.; Li, Y.; Hu, X.; Su, W.; Zhong, M. Combined Enzymatic and Mechanical Cell Disruption and Lipid Extraction of Green Alga Neochloris oleoabundans. Int. J. Mol. Sci. 2015, 16, 7707–7722. [Google Scholar] [CrossRef]
- Jones, B.; Peng, X. Amorphous calcium carbonate associated with biofilms in hot spring deposits. Sediment. Geol. 2012, 269–270, 58–68. [Google Scholar] [CrossRef]
- Borowitzka, M.A.; Larkum, A.W.D.; Nockolds, C.E. A scanning electron microscope study of the structure and organization of the calcium carbonate deposits of algae. Physiologia 1974, 13, 195–203. [Google Scholar] [CrossRef]


| Component | Concentration/mM |
|---|---|
| MgSO4∙7H2O | 0.400 |
| KNO3 | 0.247 |
| NaNO2 | 0.005 |
| H3BO3 | 0.040 |
| FeCl3∙2H2O | 0.006 |
| MgSO4∙7H2O | 0.400 |
| Solution | Cat/×10−3 mol∙L−1 | Supersaturation Ratio, SRcalcite | Relative Supersaturation σcalcite | AO Cell Concentration/×107 cells·L−1 | Precipitation Rate, Rp/×10−7 mol min−1 L−1 |
|---|---|---|---|---|---|
| 1 | 1.7 | 7.94 | 0.68 | 1.26 | 1.4 |
| 2.52 | 3.5 | ||||
| 5.04 | 3.6 | ||||
| 2 | 5.8 | 29.51 | 4.43 | 1.26 | 5.4 |
| 2.52 | 5.5 | ||||
| 5.04 | 6.6 | ||||
| 3 | 11.6 | 104.71 | 9.23 | 1.26 | 26.6 |
| 2.52 | 34.0 | ||||
| 5.04 | 37.3 |
| Cat/×10−3 mol∙L−1 | Relative Supersaturation, σcalcite | Induction Time, tind/min | Precipitation Rate, Rp/×10−7 mol∙min−1∙L−1 |
|---|---|---|---|
| 3.5 | 2.38 | 150 | 0.21 |
| 4.0 | 2.84 | 140 | 0.24 |
| 4.5 | 3.26 | 120 | 1.78 |
| 5.0 | 3.73 | 116 | 8.15 |
| 5.5 | 4.18 | 47 | 27.5 |
| 6.0 | 4.60 | 10 | 79.0 |
| Total Calcium, Cat = Total Carbonate, Ct/×10−3 mol∙L−1 | Relative Supersaturation, σcalcite | Induction Time, tind/min | Precipitation Rate (t→0)/×10−6 mol∙min−1∙L−1∙m−2 |
|---|---|---|---|
| 3.5 | 2.38 | 463 | 1.1 |
| 4.0 | 2.84 | 406 | 2.4 |
| 5.0 | 3.73 | 359 | 3.1 |
| 6.0 | 4.60 | 272 | 5.3 |
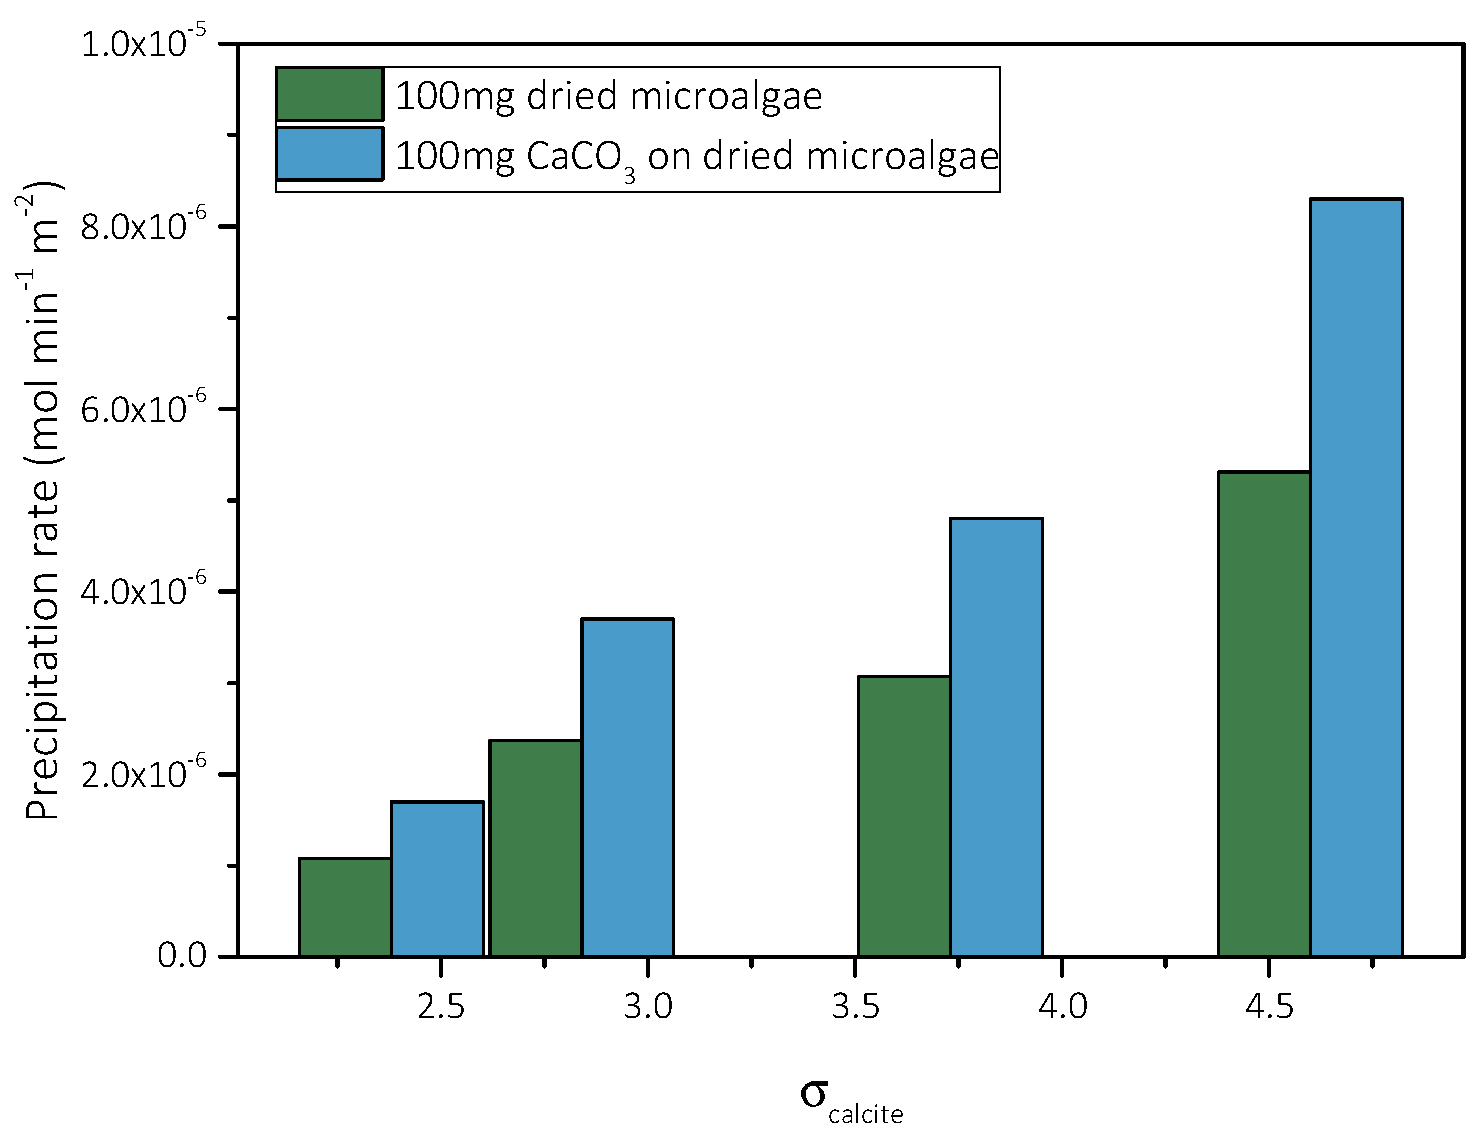
| Total Calcium, Cat = Total Carbonate, Ct/×10−3 mol∙L−1 | Relative Supersaturation, σcalcite | Induction Time, tind/min | Precipitation Rate (t→0)/×10−6 mol∙min−1∙L−1∙m−2 |
|---|---|---|---|
| 3.5 | 2.38 | 435 | 1.7 |
| 4.0 | 2.84 | 385 | 3.7 |
| 5.0 | 3.73 | 242 | 4.8 |
| 6.0 | 4.60 | 208 | 8.3 |
Publisher’s Note: MDPI stays neutral with regard to jurisdictional claims in published maps and institutional affiliations. |
© 2022 by the authors. Licensee MDPI, Basel, Switzerland. This article is an open access article distributed under the terms and conditions of the Creative Commons Attribution (CC BY) license (https://creativecommons.org/licenses/by/4.0/).
Share and Cite
Natsi, P.D.; Koutsoukos, P.G. Calcium Carbonate Mineralization of Microalgae. Biomimetics 2022, 7, 140. https://doi.org/10.3390/biomimetics7040140
Natsi PD, Koutsoukos PG. Calcium Carbonate Mineralization of Microalgae. Biomimetics. 2022; 7(4):140. https://doi.org/10.3390/biomimetics7040140
Chicago/Turabian StyleNatsi, Panagiota D., and Petros G. Koutsoukos. 2022. "Calcium Carbonate Mineralization of Microalgae" Biomimetics 7, no. 4: 140. https://doi.org/10.3390/biomimetics7040140
APA StyleNatsi, P. D., & Koutsoukos, P. G. (2022). Calcium Carbonate Mineralization of Microalgae. Biomimetics, 7(4), 140. https://doi.org/10.3390/biomimetics7040140