Article

A New Framework for Assessment of Offshore Wind Farm Location

1
Institute of Meteorology and Oceanology, National University of Defense Technology, Changsha 410073, China
2
Collaborative Innovation Center on Meteorological Disaster Forecast, Warning and Assessment, Nanjing University of Information Science and Engineering, Nanjing 210044, China
*
Author to whom correspondence should be addressed.
Energies 2022, 15(18), 6758; https://doi.org/10.3390/en15186758
Submission received: 19 August 2022 / Revised: 5 September 2022 / Accepted: 7 September 2022 / Published: 15 September 2022

Abstract

:
Offshore wind energy has become a hot spot in new-energy development due to its abundant reserves, long power generation time, high unit capacity and low land occupation. In response to the current situation whereby wind energy, and natural and human factors have not been taken into account in the selection of sites for offshore wind-energy-resource development in the traditional “21st Century Maritime Silk Road” region, this paper intends to establish a new risk assessment framework that comprehensively considers the influence of wind resources, the natural environment, and the geopolitical and humanistic environment. The rationality of the new index system and weight determination methods are separately investigated. Some interesting results are obtained by comparing the new framework with traditional frameworks. The results show that the Persian Gulf, the Timor Sea in northern Australia, and the northern part of Sri Lanka in southern India are rich in wind-energy resources and have a low overall risk, making them recommended sites. In addition, unlike the results of previous studies, this paper does not recommend the Somali Sea as a priority area for wind-energy siting due to its high geographic humanity risks.

1. Introduction

In 2013, the Chinese government proposed the strategic idea of the 21st Century Maritime Silk Road, which has been tasked with economic prosperity, political stability, diplomatic harmony, ecological improvement, cultural dissemination, and civilizational rebirth, among others. The successful implementation of the 21st Century Maritime Silk Road would not only contribute to the rapid transformation and upgrading of China’s economy and the effective improvement of its ecological environment, but it would also have a significant impact on the creation of a new diplomatic situation in China, the shaping of China’s international image of peaceful development, and the improvement of China’s international discourse. In this context, Chinese firms have expedited their development and increased their investment in nations along the 21st Century Maritime Silk Road [1,2,3,4].
As the countries along the 21st Century Maritime Silk Road are numerous and densely populated, solving the problem of energy supply, especially power security, is an inescapable topic for international investment and construction.
Since the Third Scientific and Technological Revolution, energy has become the lifeblood of a country’s survival. As the limited reserves of fossil fuels are rapidly depleting, the energy crisis is becoming more and more severe, and the energy game is getting more competitive [5].
In addition, population explosion, ecological destruction, and environmental pollution have continued to degrade the Earth’s environment, diminishing the space available for human survival [6]. The dilemma mentioned above has prompted humanity to turn its attention to the field of renewable energy. Renewable energy is gaining more and more attention worldwide because of its sustainable, cost-free, and environmentally friendly characteristics. Among the renewable energy sources, wind energy is one of the most important and potentially valuable [7,8]. The many advantages of abundant reserves, Long power generation time, large individual capacity, and the not taking up of too much land make offshore wind energy a hot spot in new-energy development [9].
Relevant studies have shown that the 21st Century Maritime Silk Road region is rich in wind-energy resources, and the amount of wind-energy resources that can be developed is large. The abundance of wind-energy resources directly influences the choice of sites for wind-energy development. In the early days, the wind-energy distribution was mainly characterized by wind power density alone [10,11]. Zheng has used wind field reanalysis data to develop a wind-energy ranking map covering the global ocean, which provides a good overview of the global distribution of wind-energy resources, but does not integrate the many elements [12]. Gamboa has constructed a reasonable comprehensive evaluation model for the macro siting of wind farms based on the indicator system. The model uses the social multi-criterium evaluation method, which integrates well many factors in the socio-economy into one framework to obtain the assessment results for the siting of wind-energy-resource development and does not take into account the wind-energy-resource element in the construction of wind farms [13]. It can be seen that the research studies mentioned above on wind-energy-resource development and site selection frequently focus on a single factor involved in the construction process of wind power plants, mainly on the climatic distribution characteristics of wind energy and the socio-economic impact of wind-power-plant site selection, and do not take into account the actual investment and construction process involving wind-energy resources, construction costs, construction difficulties, and other comprehensive wind-energy resources and socio-economic issues and cannot provide a comprehensive scientific basis for siting wind-energy development. In addition, Yeh has selected environmental, policy, and economic indicators, but the selection of indicators is still not comprehensive. He used Decision Making Trial and Evaluation Laboratory (DEMATEL) and the Analytic Network Process (ANP) to determine the weights of the indicators. He applied them to the macro siting of wind farms [14]. The assessment methods described above perform the risk assessment exercise to some extent. However, determining the impact of elements through subjective methods alone weakens the data themselves and lacks a degree of objectivity.
Therefore, there is still potential for improvement of research conducted so far. (1) The evaluation index system is not comprehensive enough to take into account the many factors involved in the construction of wind farms. In particular, the location of wind-energy resources for the 21st Century Maritime Silk Road needs to take into account not only the availability of wind-energy resources but also the impact of the natural environment in terms of temperature, the geological structure of the seabed, water depth, distance from the shore, and many other factors, such as the political instability, cultural level, and industrialization level of the countries along the route of investment and construction. (2) Most of them are simple lists of the characteristics of wind-energy elements, without an organic integration of the elements to form a hierarchy. (3) The model evaluation and decision making are relatively single-minded. (4) The model is too subjective and relies too much on expert experience, which has an impact on the accuracy of the assessment results.
The main contributions of this paper are, therefore, as follows:
(1)
The influence of geo-humanities is considered in assessing wind-energy resources, and a comprehensive, reasonable, mutually independent risk indicator system for wind-energy resources is constructed;
(2)
The impact of different weighting methods on the wind-energy-resource assessment results is explored, and the influence of subjective knowledge based on experts and objective laws based on data on the weighting of the index system are comprehensively evaluated;
(3)
The differences among the results of comprehensive wind-resource risk zoning, the results of wind-energy-resource risk zoning that only considers the influence of the natural environment, and the results of zoning that only considers geo-human influences are compared, and new conclusions are obtained.
This study makes full use of the previous research results to sort out the concerns and research progress of wind-energy site selection. Additionally, we integrate a series of complex characteristics of wind energy, quantitatively present the value of wind-energy development in the 21st Century Maritime Silk Road, and form a convenient and easy-to-use wind-energy-development risk classification map to facilitate wind-energy development in the 21st Century Maritime Silk Road.

2. Index Selection and Data Sources

2.1. Wind-Energy-Resource Assessment Index System

In this study, after a systematic analysis of the various factors affecting the siting of wind-energy-resource development, evaluation indicators such as wind-energy-resource situation, construction and maintenance costs, construction and maintenance difficulties, and policy security were specified and refined, and a series of evaluation indicators were selected. As mentioned in the introduction part, the above studies show that wind power density, the frequency of effective wind speed, energy-level frequencies above 200W·m−2, the coefficient of variation in WPD, the effective reserves of WPD, and extreme wind speed are usually used to characterize wind-energy resources. Therefore, these factors are preliminarily incorporated into the wind-energy-resource assessment index system.
Data source and profile: ERA5 sea surface 10 m in-analysis wind field information for 2001–2020, 6 h by 6 h, with a spatial resolution of 0.25° × 0.25°, was used to calculate the corresponding results according to the calculation method of each indicator [10,15].

2.1.1. Wind Power Density (WPD)

WPD is defined as the power of the wind per unit cross-section perpendicular to the airflow and is calculated as:
WPD = 1 2 ρ V 3
where WPD is in W / m 2 ; ρ is the air density, which may be taken as 1.225 kg / m 3 ; and V is the wind speed in m / s [16,17].

2.1.2. Frequency of Effective Wind Speed (EWSO)

In the process of wind-energy development, wind speeds between 5 and 25 m/s are generally considered conducive to the capture and conversion of wind-energy resources, and the wind speed in this range is defined as the effective wind speed. The frequency of effective wind speed reflects the availability of wind energy [15].

2.1.3. Energy-Level Frequencies above 200W·m−2 (RLO)

In wind-energy development, a wind-energy density of 200 W/m2 or more is generally considered an abundant resource. The frequency of energy levels reflects the level of wind-energy enrichment [15].

2.1.4. Coefficient of Variation in WPD (Cv)

The stability of the resource is closely related to the capture and conversion efficiency of the installation, the life of the installation, etc. When the energy flow density varies considerably, it reduces the output power. It may also cause extreme loads (causing oscillations and uneven loads in the wind-energy conversion system), ultimately weakening and damaging the wind turbine. For this reason, the coefficient of variation, Cv, is introduced. Cv mainly reflects the stability of the resource on the monthly scale; the smaller the value, the better the stability on the monthly scale.
The coefficient of variation is calculated using the formula:
C v = S X ¯
S = i = 1 n x i 2 ( i = 1 n x i ) 2 / n n 1
where C v is the coefficient of variation, S is the standard deviation of the series (unbiased estimate) and X ¯ is the series mean.

2.1.5. Effective Reserves of WPD (ER)

The effective storage capacity is closely related to the output of wind energy. It is the product of the annual average wind-energy flow density and the number of wind speed hours available throughout the year or the product of the total storage capacity and the frequency of available wind speed, which is a practical guide to wind-energy development:
E P E = P ¯ * H E
where P ¯ is the average value of wind power density (when calculating annual resource storage, P ¯ is the average value of annual average wind power density) and H E is the number of hours when effective wind speed occurs [18].

2.1.6. Extreme Wind Speed (EWS)

x p = ( φ C ^ v + 1 ) x ¯
C ^ v = 1 n 1 i = 1 n ( x i x ¯ ) 2 x ¯
where x p is the desired multi-year extreme value. x ¯ is the mean value, φ is the coefficient of deviation mean and P is the design frequency in Table 1 [19,20].

2.2. Natural Environment Assessment Index System

2.2.1. Two-Meter Temperature (T2m)

Low temperatures in the target area pose significant challenges for offshore construction, personnel safety, and wind-energy equipment. Two-meter air temperature data were also derived from ERA5 high-precision reanalysis data with a spatial resolution of 0.25° × 0.25°.

2.2.2. Water Depth (WD)

This indicator is closely related to the cost and difficulty of offshore construction and the difficulty of grid connection for power generation. It is one of the most significant concerns for wind-energy development. As the resolution in this study was 0.25° × 0.25°, the bathymetry data were used instead of using the more accurate ETOP5 data. Instead, ETOP1 data were used with a spatial resolution of 0.0167° × 0.0167° and interpolated to 0.25° × 0.25°.

2.2.3. Offshore Distance (DC)

The relationship among offshore distances, the expense and difficulty of offshore construction, and the difficulties of grid connection for power generation is close. With the rapid advancement of observational equipment, it is now possible to determine offshore distances using high-resolution coastline data (0.1 km) from the GSHHS (Global Self-consistent Hierarchical High-resolution Shoreline) database.

2.3. Geopolitical Human Assessment Indicators (ICRG)

The measurement of country risk is complex but can be compared across countries by relying on country risk ratings from relevant international agencies. In this paper, the country risk ratings published by the international country risk guide (ICRG) of the US-based PRS Group are used as a proxy for country risk assessment based on multi-attribute decision making.
The ICRG classifies country risk into three elements of risk: political risk (PR), economic risk (ER), and financial risk (FR), where political risk is weighted with 12 indicators, and economic risk and financial risk are each weighted with 5 indicators. The final composite risk (CR) is obtained by weighing 12 political and 5 economic and financial risk indicators.
This paper used comprehensive risk data covering the period of 2001–2020 for each country as indicators for geo-humanistic assessment. Based on the ICRG dataset, Ukwueze has examined the impact of political factors on international aid and recommends that donors consider politics when donating [21]. Based on the ICRG dataset, Javaid has examined the impact of political factors on climate change and has concluded that improving political quality is effective in reducing climate risk [22].
Used by institutional investors, banks, multinationals, importers, exporters, foreign exchange dealers, shipping companies, and many others, the ICRG model is widely used in a variety of country-risk-related studies and has a high degree of credibility [23,24].

2.4. Comprehensive Risk Assessment System

After identifying the influencing factors for wind-farm siting and considering a large number of influencing factors, a 3-tier decision framework for wind-farm siting was established to facilitate the selection of the optimal solution: the target layer, the decision layer, and the influence layer. The decision quasi-measurement layer includes two decision criteria, namely, wind-energy resources and the natural environment. The influencing factors included in each decision criterion are shown in Table 2.
The criteria are the greater the value of the indicator, the lower the expectation of wind-energy development. In practice, the wind field reanalysis data of ERA5 with a spatial resolution of 0.25° × 0.25° for the period January 2001 to December 2020 were used to calculate the 6 h WPD in combination with the WPD calculation method, and the monthly average WPD was calculated based on GSHHS shoreline data and ETOP1 bathymetry data. WPD, EWSO, RLO, WD, DC, EWS, etc.
There are two main trends in the development of offshore wind projects: one is increasing offshore distance; the other is increasing power. As water depth conditions affect the operating costs of wind farms, current development experience shows that water depths of around 20 m have a low impact on wind farms and are used as the optimal linguistic variable (very shallow), with water depths of 100 m or more selected as the worst linguistic variable (very deep). Similarly, according to each of the references mentioned above, the data dispersion criteria were established, and the indicator set was processed in conjunction with engineering practice, as shown in Table 3.

3. Methods

In this paper, based on the comprehensive evaluation index system of the wind-energy development value of the 21st Century Maritime Silk Road, which takes into account wind-energy-resource factors, natural environment factors, and geo-human factors, a comprehensive weighting method combining the CRITIC method and hierarchical analysis was used to determine the weights of each index. The TOPSIS method established a site selection model for wind-energy development in the 21st Century Maritime Silk Road region.

3.1. Data Analysis and Processing

In this paper, the discrete data for the above indicators were normalized before the indicators were weighted and subsequently assessed.
It is worth noting that, according to the United Nations Convention on the Law of the Sea [25,26], coastal states have significant access to their EEZs for resource maintenance and jurisdiction. Therefore, this study determines the geo-humanistic integrated risk values for the 21st Century Maritime Silk Road region based on the global maritime economic exclusive zone boundary data provided by the IHO and the ICRG integrated risk data.
Figure 1 shows the technical approach of this paper.

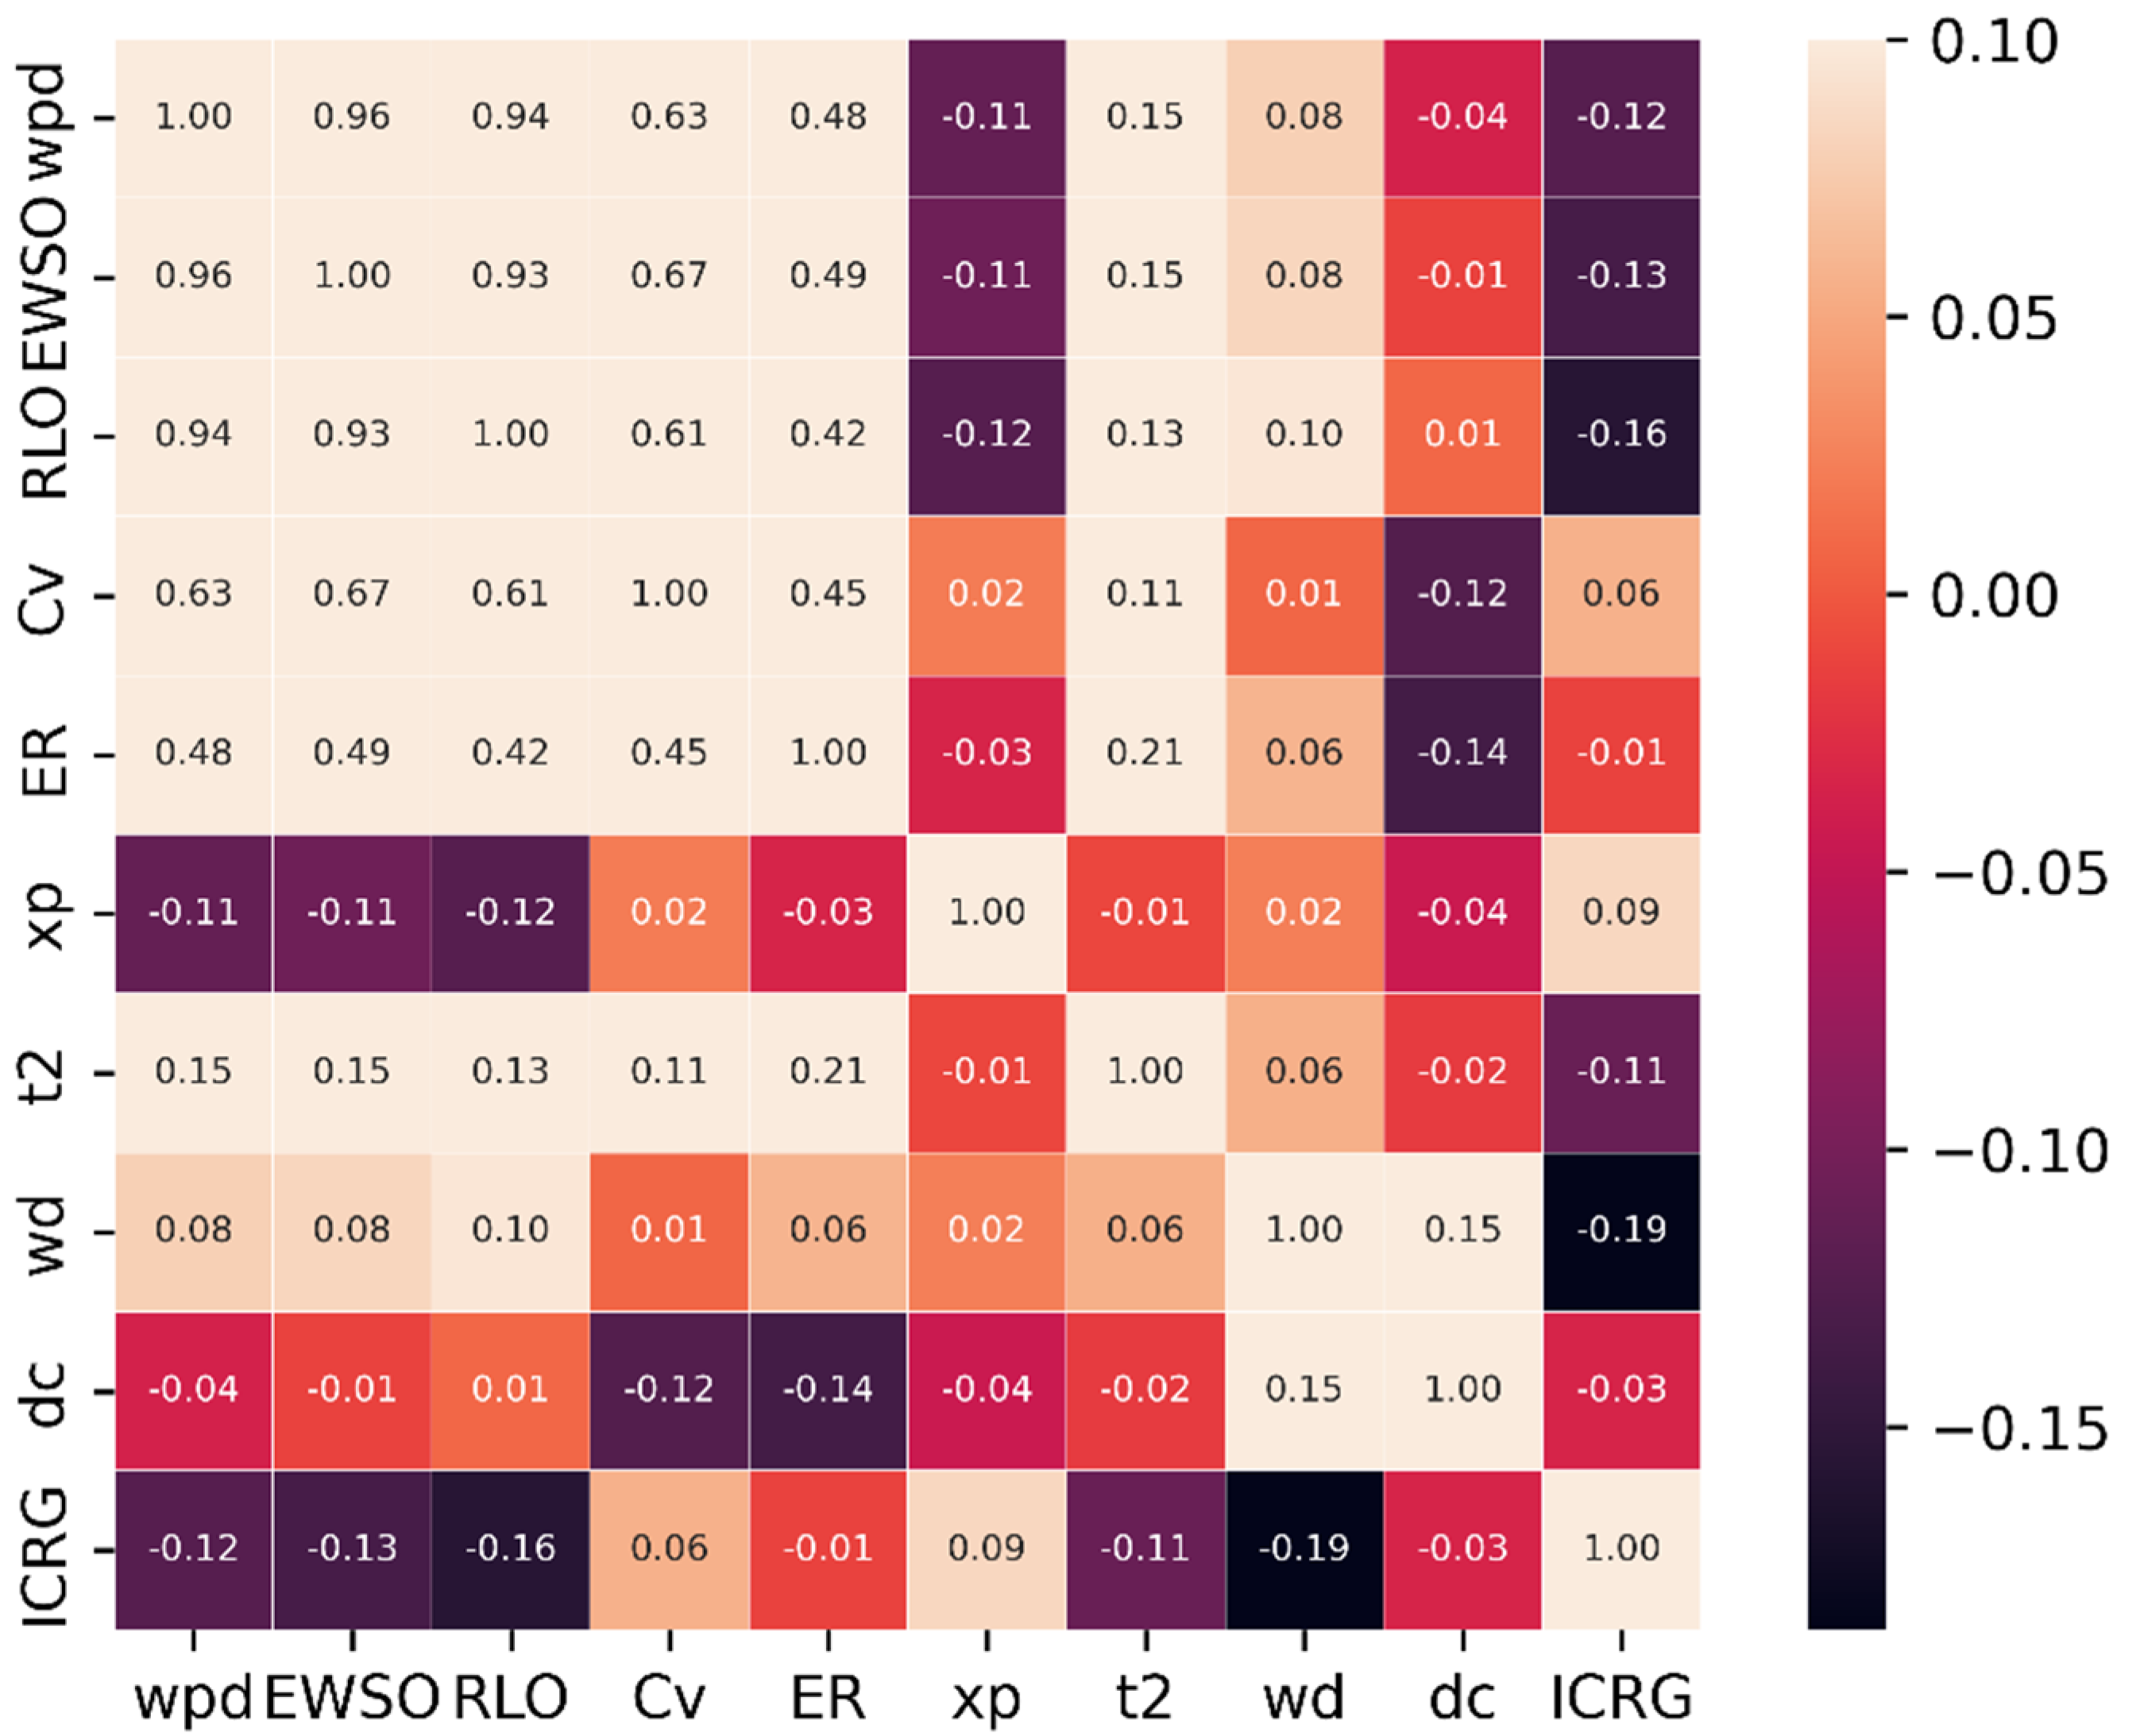
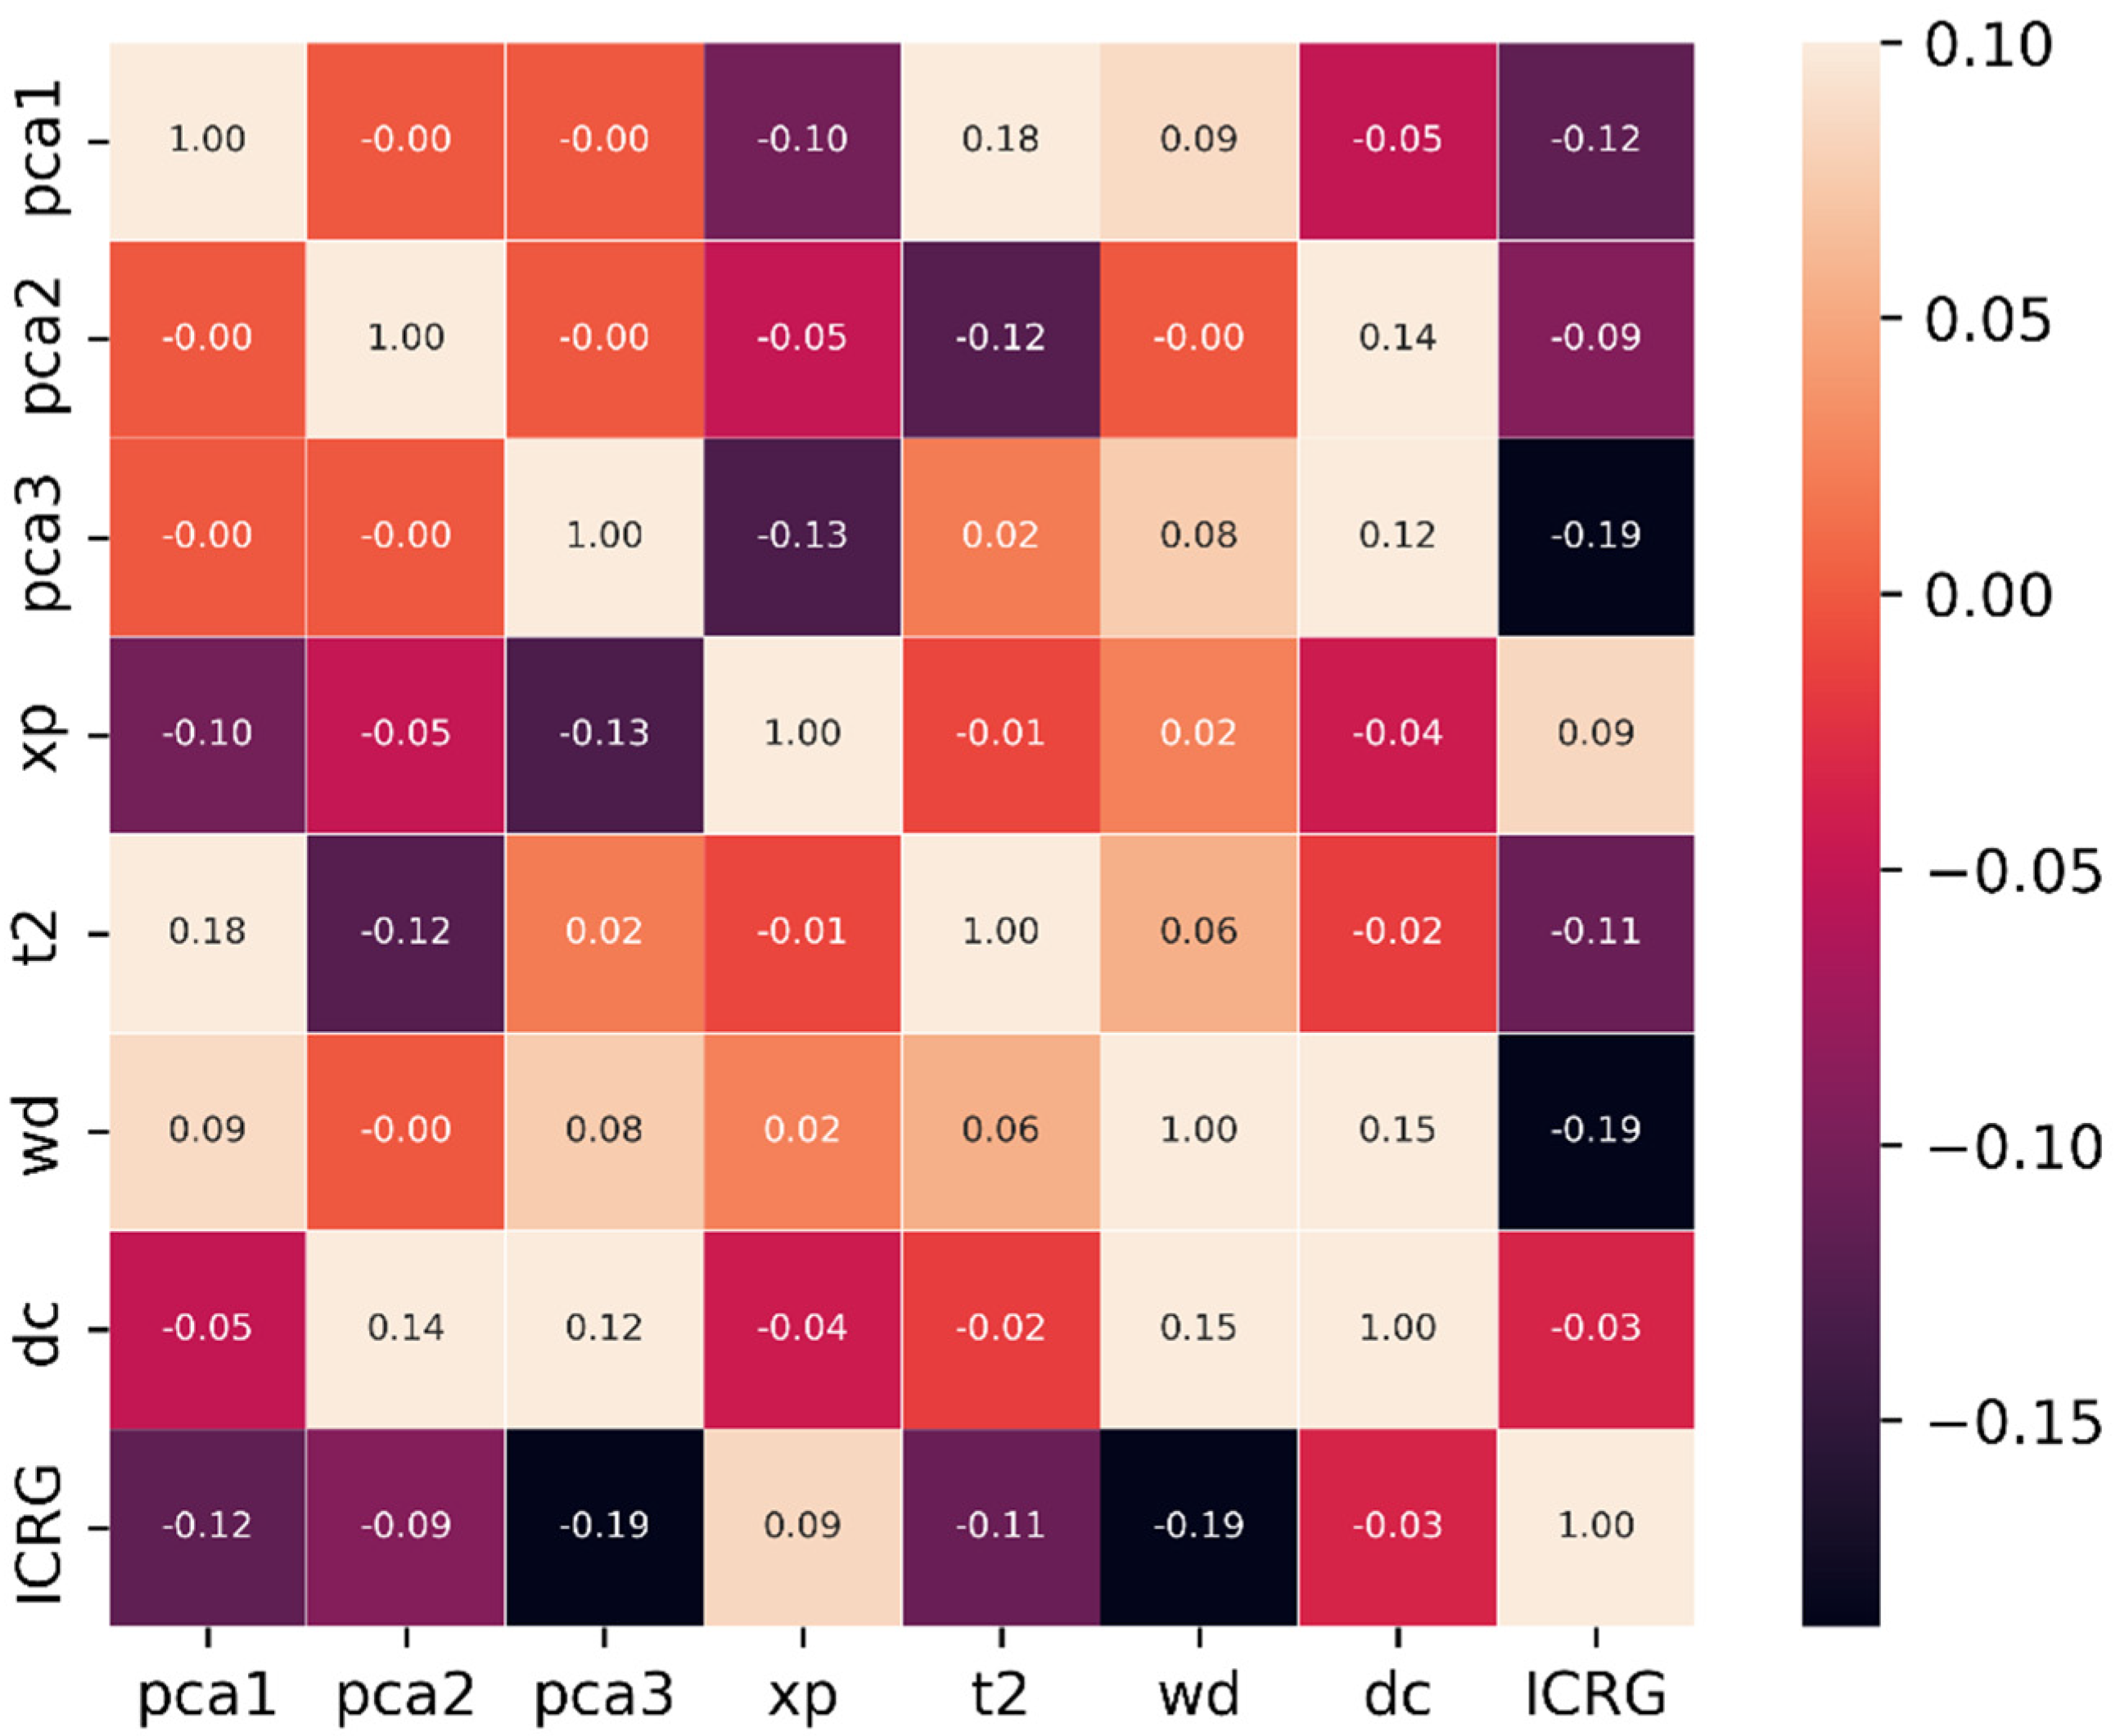
3.1.1. Correlation Analysis

The process of measuring the strength of a linear correlation between things or variables and expressing it in terms of appropriate statistical indicators is called correlation analysis. It is a standard statistical method for studying the closeness of variables.

3.1.2. Principal Component Analysis

Principal component analysis (PCA) is an unsupervised dimensionality reduction method that analyzes the main components of the data and compresses and simplifies them. The method allows a smaller number of indicators to be uncorrelated with each other while providing most of the information of the original indicators [27,28].

3.2. Indicator Weights

At present, according to the different sources of the original data in calculating the weights, the methods of determining the weights of the indicator system can generally be divided into two categories: subjective and objective. In objective weighting methods, the original data for calculating the weights are obtained from the actual data of each measurement index in the evaluation process; some examples are the mean square difference method, the principal component analysis method, the entropy weighting method, the representative calculation method, etc. In subjective weighting methods, the original data for calculating the weights are mainly obtained by experts based on their subjective judgment; some examples are the subjective weighting method, the expert survey method, the hierarchical analysis method, the comparative weighting method, the multivariate analysis method, the fuzzy statistics method, etc. These two types of methods have their own advantages and disadvantages. The subjective weighting methods are less objective but more explanatory. The weights determined using objective weighting methods are more accurate in most cases. However, sometimes they are contrary to the actual situation, and it is not easy to clearly explain the results obtained. This paper combined the subjective and objective assignment methods to determine the final combined weight values.

3.2.1. Entropy Weight

The entropy weight method is a type of objective weighting method that determines the weight of an indicator based on its inherent information, which eliminates human interference and makes the results more factual. The entropy weight method has a certain degree of accuracy and is more adaptable than the subjective method of hierarchical analysis. In information theory, Shannon’s entropy can be used to determine the degree of disorder and its utility in the information of a system. The lower the entropy value, the less disorderly the system is. The entropy weight method is an objective method for determining the weight of an indicator based on the amount of information and is an objective method for fixing weights [29,30].
The formula for calculating entropy in the entropy weight method was proposed by information scientist Shannon [31]:
H j = i = 1 m f i ln f i

3.2.2. CRITIC

The CRITIC method is an objective weighting method. It is the objective weighting of indicators based on the comparative strength of the indicators and the conflict between them. It considers the correlation between indicators while considering the variability of the indicators, not the rule whereby the larger the number is, the more critical it is; furthermore, it uses the objective properties of the data themselves for scientific evaluation [32].

3.2.3. Analytic Hierarchy Process

The Analytic Hierarchy Process (AHP) is a multi-criteria decision-making method combining qualitative and quantitative analyses, which mathematizes people’s thinking process about complex systems, quantifies the qualitative analysis based on human subjective judgments, and numerically sizes the differences between various judgment elements; it is a widely used subjective weighting method [33,34,35].

3.3. Comprehensive Assessment Method

Technique for Order Preference by Similarity to Ideal Solution (TOPSIS) is a systematic evaluation method for multi-indicator, multi-option decision analysis. It is used to rank multiple decision options by constructing positive ideal solutions and negative ideal solutions [36,37,38].
(1)
Construct a decision weighting matrix.
We multiply each indicator weight W with normalized matrix V to obtain the decision weighting matrix:
R = ( r i j ) m × n
r i j = w j v i j , i = 1 , 2 , , m ; j = 1 , 2 , , n
(2)
Calculate the positive ideal solution and the negative ideal solution.
Because the results of the TOPSIS method are influenced by the size of the positive and negative ideal solutions and this section aims to carry out assessments in different contexts at different times, we need to select appropriate positive and negative ideal solutions in order to allow longitudinal comparisons to be drawn:
S j + = max 1 i m { r i j } , j = 1 , 2 , , n
S j = min 1 i m { r i j } , j = 1 , 2 , , n
(3)
Calculate the distance of each scenario from the positive ideal solution and the negative ideal solution.
In the calculation, the Euclidean distance is used:
S d j + = j = 1 n ( S j + r i j ) 2 , i = 1 , 2 , , m
S d j = j = 1 n ( S j r i j ) 2 , i = 1 , 2 , , m
(4)
Calculate the nearness degree.
The relative closeness of each scenario to the positive ideal solution is given by:
η i = S d j S d j + + S d j , i = 1 , 2 , , m
Here, our positive ideal solution refers to the wind-energy resources, physical geography, and geo-human elements that are the most favorable for wind-farm siting, so that the greater the relative proximity, the lower the risk of siting a wind farm in the sea there. The thresholds for defining risk partitioning here are shown in Table 4.

4. Results and Discussion

4.1. Index System Establishment and Rationality Analysis

Due to the large number of indicators involved in this study, the above indicators were initially selected based on expert knowledge and experience. However, we found through the correlation analysis that there was a specific relationship among these indicators, as shown by the high correlation among the WPD, EWSO, RLO, Cv, and ER indicators and the low correlation of the remaining part of the indicators. The heat map of the correlation coefficients is shown in Figure 2.
The results of the correlation analysis above reflected the high correlation among the WPD, EWSO, RLO, Cv, and ER indicators. This had a more significant impact on the construction of the indicator system.
Therefore, in this study, the factors with high correlation were reduced in dimensionality through principal component analysis to obtain a more reasonable indicator system. We set the cumulative contribution rate of principal components at 95%. Finally, the five highly correlated factors were reduced to three elements. These three elements constituted the new wind-energy-resource indicator section.
Then, we conducted a correlation analysis on all indicators after the principal component analysis. We found that the correlation coefficients among indicators were all lower than 0.2, which met the independence requirement among indicators, as is shown in Figure 3.

4.2. Weight Determination and Rationality Analysis

4.2.1. Comparison of Weight Results

In this part, we compared the influence of three different subjective and objective weighting methods on the results, as shown in Figure 4.
Figure 4a shows the results of the entropy weight method risk zoning, and it could be seen that large areas of distant waters had extremely high-risk values, while offshore areas had very low-risk values. This is mainly due to the fact that the entropy weighting method relies on the dispersion of the data themselves. When the entropy weighting is carried out then, the phenomenon of larger WD weights occurs, which significantly differs from the actual situation. Therefore, the weight method was not applicable to this study.
Figure 4b shows a map of the CRITIC method of risk zoning. It could be seen that large areas of the high seas had high-risk values, while some areas rich in wind-energy resources and with low geo-human risks had lower risks, which was somewhat similar to the actual situation. Therefore, the method could be applied in this study.
Figure 4c shows the results of the Analytic Hierarchy Process risk classification. The Analytic Hierarchy Process method applies experts’ empirical knowledge to set up the indicator system, which effectively combines qualitative and quantitative analysis and has a certain degree of reference. As this study involved multiple indicators and multiple scenarios, the method was somewhat informative for this study.

4.2.2. General Weight

The CRITIC method and the Analytic Hierarchy Process method gave the weighting results for each indicator from objective and subjective perspectives, respectively, and were more in line with the actual situation.
Therefore, this study used the CRITIC method combined with the Analytic Hierarchy Process method for the comprehensive weights.
Table 5 shows the entropy weighting method, the CRITIC method, the Analytic Hierarchy Process method, and the combined weighting results.

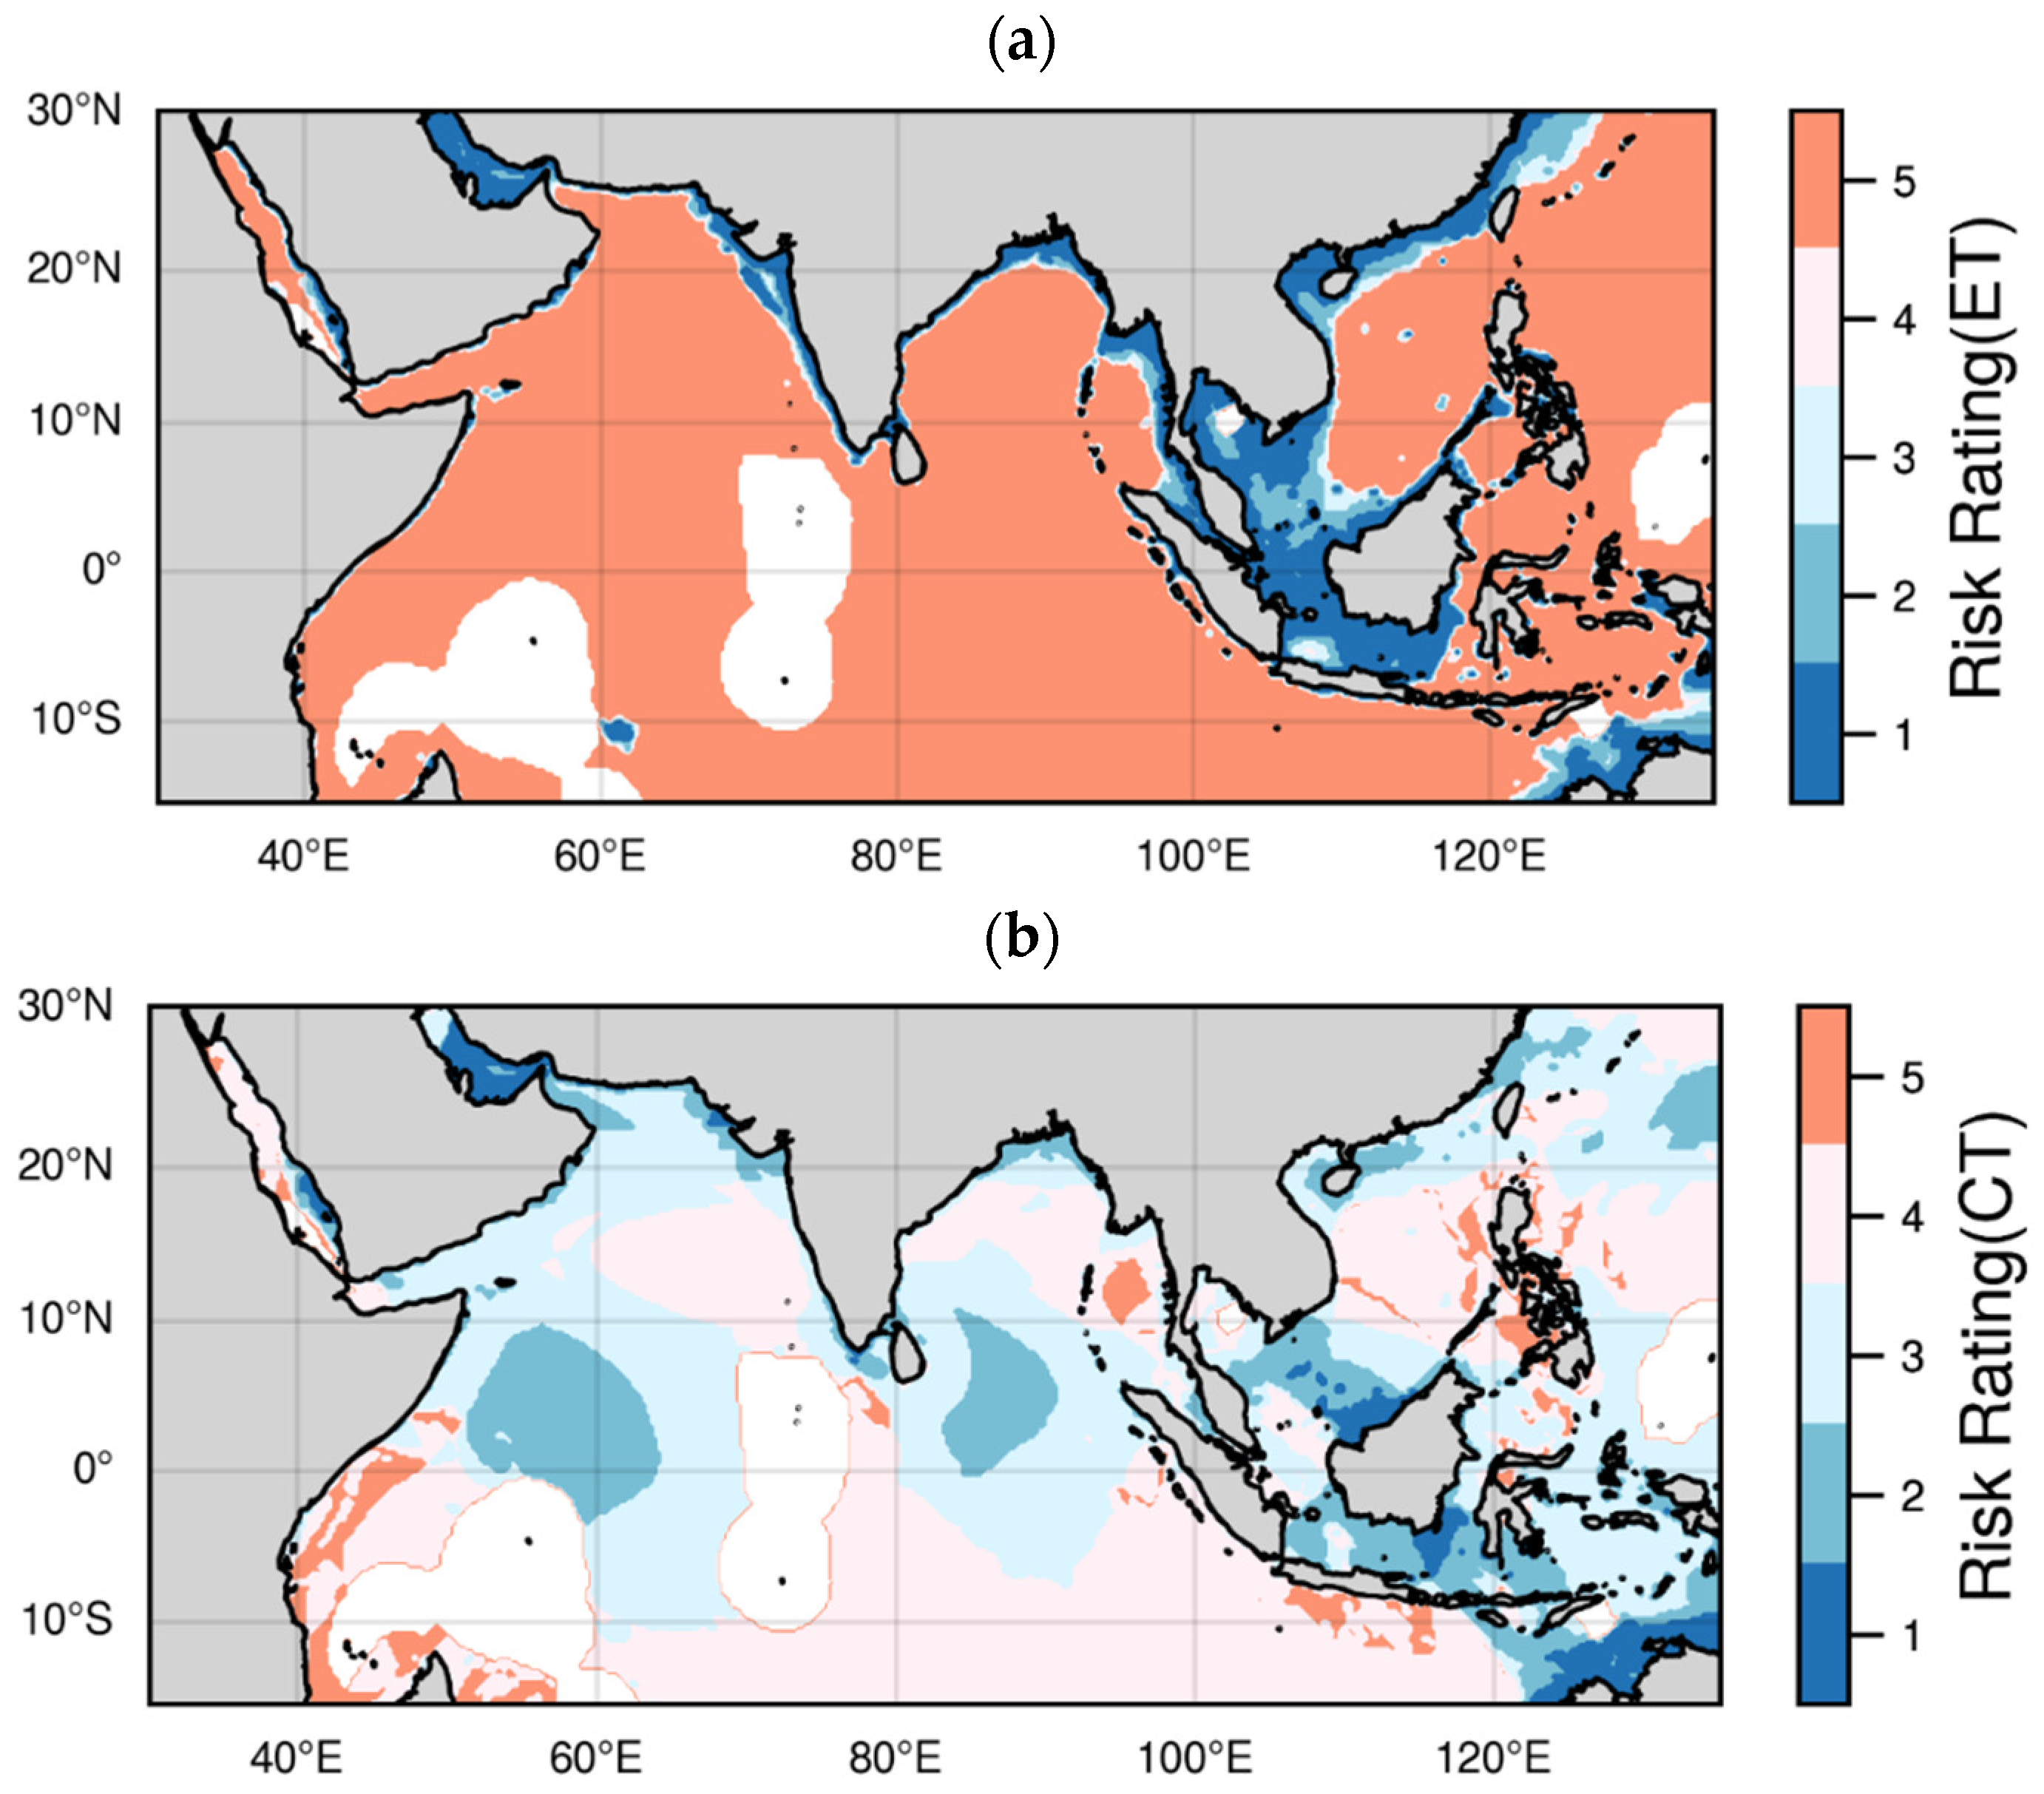
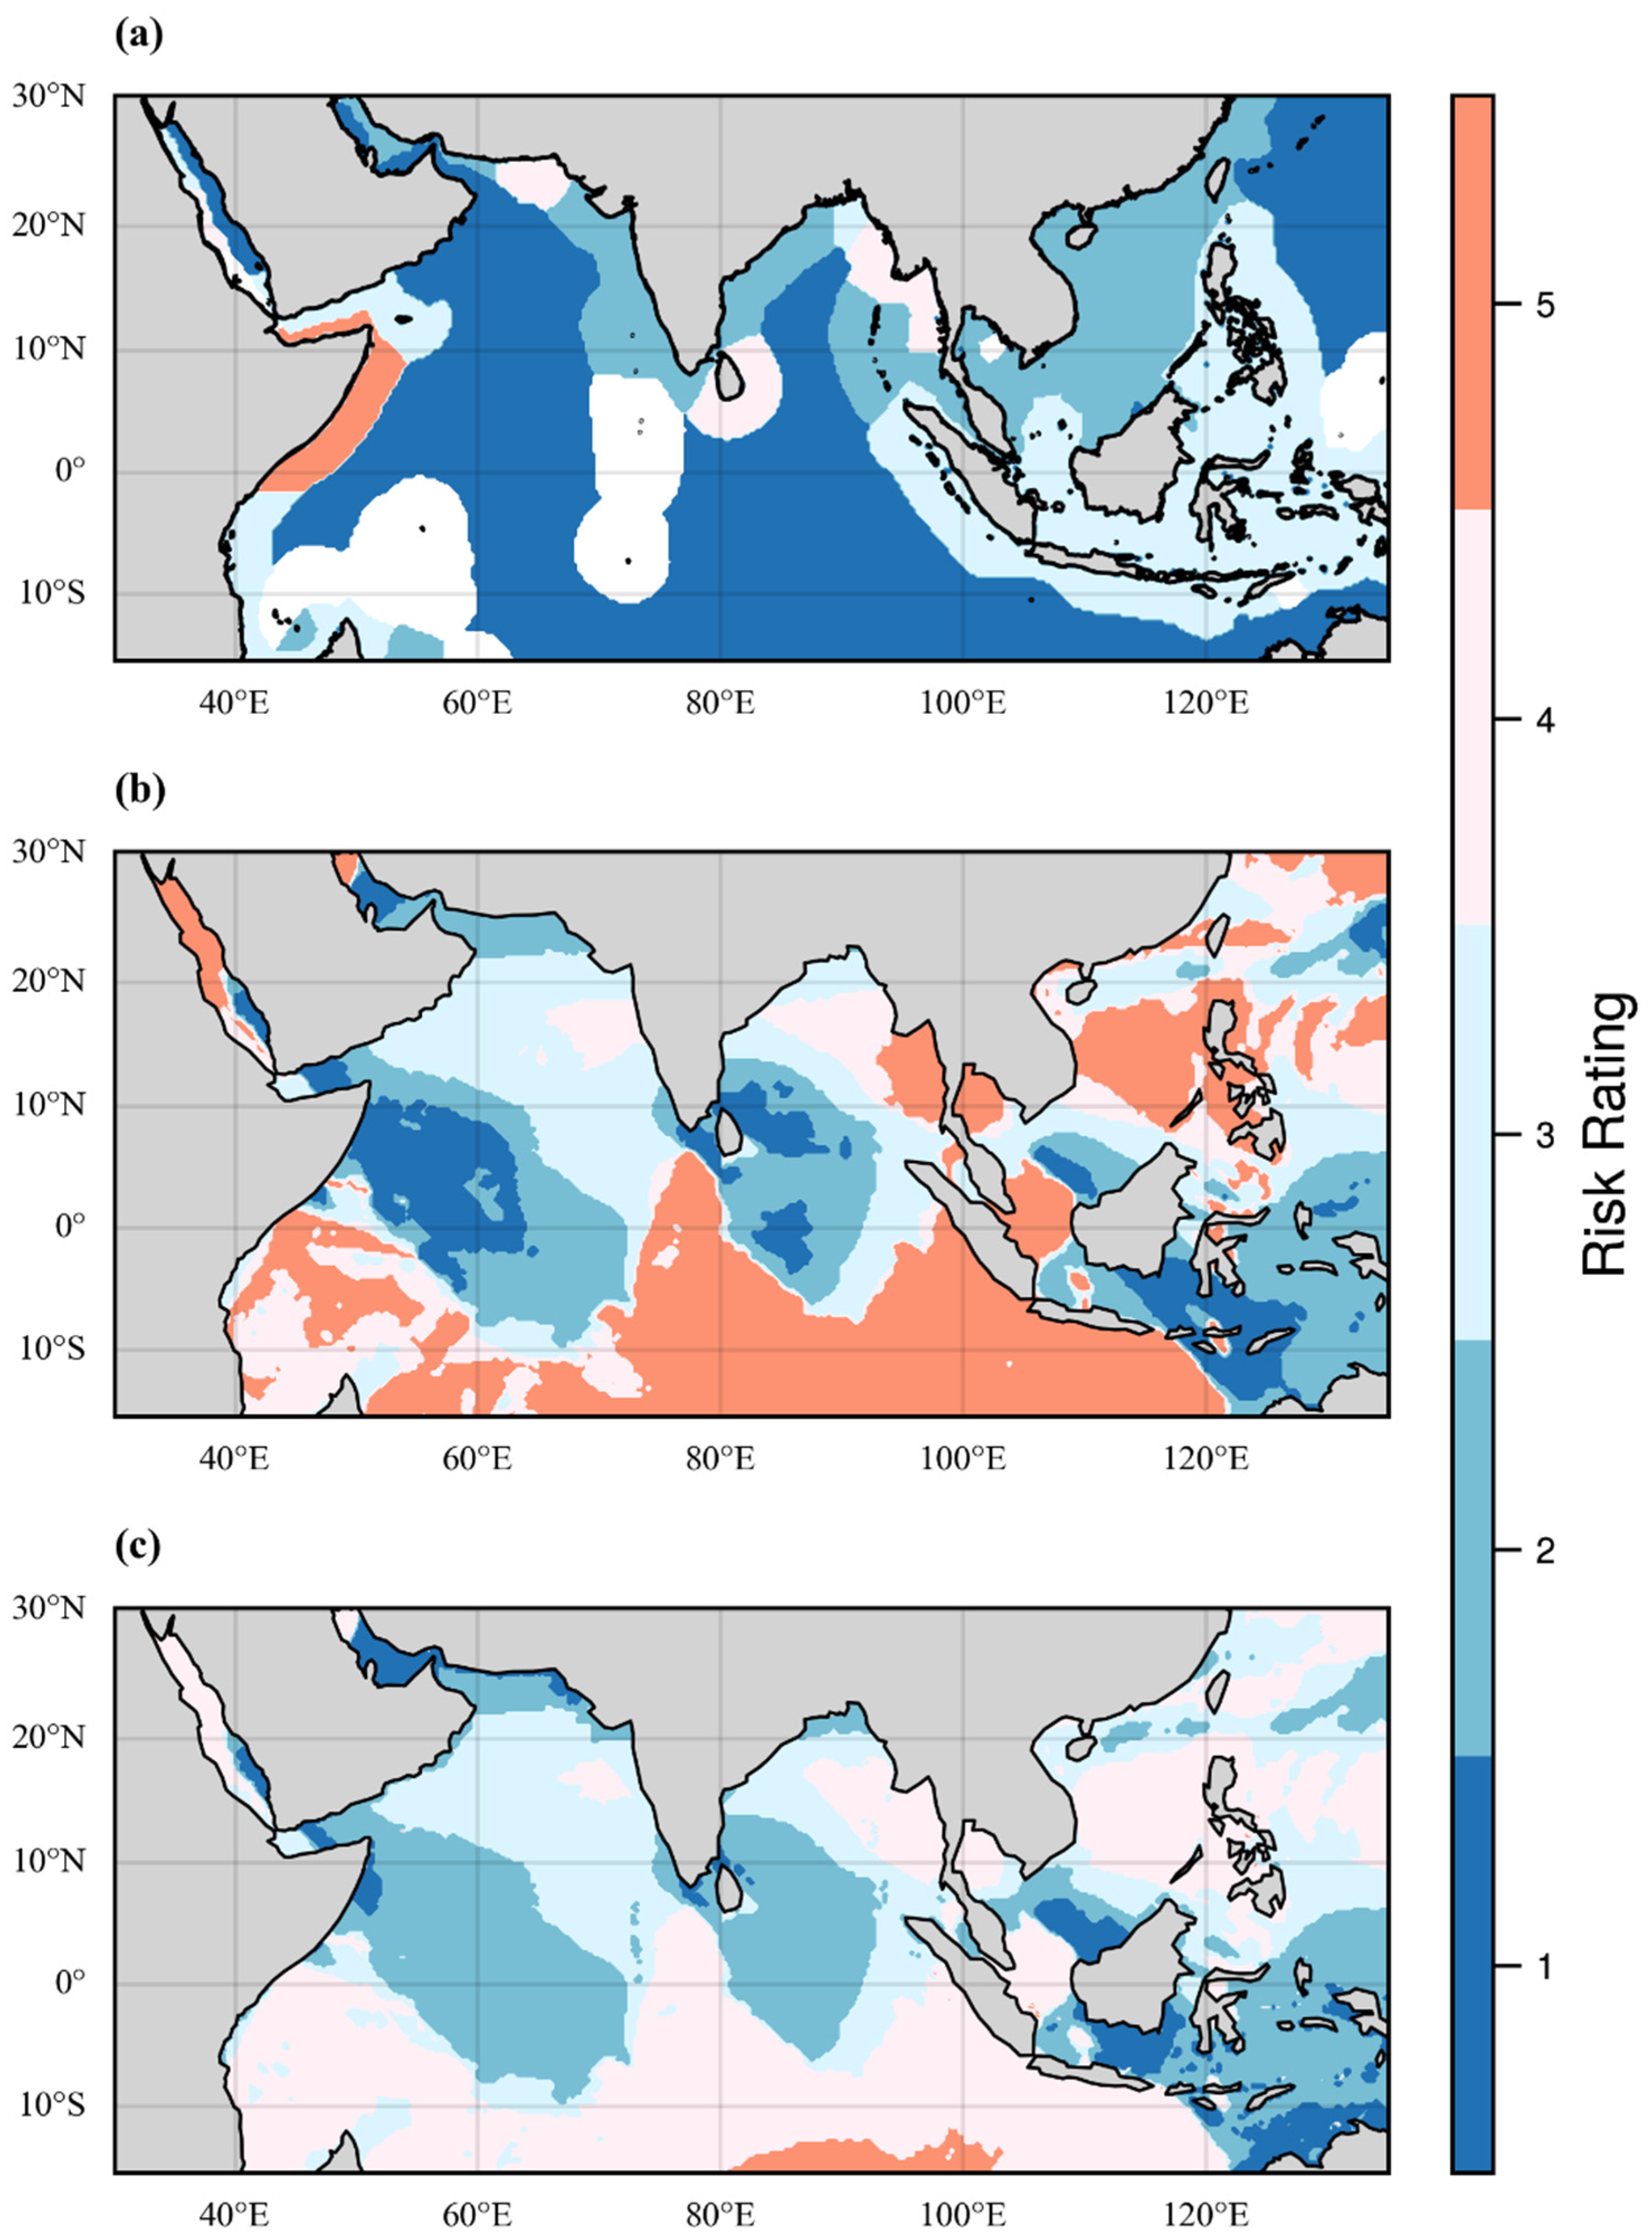
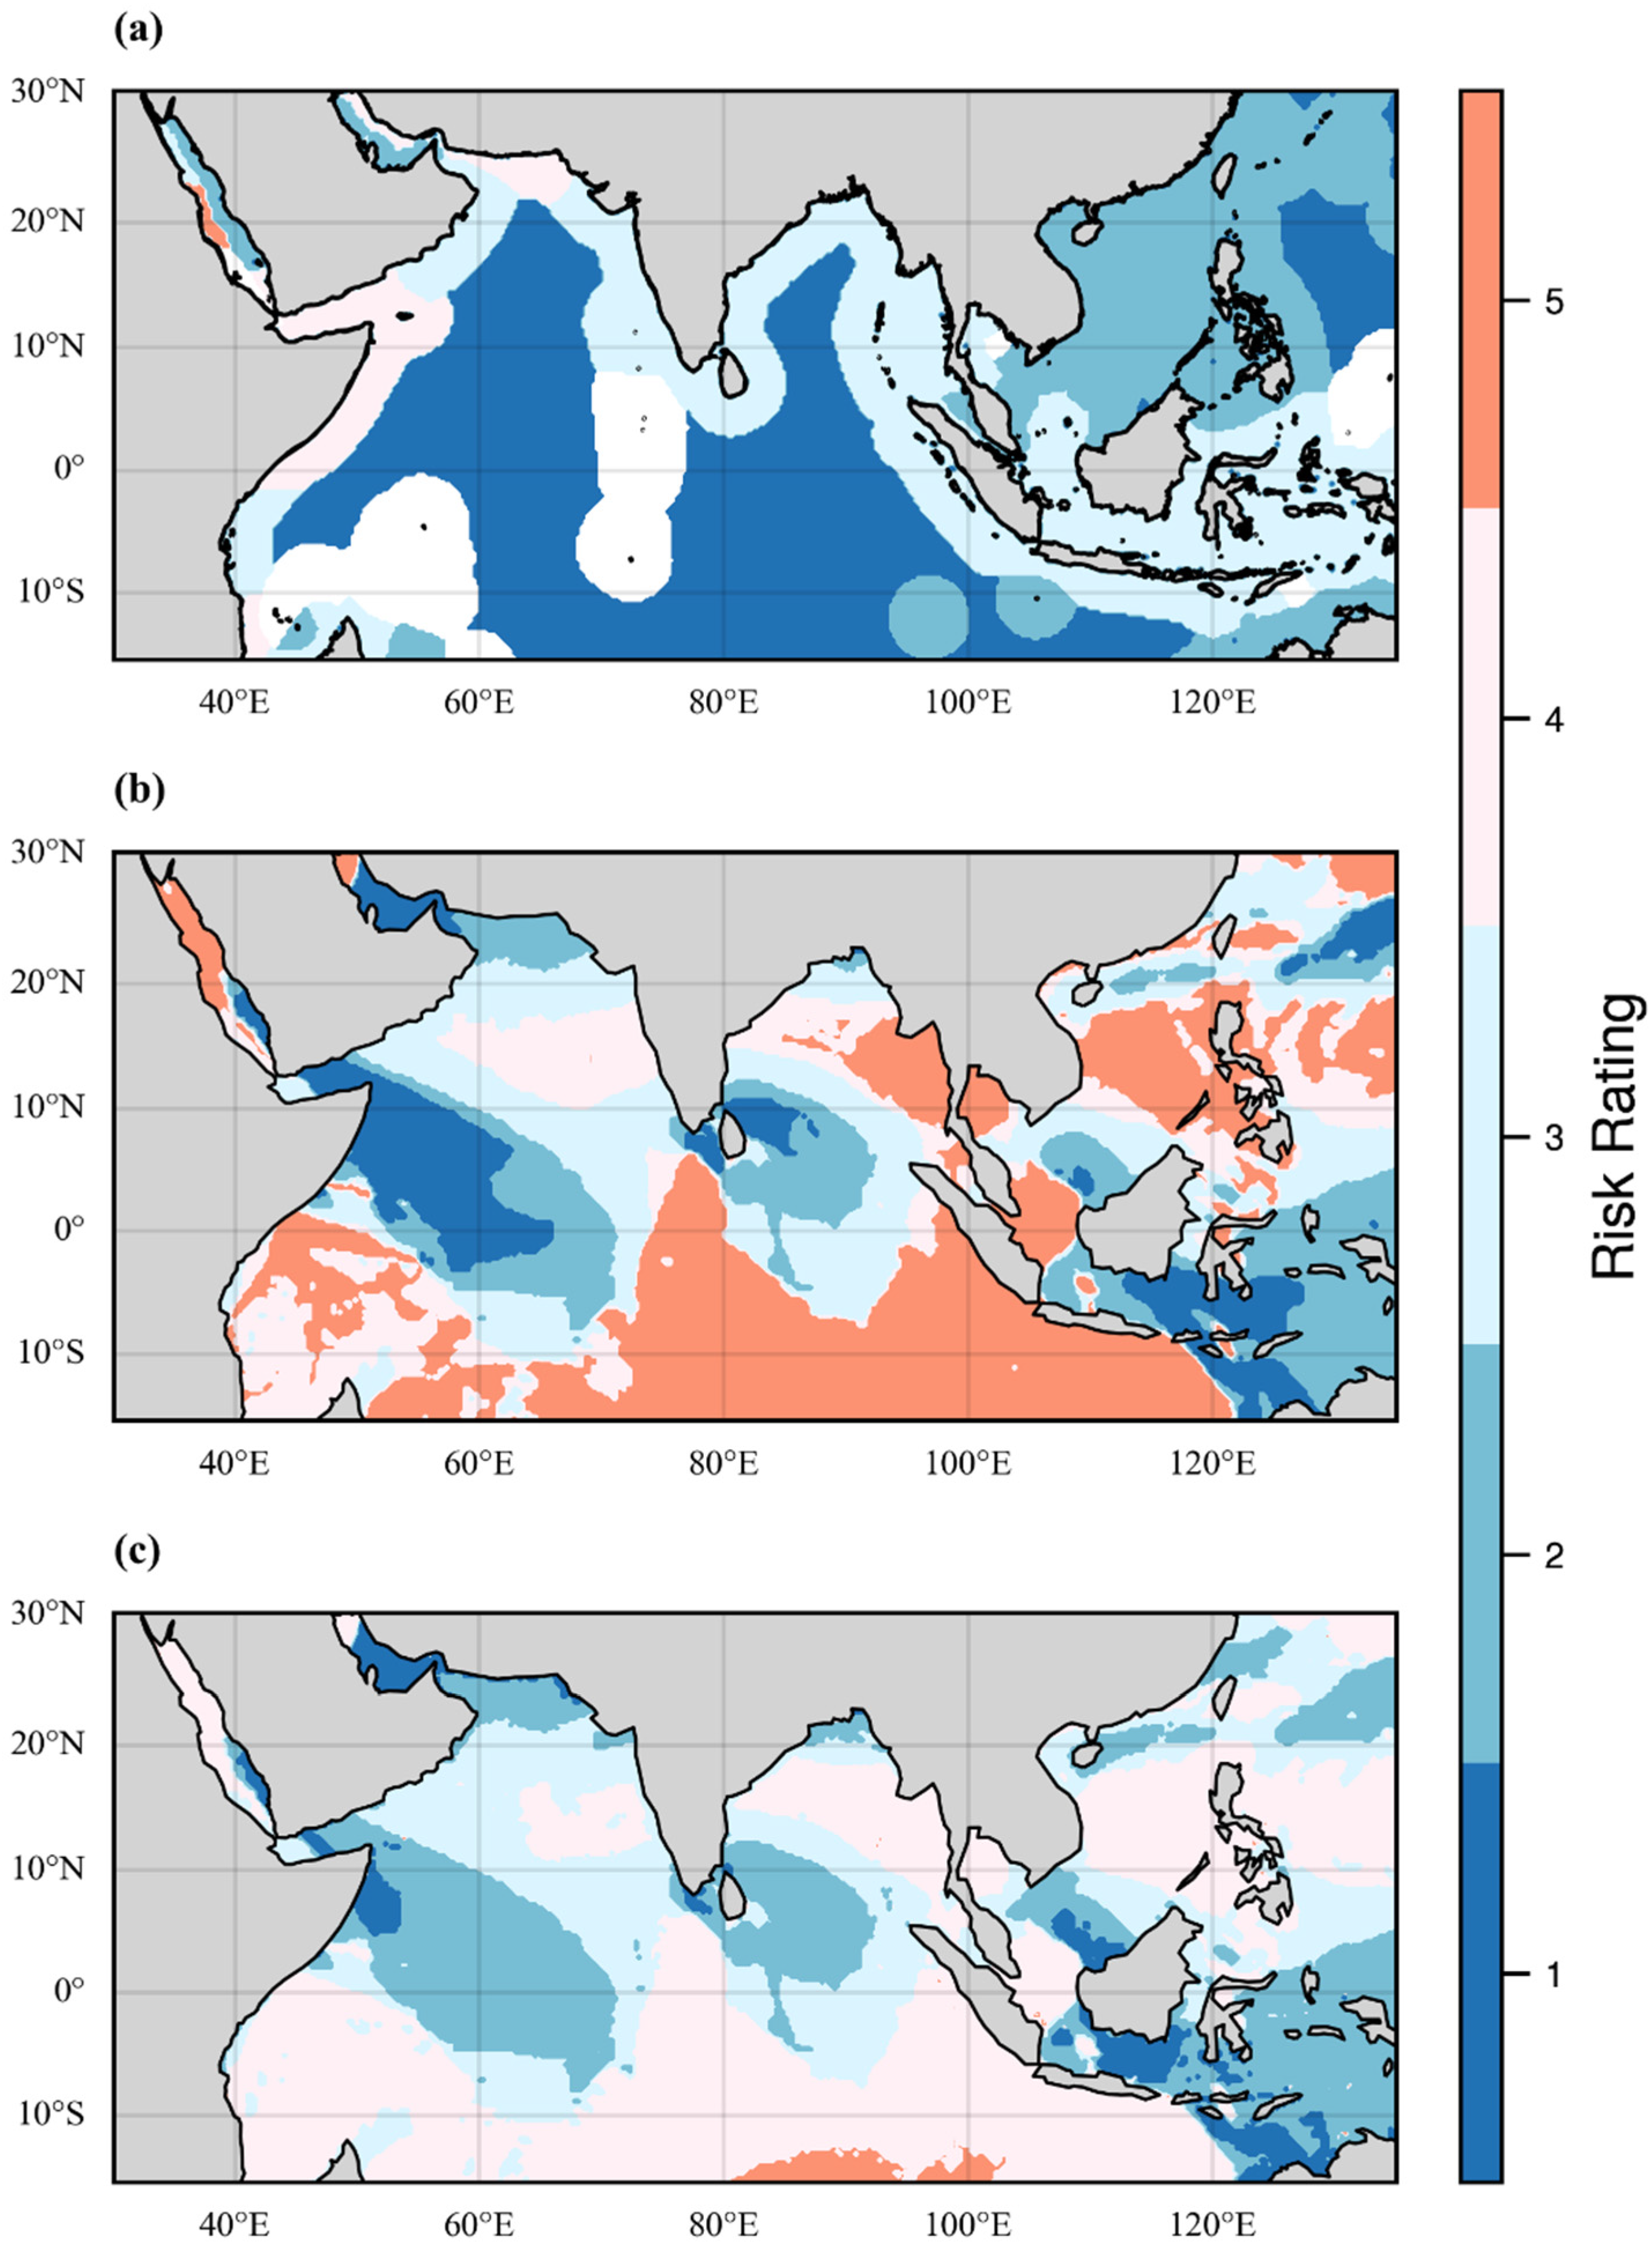
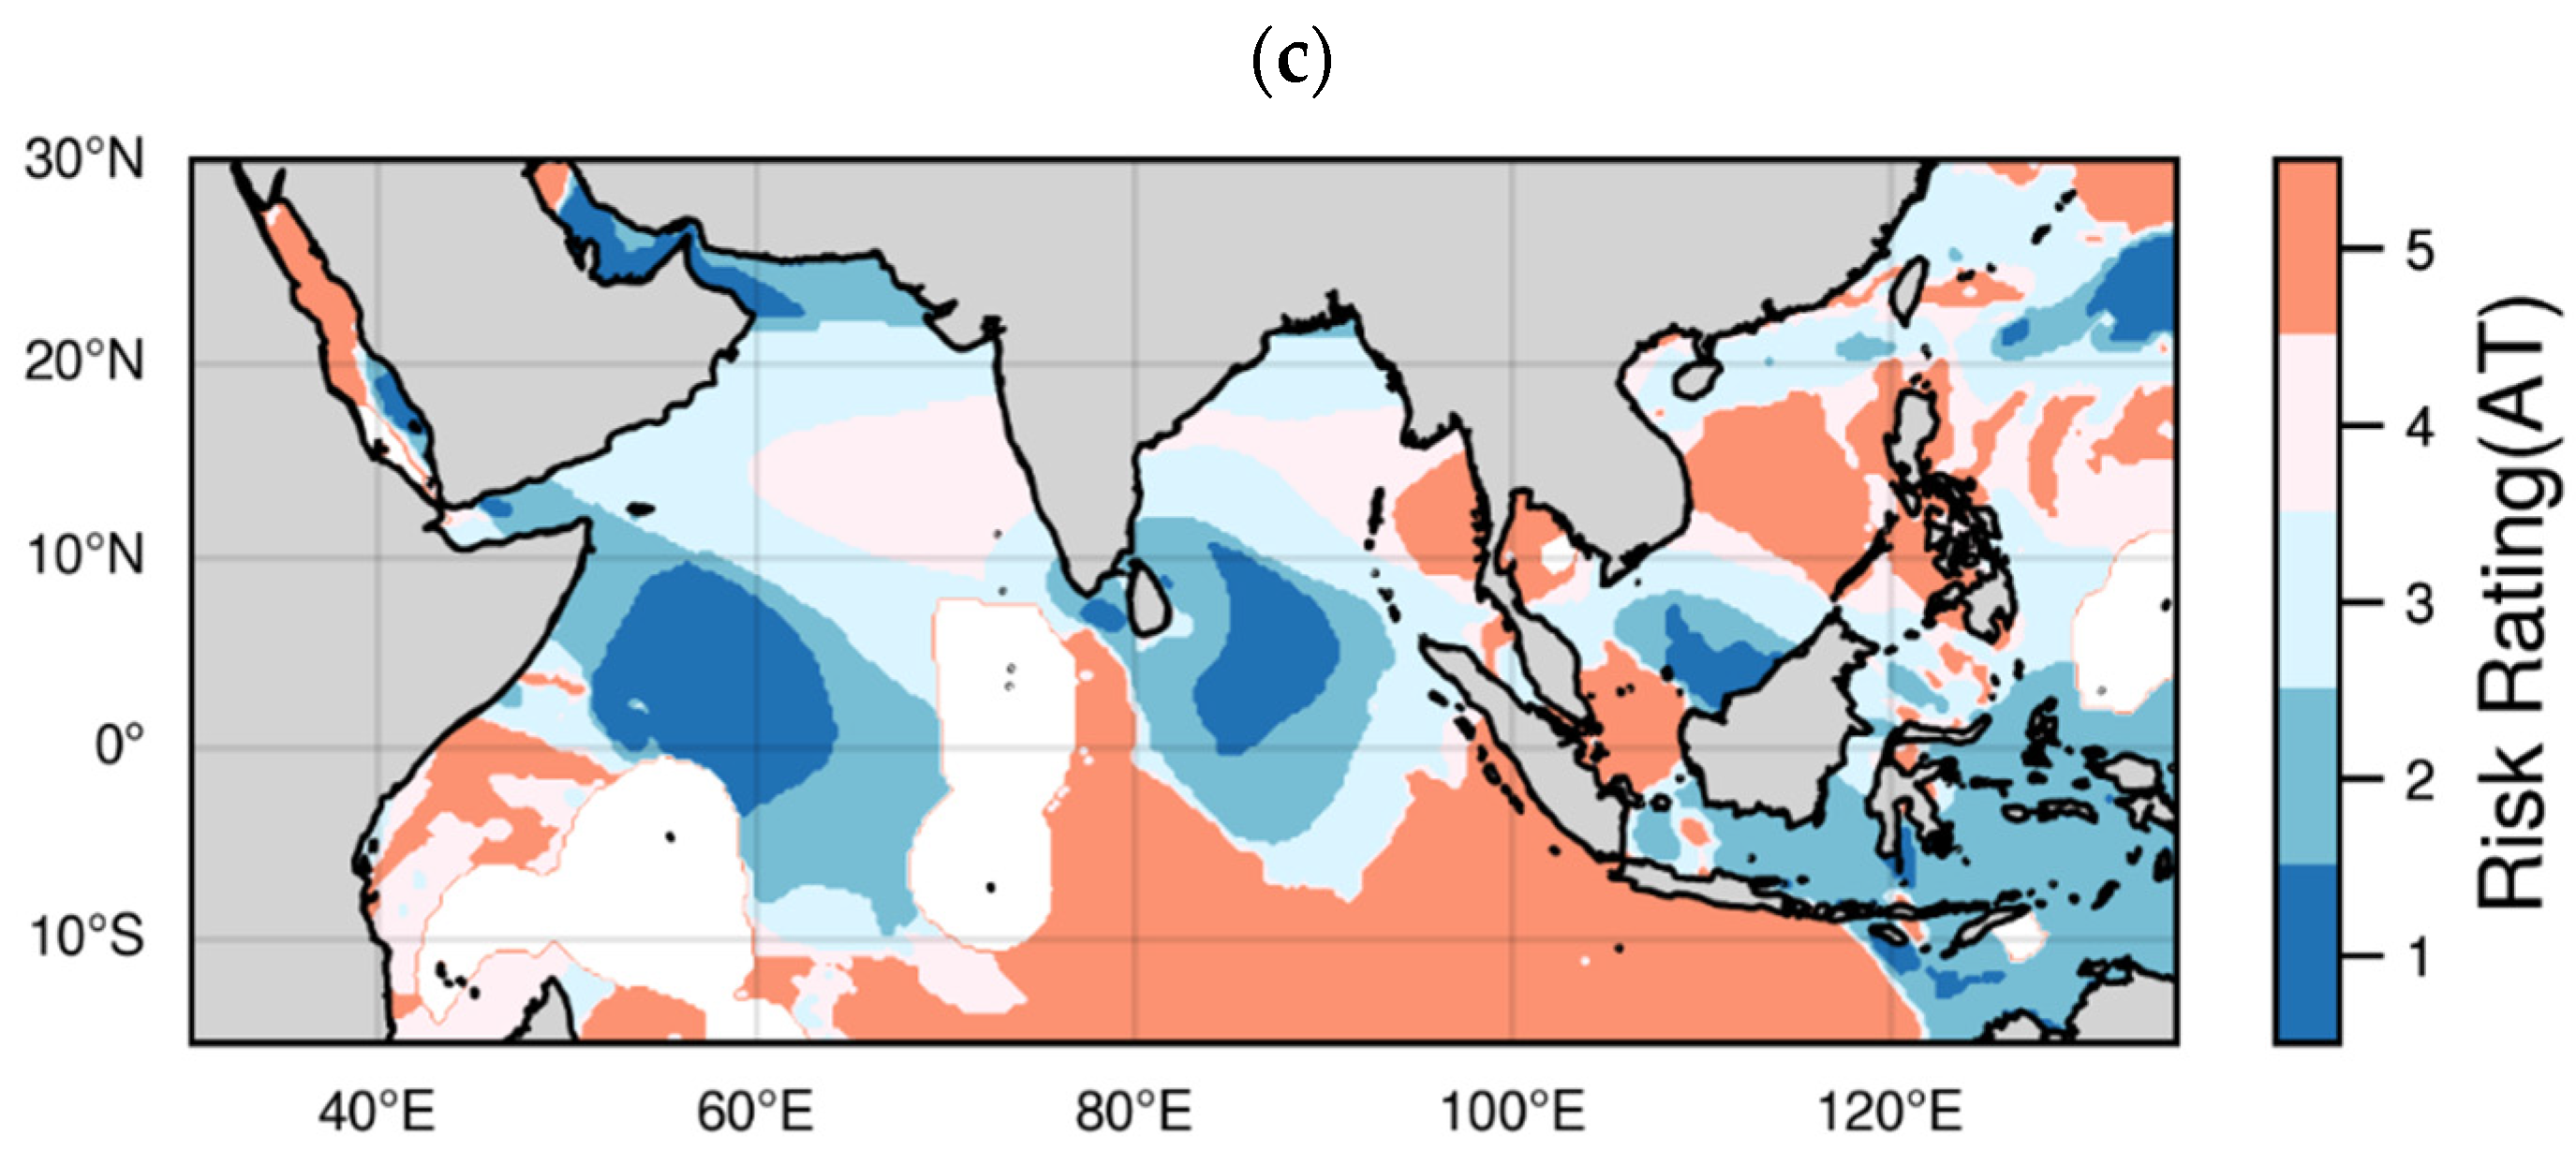
4.3. Comparison and Discussion of Regionalization Results

Since most of the data used in this paper had a spatial resolution of 0.25° × 0.25°, the 21st Century Maritime Silk Road area could be divided into a total of 77,043 grid points.
We compared the results of risk zoning in 2005 for several different indicator systems, as shown in Figure 5.
The result of the ICRG integrated risk zones, as shown in Figure 5a, showed that the western Red Sea region, the Somali Sea, and the northern Arabian Sea were permanently at high risk, while the regions of the high seas were all at low risk. The overall geo-human risk in other regions did not change much.
This is mainly due to the fact that Yemen, Somalia, Iran, Iraq, and Lebanon have control of this part of the sea. These countries, in turn, have long been exposed to political instability and economic downturns and have high combined geo-human risks and thus high-risk values for the maritime areas under their control.
On the other hand, the high seas are not controlled by a specific country; therefore, they had a lower risk value.
However, the siting of offshore wind power sites is not based on geo-human risks alone. Although the geophysical and human risks were found to be low in the high sea region, most areas are far from shore, where construction costs are high, and wind resources are scarce, making construction less meaningful.
The wind-energy-resource zoning result, as we can see in Figure 5b, showed that the overall wind-energy resources did not change much. The most abundant wind-energy resources were found to be concentrated in the Somali Sea, the Persian Gulf Sea, the sea around Sri Lanka, and the sea around Indonesia. The southern part of the Indian Ocean was relatively poor in wind-energy resources.
However, the risk of wind energy alone is not the only consideration for offshore wind power sites. Regions such as Somalia are rich in wind-energy resources but war-ridden and economically depressed, making the siting of wind power plants a real risk.
In addition, we compared the results of risk zoning in 2020 for several different indicator systems, as shown in Figure 6.
Overall, the risk of wind-energy development did not change much over the years, and the higher risk areas were found to be concentrated in the north-western Red Sea, the eastern coast of Africa, the south-western part of Indonesia, the Andaman Sea, and the southern part of the South China Sea. The lower-risk areas were found to be in the south-eastern Red Sea, the Persian Gulf, northern Malaysia, parts of the Java Sea, and northern Australia.
The following areas are worth noting:
(1)
Somali Sea area: The Somali Sea area is close to the Gulf of Aden, which is the connection between the Indian Ocean and the Mediterranean Sea, hosts important fuel ports and trade transit ports of the Atlantic Ocean route as well as exports from the southeast Mediterranean Sea and the entire Middle East. Thus, the Gulf of Aden is in an important strategic position. Considering only wind-energy resources, the region is a relatively large value center for wind-energy resources. However, Somalia has a long history of political instability, war, and piracy along its coast. It is ranked by the International Maritime Bureau as one of the most dangerous seas in the world. In addition, Somalia’s low economic and cultural development levels make it difficult to build infrastructure. Therefore, the risk of siting wind power plants in this sea area significantly increases after taking complete account of political and human factors;
(2)
In addition, the geo-humanistic risk of this region decreased in 2020, while the risk of wind-energy resources remained unchanged, and its recommended site selection area increased;
(3)
Persian Gulf Sea: The Persian Gulf Sea is a gulf in the northwest of the Arabian Sea extending into the Asian continent, located between the Iranian plateau and the Arabian Peninsula, surrounded by the world’s most enormous oil treasure trove on land, with a developed oil industry in the coastal countries. The region is rich in wind-energy resources due to natural factors. Moreover, the countries surrounding the sea are more politically stable, less war-torn, and have more developed industries. Therefore, after fully considering the political and human factors, the risk of siting wind power plants in this area is still at a low level;
(4)
The Timor Sea area in northern Australia: It is a sea area connecting the Indian Ocean and the Pacific Ocean. It is located between Timor Island and north-western Australia. It is connected to the Indian Ocean in the west and the Arafura Sea in the east. The wind-energy expectations for this area are high due to natural factors. Furthermore, Australia is politically stable, war-free, and industrially developed in the vicinity of this sea area. Therefore, after fully considering the political and human factors, the risk of siting wind power plants in this area is still at a low level;
(5)
Northern Sri Lankan waters in southern India: They are located in the Indian Ocean, southern India, and northern Sri Lankan waters. The wind-energy expectation in this area is higher due to natural factors. Moreover, the sea near India and Sri Lanka is relatively stable politically and presents relatively low war-related risk. India and Sri Lanka have large populations and more developed industries, with a high demand for electricity. In addition, the port of Colombo in this sea area is one of the largest artificial ports in the world. It is one of the critical intermediate ports in the world’s navigation routes among Europe, Asia, the Pacific, and the Indian Ocean. China has a strong political influence on the sea area. Therefore, the risk of siting wind power plants in this sea area is at a low level after taking complete account of political and human factors.
In conclusion, although this study provides results on the risk ranking of wind-resource sites by selecting as comprehensive a range of indicators as possible from wind-resource, natural-environment, and geo-human perspectives, we do acknowledge that uncertainty in the siting of wind resources can also arise from other factors, such as the ecological impacts of siting [39,40] and the impact of shipping density and conflicts with fisheries. Only a rational and scientific development of offshore wind-energy resources can promote the sustainable and harmonious development of humans and the environment.
Furthermore, in this study, the resolution of the wind field data based on the ERA5 reanalysis is 0.25° × 0.25°, and the resulting zonal extent is still not satisfactory enough. In future operational scenarios, the use of higher resolution datasets may be considered to improve the accuracy of risk zoning for wind-resource siting. In addition, the determination of risk has certain fuzzy factors, so the introduction of fuzzy mathematical research results can be considered in subsequent studies, and the use of fuzzy concepts for the scoring of each indicator can be attempted to improve the effectiveness and accuracy of the hierarchical analysis method, making the risk zoning of wind-resource siting more scientific and reasonable.

5. Conclusions

The siting of wind farms in the “21st Century Maritime Silk Road” region is an excellent way to promote energy construction in the region, promote the green development of the world economy, and comply with the current concept of sustainable development.
The specific conclusions are as follows:
  • Our study introduces authoritative ICRG data as geo-human factors for the first time in wind-energy-resource assessment. It constructs a comprehensive, reasonable, and independent comprehensive risk index system for wind-energy resources, making it different from traditional wind-energy-resource regionalization studies that only consider natural factors, policies, and other single factors. The results show that the wind-energy-resource factor is the most important, and the geo-human factor is the second;
  • Our study discusses the influence of different weighting methods on the wind-energy-resource assessment results. It comprehensively evaluates the influence of subjective knowledge based on experts and objective laws based on data on the weight determination of the index system. The results show that the entropy weight method is unsuitable for this research study. The general weight composed of the CRITIC method and analytic hierarchy process is the most in line with the actual demand;
  • Our study compares the differences among the results of the comprehensive risk zoning of wind-energy resources, the results of the risk zoning of wind-energy resources that only considers the impact on the natural environment, and the results of geo-human zoning published by ICRG. The results show that comprehensive zoning is the most reasonable. In particular, unlike previous research results that only considered wind-energy factors, this paper does not recommend the Somali sea as a priority area for wind-energy location due to its long-standing political instability, economic downturn, and numerous pirates.
Overall, this study achieves a comprehensive assessment of wind-energy resources, the natural environment, and geo-human factors. The model is expected to provide reliable reference and advice for siting wind-energy-resource development and promoting new-energy construction in the 21st Century Maritime Silk Road region.

Author Contributions

Data curation, J.X. and Q.L.; Formal analysis, J.X. and Q.L.; Funding acquisition, R.Z. and Y.W.; Investigation, Y.R.; Methodology, Y.W. and H.Y.; Project administration, R.Z. and Y.W.; Software, J.X.; Supervision, Y.W., H.Y. and Q.L.; Validation, H.Y. and Y.G.; Visualization, J.X.; Writing—original draft, J.X.; Writing—review & editing, J.X. All authors have read and agreed to the published version of the manuscript.

Funding

This study was supported by Chinese National Natural Science Fund (No. 41976188) and Natural Science Foundation of Hunan Province of China (No. 2021JJ40669).

Conflicts of Interest

The authors declare no conflict of interest.

References

  1. Len, C. China’s 21st Century Maritime Silk Road Initiative, Energy Security and SLOC Access. Marit. Aff. 2015, 11, 1–18. [Google Scholar] [CrossRef]
  2. Blanchard, J.F. China’s Maritime Silk Road Initiative and South Asia: Political and Economic Contours, Challenges, and Conundrums; Springer: Berlin/Heidelberg, Germany, 2018; ISBN 9789811052392. [Google Scholar]
  3. Chang, Y.C. The ‘21st Century Maritime Silk Road Initiative’ and Naval Diplomacy in China. Ocean Coast. Manag. 2018, 153, 148–156. [Google Scholar] [CrossRef]
  4. Zhang, X.; Zhang, J.; Fan, C.; Meng, J.; Wang, J.; Wan, Y. Analysis of Dynamic Characteristics of the 21st Century Maritime Silk Road. J. Ocean Univ. China 2018, 17, 487–497. [Google Scholar] [CrossRef]
  5. Pimentel, D.; Hurd, L.E.; Bellotti, A.C.; Forster, M.J.; Oka, I.N.; Sholes, O.D.; Whitman, R.J. Food Production and the Energy Crisis. Science 1973, 182, 443–449. [Google Scholar] [CrossRef] [PubMed]
  6. Carraro, C.; Siniscalco, D. Strategies for the International Protection of the Environment. J. Public Econ. 1993, 52, 309–328. [Google Scholar] [CrossRef]
  7. Wang, X.; Guo, P.; Huang, X. A Review of Wind Power Forecasting Models. Energy Procedia 2011, 12, 770–778. [Google Scholar] [CrossRef]
  8. Chang, W.-Y. A Literature Review of Wind Forecasting Methods. J. Power Energy Eng. 2014, 02, 161–168. [Google Scholar] [CrossRef]
  9. Archer, C.L.; Jacobson, M.Z. Evaluation of Global Wind Power. J. Geophys. Res. Atmos. 2005, 110, 1–20. [Google Scholar] [CrossRef]
  10. Mohammadi, K.; Shamshirband, S.; Yee, P.L.; Petković, D.; Zamani, M.; Ch, S. Predicting the Wind Power Density Based upon Extreme Learning Machine. Energy 2015, 86, 232–239. [Google Scholar] [CrossRef]
  11. Mohammadi, K.; Alavi, O.; Mostafaeipour, A.; Goudarzi, N.; Jalilvand, M. Assessing Different Parameters Estimation Methods of Weibull Distribution to Compute Wind Power Density. Energy Convers. Manag. 2016, 108, 322–335. [Google Scholar] [CrossRef]
  12. Zheng, C.W.; Li, C.Y.; Pan, J.; Liu, M.Y.; Xia, L.L. An Overview of Global Ocean Wind Energy Resource Evaluations. Renew. Sustain. Energy Rev. 2016, 53, 1240–1251. [Google Scholar] [CrossRef]
  13. Gamboa, G.; Munda, G. The Problem of Windfarm Location: A Social Multi-Criteria Evaluation Framework. Energy Policy 2007, 35, 1564–1583. [Google Scholar] [CrossRef]
  14. Yeh, T.M.; Huang, Y.L. Factors in Determining Wind Farm Location: Integrating GQM, FuzzyDEMATEL, and ANP. Renew. Energy 2014, 66, 159–169. [Google Scholar] [CrossRef]
  15. Zheng, C.W.; Xiao, Z.N.; Peng, Y.H.; Li, C.Y.; Du, Z.B. Rezoning Global Offshore Wind Energy Resources. Renew. Energy 2018, 129, 1–11. [Google Scholar] [CrossRef]
  16. Ziemba, P.; Wątróbski, J.; Zioło, M.; Karczmarczyk, A. Using the PROSA Method in Offshore Wind Farm Location Problems. Energies 2017, 10, 1755. [Google Scholar] [CrossRef]
  17. Gao, X.; Yang, H.; Lu, L. Study on Offshore Wind Power Potential and Wind Farm Optimization in Hong Kong. Appl. Energy 2014, 130, 519–531. [Google Scholar] [CrossRef]
  18. De Vos, K.; Morbee, J.; Driesen, J.; Belmans, R. Impact of Wind Power on Sizing and Allocation of Reserve Requirements. IET Renew. Power Gener. 2013, 7, 1–9. [Google Scholar] [CrossRef]
  19. An, Y.; Pandey, M.D. A Comparison of Methods of Extreme Wind Speed Estimation. J. Wind Eng. Ind. Aerodyn. 2005, 93, 535–545. [Google Scholar] [CrossRef]
  20. Young, I.R.; Vinoth, J.; Zieger, S.; Babanin, A.V. Investigation of Trends in Extreme Value Wave Height and Wind Speed. J. Geophys. Res. Ocean. 2012, 117, 1–13. [Google Scholar] [CrossRef]
  21. Ukwueze, E.R.; Ugwu, U.C.; Okafor, O.A. Impact of Institutional Quality on Multilateral Aid in Nigeria. J. Econ. Sci. Res. 2021, 4, 3116. [Google Scholar] [CrossRef]
  22. Javaid, A.; Arshed, N.; Munir, M.; Zakaria, Z.A.; Alamri, F.S.; Abd El-Wahed Khalifa, H.; Hanif, U. Econometric Assessment of Institutional Quality in Mitigating Global Climate-Change Risk. Sustainbility 2022, 14, 669. [Google Scholar] [CrossRef]
  23. Brown, C.L.; Cavusgil, S.T.; Lord, A.W. Country-Risk Measurement and Analysis: A New Conceptualization and Managerial Tool. Int. Bus. Rev. 2015, 24, 246–265. [Google Scholar] [CrossRef]
  24. Gezikol, B.; Tunahan, H. The Econometric Analysis of the Relationship Between Perceived Corruption, Foreign Trade and Foreign Direct Investment in the Context of International Indices. Alphanumeric J. 2018, 6, 117. [Google Scholar] [CrossRef]
  25. Barker, D.L.A. Human Rights and the Law of Persons. Law Made Simple 2020, 28, 84–112. [Google Scholar] [CrossRef]
  26. Wong, M.S. The United Nations Convention on the Law of the Sea 1982. Multilater. Environ. Treaties 2017, 488, 145–165. [Google Scholar] [CrossRef]
  27. Martinez, A.M.; Kak, A.C. PCA versus LDA. IEEE Trans. Pattern Anal. Mach. Intell. 2001, 23, 228–233. [Google Scholar] [CrossRef]
  28. Subasi, A.; Gursoy, M.I. EEG Signal Classification Using PCA, ICA, LDA and Support Vector Machines. Expert Syst. Appl. 2010, 37, 8659–8666. [Google Scholar] [CrossRef]
  29. Li, X.; Wang, K.; Liuz, L.; Xin, J.; Yang, H.; Gao, C. Application of the Entropy Weight and TOPSIS Method in Safety Evaluation of Coal Mines. Procedia Eng. 2011, 26, 2085–2091. [Google Scholar] [CrossRef]
  30. Delgado, A.; Romero, I. Environmental Conflict Analysis Using an Integrated Grey Clustering and Entropy-Weight Method: A Case Study of a Mining Project in Peru. Environ. Model. Softw. 2016, 77, 108–121. [Google Scholar] [CrossRef]
  31. Shannon, C.E. A Mathematical Theory of Communication. Bell Syst. Tech. J. 1948, 27, 623–656. [Google Scholar] [CrossRef]
  32. Konda V, R.; Tsitsiklis J, N. On Actor-Critic Algorithms. SIAM J. Control Optim. 2003, 42, 1143–1166. [Google Scholar] [CrossRef]
  33. Vaidya, O.S.; Kumar, S. Analytic Hierarchy Process: An Overview of Applications. Eur. J. Oper. Res. 2006, 169, 1–29. [Google Scholar] [CrossRef]
  34. Saaty, T.L. What Is the Analytic Hierarchy Process? Springer: Berlin/Heidelberg, Germany, 1988. [Google Scholar]
  35. Dos Santos, P.H.; Neves, S.M.; Sant’Anna, D.O.; de Oliveira, C.H.; Carvalho, H.D. The Analytic Hierarchy Process Supporting Decision Making for Sustainable Development: An Overview of Applications. J. Clean. Prod. 2019, 212, 119–138. [Google Scholar] [CrossRef]
  36. Behzadian, M.; Khanmohammadi Otaghsara, S.; Yazdani, M.; Ignatius, J. A State-of the-Art Survey of TOPSIS Applications. Expert Syst. Appl. 2012, 39, 13051–13069. [Google Scholar] [CrossRef]
  37. Salih, M.M.; Zaidan, B.B.; Zaidan, A.A.; Ahmed, M.A. Survey on Fuzzy TOPSIS State-of-the-Art between 2007 and 2017. Comput. Oper. Res. 2019, 104, 207–227. [Google Scholar] [CrossRef]
  38. Mokhtarian, M.N. Extension of Fuzzy TOPSIS Method Based on Interval-Valued Fuzzy Sets. Appl. Soft Comput. J. 2015, 26, 513–514. [Google Scholar] [CrossRef]
  39. Leung, D.Y.C.; Yang, Y. Wind Energy Development and Its Environmental Impact: A Review. Renew. Sustain. Energy Rev. 2012, 16, 1031–1039. [Google Scholar] [CrossRef]
  40. Tabassum, A.; Premalatha, M.; Abbasi, T.; Abbasi, S.A. Wind Energy: Increasing Deployment, Rising Environmental Concerns. Renew. Sustain. Energy Rev. 2014, 31, 270–288. [Google Scholar] [CrossRef]
Figure 1. Technical routes (“WE” represents wind energy; “NE” represents natural environment; “GH” represents geography humanities).
Energies 15 06758 g001
Figure 2. Correlation coefficient heatmap before principal component analysis.
Energies 15 06758 g002
Figure 3. Correlation coefficient heatmap after principal component analysis.
Energies 15 06758 g003
Figure 4. Comparison of weight results: (a) entropy weight; (b) CRITIC weight; (c) analytic hierarchy process weight (the blanks are missing parts of ICRG data).
Energies 15 06758 g004aEnergies 15 06758 g004b
Figure 5. Results of different indicator systems in 2005: (a) only geo-human influences; (b) only wind-energy resources; (c) comprehensive risk.
Energies 15 06758 g005
Figure 6. Results of different indicator systems in 2020: (a) only geo-human influences; (b) only wind-energy resources; (c) comprehensive risk.
Energies 15 06758 g006
Table 1. Coefficient of deviation mean for Gumbel curves.
P × 100 φ P × 100 φ
0.0018.53300.35
0.0106.73400.07
0.0505.4850−0.16
0.14.9460−0.38
0.53.6870−0.59
13.1480−0.82
22.5990−1.10
32.2795−1.31
51.8797−1.43
101.3099−1.64
200.7299.9−1.96
Table 2. Integrated risk assessment system.
Target LayerCriterion LayerIndex LayerIndex Attribute
Wind-Farm Site ExpectationWind-Energy ResourcesWind Power DensityBenefit Type
Frequency of Effective Wind SpeedBenefit Type
Energy-Level Frequencies above 200W·m−2Benefit Type
Coefficient of Variation in WPDCost Type
Effective Reserves of WPDBenefit Type
Extreme Wind SpeedCost Type
Natural Environment2 m TemperatureCost Type
Water DepthCost Type
Offshore DistanceCost Type
Geography HumanitiesICRG Integrated RiskBenefit Type
Table 3. Index grade division.
Index LayerVery Poor (1)Poor (2)Medium (3)Good (4)Very Good (5)
Wind Power Density<5050~100100~200200~400>400
Frequency of Effective Wind Speed<0.20.2~0.40.4~0.60.6~0.80.8~1.0
Frequencies above 200W·m−2<0.10.1~0.20.2~0.40.4~0.60.6~1.0
Coefficient of Variation in WPD>2.52.0~2.51.5~2.01.0~1.5<1.0
Effective Reserves of WPD<6060~9090~120120~150>150
Extreme Wind Speed>4035~4030~3525~30<25
2 m Temperature<-20−20~−10−10~00~10>10
Water Depth>200150~200100~15060~100<60
Offshore Distance>10080~10050~8030~50<30
ICRG Integrated Risk12345
Table 4. Risk zone threshold.
Nearness DegreeRisk Degree
[ 0 , 0.2 ) High Risk
[ 0.2 , 0.4 ) Higher Risk
[ 0.4 , 0.6 ) Medium Risk
[ 0.6 , 0.8 ) Lower Risk
[ 0.8 , 1 ] Low Risk
Table 5. Entropy weight, CRITIC, analytic hierarchy process and general weight results.
IndexEntropy WeightCRITIC WeightAHP WeightGeneral Weight
PCA10.08240.32210.49760.4099
PCA20.14100.16380.12180.1428
PCA30.01830.06730.02160.0444
EWS0.00260.01200.09420.0530
T2m0.00370.02900.02150.0252
WD0.69770.18180.03800.1099
DC0.02560.07050.03800.0542
ICRG0.02860.15370.16730.1605
Publisher’s Note: MDPI stays neutral with regard to jurisdictional claims in published maps and institutional affiliations.

