Article

Impact of Government Support, Business Style, and Entrepreneurial Sustainability on Business Location of SMEs in South Africa’s Mpumalanga Province

by
Kanayo K. Ogujiuba
1,*,
Ebenezer Olamide
1,
Azikiwe Isaac Agholor
2,
Estelle Boshoff
1 and
Phetole Semosa
1
1
School of Development Studies, University of Mpumalanga, Nelspruit 1200, South Africa
2
School of Agriculture, University of Mpumalanga, Nelspruit 1200, South Africa
*
Author to whom correspondence should be addressed.
Adm. Sci. 2022, 12(3), 117; https://doi.org/10.3390/admsci12030117
Submission received: 3 July 2022 / Revised: 7 September 2022 / Accepted: 7 September 2022 / Published: 14 September 2022

Abstract

:
Finance, incubation, managerial support initiatives, and technological innovation have all been identified as major drivers of SMEs’ business location. Despite the importance of SMEs, little attention has been paid to business research regarding the impact of government support, business style, and entrepreneurial sustainability on SME activities in rural, semi-urban, and urban areas. Identifying the necessary support for SMEs in rural, semi-urban, and urban areas is critical for the government as well as stakeholders and SME owners in assessing their survival status and other goal-setting achievements. The article’s central question is whether government support, business style, and entrepreneurship sustainability affect SME operations differently depending on location (rural, semi-urban, or urban). The MANOVA technique was used for the analysis to determine whether there is a significant difference between groups on a composite dependent variable as well as the univariate results for each dependent variable separately. Because conducting a series of studies (ANOVA) reveals the possibility of an inflated Type 1 error, MANOVA is preferred. The test re-test reliability method (trustworthiness assessment of the questionnaire) and the Cronbach Alpha test (internal consistency of instrument sections) yielded satisfactory results of 0.70 and 0.875, respectively. Government support (GS), business style (BS), and entrepreneurial sustainability were used as dependent variables (SE). The independent variable was the business location. On the combined dependent variables, there was a statistically significant difference between SME location: F (3, 902) = 20.388, p = 0.001, Wilks’ Lambda = 0.88, partial eta squared = 0.06. When the results for the dependent variables were considered separately, they all reached statistical significance, using a Bonferroni adjusted alpha level of 0.017. BS: F (1, 904) = 13.29, p ≤ 001, partial eta squared = 0.03. GS: F (1, 904) = 30.28, p ≤ 0.001, partial eta squared = 0.06. SE: F (1, 904) = 8.08, p ≤ 0.001, partial eta squared = 0.02. The findings show that locational effects on government support have a knock-on effect on the business plan and long-term entrepreneurship. As a result, the government must reconsider its rural activities to ensure that support is distributed equitably across levels of location.

1. Introduction

The significance of small and medium-sized businesses (SMEs) has been highlighted in the current business environment (Fatoki 2018; Nguyen et al. 2018; Ogujiuba et al. 2021c). Small, micro, and medium-sized companies (SMMEs) continue to be the main engines of any economy, according to Zhou and Gumbo (2021); hence, all levels of government must support their initiatives. Other theories have been put out as to why SMEs fail, whether they do so early on in operations or as they grow (Farja et al. 2017; Otto 2018). Few of the failure factors include finances (Feng et al. 2020), managerial incompetence (Abrham et al. 2015), a lack of government support (Xiang and Worthington 2017; Lee et al. 2011), a lack of infrastructure (Ajide 2020), and the environment (Hamann et al. 2015; Ogujiuba et al. 2021b). Furthermore, although Zhou and Gumbo (2021) and Simarasi et al. (2021) emphasized location as a major barrier to the success or failure of SMEs and stated that this gap must be crossed, Farja et al. (2017) linked this failure to a lack of skill acquisition. The failure of SMEs in South Africa, according to Ladzani and Netswera (2009) and Ogujiuba et al. (2021c), was blamed on a lack of government support, either in the form of start-up funding or operating funds. Some of the most significant government support systems for SMEs in South Africa are the Small Enterprise Development Agency (SEDA), the Rural Economic Development Initiative, and Khula Enterprise Finance. Ogujiuba et al. (2021a) identified financial, social, and environmental elements as the main entrepreneurial drivers of company performance for SMEs in South Africa. Both Fatoki (2014) and Masocha and Fatoki (2018) highlighted how crucial an entrepreneur’s style is to the continuation and expansion of any business. Entrepreneurship sustainability is another element that might have an impact on SME growth (Jia et al. 2020). Nguyen et al. (2018) claim that government support in the areas of finance, incubation guidance, managerial support programs, and technical innovation are key factors influencing the location of SME businesses. Innovative and technical adaptability, according to Pu et al. (2021), is a significant engine that could boost entrepreneurial sustainability. Even though the industry has been successful in creating a lot of jobs, the majority of the participants still operate below capacity. Small- and medium-sized enterprises (SMEs) in Africa have a greater potential to increase GDP and job opportunities than SMEs in other affluent nations. Due to the locational effects of government support for SME activities in rural and urban regions, entrepreneurial activity may move from rural to urban areas or vice versa. According to Freeman and his colleagues (2012), a company’s location, whether rural or urban, may, in theory, help SMEs run more effectively because businesses’ resource and capacity profiles differ in various locations. Having connections to their metropolitan counterparts can help rural and urban entrepreneurs participate in long-term economic involvement, claim Mayer et al. (2016). Despite this, government assistance for SME activity in rural and urban areas has received little attention from business studies.
However, in Africa, besides their critical and positive role, many SMEs face numerous challenges in semi-urban and rural settings, ranging from power shortage, lack of capital, poor management skills and competencies, and inadequate information and corruption. This article stands out in three ways. To begin, the study’s main question is: “Do government support, business style, and entrepreneurial sustainability affect SMEs differently depending on whether they are in a rural, semi-urban, or urban location?” This is a complex subject that has not received much consideration in business studies. According to Cravo and Piza, the level and cost of government support for businesses vary (Cravo and Piza 2016). As a result, differences between grant and loan support may be connected to the overhead associated with giving SMEs financial assistance (Simarasi et al. 2021). Furthermore, SMEs in cities outperform their local equivalents, according to Freeman et al. (2012), because of the strength of their business concepts. Second, each nation, including South Africa, experiences government support, unique entrepreneurial business methods, and sustainability initiatives with varying effects on the outputs of SMEs. By studying how each of these factors affects SME location in rural, semi-urban, and metropolitan areas of South Africa, this study advances previous research in the field. Finally, the use of multivariate analysis of variance in this study is noteworthy (MANOVA). It is a method that solves both the problems with primary data analysis, such as type 1 error, and the ease with which many dependent variables can be integrated into one, possibly leading to an econometric bias in conclusions. Nonetheless, this study adds to the small body of literature on the relationship between SME location and government support, business plans, and long-term entrepreneurship in South Africa. Thus, the objective of the article is to determine the impact of government support, business style, and entrepreneurial sustainability on the business location of SMEs in South Africa. The article is further divided into literature review; data and methods; results; and discussion and conclusion.

2. Literature Review

Numerous types of research have been conducted on the relationship between government support and entrepreneurial motivations (Otto 2018; Feng et al. 2020), but it is still unclear whether these supports differ or have similar effects on SME operations depending on location. In addition, while business models and sustainability strategies for entrepreneurship have been researched in the literature as indicators for SME success drivers, information on how they could influence SMEs’ activities based on geography is lacking. The government must investigate the problems that are contributing to —rural-urban SME mobility because government support for rural and urban entrepreneurship may differ.

2.1. Government Support as Driver of Business Location for SMEs in South Africa

One technique for helping South Africa’s rural economy flourish is government support for the establishment of SMEs in rural areas. —Rural-urban migration is common in South Africa, as it is in many other developing countries, necessitating government support (Ladzani and Netswera 2009). Lee et al. (2011) assessed the extent to which government assistance enables women’s participation in entrepreneurship in Korea, concluding that present levels of government support for women’s ownership are insufficient. The role of the government and other institutional assistance in Zimbabwe’s manufacturing sector was the subject of research by Zindiye et al. (2012). Using the chi-square method, the study discovered that government support has a positive impact on SME ownership in Zimbabwe. Ntiamoah et al. (2016) studied the agriculture sector in Ghana and discovered a positive relationship between SME ownership and government support. In other words, the ownership structure of SMEs in Ghana was influenced by government support. Feng et al. (2020) investigated the impact of capital on the ownership structure of SMEs in China, discovering that capital has a significant impact on the ownership outlook of listed real estate enterprises in the country. Abramov et al. (2017) found that private-equity firms were more productive than state-owned structures in a sample of 114 top companies in Russian cities. The study concluded that the variations in the effects of government control on ownership were relatively small, using private ownership to represent rural SMEs and public ownership to represent urban SMEs. Xiang and Worthington (2017) and Ogujiuba et al. (2021a) discovered that government financial support for SMEs has a positive influence on their performance. Park et al. (2019) compared nonmonetary diagnostic/support services (such as technical consultation, SME management mentoring, and business management) provided by the Korean government to SMEs and found that nonmonetary diagnostic/support services are insufficient to ensure small-scale enterprise survival. When financial support was extended to SME activities, sales production increased, and assets were expanded. Although the results of the binary probit regression model emphasized the need for government financial assistance, as modern classical economists have shown, the relevance of such assistance for SME survival and growth cannot be overestimated. The financial help provided by the Spanish government to SMEs enhanced their productivity and, as a result, their contribution to the national job creation effort regardless of location. Bertoni et al. (2018) investigated the association between government participatory loans and SME growth in Spain using Propensity-Score Matching and Instrumental Variable Analysis. Nguyen et al. (2018) explored how government support could affect SME financial performance in Vietnam using the econometric dynamic model technique, confirming prior findings of a positive relationship between the two variables. On the other hand, the level of government support manifested in the activities of rural SMEs differs from that of urban SMEs. This may be one of the reasons why SME actions are more visible and felt than their metropolitan counterparts. The government’s response to these inequalities may delay the movement of SMEs from rural to urban areas. Bureaucratic procedures, corruption, and service fees, according to Abioye et al. (2017), are some of the hurdles to government support for SMEs in Nigeria’s rural areas. Farja et al. (2017) recommended enhanced government assistance in the areas of funding and knowledge acquisition to the economic fortunes of rural areas and the formation of young SMEs. Government support for rural and urban SMEs in Israel has different locational repercussions, according to the study, with rural SMEs having less access to finance than their urban counterparts. This was seen as a major factor in the decline of rural SME activity, resulting in a rural–urban SME migration across the country. Mayer et al. (2016) attributed distance as one explanation for differences in the effects of government support on SME activity in rural and urban locations in another study.

2.2. Business Style as Driver of Business Location for SMEs in South Africa

Zhou and Gumbo (2021) dwelled much on the influence of location as a means of identifying business style in South Africa and submitted that the extent to which this affects ownership structure and performance is limited. Ndesaulwa and Kikula (2016) investigated how innovation as a form of business style in Tanzania and concluded that there was no consensus among the studies reviewed. In South Africa, Fatoki (2014) attributed attitude toward customers as one of the major poor business service styles that hinders the survival of new SMEs; just as AlQershi et al. (2020) observed that customers in the rural settings receive more attention because of their closeness to service providers. On the contrary, Otto (2018) submitted that the availability of credit facilities that usually resulted in bad debt by rural customers is one major barrier that limits the scope of expansion of SMEs at local business centers. In general, business style can have a variety of effects on how SMEs operate in terms of location requirements. In their study on the relationship between the idea of Mimicry Isomorphism and SME operations in South Africa, Masocha and Fatoki (2018) found two fundamental components of Mimicry Isomorphism (organizational ecology and institutional theory). Furthermore, the study conceived social development as an environmental, economic, and social trajectory, indicating that social stability as a business style has an important influence on SME placement and image laundering. As a result, whether in rural areas or metropolitan centers, socializing as a business approach will impact business location.
Entrepreneurial resilience, according to Fatoki (2018), is a personal trait of an entrepreneur that transfers into business success. This success was also ascribed to the owner’s business style, rather than just the management. As a result, regardless of whether SMEs are based in rural, semi-urban, or urban locations, business style as a success strategy remains sacred to their survival and continuous existence in South Africa. However, operational skills and strategic management, according to Urban and Naidoo (2012) and Sandada et al. (2014), are instruments of entrepreneurial sustainability that are currently lacking in SMEs in South Africa, resulting in business failures. However, due to the narrow scope of this research, it was acknowledged that their conclusions might not reflect the state of the economy in other sectors. As a result, entrepreneurial sustainability may have a distinct impact on SME operations, particularly in terms of location. Abrham et al. (2015) found that the managerial style of a company played a significant effect on the location of SMEs in the Czech Republic. The one-way error model’s findings also identified the size of an organization, age, and innovation as important influencing factors that determine the distribution of SMEs within the country, among other things. Paudel (2020) defined two types of leadership styles—transformative and transactional—and found that these two indices had a significant impact on entrepreneurial orientation in the management and location of SMEs in Nepal. Innovation and marketing are two instruments of SME performance. Realizing a business’ potential depends on its owner’s capacity to use these tools to accomplish its objectives. This is what is known as a transformational business style, according to Afriyie et al. (2019). Additionally, this kind of business is quite important for ensuring a company’s survival. The researchers used a combination of partial least squares structural equation modeling and bootstrapping techniques to show how transformational business approaches affect the operations of SMEs in Ghana. Because of this, an entrepreneur’s flexibility and dynamism while using the invention’s tool will help in adapting the current style when essential for a future business transfer.

2.3. Entrepreneurial Sustainability as Driver of Business Location for SMEs in South Africa

Entrepreneurship was named one of the solutions for economic success, progress, and development by Ogujiuba et al. (2021a). Jia et al. (2020) looked into how much China’s national innovative system has influenced the sustainability drive and ownership of SMEs and found that it had little bearing on their survival. Two main justifications were offered for this. The first was the support’s limited operational range, and the second was that the system’s top-down structure did not allow for the ownership sustainability structure of the SME. The entrepreneurial sustainability and ownership structure of SMEs are often positively impacted by the government’s well-planned and targeted support. Iskandar et al. (2017) linked corporate governance as a characteristic of entrepreneurial sustainability and the ownership structure of SMEs in Malaysia. According to the study, effective corporate governance is a result of the ownership structure and helps SMEs remain sustainable. In a study by Lamoureux et al. (2019) on sustainability methods used by SMEs in the USA, it was found that a significant barrier to achieving the benefits of SMEs’ sustainability programs was the absence of government direction. According to the study, sustainability packages of SMEs include the usage of renewable energies, recycling/waste reduction, and sourcing from local suppliers of production inputs. In essence, relying on local inputs helped in conserving funds and therefore resulted in financial prudence Songling et al. (2018) attributed a lack of the required managerial skill, financial capability, and lack of resources as major obstacles to entrepreneurship sustainability of SMEs. While examining government financial and non-financial supports for SMEs, it was noted that these factors have a significant influence on the sustainable strategy of any enterprise. Therefore, the continued support from the government in the area of finance especially the start-up capital was advocated for in the study. In Bangladesh, an emerging economy with similar characteristics to South Africa, financial innovation (financial prudence and technological adaptation) was seen as an entrepreneurial sustainability driver for SMEs location. Applying the structural equation modeling Pu et al. (2021) canvassed for policy formulation and implementation that will enhance effective online financial delivery services that cut across SME operations. Technological adaptation by SMEs is an innovation that makes urban services to be more novel than rural operations and hence the need for government to provide necessary technical apparatus in the rural areas.
According to Fatoki (2018), sustainability is a type of resilience that refers to a person’s capacity to meet and overcome obstacles. It is a sustainable success drive, according to one entrepreneur, which enables business owners to weather the storm and remain forward-thinking in the face of challenging economic and competitive situations. Resilience was shown to have a positive impact on SME activities, even though the results of the descriptive statistics, confirmatory factor analysis, and regression analysis instruments came with the warning that the results of the study might not be a complete reflection of the situation in South Africa. Greenberg et al. (2018) identified the location of an enterprise near family members in rural areas as an instrument of entrepreneurship sustainability for SMEs in that it reduces operational costs, especially at the early stage. It was also said that the majority of SMEs in the agricultural sector employ this sustainability strategy by relocating to rural areas where they can take advantage of the resources they already have, hence reducing production costs. In addition, it was seen as a tactic that fosters rural economies, generates employment opportunities for educated people, and ultimately advances the economy of the country. According to Mayer et al. (2016), a rural enterprise’s capacity to interact with urban customers is an important instrument for entrepreneurship sustainability that can also aid rural residents in achieving economic independence. The findings of the exploratory approach furthered the claim that links between rural and urban entrepreneurship might foster healthy competition.
One major fact from the above review is that government support, business style, and entrepreneurial sustainability constitute major influencers for the SME location. The government had renewed its commitment to —rural-urban migration reduction by enhancing the activities of this sector. While related studies have been carried out in this area, none had examined the contributions of these indices to the —rural-urban location of SMEs in South Africa. To this extent, this study is set out to fill this gap. Consequently, the guiding hypothesis for this study is formulated as government support, business style, and entrepreneurial sustainability are positively related to SME’s location in South Africa’s Mpumalanga Province.

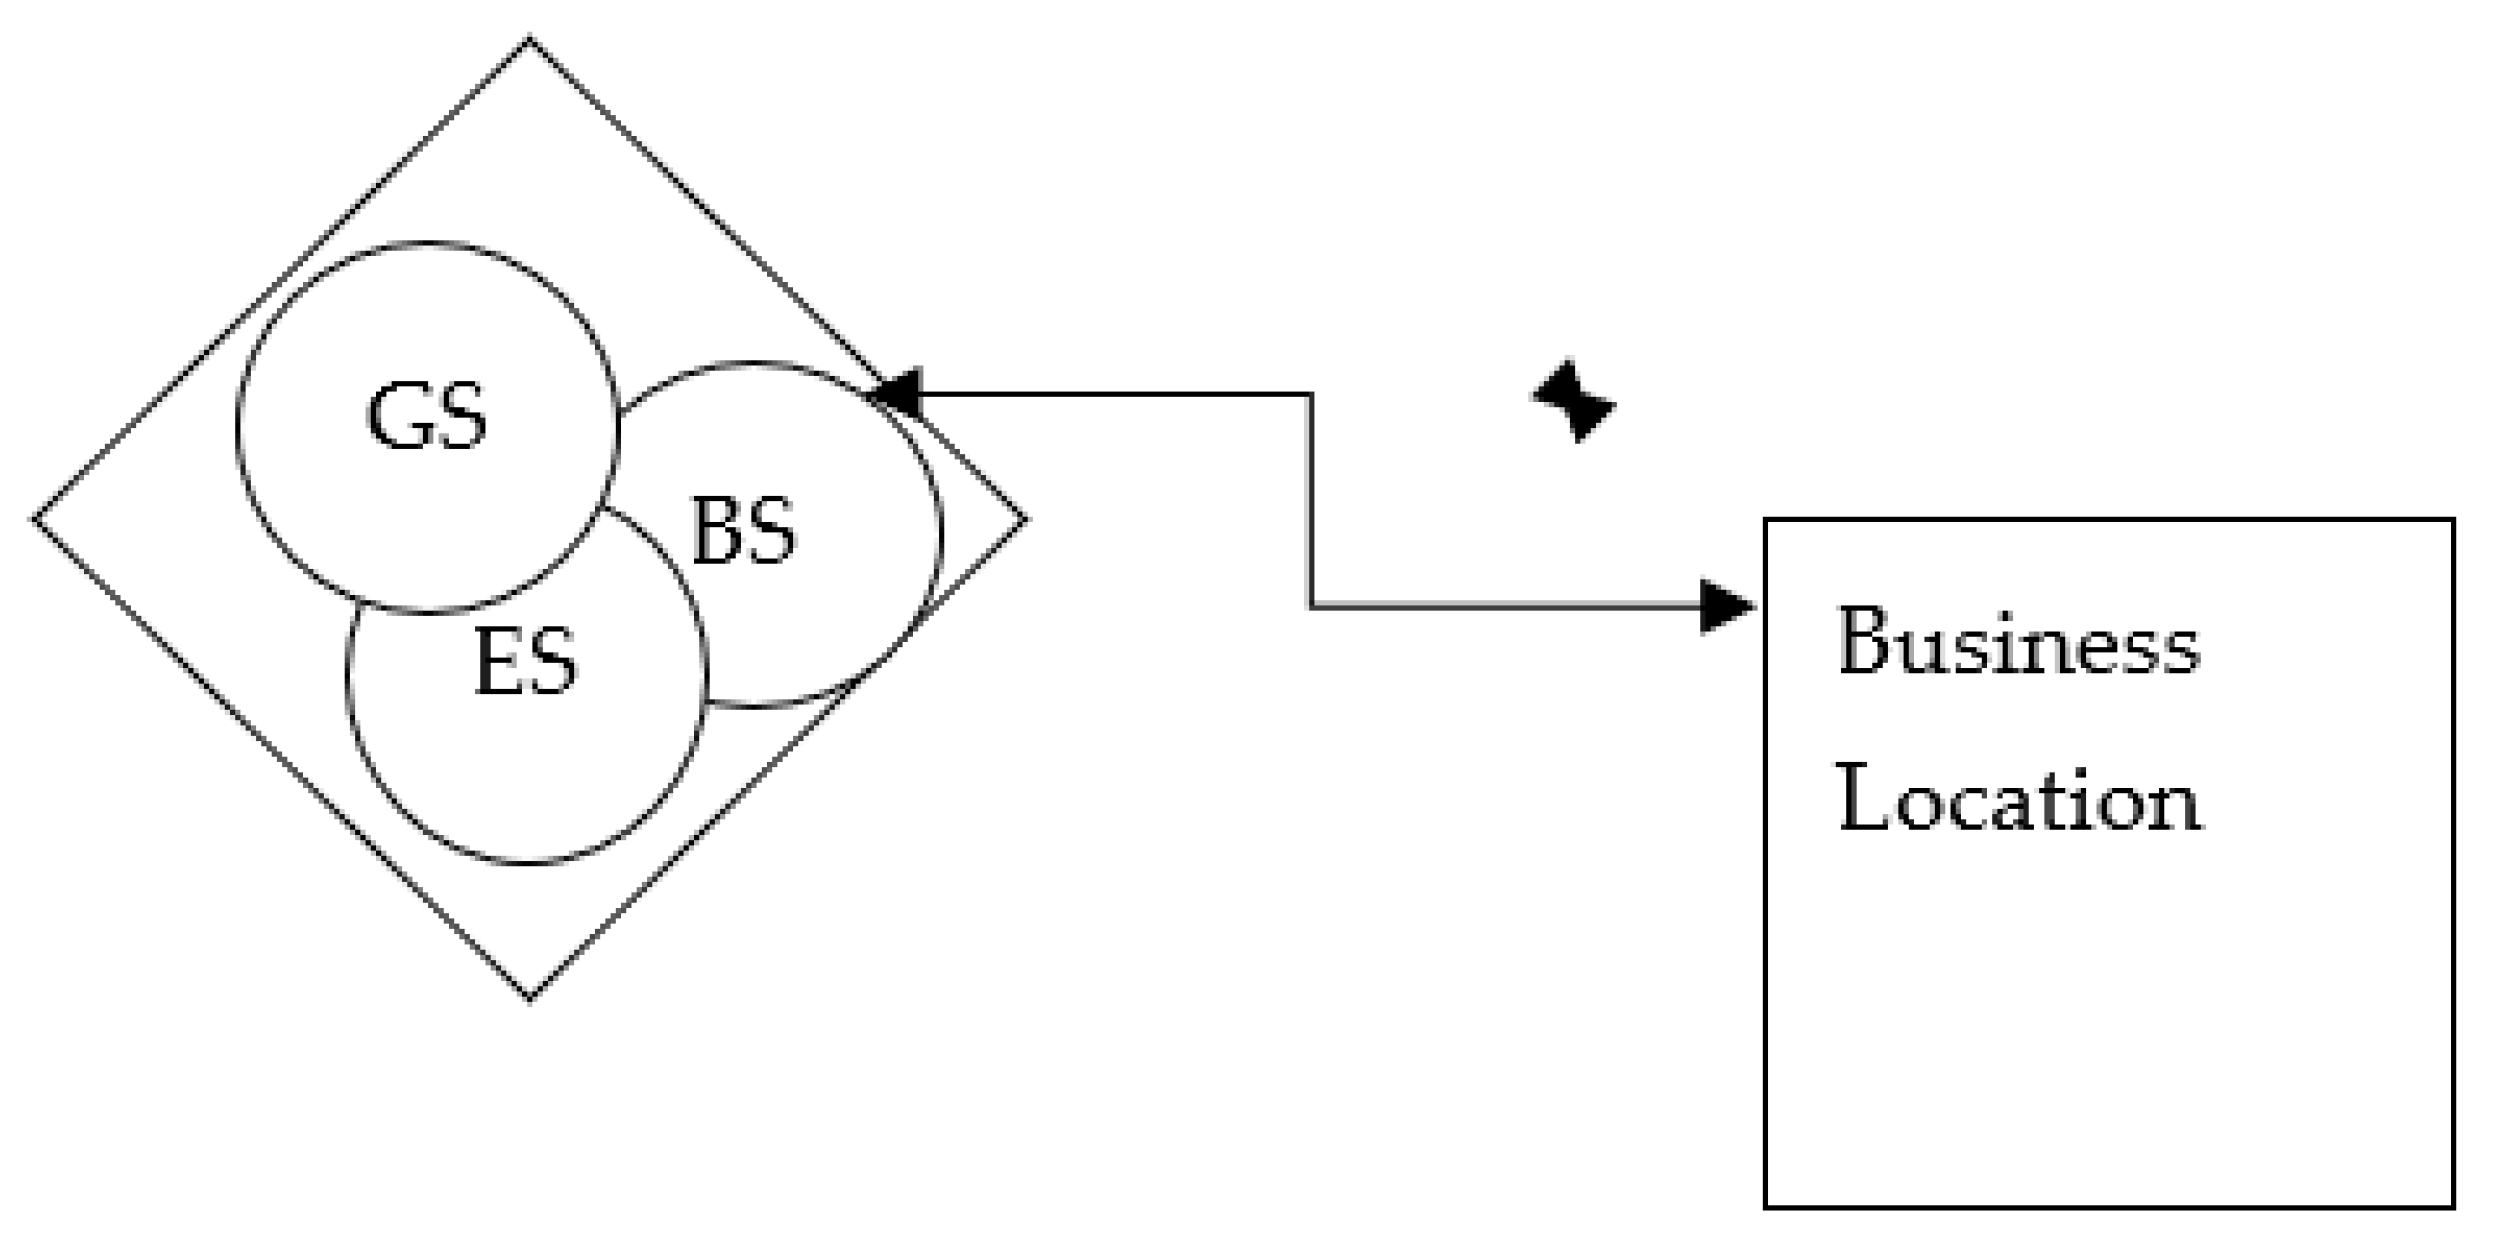
2.4. Conceptual Framework

Figure 1 illustrates how government assistance, corporate culture, and sustained entrepreneurship affect how SMEs operate in diverse sectors. To determine whether the effects of these variables on the activities of SMEs differ depending on whether they are situated in rural, semi-urban, or urban areas, it is necessary to model this relationship. Regardless of whether the citation is in a rural, semi-urban, or urban center, the business style continues to be a significant indicator, in line with Schumpeter’s identification of a growth-maximizing process where firm innovation and profit production are key factors in business location decisions. Goetz and Rupasingha (2009) as adopted by Goetz et al. (2010), knowledge accumulation DTA/dt) that results from the government in the form of finance, training, or subvention (A) and the efficient business style that leads to technological know-how (entrepreneurship sustainability) HA (Acs and Armington 2006).
Hence,
dA/dt = δHAλ Aφ
According to our indices, the parameter δ is the measurement of research efficacy, which is the result of government assistance and entrepreneurship sustainability pushes. Knowledge is represented by and varies endogenously to impact entrepreneurial location decisions. Similarly, support differs by geography (rural, semi-urban, and urban), which, according to our model, is a function of company style coming from workers’ creativity. We proposed a neo-classical entrepreneurial locational decision equation based on the aforesaid framework, in which the decision to locate or relocate is influenced by government support, business style, and entrepreneurship sustainability motivations (Songling et al. 2018). This translates into:
E = f{[πi(Aμ, C) − ωii}
Here, Ei is how an entrepreneur operates at location I, πi is the expected reward from operations, Aμ is knowledge (business style), C is an entrepreneurial region, ωi is wage and salary as a way of sustainability, and θi denotes groups and government support. Government assistance could take the form of funding, education, skill training, or policy control, depending on how each affect the location. According to Goetz et al. (2010), agglomeration economies will differ depending on rural, semi-urban, and urban nearby places. Because SME activity is a means of building an economy rather than simply existing, the government must respect this variability.

3. Data and Methods

To conduct the analysis (stratified approach), a general survey of 1000 active SMEs in South Africa’s Mpumalanga Province was conducted. This article is predicated on the (EU 2003) classification of SMEs as firms with less than 50 employees for small-sized establishments and less than 250 employees for middle-sized businesses. To create our sample, the stratified method was applied. To choose samples for the survey, we first divided the population into strata. We divided the target population into three groups (strata) and then selected samples from each stratum for the survey. The estimated target population is about 10,000. Thus, using a sample size calculator, margin of error of 2%, confidence level of 95%, and 10% population proportion, the sample would be 796. Thus, we distributed 1500 questionnaires. This means 796 or more measurements/surveys are needed to have a confidence level of 95% that the real value is within ±2% of the measured/surveyed value. For this study, we applied a two-fold structured questionnaire.
The questionnaire’s first section concentrated on business types and demographics, while the second segment concentrated on business success elements pertinent to the study’s objectives. The data were also checked for anomalies and contradictions. The results of the Cronbach Alpha test, which measures the internal consistency of instrument sections, and the test–retest reliability method, which assesses the questionnaire’s reliability, produced satisfactory values of 0.70 and 0.875, respectively. The survey was completed using paper survey questionnaires by trained field assistants.
We used SPSS version 25.0 to analyze the data. The analyses, in this case, were divided into three categories: the descriptive, test of assumptions, and results of our multiple ANOVA. A level of 5% was used to define the significance level. From the descriptive statistics in Table 1, the possibility of the violation of normality or equality of variance did not matter. This is because of the total number of cells (i.e., 9) as against the minimum required number of 3. By implication, the number of cells for rural, semi-urban, and urban locations has 3 each while the independent variables (i.e., GS, BP, and ES) are 3.
The descriptive analyses of the Mpumalanga respondents who participated are shown in Table 1. A total of 53.9% of respondents were male, and 46.1% were female, according to the data. Secondary school graduates make up the largest percentage of the population (46.6%), followed by those with tertiary education (36.2%) and primary school graduates (10.4%). There was overwhelming evidence in favor of married women and against divorces when it comes to marital status. This was noteworthy because it demonstrates how most men encouraged their spouses to pursue their businesses. Additionally, the most active SMEs were those with an average age of under five (5) years in business, while the least active SMEs were those with more than ten (10) years in operation. A total of 53.9% of firms were registered, compared to 46.1% of unregistered businesses. This suggests that a bigger proportion of SMEs lack data with the government, which could lower tax collection for the government. Finally, the SMEs were mostly but equally distributed between rural (34.7%) and urban (34.7%) regions. A total of 30.5% of the population resided in rural areas.

Analytical Technique: MANOVA

When there are multiple dependent variables, multivariate analysis of variance (MANOVA) is an extension of the analysis of variance. The dependent variables should, in general, be connected in some way or have some conceptual purpose for being considered together. MANOVA examines the groups and determines if the mean differences in the dependent variables between the groups are likely to have arisen by chance. MANOVA does this by generating a new summary dependent variable that is a linear combination of the original dependent variables. The new combined dependent variable is then used in an analysis of variance. On this composite dependent variable, as well as the univariate outcomes for each of the dependent variables separately, MANOVA assesses whether there is a significant difference between the groups. Because conducting many experiments (ANOVA) indicates the potential for an "inflated Type 1 mistake", MANOVA is favored. This implies that even in the absence of any differences between the groups, the more studies that are conducted, the greater the likelihood that a meaningful result would be discovered. The advantage of MANOVA is that it takes into consideration the increased likelihood of a Type 1 error.
The multivariate analysis of variance, often abbreviated as MANOVA is arranged in a randomized design as:

4. Results

4.1. Contextual Analysis

The crosstabs summary is shown in Table 2 below.
The cross-sectional link between government support scores and geography is seen in Table 3 above. A total of 51.7%, 68.4%, and 45.3% of SMEs in rural, semi-urban, and metropolitan areas, respectively, received little government assistance. Similar to metropolitan areas, rural areas have high government support in proportions of 48.3%, 31.6%, and 54.7%, respectively. Comparatively, a bigger proportion of SMEs with little government support are found in rural and semi-urban areas than those with substantial government backing. On the other hand, more urban-based SMEs (54.7%) receive high government support than those that receive low government support (45.3%). This shows that the effects of government support on businesses located in rural, semi-urban, and urban areas differ across the board with varying degrees. However, Nguyen et al. (2018) and Simarasi et al. (2021) opined that distance and ease of accessing finance by SMEs differ from one location to another.
Table 4 above illustrates the relationship between business plan score and SME location in rural, semi-urban, and metropolitan locations. It demonstrates that the proportion of SMEs without a structured business plan in rural areas (67.7%) is greater than the proportion of SMEs with a structured business plan (32.3%). Furthermore, compared to 40.2% and 45.9% for unstructured business plans, respectively, 59.8% and 54.1% of SMEs in semi-urban and urban areas utilize structured business plans. This suggests that SMEs in semi-urban and urban areas had more structured than unstructured business plans than those in rural or semi-rural settings. Because of the easier access to improved skill acquisition, SMEs in semi-urban and urban areas should have more defined business plans than those in rural areas. Songling et al. (2018) proposed skill learning as a tool for business expansion in the face of population growth. As a result, the business plan relationship between semi-urban and urban SMEs is the same, however, the business plan relationship in rural areas is different.
The association between sustainable entrepreneurship and SME location is shown cross-sectionally in Table 5. The relationship between government assistance and business location follows the same pattern. SMEs with low sustainable entrepreneurship were more prevalent in rural and semi-urban areas than those with high sustainable entrepreneurship. However, SMEs in rural regions with poor sustainable entrepreneurship have a higher percentage (58.6%) than SMEs in urban areas with high sustainable entrepreneurship (41.1%). Once more, these impacts vary somewhat between portions. Environmental and financial concerns vary from place to place occasionally. These two major factors were identified by Ogujiuba et al. (2021a) and Ogujiuba et al. (2021b) as the driving forces for sustainable entrepreneurship. Fatoki (2018) argued that the business resilience to environmental changes influences its operation and will also determine its survival.

4.2. MANOVA

General Linear Model [MANOVA]

If the sample data violates the condition of homogeneity of variance-covariance matrices, it is shown in the output box titled box’s test of equality of covariance matrices (Table 6). The assumption is not broken if the sig. value was greater than 0.001. The sig is less than 0.001 in this instance, indicating a potential violation. However, Tabachnick and Fidell (2001) caution that, as in this case, Box’s M can tend to be overly severe when a high sample size is used. As a result, in the analysis that followed, we established a rigorous degree of acceptance for our F Ratio. Nimon (2012) stressed the significance of testing the group variance and covariance matrix assumptions to support the pooling of the error variances across the groups. Box’s M test for equivalence of covariance matrices is a parametric test that is meant for multivariate sample variation comparison. It checks for the possibility that two or more covariance matrices are homogeneous.
The data in Table 7 above demonstrate that our N values are accurate and match our sample. We refer to these N numbers as our “cell sizes” (Assumption 1 of MANOVA). Three cases are the bare minimum that must be present in each cell (the number of dependent variables). There are three levels of our independent variable—rural/semi-urban/urban—and three dependent variables for each in our total of nine cells. In this analysis, we have more subjects (cases) than dependent variables in each cell. Any deviations from normality or equality of variance that may exist will not have a significant impact given that our N is greater than 30.
Based on a linear combination of the dependent variables, this set of multivariate significance tests reveals if there are statistically significant differences between groups. The data include Wilks’ Lambda, Hotelling’s Trace, and Pillai’s Trace. One of the statistics that is most frequently reported is Wilks’ Lambda. For general use, Tabachnick and Fidell (2001) advise using Wilks’ Lambda. Since we had no data issues (such as a short sample size, unequal N values, or assumption violations), we did not take the Pillai’s into consideration (Tabachnick and Fidell 2001). The row labeled with the name of our independent variable in the second portion of the Multivariate Tests table in Table 8 above has the value of interest (Wilks’ Lambda) (in this case, Location). The decision rule says that there is a difference between the groups if the significance level is below 0.05. Wilks’ Lambda was 0.877 in our analysis, and its significance level was less than 0.001. This is less than 0.05, showing that there is a statistically significant difference in the three categories (rural, semi-urban, and urban) in terms of company success.
Levene’s test of equality of error variances is the following post-test evaluation shown in Table 9 below. The equality of error variances for that variable has been broken if the significance is less than 0.05. While the business plan had significant values, two of the variables had non-significant values. Thus, to a certain extent, we can assume equal variances. As a result, to assess the significance of that variable in the univariate F-test, we used a more conservative alpha threshold. Tabachnick and Fidell (2001) suggest using an alpha of 0.025 or 0.01 rather than the usual 0.05 level if any variable is violated.
Further analysis of our dependent variables in Table 10 above is because the multivariate test of significance yielded a significant result for the dependent measures. This data are available in the tests of the between-subject effects output box. We used a higher alpha level to reduce the possibility of a Type 1 error (finding a significant result when there is not one) because we are looking at several separate analyses here. We used the Bonferroni correction method. In its most basic form, this entails dividing our original alpha level of 0.05 by the number of analyses we intend to conduct (see Tabachnick and Fidell 2001). Because we had three dependent variables to investigate in this case, we divided 0.05 by three, yielding a new alpha level of 0.017. Because the probability value (Sig.) was less than 0.017, we thus believed that our findings were significant. Our independent variable is marked on the third set of data in a row in the Tests of Between-Subjects Effects box (in this case, Location). There is a list of all of our dependent variables, together with the univariate F, df, and Sig. values for each one. Similar to a typical one-way analysis of variance, this is interpreted. Significant values in the sig. column are those with values less than 0.017 (our new corrected alpha threshold). In our scenario, every variable (recorded a significance value less than our cut-off, less than 0.001) for which we had data. The partial eta squared effect size statistic, is used to evaluate the significance of the influence of location on our dependent variables. Partial eta squared is a mathematical expression that shows how much of the variance in the dependent variable can be explained by the independent variable. The business plan, government support, and sustainable entrepreneurship in this instance had values of 0.029, 0.063, and 0.018, respectively. According to commonly accepted standards (Cohen 1988), these numbers show a moderate impact on government assistance (6.3%), but a minimal impact on business support and sustainable entrepreneurship (2.9% and 1.8%, respectively). The percentage of the variance in our dependent variable scores that can be accounted for by location is explained here.
In terms of business planning, government backing, and sustainable entrepreneurship, rural, semi-urban, and urban SMEs vary. The output table (Table 11)—e “estimated marginal means” section gives the magnitudes and precise differences. In terms of the business plan score, rural areas scored 10.824, semi-urban areas scored 12.295 and urban areas scored 11.584; in terms of the government support score, rural areas scored 9.435, semi-urban areas scored 7.895, and urban areas scored 9.558; and in terms of sustainable entrepreneurship, rural areas scored 52.978, semi-urban areas scored 52.247, and urban areas scored 54.597. The actual difference between the three mean scores was quite minor, with fewer than two scale points, although being statistically significant.
According to the aforementioned findings, SMEs in urban, semi-urban, and rural areas differ in terms of their business plans. Finally, there was a difference in sustainable entrepreneurship between rural and urban, urban and semi-urban, but not between semi-urban and rural as shown in Table 12 above. In addition, there was a difference in government assistance between rural and semi-urban, semi-urban and urban-based SMEs, but not between rural and urban.
To ascertain whether there is a statistically significant difference between the groups, several multivariate tests are used in the other tests. The four multivariate statistical significance tests for the entire model were shown in these tests. They are Roy’s most characteristic root, the Hotelling–Lawley trace, the Pillai–Bartlett trace, and the Wilks’ lambda. Wilk’s lambda test is the most commonly reported of these results. These results are shown in Table 13 below. Not only does it tend to fall in the middle of the other options, but it also accounts for the model’s unexplained variance (Smith et al. 2020). As a result, this test serves as the foundation for our analysis. With a significance level of 0.001, which is less than 0.05, this shows that there is a statistically significant variation in the effects of geography in terms of rural, semi-urban, and urban SME locations. By implication, the findings indicate that government support, business style, and entrepreneurial sustainability all have high significant multivariate effects on the business location of SMEs in South Africa’s Mpumalanga Province.

5. Discussion and Conclusions

The study’s motivation was informed by widespread awareness of the importance of SME activities, particularly in addressing unemployment and poverty alleviation issues. In this study, the location was classified as rural, semi-urban, or urban to address the concerns expressed by Simarasi et al. (2021) that locations with a high cost of doing business are unappealing to entrepreneurs, just as distance and its costs were identified as major barriers to accessing government support by rural SMEs. To start with, the study established that government support has different effects on the three categorized forms of SME location in South Africa. Studies by Simarasi et al. (2021), Greenberg et al. (2018), Nguyen et al. (2018), and Feng et al. (2020) found that the expense of administering government assistance to SMEs varied over time and from location to location provided support for this. Because government programs such as the National Empowerment Funds, Township Rural Entrepreneurs Program, Small Enterprise Finance Agency, and National Youth Development Agency are more prevalent in urban areas than in rural ones, this result was not unexpected in South Africa, as it was in many other nations. Depending on where they are, this will invariably have a different effect on SME operations. The association between geography and business strategies for SME activities showed the same pattern during the investigation period as the relationship between government support and business location. This implies that government assistance and business location affect business strategies in South Africa. The standard of SMEs’ business plans is anticipated to increase with increased access to capital, high-quality education, and skill acquisition and management. This was in line with the findings of Afriyie et al. (2019) and Paudel (2020), who discovered that both the cost and benefits of schooling vary. Because South Africa has regional federalism, education costs vary by region, and this location is important in terms of the benefits of good education and access to finance, which is expected to affect business plans. Sustainable entrepreneurship is an ecosystem index that can make or break a company’s success. Individual entrepreneurs who become sustainable have a sufficient understanding of the environment and social aspects of their operations.
The results of this study also revealed statistically significant differences between the effects of long-term entrepreneurs and the location of an enterprise. This article confirms the trickle-down effects of government support, as have earlier ones. Business location-based inequalities in government support for SMEs also affect how sustainable entrepreneurship is as a means of survival. Studies by Lamoureux et al. (2019) corroborated our findings (2020). However, Fatoki (2018) discovered that an entrepreneur’s resilience and the creation of connections with SMEs in urban areas might minimize this gap. Once more, the efforts of groups such as TREP and SEDA may aid South Africa’s business owners in adjusting to the changing environment.
We contend in this study that the placement of SMEs in South Africa’s rural, semi-urban, and urban areas is influenced by a variety of factors, prominent among which are government support, company style, and long-term entrepreneurship sustainability. Our study’s contribution to business planning support, sustainable entrepreneurship, SME location, and government support highlights the necessity for the government to reevaluate its rural activities to ensure fair support across levels of location. These distinctions are crucial for both the government in deciding what kind of support is best for SMEs in rural, semi-urban, and urban locations, as well as for SME owners in assessing their chances of surviving and other goal-setting successes. The policy implication of this study is that it highlighted the importance of business location in SME activities. To ensure a level playing field and reduce rural–urban migration of SMEs, government financing aid from organizations such as SEDA, TREP, and SEFA should be reviewed to synchronize their services to improve the performance of SMEs in South Africa, regardless of location. With political will, the Small Entrepreneurship Development Agency (SEDA), the Export Marketing and Investment Assistance Scheme (EMIAS), the Agric-Processing Support Scheme (APSS), and the Township Rural Entrepreneurs Program (TREP) should narrow the differences in locational effects of government support. Policymakers and other players need to craft policies and strategies that enhance the growth of the sector despite its location.

Author Contributions

Conceptualization, K.K.O.; Data curation, P.S.; Formal analysis, K.K.O. and E.O.; Investigation, E.O.; Methodology, A.I.A. and P.S.; Project administration, A.I.A. and P.S.; Supervision, K.K.O.; Validation, A.I.A.; Writing—original draft, E.O. and E.B.; Writing—review & editing, K.K.O. and E.B. All authors have read and agreed to the published version of the manuscript.

Funding

This research received no external funding, and the APC was funded by the University of Mpumalanga, South Africa.

Data Availability Statement

Not Applicable.

Conflicts of Interest

The authors declare no conflict of interest.

References

  1. Abioye, Lawal Abdulazeez, Akingbade Waidi Adeniyi, and Williams Babatunde Mustapha. 2017. The Status of Entrepreneurship Support Agencies (ESAs) in Lagos State, Nigeria. Iranian Journal of Management Studies 10: 853–81. [Google Scholar] [CrossRef]
  2. Abramov, Alexander, Alexander Radygin, and Maria Chernova. 2017. State-owned enterprises in the Russian market: Ownership structure and their role in the economy. Russian Journal of Economics 3: 1–23. [Google Scholar] [CrossRef]
  3. Abrham, Josef, Wadim Strielkowski, Milan Vošta, and Jan Šlajs. 2015. Factors that influence the competitiveness of Czech rural small and medium enterprises. Agricultural Economics Czech 61: 450–60. [Google Scholar] [CrossRef]
  4. Acs, Zoltan J., and Catherine Armington. 2006. Entrepreneurship, Geography and American Economic Growth. Cambridge: Cambridge University Press. [Google Scholar]
  5. Afriyie, Samuel, Jianguo Du, and Abdul-Aziz Ibn Musah. 2019. Innovation and marketing performance of SME in an emerging economy: The moderating effect of transformational leadership. Journal of Global Entrepreneurship Research 9: 40. [Google Scholar] [CrossRef]
  6. Ajide, Folorunsho M. 2020. Infrastructure and Entrepreneurship: Evidence from Africa. Journal of Developmental Entrepreneurship 25: 2050015. [Google Scholar] [CrossRef]
  7. AlQershi, Nagwan, Sany Sanuri Mohd Mokhtar, and Zakaria Bin Abas. 2020. Innovative CRM and Performance of SMEs: The Moderating Role of Relational Capital. Journal of Open Innovation Technology Market and Complexity 6: 155. [Google Scholar] [CrossRef]
  8. Bertoni, Fabio, Josearmelo Martí, and Carmelo Reverte. 2018. The impact of government-supported participative loans on the growth of entrepreneurial ventures. Research Policy 48: 371–84. [Google Scholar] [CrossRef]
  9. Cohen, J. 1988. Statistical Power Analysis for the Behavioral Sciences, 2nd ed. Hillside: Lawrence Erlbaum Associates. [Google Scholar]
  10. Cravo, Tulio A., and Caio Piza. 2016. The Impact of Business Support Services for Small and Medium Enterprises on Firm Performance in Low- and Middle-Income Countries: A Meta-Analysis. Policy Research Working Paper. No. 7664. Washington, DC: World Bank. Available online: https://openknowledge.worldbank.org/handle/10986/ (accessed on 5 April 2021).
  11. EU. 2003. European Commission Recommendation of 6 May 2003 Concerning the Definition of Micro, Small and Medium-Sized Enterprises (Text with EEA Relevance) (Notified under Document Number C(2003) 1422). Available online: https://eur-lex.europa.eu/legal-content/EN/TXT/?uri=CELEX:32003H0361 (accessed on 5 April 2021).
  12. Farja, Yanay, Eli Gimmon, and Zeev Greenberg. 2017. The developing in the developed: Rural SME growth in Israel, The International. Journal of Entrepreneurship and Innovation 18: 36–46. [Google Scholar] [CrossRef]
  13. Fatoki, Olawale. 2014. The Causes of the Failure of New Small and Medium Enterprises in South Africa. Mediterranean Journal of Social Sciences 5: 922–27. [Google Scholar] [CrossRef]
  14. Fatoki, Olawale. 2018. The Impact of Entrepreneurial Resilience on the Success of Small and Medium Enterprises in South Africa. Sustainability 10: 2527. [Google Scholar] [CrossRef] [Green Version]
  15. Feng, Yi, Abeer Hassan, and Ahmed A. Elamer. 2020. Corporate governance, ownership structure and capital structure: Evidence from Chinese real estate listed companies. International Journal of Accounting & Information Management, ahead-of-print. [Google Scholar] [CrossRef]
  16. Freeman, Joanne, Chris Styles, and Meredith Lawley. 2012. Does firm location make a difference to the export performance of SMEs? International Marketing Review 29: 88–113. [Google Scholar] [CrossRef]
  17. Goetz, Stephan J., and Anil Rupasingha. 2009. Determinants of growth in non-farm proprietor densities in the US, 1990–2000. Small Business Economics 32: 425–38. [Google Scholar] [CrossRef]
  18. Goetz, Stephan J., Mark Partridge, Steven C. Deller, and David A. Fleming. 2010. Evaluating U.S. Rural Entrepreneurship Policy. The Journal of Regional Analysis and Policy 40: 20–33. [Google Scholar]
  19. Greenberg, Zeevik, Yanay Farja, and Eli Gimmon. 2018. Embeddedness and growth of small businesses in rural regions. Journal of Rural Studies 62: 174–82. [Google Scholar] [CrossRef]
  20. Hamann, Ralph, James Smith, Pete Tashman, and R. Scott Marshall. 2015. Why Do SMEs Go Green? An Analysis of Wine Firms in South Africa. Business & Society 56: 1–34. [Google Scholar] [CrossRef]
  21. Iskandar, Takiah Mohd, Nor Hazwani Hassan, Zuraidah Mohd Sanusi, and Zakiah Muhammadun Mohamed. 2017. Board of Directors and Ownership Structure: A Study on Small and Medium Enterprises (SMEs) in Malaysia. Jurnal Pengurusan 49: 25–39. [Google Scholar] [CrossRef]
  22. Jia, Caiyan, Xiaoyun Tang, and Zhehan Kan. 2020. Does the Nation Innovation System in China Support the Sustainability of Small and Medium Enterprises (SMEs) Innovation? Sustainability 12: 2562. [Google Scholar] [CrossRef]
  23. Ladzani, Watson, and Godfrey Netswera. 2009. Support for rural small businesses in Limpopo Province, South Africa. Development Southern Africa 26: 225–39. [Google Scholar] [CrossRef]
  24. Lamoureux, Sarah Marie, Hormoz Movassaghi, and Narges Kasiri. 2019. The Role of Government Support in SMEs’ Adoption of Sustainability. IEEE Engineering Management Review 47: 110–14. [Google Scholar] [CrossRef]
  25. Lee, Jong Ha, So Young Sohn, and Yong Han Ju. 2011. How Effective Is Government Support for Korean Women Entrepreneurs in Small and Medium Enterprises? Journal of Small Business Management 49: 599–616. [Google Scholar] [CrossRef]
  26. Masocha, Reginald, and Olawale Fatoki. 2018. The Role of Mimicry Isomorphism in Sustainable Development Operationalisation by SMEs in South Africa. Sustainability 10: 1264. [Google Scholar] [CrossRef]
  27. Mayer, Heike, Antoine Habersetzer, and Rahel Meili. 2016. Rural-Urban Linkages and Sustainable Regional Development: The Role of Entrepreneurs in Linking Peripheries and Centers. Sustainability 8: 745. [Google Scholar] [CrossRef]
  28. Ndesaulwa, Audrey Paul, and Jaraji Kikula. 2016. The Impact of Innovation on Performance of Small and Medium Enterprises (SMEs) in Tanzania: A Review of Empirical Evidence. Journal of Business and Management Sciences 4: 1–6. [Google Scholar] [CrossRef]
  29. Nguyen, Phuong V., Khoa T. Tran, Khanh Hai Dao, and Ho Phi Dinh. 2018. The impact of government support on firm performance in Vietnam: New evidence from a dynamic approach. Asian Academy of Management Journal 23: 101–23. [Google Scholar] [CrossRef]
  30. Nimon, Kim F. 2012. Statistical assumptions of substantive analyses across the general linear model: A mini-review. Frontiers in Psychology 3: 322. Available online: https://www.ncbi.nlm.nih.gov/pmc/articles/PMC3428812 (accessed on 5 April 2021). [CrossRef]
  31. Ntiamoah, Evans Brako, Dongmei Li, and Michael Kwamega. 2016. Impact of Government and Other Institutions’ Support on Performance of Small and Medium Enterprises in the Agribusiness Sector in Ghana. American Journal of Industrial and Business Management 6: 558–67. [Google Scholar] [CrossRef]
  32. Ogujiuba, Kanayo, Ebenezer Olamide, and Isaac Agholor. 2021a. Impact of Sustainable Entrepreneurship Indicators on SMEs Business Success in South Africa. Academy of Entrepreneurship Journal 27: 1–17. [Google Scholar]
  33. Ogujiuba, Kanayo, Ebenezer Olamide, Chinelo Ogujiuba, and Nancy Stiegler. 2021b. Effects of Contextual Factors on Entrepreneurship Success in South Africa: Application of Two-Way Analysis of Variance Design. Academy of Entrepreneurship Journal 27. Available online: https://www.abacademies.org/articles/Effect-of-contextual-factors-on-entrepreneurship-success-in-south-africa-application-of-two-way-1528-2686-27-S3-469.pdf (accessed on 5 April 2021).
  34. Ogujiuba, Kanayo, Ebenezer Olamide, Isaac Agholor, and Estelle Boshoff. 2021c. Are There Gender Differences in Sustainable Entrepreneurship Indicators Amongst SMEs in South Africa? Application of MANOVA. International Journal of Financial Research 12. [Google Scholar] [CrossRef]
  35. Otto, Werner H. 2018. Management of trade credit by small and medium-sized enterprises. Journal of Economic and Financial Sciences 11: a178. [Google Scholar] [CrossRef]
  36. Park, Soonae, In Hyeock Lee, and Jung Eun Kim. 2019. Government support and small- and medium-sized enterprise (SME) performance: The moderating effects of diagnostic and support services. Asian Business & Management 19: 1–26. [Google Scholar] [CrossRef]
  37. Paudel, Samundra. 2020. Leadership Style and Business Performance in Nepali SMEs: The Mediating Role of Entrepreneurship Orientation. Journal of Business and Management Research 3: 1–17. [Google Scholar] [CrossRef]
  38. Pu, Ganlin, Md Qamruzzaman, Ahmed Muneeb Mehta, Farah Naz Naqvi, and Salma Karim. 2021. Innovative Finance, Technological Adaptation, and SMEs Sustainability: The Mediating Role of Government Support during COVID-19 Pandemic. Sustainability 13: 9218. [Google Scholar] [CrossRef]
  39. Sandada, Maxwell, David Pooe, and Manilall Dhurup. 2014. Strategic Planning and Its Relationship with Business Performance Among Small and Medium Enterprises In South Africa. International Business & Economics Research Journal (IBER) 13: 659–70. [Google Scholar] [CrossRef]
  40. Simarasi, Nastaran, Kaveh Moghaddam, and David W. Williams. 2021. Antecedents of business location decisions: The case of aspiring immigrant opportunity entrepreneurs. Journal of Small Business and Enterprise Development 107: 2411–502. [Google Scholar] [CrossRef]
  41. Smith, Kendal N., Kristen N. Lamb, and Robin K. Henson. 2020. Making Meaning out of MANOVA: The Need for Multivariate Post Hoc Testing in Gifted Education Research. Gifted Child Quarterly 64: 41–55. [Google Scholar] [CrossRef]
  42. Songling, Yang, Muhammad Ishtiaq, Muhammad Anwar, and Hamid Ahmed. 2018. The Role of Government Support in Sustainable Competitive Position and Firm Performance. Sustainability 10: 3495. [Google Scholar] [CrossRef]
  43. Tabachnick, Barbara G., and Linda S. Fidell. 2001. Using Multivariate Statistics, 4th ed. Needham: Allyn & Bacon. [Google Scholar]
  44. Urban, Boris, and Reggie Naidoo. 2012. Business sustainability: Empirical evidence on operational skills in SMEs in South Africa. Journal of Small Business and Enterprise Development 19: 146–63. [Google Scholar] [CrossRef]
  45. Xiang, Dong, and Andrew C. Worthington. 2017. The impact of government financial assistance on the performance and financing of Australian SMEs. Accounting Research Journal 30: 447–64. [Google Scholar] [CrossRef]
  46. Zhou, Helper, and Victor Gumbo. 2021. Rural-Urban Comparison of Manufacturing SMMEs Performance in KwaZulu Natal Province, South Africa. African Journal of Development Studies 11: 7–31. [Google Scholar] [CrossRef]
  47. Zindiye, Stanislous, Norman Chiliya, and Reginald Masocha. 2012. The impact of Government and other Institutions’ support on the Performance of Small and Medium Enterprises in the Manufacturing Sector in Harare, Zimbabwe. International Journal of Business and Economics Research 3: 655–67. [Google Scholar]
Figure 1. Conceptual framework. GS—government support. BS—business style. ES—entrepreneurial sustainability.
Admsci 12 00117 g001
Table 1. Descriptive statistics/demographics of respondents.
GenderLevel of EducationMarital StatusAge of BusinessRegistered BusinessLocation of Business
NValid953953945946947953
Missing551312115
Gender
FrequencyPercentValid PercentCumulative Percent
ValidMale51453.753.953.9
Female43945.846.1100.0
Total95399.5100.0
Missing System50.5
Total958100.0
Level of Education
FrequencyPercentValid PercentCumulative Percent
ValidPrimary9910.310.410.4
Secondary44446.346.657.0
Tertiary34536.036.293.2
Other656.86.8100.0
Total95399.5100.0
Missing System50.5
Total958100.0
Marital Status
FrequencyPercentValid PercentCumulative Percent
ValidSingle39341.041.641.6
Married44646.647.288.8
Divorced363.83.892.6
Widowed707.37.4100.0
Total94598.6100.0
Missing System131.4
Total958100.0
Age of Business
FrequencyPercentValid PercentCumulative Percent
ValidLess than 5 years29130.430.830.8
Between 5–8 years26627.828.158.9
Between 8–10 years23424.424.783.6
Above 10 years15516.216.4100.0
Total94698.7100.0
Missing System121.3
Total958100.0
Registered Business
FrequencyPercentValid PercentCumulative Percent
ValidYes Registered51053.253.953.9
Not Registered43745.646.1100.0
Total94798.9100.0
Missing System111.1
Total958100.0
Business Location
FrequencyPercentValid PercentCumulative Percent
ValidRural33134.634.734.7
Urban33134.634.769.5
Semi-Urban29130.430.5100.0
Total95399.5100.0
Missing System50.5
Total958100.0
Table 2. Crosstabs (case processing summary).
ValidCases MissingTotal
NPercentNPercentNPercent
Govt Support Score * Location of Business95399.5%50.5%958100.0%
Business Plan Score * Location of Business95399.5%50.5%958100.0%
Sustainable Entrepreneurship
(Financial + Social + Environment) * Location of Business
90794.7%515.3%958100.0%
Table 3. Government support score * location of business crosstabulations.
Location of Business
RuralUrbanSemi-UrbanTotal
Government Support≤9 [Low Govt Support]Count171150199520
% Within Location of Business51.7%45.3%68.4%54.6%
10+ [High Govt Support]Count16018192433
% Within Location of Business48.3%54.7%31.6%45.4%
TotalCount331331291953
% Within Location of Business100.0%100.0%100.0%100.0%
Chi-Square Tests
ValuedfAsymptotic Significance (2-sided)
Pearson Chi-Square34.962 a2<0.001
Likelihood Ratio35.6022<0.001
Linear-by-Linear Association16.1261<0.001
N of Valid Cases953
a. 0 cells (0.0%) have an expected count of less than 5. The minimum expected count is 132.22.
Symmetric Measures
ValueAsymptotic Standard Error aApproximate T bApproximate Significance
Interval by IntervalPearson’s R−0.1300.032−4.048<0.001 c
Ordinal by OrdinalSpearman Correlation−0.1280.032−3.966<0.001 c
N of Valid Cases953
a. Not assuming the null hypothesis.
b. Using the asymptotic standard error assuming the null hypothesis.
c. Based on normal approximation.
Table 4. Business plan score * location of business.
Location of Business
RuralUrbanSemi-UrbanTotal
Business Support≤11 [Unstructured Business Plan]Count224152117493
% Within Location of Business67.7%45.9%40.2%51.7%
12+ [Structured Business Plan]Count107179174460
% Within Location of Business32.3%54.1%59.8%48.3%
TotalCount331331291953
% Within Location of Business100.0%100.0%100.0%100.0%
Chi-Square Tests
ValuedfAsymptotic Significance (2-sided)
Pearson Chi-Square53.645 a2<0.001
Likelihood Ratio54.5632<0.001
Linear-by-Linear Association48.0401<0.001
N of Valid Cases953
a. 0 cells (0.0%) have an expected count of less than 5. The minimum expected count is 140.46.
Symmetric Measures
ValueAsymptotic Standard Error aApproximate T bApproximate Significance
Interval by IntervalPearson’s R0.2250.0317.109<0.001 c
Ordinal by OrdinalSpearman Correlation0.2260.0317.155<0.001 c
N of Valid Cases953
a. Not assuming the null hypothesis.
b. Using the asymptotic standard error assuming the null hypothesis.
c. Based on normal approximation.
Table 5. Sustainable entrepreneurship (financial + social + environment) * location of business crosstabulations.
Location of Business
RuralUrbanSemi-UrbanTotal
Sustainable Entrepreneurship (Financial + Social + Environment)≤53 [Low Sustainable Entrepreneurship]Count190139161490
% Within Location of Business58.6%45.1%58.5%54.0%
≥54+ [High Sustainable Entrepreneurship]Count134169114417
% Within Location of Business41.4%54.9%41.5%46.0%
TotalCount324308275907
% Within Location of Business100.0%100.0%100.0%100.0%
Chi-Square Tests
ValuedfAsymptotic Significance (2-sided)
Pearson Chi-Square14.855 a2<0.001
Likelihood Ratio14.8452<0.001
Linear-by-Linear Association0.04310.836
N of Valid Cases907
a. 0 cells (0.0%) have an expected count of less than 5. The minimum expected count is 126.43.
Symmetric Measures
ValueAsymptotic Standard Error aApproximate T bApproximate Significance
Interval by IntervalPearson’s R0.0070.0330.2070.836 c
Ordinal by OrdinalSpearman Correlation0.0100.0330.2980.766c
N of Valid Cases907
a. Not assuming the null hypothesis.
b. Using the asymptotic standard error assuming the null hypothesis.
c. Based on normal approximation.
Table 6. Subject factors and equality of covariance matrices.
Between-Subject Factors
Value LabelN
Location of Business1Rural324
2Urban308
3Semi-Urban275
Box’s Test of Equality of Covariance Matrices
Box’s M434.458
F36.030
df112
df23,798,068.035
Sig.<0.001
Tests the null hypothesis that the observed covariance matrices of the dependent variables are equal across groups. a
a Design: Intercept + Loc.
Table 7. Descriptive statistics.
Location of BusinessMeanStd. DeviationN
Business Plan ScoreRural10.822.099324
Urban11.582.679308
Semi-Urban12.295.184275
Total11.533.534907
Govt Support ScoreRural9.442.832324
Urban9.563.036308
Semi-Urban7.892.664275
Total9.012.945907
Sustainable Entrepreneurship (Financial + Social + Environment)Rural52.987.264324
Urban54.607.458308
Semi-Urban52.257.098275
Total53.317.338907
Table 8. Multivariate tests a.
ValueFHypothesis dfError dfSig.Partial Eta Squared
InterceptPillai’s Trace0.98317,578.197 b3.000902.0000.0010.983
Wilks’ Lambda0.01717,578.197 b3.000902.0000.0010.983
Hotelling’s Trace58.46417,578.197 b3.000902.0000.0010.983
Roy’s Largest Root58.46417,578.197 b3.000902.0000.0010.983
LocationPillai’s Trace0.12519.9816.0001806.000<0.0010.062
Wilks’ Lambda0.87720.388 b6.0001804.000<0.0010.064
Hotelling’s Trace0.13820.7956.0001802.000<0.0010.065
Roy’s Largest Root0.12537.475 c3.000903.000<0.0010.111
a Design: Intercept + Loc. b Exact statistic. c The statistic is an upper bound on F that yields a lower bound on the Significance Level.
Table 9. Levene’s test of equality of error variances.
Levene Statisticdf1df2Sig.
Business Plan ScoreBased on Mean7.7462904<0.001
Based on Median7.7982904<0.001
Based on Median and with adjusted df7.7982452.884<0.001
Based on trimmed mean6.44929040.002
Government Support ScoreBased on Mean1.27829040.279
Based on Median1.29629040.274
Based on Median and with adjusted df1.2962897.7420.274
Based on trimmed mean1.22929040.293
Sustainable Entrepreneurship (Financial + Social + Environment)Based on Mean0.48329040.617
Based on Median0.59129040.554
Based on Median and with adjusted df0.5912892.6290.554
Based on trimmed mean0.50029040.607
Tests the null hypothesis that the error variance of the dependent variable is equal across groups. a
a Design: Intercept + Loc.
Table 10. Tests of between-subject effects.
SourceDependent VariableType III Sum of SquaresdfMean SquareFSig.Partial Eta Squared
Corrected ModelBusiness Plan Score323.114 a2161.55713.290<0.0010.029
Government Support Score493.382 b2246.69130.286<0.0010.063
Sustainable Entrepreneurship (Financial + Social + Environment)856.679 c2428.3408.079<0.0010.018
InterceptBusiness Plan Score120,798.0561120,798.0569937.4140.0000.917
Government Support Score72,518.296172,518.2968902.8700.0000.908
Sustainable Entrepreneurship (Financial + Social + Environment)2,562,146.54312,562,146.54348,326.1360.0000.982
LocationBusiness Plan Score323.1142161.55713.290<0.0010.029
Government Support Score493.3822246.69130.286<0.0010.063
Sustainable Entrepreneurship (Financial + Social + Environment)856.6792428.3408.079<0.0010.018
ErrorBusiness Plan Score10,988.91990412.156
Govt Support Score7363.5299048.145
Sustainable Entrepreneurship (Financial + Social + Environment)47,928.11290453.018
TotalBusiness Plan Score131,850.000907
Government Support Score81,486.000907
Sustainable Entrepreneurship (Financial + Social + Environment)2,626,101.000907
Corrected TotalBusiness Plan Score11,312.033906
Government Support Score7856.911906
Sustainable Entrepreneurship (Financial + Social + Environment)48,784.792906
a R Squared = 0.029 (Adjusted R Squared = 0.026). b R Squared = 0.063 (Adjusted R Squared = 0.061). c R Squared = 0.018 (Adjusted R Squared = 0.015).
Table 11. Estimated marginal means (location of business) estimates.
95% Confidence Interval
Dependent VariableLocation of BusinessMeanStd. ErrorLower BoundUpper Bound
Business Plan ScoreRural10.8240.19410.44411.204
Urban11.5840.19911.19511.974
Semi-Urban12.2950.21011.88212.707
Government Support ScoreRural9.4350.1599.1249.746
Urban9.5580.1639.2399.878
Semi-Urban7.8950.1727.5578.232
Sustainable Entrepreneurship (Financial + Social + Environment)Rural52.9780.40552.18453.772
Urban54.5970.41553.78355.412
Semi-Urban52.2470.43951.38653.109
Table 12. Pairwise comparisons.
95% Confidence Interval for Difference
Dependent Variable(I) Location of Business(J) Location of BusinessMean Difference (I–J)Std. ErrorSig. aLower BoundUpper Bound
Business Plan ScoreRuralUrban−0.760 *0.2770.006−1.305−0.216
Semi-Urban−1.470 *0.286<0.001−2.032−0.909
UrbanRural0.760 *0.2770.0060.2161.305
Semi-Urban−0.710 *0.2890.014−1.278−0.142
Semi-UrbanRural1.470 *0.286<0.0010.9092.032
Urban0.710 *0.2890.0140.1421.278
Government Support ScoreRuralUrban−0.1230.2270.587−0.5690.323
Semi-Urban1.541 *0.234<0.0011.0812.000
UrbanRural0.1230.2270.587−0.3230.569
Semi-Urban1.664 *0.237<0.0011.1992.129
Semi-UrbanRural−1.541 *0.234<0.001−2.000−1.081
Urban−1.664 *0.237<0.001−2.129−1.199
Sustainable Entrepreneurship (Financial + Social + Environment)RuralUrban−1.619 *0.5790.005−2.756−0.482
Semi-Urban0.7310.5970.221−0.4411.903
UrbanRural1.619 *0.5790.0050.4822.756
Semi-Urban2.350 *0.604<0.0011.1653.536
Semi-UrbanRural−0.7310.5970.221−1.9030.441
Urban−2.350 *0.604<0.001−3.536−1.165
Based on estimated marginal means. * The mean difference is significant at the 0.05 level. a Adjustment for multiple comparisons: Least Significant Difference (equivalent to no adjustments).
Table 13. Multivariate and univariate test effects.
Multivariate Tests
ValueFHypothesis dfError dfSig.Partial Eta Squared
Pillai’s trace0.12519.9816.0001806.000<0.0010.062
Wilks’ lambda0.87720.388 a6.0001804.000<0.0010.064
Hotelling’s trace0.13820.7956.0001802.000<0.0010.065
Roy’s largest root0.12537.475 b3.000903.000<0.0010.111
Each F tests the multivariate effect of the location of business. These tests are based on the linearly independent pairwise comparisons among the estimated marginal means.
a Exact statistic
b The statistic is an upper bound on F that yields a lower bound on the significance level.
Univariate Tests
Dependent Variable Sum of SquaresdfMean SquareFSig.Partial Eta Squared
Business Plan ScoreContrast323.1142161.55713.290<0.0010.029
Error10,988.91990412.156
Government Support ScoreContrast493.3822246.69130.286<0.0010.063
Error7363.5299048.145
Sustainable Entrepreneurship (Financial + Social + Environment)Contrast856.6792428.3408.079<0.0010.018
Error47,928.11290453.018
The F tests the effect of the Location of Business. This test is based on the linearly independent pairwise comparisons among the estimated marginal means.
Publisher’s Note: MDPI stays neutral with regard to jurisdictional claims in published maps and institutional affiliations.

