Abstract
Based on the road surface (bridge deck) temperature, relative humidity, air temperature, wind speed and precipitation observed at two road surface meteorological stations and two bridge deck meteorological stations, as well as subsurface temperature at different depths observed at Hefei meteorological station, the independent variables are selected to establish the relationship between these factors and road surface temperature, using random forest and stepwise regression. The performance of these two methods was compared, and the importance of each factor was analyzed. Results show that the road surface (bridge deck) temperature linearly correlates with air temperature. In the case of low air temperature conditions (air temperature ≤ 8 °C), the road surface temperature is mainly higher than air temperature observed at the same station, and the bridge deck temperature is mainly lower than air temperature. In the retrieving of road surface temperature and bridge deck temperature, the random forest algorithm has lower mean absolute error (MAE) and root mean square error (RMSE) than the stepwise regression algorithm, especially in the retrieving of road surface temperature. MAE of road surface temperature retrieved by random forest on two bridge deck stations is reduced by 0.19 °C and 0.26 °C compared with the stepwise regression, and RMSE is reduced by 0.33 °C and 0.49 °C, respectively. The bias in the retrievals can be originated from the model itself and the error in the observations. Among the factors in the random forest model, air temperature is the most important. Meanwhile, there are differences in the importance of each factor in the retrieval of road surface temperature and bridge deck temperature. The subsurface temperature is more important in retrieving road surface temperature, while humidity and wind speed are generally more important to bridge deck temperature. It should be noted that due to the limitation of the observations, this study did not consider the net radiative flux, and the influence of net radiative flux on bridge deck and road surface temperature may be different.
1. Introduction
In recent years, road conditions have been greatly improved, and the mileage of expressways has increased by year with the rapid development of the economy in China. By the end of 2021, the mileage of expressways in China reached 169,100 km. Precipitation in the condition of low air temperature, ice fog and freezing fog could result in road icing [1]. Due to the high speed on the expressway, vehicles are more sensitive to high-impact weather conditions such as road icing [2]. The mechanisms of road icing mainly include hoar frost, freezing fog and frozen precipitation [3], which is mainly influenced by air temperature, cloud fraction and radiation [4,5]. The above-mentioned meteorological factors directly influence road surface temperature [6].
There are many factors that affect the road surface temperature, and it is difficult to achieve a universal retrieving method that is adaptive to road surface temperature in any scenario [7,8,9,10]. Recently, many studies focused on establishing the relationship between air temperature and road surface temperature. However, the existing observations reveal a complex relationship between air temperature and road surface temperature [8,10], and this relationship is influenced by the current and the previous weather conditions, surface conditions, atmospheric radiation, wind speed and direction, etc. [11]. The road surface is directly in contact with the ground. Since the ground temperature has a certain “memory effect”, the road surface temperature is not only closely related to the current weather, but also affected by the previous weather. For example, during the passage of a front, weather preceding the front, temperature difference when the front arrives, arrival time of the front, wind speed and the occurrence of precipitation influence the road surface temperature and air temperature to different degrees. This different impact complicates the relationship between road temperature and air temperature [8]. Moreover, the changing climate will lead to a more complicated change of air temperature in the future [12,13,14], making it more difficult to predict road surface temperature from air temperature. Previous studies have modeled road surface temperature from the perspective of geographical parameters. Results show that the model has the ability to explain up to 72% of the variation in road surface temperature purely by thermally projecting surface temperature using geographical variables [15]. Among all the factors that influence the road surface temperature, radiation is quite important since it complicates the near-surface profile of temperature and humidity [11]. To analyze the influence of radiation on road surface temperature, previous studies have tried different solutions such as numerical simulation [16], establishment of energy balance model [7], classification of cloud coverage [10], etc. However, the current numerical models are not ideal for predicting cloud coverage and aerosol conditions [17]. In recent years, thermal mapping has been widely used in the analysis of road surface temperature [18,19]. Marchetti et al. combined principal components analysis with thermal mapping. Principal components analysis is used to interpolate between individual thermal mapping surveys to build a thermal map, for a wider range of climatic conditions than that permitted by traditional surveys [19]. However, thermal mapping is quite complicated and the thermal mapping features of different road surfaces are different. In addition, the process of heat exchange between the surface and near-surface atmosphere is too complex to be accurately expressed by simple formulas, which also leads to a large difference between the retrieved road surface temperature and the observations. In addition to air temperature, wind speed, humidity and surface temperature should not be neglected [11,20,21]. At present, most studies use statistical methods to retrieve road surface temperature, for example, by establishing regression equations [20,21]. The random forest algorithm developed in recent years not only has advantages in classification, but also in regression problems [22]. At present, the random forest algorithm has been applied to retrieving meteorological factors and has achieved good results [23].
In this study, the ground surface is classified into road surface and bridge deck surface. The relationship between road surface temperature (bridge deck temperature) with air temperature, wind speed, relative humidity, precipitation and subsurface temperature at different depths are established using the random forest algorithm. The importance of each factor and the key meteorological factors affecting the road surface and bridge deck temperature are also analyzed.
2. Data and Methods
Data used in this study mainly include the subsurface temperature at different depths (including 5 cm, 10 cm, 15 cm, 20 cm, 40 cm, 80 cm, 160 cm and 320 cm) at a meteorological observation station located in Hefei City, Anhui Province, China. Other meteorological factors include surface temperature, air temperature, wind speed, relative humidity and precipitation at two road surface stations (referred to as road surface 1 and road surface 2) and two bridge deck stations (referred to as bridge deck 1 and bridge deck 2). Note that surface is used as a general term for road surface and bridge deck surface in this study. The surface temperature is detected by the infrared sensor, which is more reliable than that detected by the traditional surface mounted sensor [24]. All the above-mentioned stations (Figure 1) are located in Hefei, with relatively flat terrain. The temporal coverage of the observations is from 12 November 2021 to 30 March 2022, and the temporal resolution is one hour. According to the time of sunrise and sunset during the winter half year of Hefei, 08:00–17:00 (UTC + 8) is defined as daytime and the other time period of a day is defined as nighttime. To compare the model results, the independent sample test is used to evaluate the model performance. To be specific, 70% of the randomly selected samples are used as the training set and 30% of the samples are used as the test set. The main methods used in this paper include least square method, Pearson correlation, stepwise regression, random forest [25], etc. Mean absolute error (MAE) and root mean square error (RMSE) are introduced to evaluate the error, and t test is used in the correlation significance test. The equations for RMSE and MAE are as follows.
where Oi is the observed surface temperature; Pi is the predicted surface temperature, and n represents the number of samples.
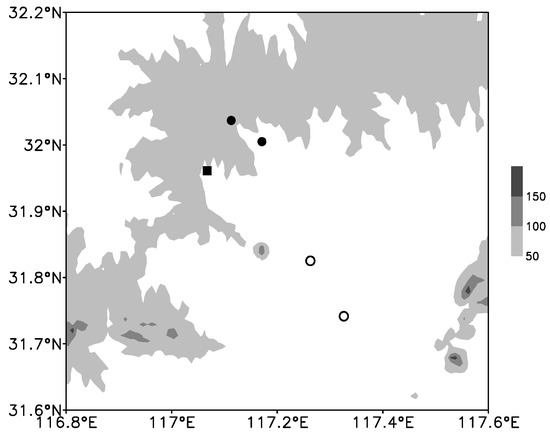
Figure 1.
The spatial distribution of meteorological stations and the surrounding topography. (■: subsurface temperature observational site; ●: road surface station; ○: bridge deck station; shaded area indicates topography, unit: m).
3. Relations between Surface Temperature and Meteorological Factors
3.1. Relations between Surface Temperature and Air Temperature
Air temperature is one of the most important factors affecting ground temperature [24]. Figure 2a,b indicates that surface temperature is significantly correlated with air temperature. The judgment coefficient R2 between road surface temperature and air temperature at the two road surface stations during the daytime is about 0.9, close to that during the nighttime. The linear equation indicates that when the air temperature changes by 1 °C, the change of road surface temperature is about 1.10 °C during the daytime and is about 0.83 °C during the nighttime. Additionally, under the same air temperature, the road surface temperature in the daytime is generally higher than that during the night, which is mainly because the road surface temperature during the daytime is also affected by solar radiation [21]. Figure 2c,d illustrates the linear relationship between the bridge deck temperature and air temperature. Under the same air temperature, the bridge deck temperature is also higher in the daytime than that in the nighttime. The higher surface temperature than air temperature during the daytime is more obvious over the bridge deck than that over the road surface. R2 of bridge deck 1 and 2 are also close in the daytime, which are 0.89 and 0.88, respectively. The bridge deck temperature shows a good agreement with air temperature with R2 being 0.98 and 0.99 at the two stations during the nighttime. Meanwhile, when the air temperature changes by 1 °C, the change of bridge deck temperature at two bridge deck stations reach 1.33 °C and 1.41 °C, respectively.
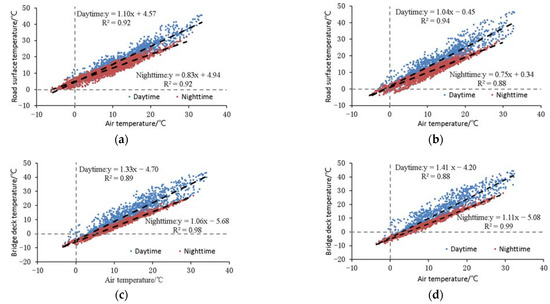
Figure 2.
Distribution of road surface (bridge deck) temperature against air temperature at road surface station 1 (a), road surface station 2 (b), bridge deck station 1 (c) and bridge deck station 2 (d) (● represents daytime; ● represents nighttime; unit: °C).
When air temperature is higher than 8 °C, the surface temperature is above 0 °C for both road surface and bridge deck (Figure 2). When air temperature is lower than or equal to 8 °C, the distribution of road surface temperature and bridge deck temperature against air temperature is shown in Figure 3. The abscissa value in the figure represents the range of ±0.5 °C. For example, 2 °C in the abscissa represents 1.5–2.5 °C. It can be seen under the same air temperature, the surface temperature is higher during the day than at night, which is consistent with the conclusion made from Figure 2. At road surface station 1 (Figure 3a), the road surface temperature is basically above 0 °C. At road surface station 2 (Figure 3b), when the daytime air temperature is around −4 °C or the nighttime air temperature is around −2 °C, the median of the corresponding road surface temperature drops below 0 °C. The change of bridge deck temperature is obviously different (Figure 3c,d). When the daytime temperature of the two bridge deck stations is about 3 °C, the median temperature of the bridge deck is below 0 °C, and when the nighttime air temperature is about 5 °C, the median temperature of the bridge deck is below 0 °C.
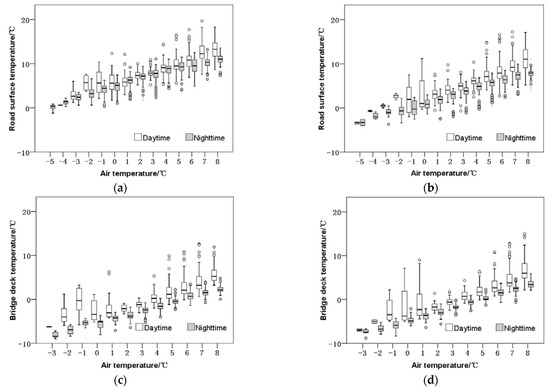
Figure 3.
Box diagram of air temperature against surface temperature at road surface station 1 (a), road surface station 2 (b), bridge deck station 1 (c), bridge deck station 2 (d). (White box is for daytime; gray box is for nighttime. The abscissa value represents a range of ±0.5 °C.)
3.2. Relationship of Surface Temperature with Other Meteorological Factors
The biggest structural difference between bridge deck and road surface lies in that the road surface is directly in contact with the soil and is obviously affected by subsurface temperature, which has a “memory effect” [20]. Hefei Station is the nearest meteorological station with subsurface temperature observations to the four road observation stations. Figure 4 shows the hourly variations of air temperature and subsurface temperature at different depths at Hefei station. The variation of air temperature is the most obvious during the study period, and the variation cycle of subsurface temperature changes with depth. When the depth is less than 20 cm, there is a certain degree of diurnal variation of subsurface temperature. When the depth reaches 40 cm, the subsurface temperature mainly reflects the cycle of weather process, and when the depth reaches 80 cm or more, the variations of subsurface temperature mainly represent the seasonal variation.
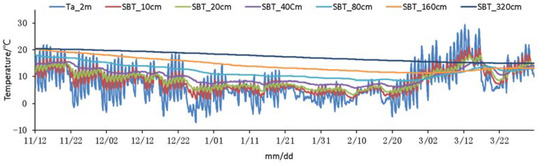
Figure 4.
Variations of hourly air temperature and subsurface temperature at Hefei station from 11 December 2021 to 30 March 2022 (Ta_2m represents air temperature at 2 m; SBT_10 cm, SBT_20 cm, SBT_40 cm, SBT_80 cm, SBT_160 cm, SBT_320 cm represent subsurface temperature at 10 cm, 20 cm, 40 cm, 80 cm, 160 cm and 320 cm).
To quantify the relationship between surface temperature and other meteorological factors, air temperature, relative humidity, wind speed, precipitation and subsurface temperature at various depths of Hefei station were selected. A series of time coefficient was added to distinguish the daytime and the nighttime. Between 8 am–17 pm (UTC + 8) was defined as daytime and was set to be 1, while the remaining period was taken as nighttime and was set to be 0. The descriptions of the variables are shown in Table 1.

Table 1.
Descriptions of meteorological factors.
From the correlation coefficients between surface temperature and meteorological factors shown in Figure 5, surface temperature has the highest correlation with air temperature, and is closely related to mean air temperature, maximum and minimum air temperature in the past 6 h, and minimum temperature in the past 24 h. In addition, the correlation between surface temperature and subsurface temperature decreases with depth, and the highest correlation coefficient is with subsurface temperature at 5 cm depth. The correlation coefficient between surface temperature and the time coefficient also passed the significance level of 0.05, indicating that time factor also has a significant impact on surface temperature. In addition, surface temperature highly correlates with relative humidity, however, correlations between surface temperature and all kinds of precipitation factors are weak.
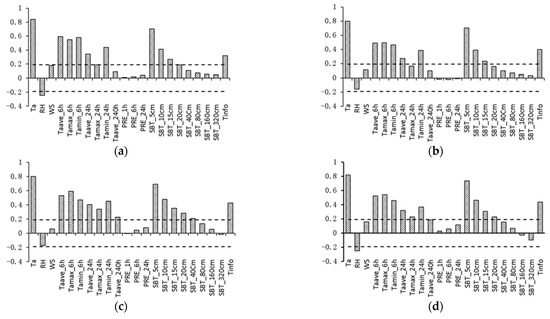
Figure 5.
Correlation coefficient between surface temperature and other meteorological factors at (a) road surface station 1, (b) road surface station 2, (c) bridge deck station 1, (d) bridge deck station 2 (dashed line represent the significant level of 0.05).
4. Surface Temperature Retrieving Model
Taking each factor in Table 1 as the independent variable, the random forest algorithm was used to establish the retrieving model of surface temperature, and the stepwise regression method was used as a comparison. In the stepwise regression, the number of equations passed the significance test is 21, 17, 16 and 9 at road surface station 1, road surface station 2, bridge deck station 1 and bridge deck station 2, respectively. Figure 6 shows the ME and RMSE of the top 15 models with the minimum RMSE (9 for bridge deck 2). On the whole, the fitting error of the equation decreases with the increase in the number of factors. In the fitting of road surface temperature, the errors in the first six equations decrease obviously with the increase in the number of factors, and then slowly decrease. Different from the bridge deck temperature, in the first three equations for bridge deck temperature, the error decreases rapidly with the increase in the number of factors, and then the error shows little decrease with the increase in factors. The error of bridge deck temperature is less than that of road surface temperature when the number of factor is 2 or more. The regression equations of each station were established by combining MSE, RMSE and the complexity of the equation (Table 2).
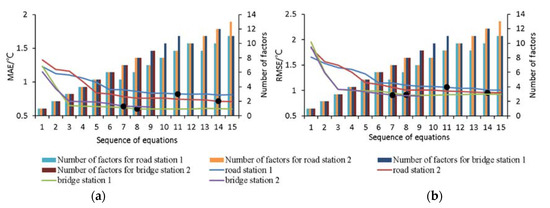
Figure 6.
MAE (a) and RMSE (b) for the stepwise regression models sorted by RMSE in reverse order (line: MAE and RMSE for each model; bar: number of factors in each model; ● selected models).
Table 2.
Stepwise regression models for each station.
The regression coefficients in the stepwise regression equation established in Table 2 are unstandardized regression coefficients, which are the original regression coefficients corresponding to different independent variables in the equation. Unstandardized regression coefficients reflect the effect of each unit change of the independent variable on the dependent variable when other factors remain unchanged. The dependent variable can be predicted by equations constructed with unstandardized regression coefficients and constant terms. However, the unstandardized regression coefficients of different variables were not comparable, so the standardized regression coefficients of each variable were calculated (Table 3). The factors related to air temperature and shallow subsurface temperature have greater effects on the surface temperature, while the factors related to precipitation have a smaller effect. Meanwhile, air temperature is more important in retrieving bridge deck temperature than that of road surface temperature.
Table 3.
The standardized regression coefficients of each factor in the stepwise regression for each site.
In the random forest algorithm, the maximum depth and the number of trees are adjusted. Various combinations of the maximum depth from 2 to 50 and the number of trees from 1 to 200 are traversed. MAE and RMSE of each combination are compared, and the number of trees is set to be 100 and the maximum depth ranges from 10 to 15 (Table 4). The other parameters of the random forest method in Scikit-learn are default.
Table 4.
The parameters in the random forest model at each station.
The random forest algorithm calculates the importance of each factor in reducing RMSE (Figure 7). Air temperature is the most important in all models, and surface temperature is generally more important in road surface temperature models. Relative humidity and wind speed are more important in bridge deck temperature models. The importance of all precipitation factors ranked the last, so precipitation has relatively little influence on surface temperature. It should be noted that precipitation here simply refers to the amount of precipitation. Studies have shown that the phase of precipitation has great influence on road surface temperature [26,27]. The influence of precipitation phase changes is not considered here due to the lack of observations. Meanwhile, the probability of the occurrence of each factor in the stepwise regression equation is calculated and the factors with higher importance in the random forest model have higher probability of occurrence in the stepwise regression. However, there are exceptions for some factors. The subsurface temperature at 10 cm depth is relatively less important in random forest models, but has a high probability of occurrence in stepwise regression algorithms.
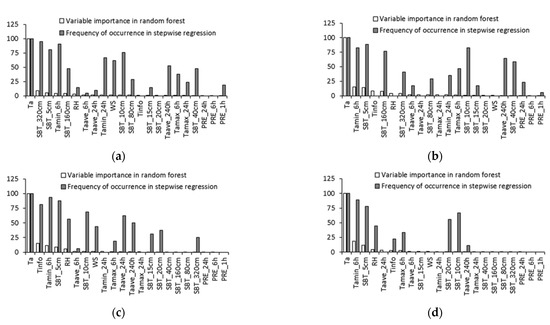
Figure 7.
The importance of each factor in the random forest model (white bar) and the possibility of the occurrence of each factor in step wise regression model (gray bar) at (a) road surface station 1, (b) road surface station 2, (c) bridge deck station 1, (d) bridge deck station 2.
Based on the stepwise regression equation in Table 3 and the random forest model shown in Table 4, the training set was used to establish the model and the test set was used for the test. Figure 8 and Figure 9 show the scatter distribution of observations and retrievals of road surface (bridge deck) temperature using the stepwise regression model and random forest model, respectively. The road surface temperature retrieved by stepwise regression is consistent with the observations (Figure 8). The retrievals of temperature over bridge deck are better than those over road surface, especially near 0 °C. Therefore, the model can accurately retrieve the bridge deck temperature.
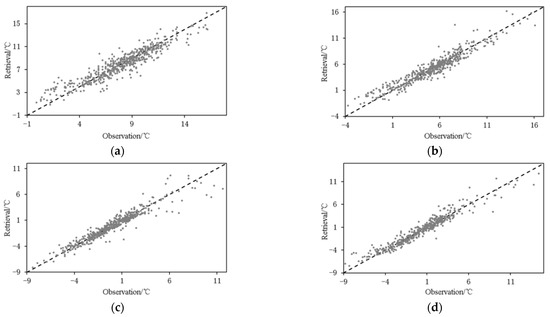
Figure 8.
Scatter plot for observations and retrievals of road surface (bridge deck) temperature using stepwise regression model at road surface station 1 (a), road surface station 2 (b), bridge deck station 1 (c), and bridge deck station 2 (d).
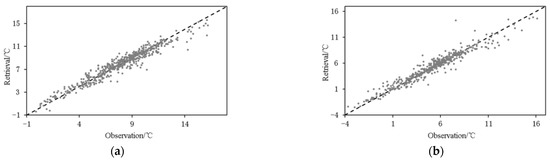
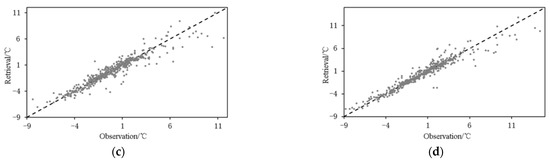
Figure 9.
Scatter plot for observations and retrievals of road surface (bridge deck) temperature using the random forest model at road surface station 1 (a), road surface station 2 (b), bridge deck station 1 (c), and bridge deck station 2 (d).
Compared with the stepwise regression model, the consistency between the observed and retrieved surface temperature using the random forest model is improved to a certain extent (Figure 9), especially in the retrieving of road temperature. In the retrieval of bridge deck temperature, the two models exhibit similar retrieving ability.
The training set was used to establish the model, and the test set was used to calculate MAE and RMSE (Figure 10). MAE of the two road surface stations retrieved by the random forest model are 0.57 °C and 0.53 °C, and RMSE are 0.57 °C and 0.63 °C, respectively. MAE of the two bridge deck stations are 0.59 °C and 0.56 °C, and RMSE are 0.89 °C and 0.87 °C, respectively. The random forest algorithm is superior to the stepwise regression algorithm in both road surface and bridge deck temperature retrieving. Especially in the retrieving of road surface temperature, MAE decreases by 0.19 °C and 0.26 °C, and RMSE decreases by 0.33 °C and 0.49 °C using the random forest model. The bias in the retrievals can be originated from the model itself as well as the error in the observations [28,29]. Meanwhile, the ability of the random forest method in retrieving bridge deck temperature is better than that of road surface, however, the ability of stepwise regression in retrieving road surface temperature is better than that of bridge deck.
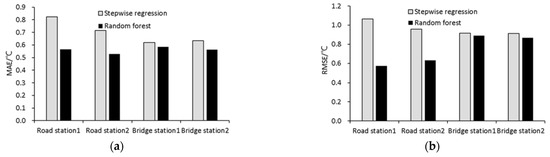
Figure 10.
MAE (a) and RMSE (b) for the stepwise regression and random forest model (gray bar: stepwise regression, black bar: random forest model).
5. Conclusions and Discussion
In this study, we analyze the relationship between surface temperature and air temperature, and establish the models between various meteorological factors and surface temperature using the random forest and stepwise regression method. The performance of the two methods is compared, and the relative importance of each factor in the inversion process is analyzed. Results are as follows:
- (1)
- The road surface (bridge deck) temperature linearly correlates with air temperature. The correlation coefficient at night is higher than that during the day, and is higher at the road surface. Under low temperature conditions (air temperature ≤ 8 °C), the road surface temperature is higher than air temperature, and the bridge deck temperature is lower than the air temperature. When the air temperature is between −4 °C and −2 °C, the median value of road surface temperature falls below 0 °C; when the air temperature is between 3 °C and 5 °C, the median value of bridge deck temperature falls below 0 °C.
- (2)
- The retrieving errors of the random forest model are smaller than those of stepwise regression for both road surface and bridge deck, and the improvement on road surface is more obvious using the random forest model. Compared with stepwise regression, MAE of road surface temperature based on the random forest model are reduced by 0.19 °C and 0.26 °C, respectively, and RMSE are reduced by 0.33 °C and 0.49 °C, respectively. The bias in the retrievals can be originated from the model itself as well as the error in the observations.
- (3)
- Among the factors selected by the random forest model, temperature is the most important. Meanwhile, the importance of each factor is different in the retrieval of road surface and bridge deck temperature. Ground temperature is more important in road surface temperature retrieval, while humidity and wind speed are generally more important in bridge deck temperature retrieval. The precipitation factors are least important in both models.
The correlation between daytime air temperature and road surface temperature (bridge deck surface temperature) is significantly lower than that at night, mainly due to the influence of radiation during the daytime [9,30]. Especially in the precipitation process, the composition of clouds is complex, cloud amount, cloud composition and the time of the occurrence of cloud and precipitation will affect the radiation received by the road surface (bridge deck) [31]. The large variations in radiation lead to a lower correlation during the daytime than the nighttime [9]. There are no radiation observations in the study area, and there are few radiation observation stations in China. The retrieving accuracy of road surface (bridge deck) temperature will be greatly improved if radiation observations can be introduced. Radiation is related not only to road surface temperature but also the formation of fog, which plays an important role in road icing [32].
Author Contributions
Methodology, C.W.; validation, B.J.; data curation, C.W.; funding acquisition, L.F.; resources, J.Z. and J.C.; writing—original draft preparation, C.W. and L.F.; writing—review and editing, B.J.; All authors have read and agreed to the published version of the manuscript.
Funding
This research was funded by the National Key Research and Development program of China (Grant number 2020YFB1600103) and FengYun Application Pioneering Project (Grant number FY-APP-2021.0111).
Institutional Review Board Statement
Not applicable.
Informed Consent Statement
Not applicable.
Data Availability Statement
The data presented in this study are available upon request from the corresponding author.
Acknowledgments
We thank the Hefei Meteorological Bureau for providing observational data.
Conflicts of Interest
The authors declare no conflict of interest.
References
- Gultepe, I.; Heymsfield, A.J.; Gallagher, M.; Ickes, L.; Baumgardner, D. Ice Fog: The current state of knowledge and future challenges. Meteorol. Monogr. 2017, 58, 4.1–4.24. [Google Scholar] [CrossRef]
- Juga, I.; Nurmi, P.; Hippi, M. Statistical modelling of wintertime road surface friction. Meteor. Appl. 2013, 20, 318–329. [Google Scholar] [CrossRef]
- Toms, B.A.; Basara, J.B.; Hong, Y. Usage of existing meteorological data networks for parameterized road ice formation modeling. J. Appl. Meteor. Climatol. 2017, 56, 1959–1976. [Google Scholar] [CrossRef]
- Gultepe, I.; Isaac, G.A.; Rasmussen, R.M.; Ungar, K. A Freezing Fog/Drizzle Event during the FRAM-S Project; SAE Technical Papers; SAE International: Warrendale, PA, USA, 2011. [Google Scholar] [CrossRef]
- Gultepe, I.; Pavolonis, M.; Zhou, B.; Ware, R.; Rabin, R.; Burrows, W.; Milbrandt, J.; Garand, L. Freezing Fog and Drizzle Observations; SAE Technical Papers; SAE International: Warrendale, PA, USA, 2015. [Google Scholar]
- Kangas, M.; Heikinheimo, M.; Hippi, M. Roadsurf: A modelling system for predicting road weather and road surface conditions. Meteor. Appl. 2015, 22, 544–553. [Google Scholar] [CrossRef]
- Jacobs, W.; Raatz, W.E. Forecasting road-surface temperatures for different site characteristics. Meteor. Appl. 1996, 3, 243–256. [Google Scholar] [CrossRef]
- Postgård, U.; Lindqvist, S. Air and road surface temperature variations during weather change. Meteorol. Appl. 2001, 8, 71–84. [Google Scholar] [CrossRef]
- Yang, C.; Yun, D.-G.; Sung, J. Validation of a road surface temperature prediction model using real-time weather forecasts. KSCE J. Civ. Eng. 2012, 16, 1289–1294. [Google Scholar] [CrossRef]
- Kim, Y.-J.; Jee, J.-B.; Kim, G.-T.; Nam, H.-G.; Lee, J.-S.; Kim, B.-J. Diurnal Variations of Surface and Air Temperatures on the Urban Streets in Seoul, Korea: An Observational Analysis during BBMEX Campaign. Atmosphere 2020, 11, 60. [Google Scholar] [CrossRef]
- Jörgen, B.; Torbjörn, G.; Maria, K. Temperature differences in the air layer close to a road surface. Meteorol. Appl. 2001, 8, 385–395. [Google Scholar]
- Monforte, P.; Ragusa, M.A. Temperature Trend Analysis and Investigation on a Case of Variability Climate. Mathematics 2022, 10, 2202. [Google Scholar] [CrossRef]
- Cheshmehzangi, A. The analysis of global warming patterns from 1970s to 2010s. Atmos. Clim. Sci. 2020, 10, 392–404. [Google Scholar] [CrossRef]
- Caloiero, T.; Coscarelli, R.; Ferrari, E.; Sirangelo, B. Trend analysis of monthly mean values and extreme indices of daily temperature in a region of southern Italy. Int. J. Clim. 2017, 37, 284–297. [Google Scholar] [CrossRef]
- Chapman, L.; E Thornes, J.; Bradley, A.V. Modelling of road surface temperature from a geographical parameter database. Part 2: Numerical. Meteorol. Appl. 2001, 8, 421–436. [Google Scholar] [CrossRef]
- Crevier, L.-P.; Delage, Y. METRo: A New Model for Road-Condition Forecasting in Canada. J. Appl. Meteorol. 2001, 40, 2026–2037. [Google Scholar] [CrossRef]
- Xia, X.A.; Wang, P.C.; Chen, H.B.; Liang, F. Analysis of downwelling surface solar radiation in China from National Centers for Environmental Prediction reanalysis, satellite estimates, and surface observations. J. Geophys. Res. 2006, 111, D09103. [Google Scholar] [CrossRef]
- Chapman, L.; Thornes, J.E. The influence of traffic on road surface temperatures: Implications for thermal mapping studies. Meteorol. Appl. 2005, 12, 371–380. [Google Scholar] [CrossRef]
- Marchetti, M.; Chapman, L.; Khalifa, A. New role of thermal mapping in winter maintenance with principal components analysis. Adv. Meteorol. 2014, 2014, 254795. [Google Scholar] [CrossRef]
- Asefzadeh, A.; Hashemian, L.; Bayat, A. Development of statistical temperature prediction models for a test road in Edmonton, Alberta, Canada. Int. J. Pavement Res. Technol. 2017, 10, 369–382. Available online: http://creativecommons.org/licenses/by-nc-nd/4.0/ (accessed on 24 May 2017). [CrossRef]
- Chen, J.; Wang, H.; Xie, P. Pavement temperature prediction: Theoretical models and critical affecting factors. Appl. Therm. Eng. 2019, 158, 113755. [Google Scholar] [CrossRef]
- Ahijevych, D.; Pinto, J.O.; Williams, J.K. Probabilistic forecasts of mesoscale convective system initiation using the random forest data mining technique. Weather Forecast. 2016, 31, 581–599. [Google Scholar] [CrossRef]
- Liu, N.; Yan, Z.; Tong, X.; Jiang, J.; Li, H.; Xia, J.; Lou, X.; Ren, R.; Fang, Y. Meshless Surface Wind Speed Field Reconstruction Based on Machine Learning. Adv. Atmos. Sci. 2022, 39, 1721–1733. [Google Scholar] [CrossRef]
- Jonsson, P.; Riehm, M. Infrared thermometry in winter road maintenance. J. Atmos. Ocean. Technol. 2012, 29, 846–856. [Google Scholar] [CrossRef]
- Breiman, L. Random forests. Mach. Learn. 2001, 45, 5–32. [Google Scholar] [CrossRef]
- Hertl, S.; Schaffar, G. An autonomous approach to road temperature prediction. Meteor. Appl. 1998, 5, 227–238. [Google Scholar] [CrossRef]
- Bouilloud, L.; Martin, E.; Habete, F.; Boone, A.; Le Moigne, P.; Livet, J.; Marchetti, M.; Foidart, A.; Franchistéguy, L.; Morel, S.; et al. Road surface condition forecasting in France. J. Appl. Meteor. Climatol. 2009, 48, 2513–2527. [Google Scholar] [CrossRef]
- Gultepe, I.; Feltz, W.F. Aviation meteorology: Observations and models. Introduction. Pure Appl. Geophys. 2019, 176, 1863–1867. [Google Scholar] [CrossRef]
- Gultepe, I.; Isaac, G.A.; Joe, P.; Kucera, P.A.; Theriault, J.M.; Fisico, T. Roundhouse (RND) Mountain Top Research Site: Measurements and Uncertainties for Winter Alpine Weather Conditions. Pure Appl. Geophys. 2014, 171, 59–85. [Google Scholar] [CrossRef]
- Handler, S.L.; Reeves, H.D.; McGovern, A. Development of a Probabilistic Subfreezing Road Temperature Nowcast and Forecast Using Machine Learning. Weather Forecast. 2020, 35, 1845–1863. [Google Scholar] [CrossRef]
- Lohmann, U.; Humble, J.; Leaitch, W.R. Simulations of ice clouds during FIRE ACE using the CCCMA single-column model. J. Geophys. Res. 2001, 106, 15123–15138. [Google Scholar] [CrossRef]
- Gultepe, I.; Heymsfield, A.J. Ice fog, ice clouds, and remote sensing. Pure Appl. Geophys. 2016, 173, 2977–2982. [Google Scholar] [CrossRef][Green Version]


Publisher’s Note: MDPI stays neutral with regard to jurisdictional claims in published maps and institutional affiliations. |
© 2022 by the authors. Licensee MDPI, Basel, Switzerland. This article is an open access article distributed under the terms and conditions of the Creative Commons Attribution (CC BY) license (https://creativecommons.org/licenses/by/4.0/).