

Sources of Intellectual Capital Acquisition

Abstract
1. Introduction
2. Literature Review
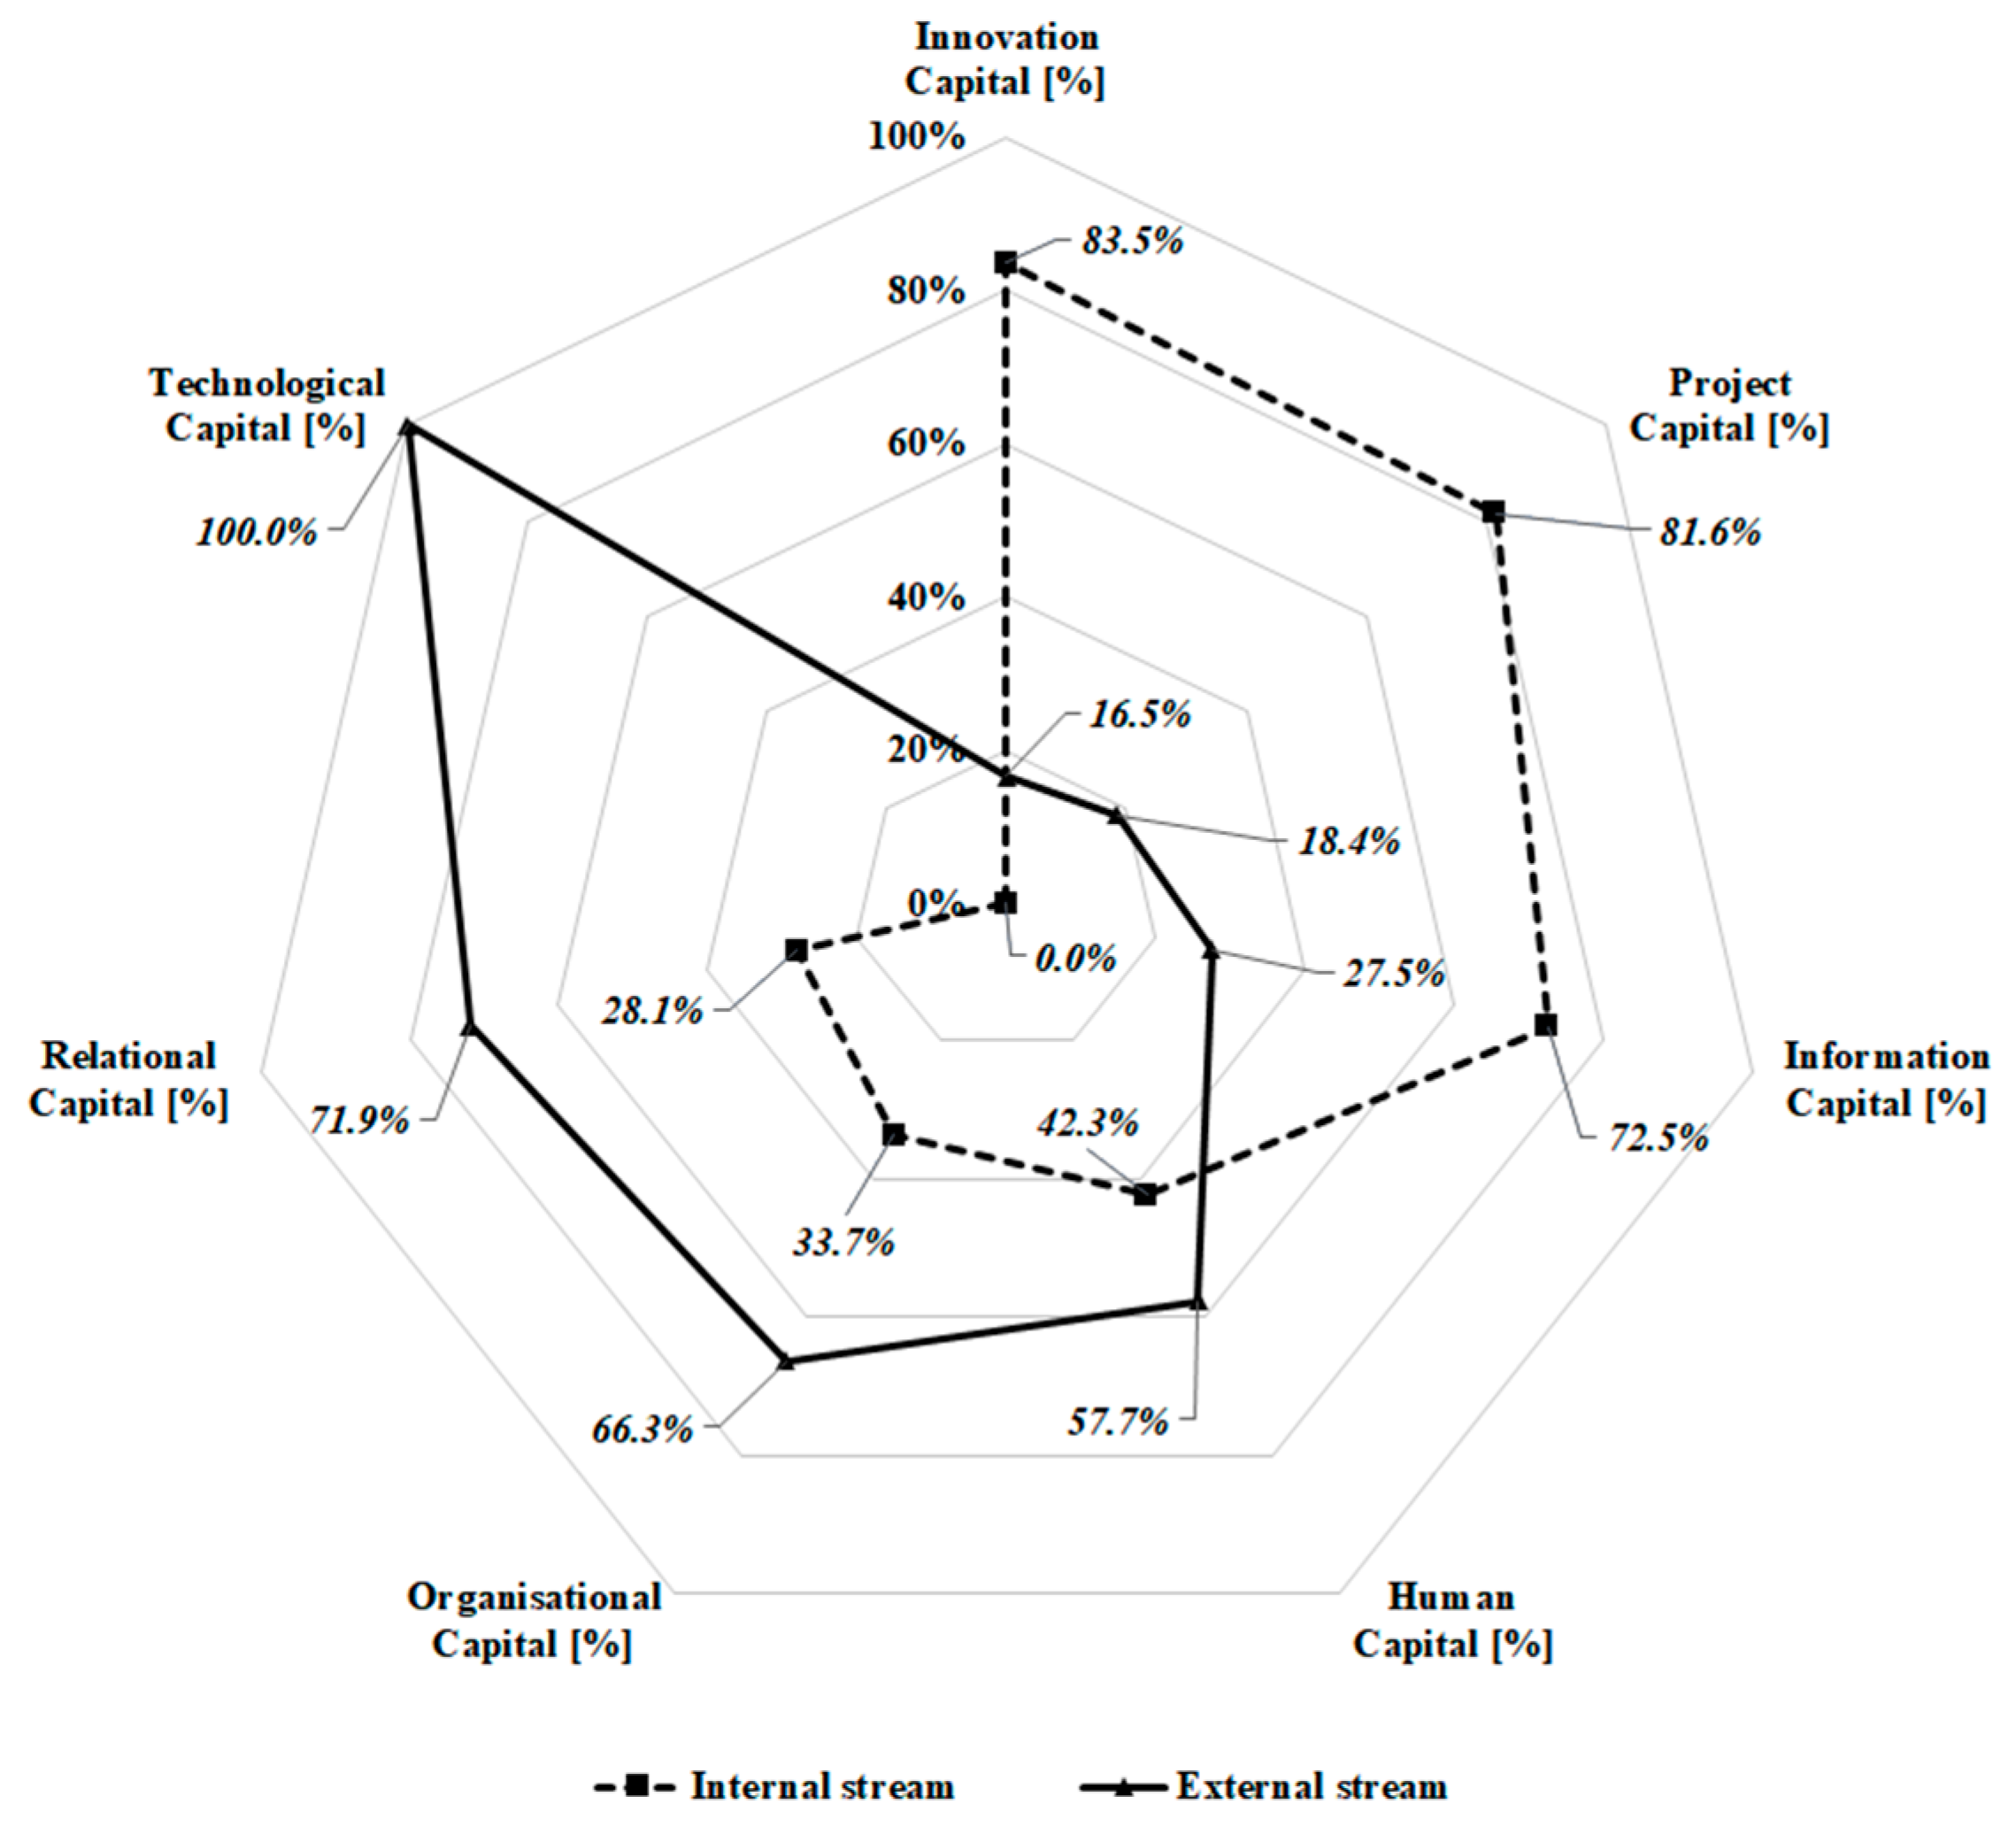
- Human capital consists of knowledge (tacit and explicit), competencies, commitment, cooperation, professional development, values, predisposition and experience.
- Organisational capital consists of structural capital, organisational culture, strategies, decision-making systems and job style.
- Relational capital consists of clients, partners, reputation, internal and external relations, trust, image and brand.
- Project capital consists of operational and supporting processes, employee programs and project management techniques and methods.
- Innovation capital consists of intellectual properties, intangible properties, intangible assets and innovations that have been developed.
- Information capital consists of information systems, formal (descriptive) documentation and information-sharing rules and databases.
- Technological capital consists of technological infrastructure, internal computer networks and technologies that have been developed.
3. Materials and Methods
3.1. The Concept of Open Intellectual Capital Acquisition
3.2. Empirical Data, Research Period and Enterprises Included in the Research
3.3. Characteristics of the Statistical Tools Used in Quantitative Analysis
4. Results and Discussion
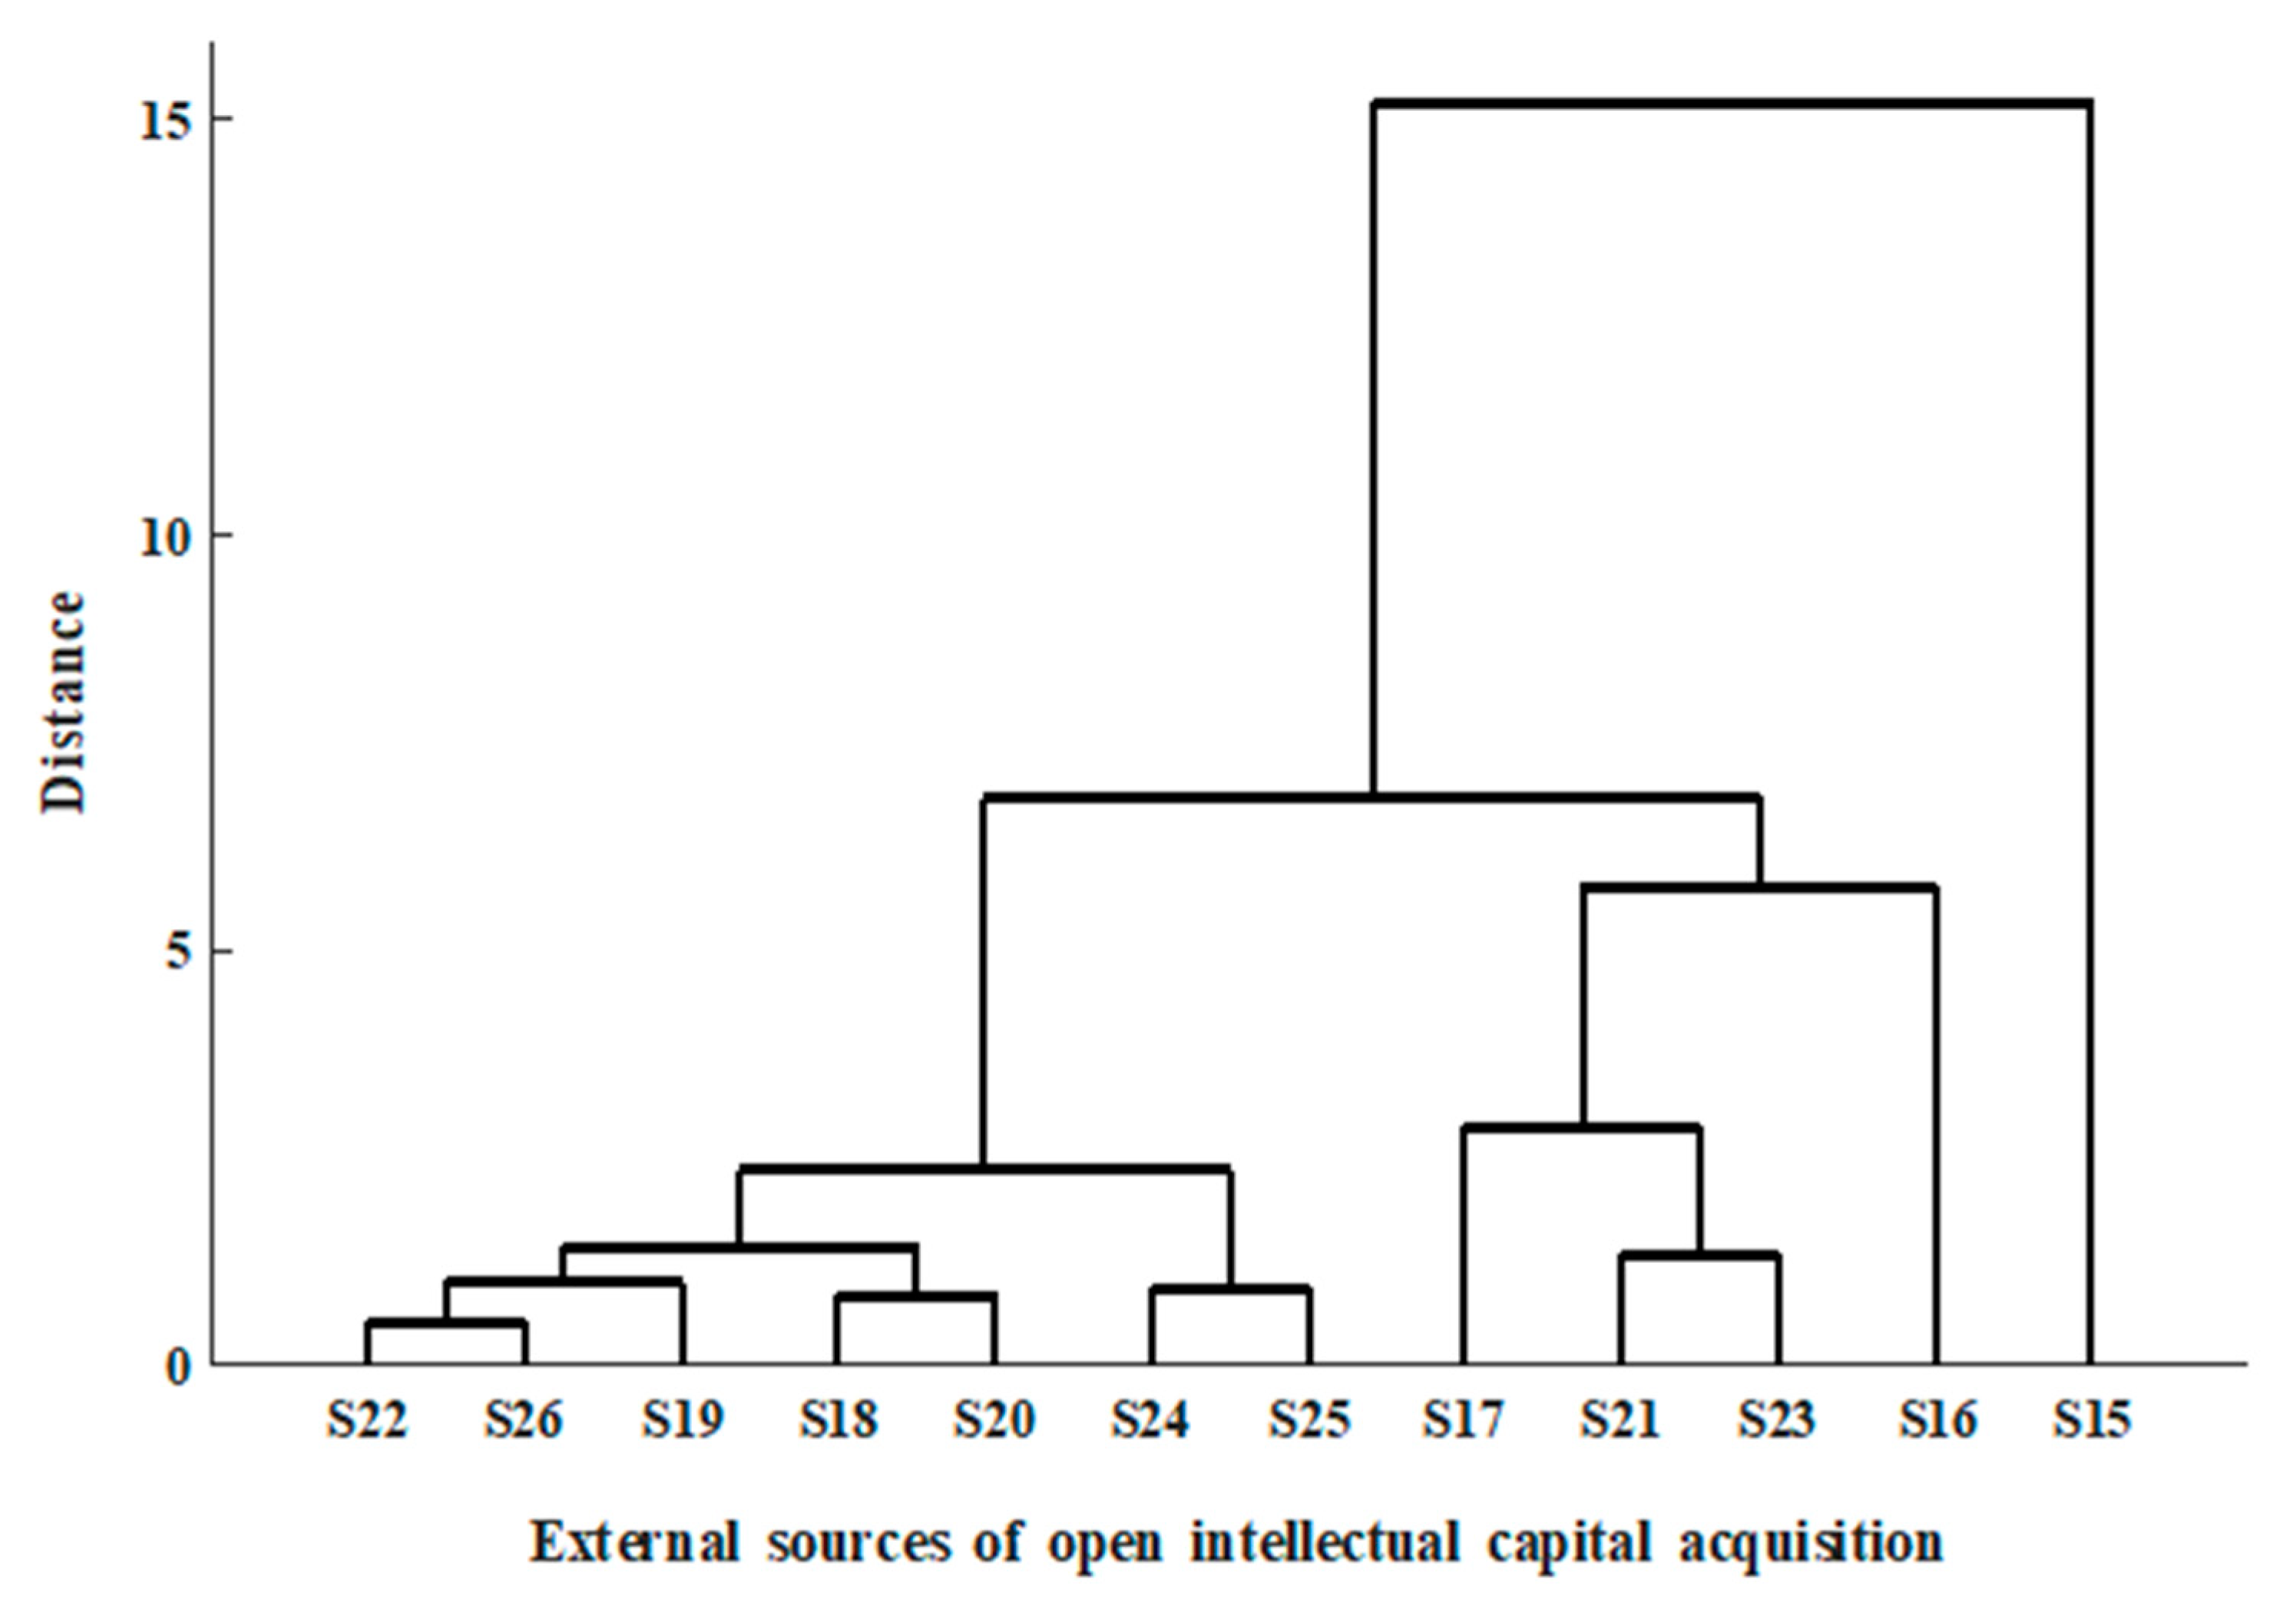
- cluster 1: s15 represents the OIC acquisition cluster that consists of a single source: cooperation with software companies belonging to the same industry;
- cluster 2: s16 represents the OIC acquisition cluster containing a single source: other companies in the same industry;
- cluster 3: s17 represents the OIC acquisition cluster that consists of a single source: suppliers of equipment, materials, components and standard software licenses;
- cluster 4: s21 and s23 represent the OIC acquisition cluster containing two OIC acquisition sources: cooperation with other national research institutes and cooperation with national universities, respectively;
- cluster 5: s24 and s25 represent the OIC acquisition clusters that consist of two OIC acquisition sources: conferences, fairs and exhibitions and scientific, technical and commercial journals and publications, respectively;
- cluster 6: s18 and s20, and s22 and s26 represent two clusters of OIC acquisition, with only 0.31 distance from each other (distances between the two clusters are 0.84 and 0.52, respectively) and s19, with a distance of 0.93. These clusters consist of the following OIC acquisition sources: coopetition and cooperation with the PAS; cooperation with foreign institutions and other scientific, technical and professional societies and publications; consulting firms, consultants, commercial laboratories and private R&D institutions.
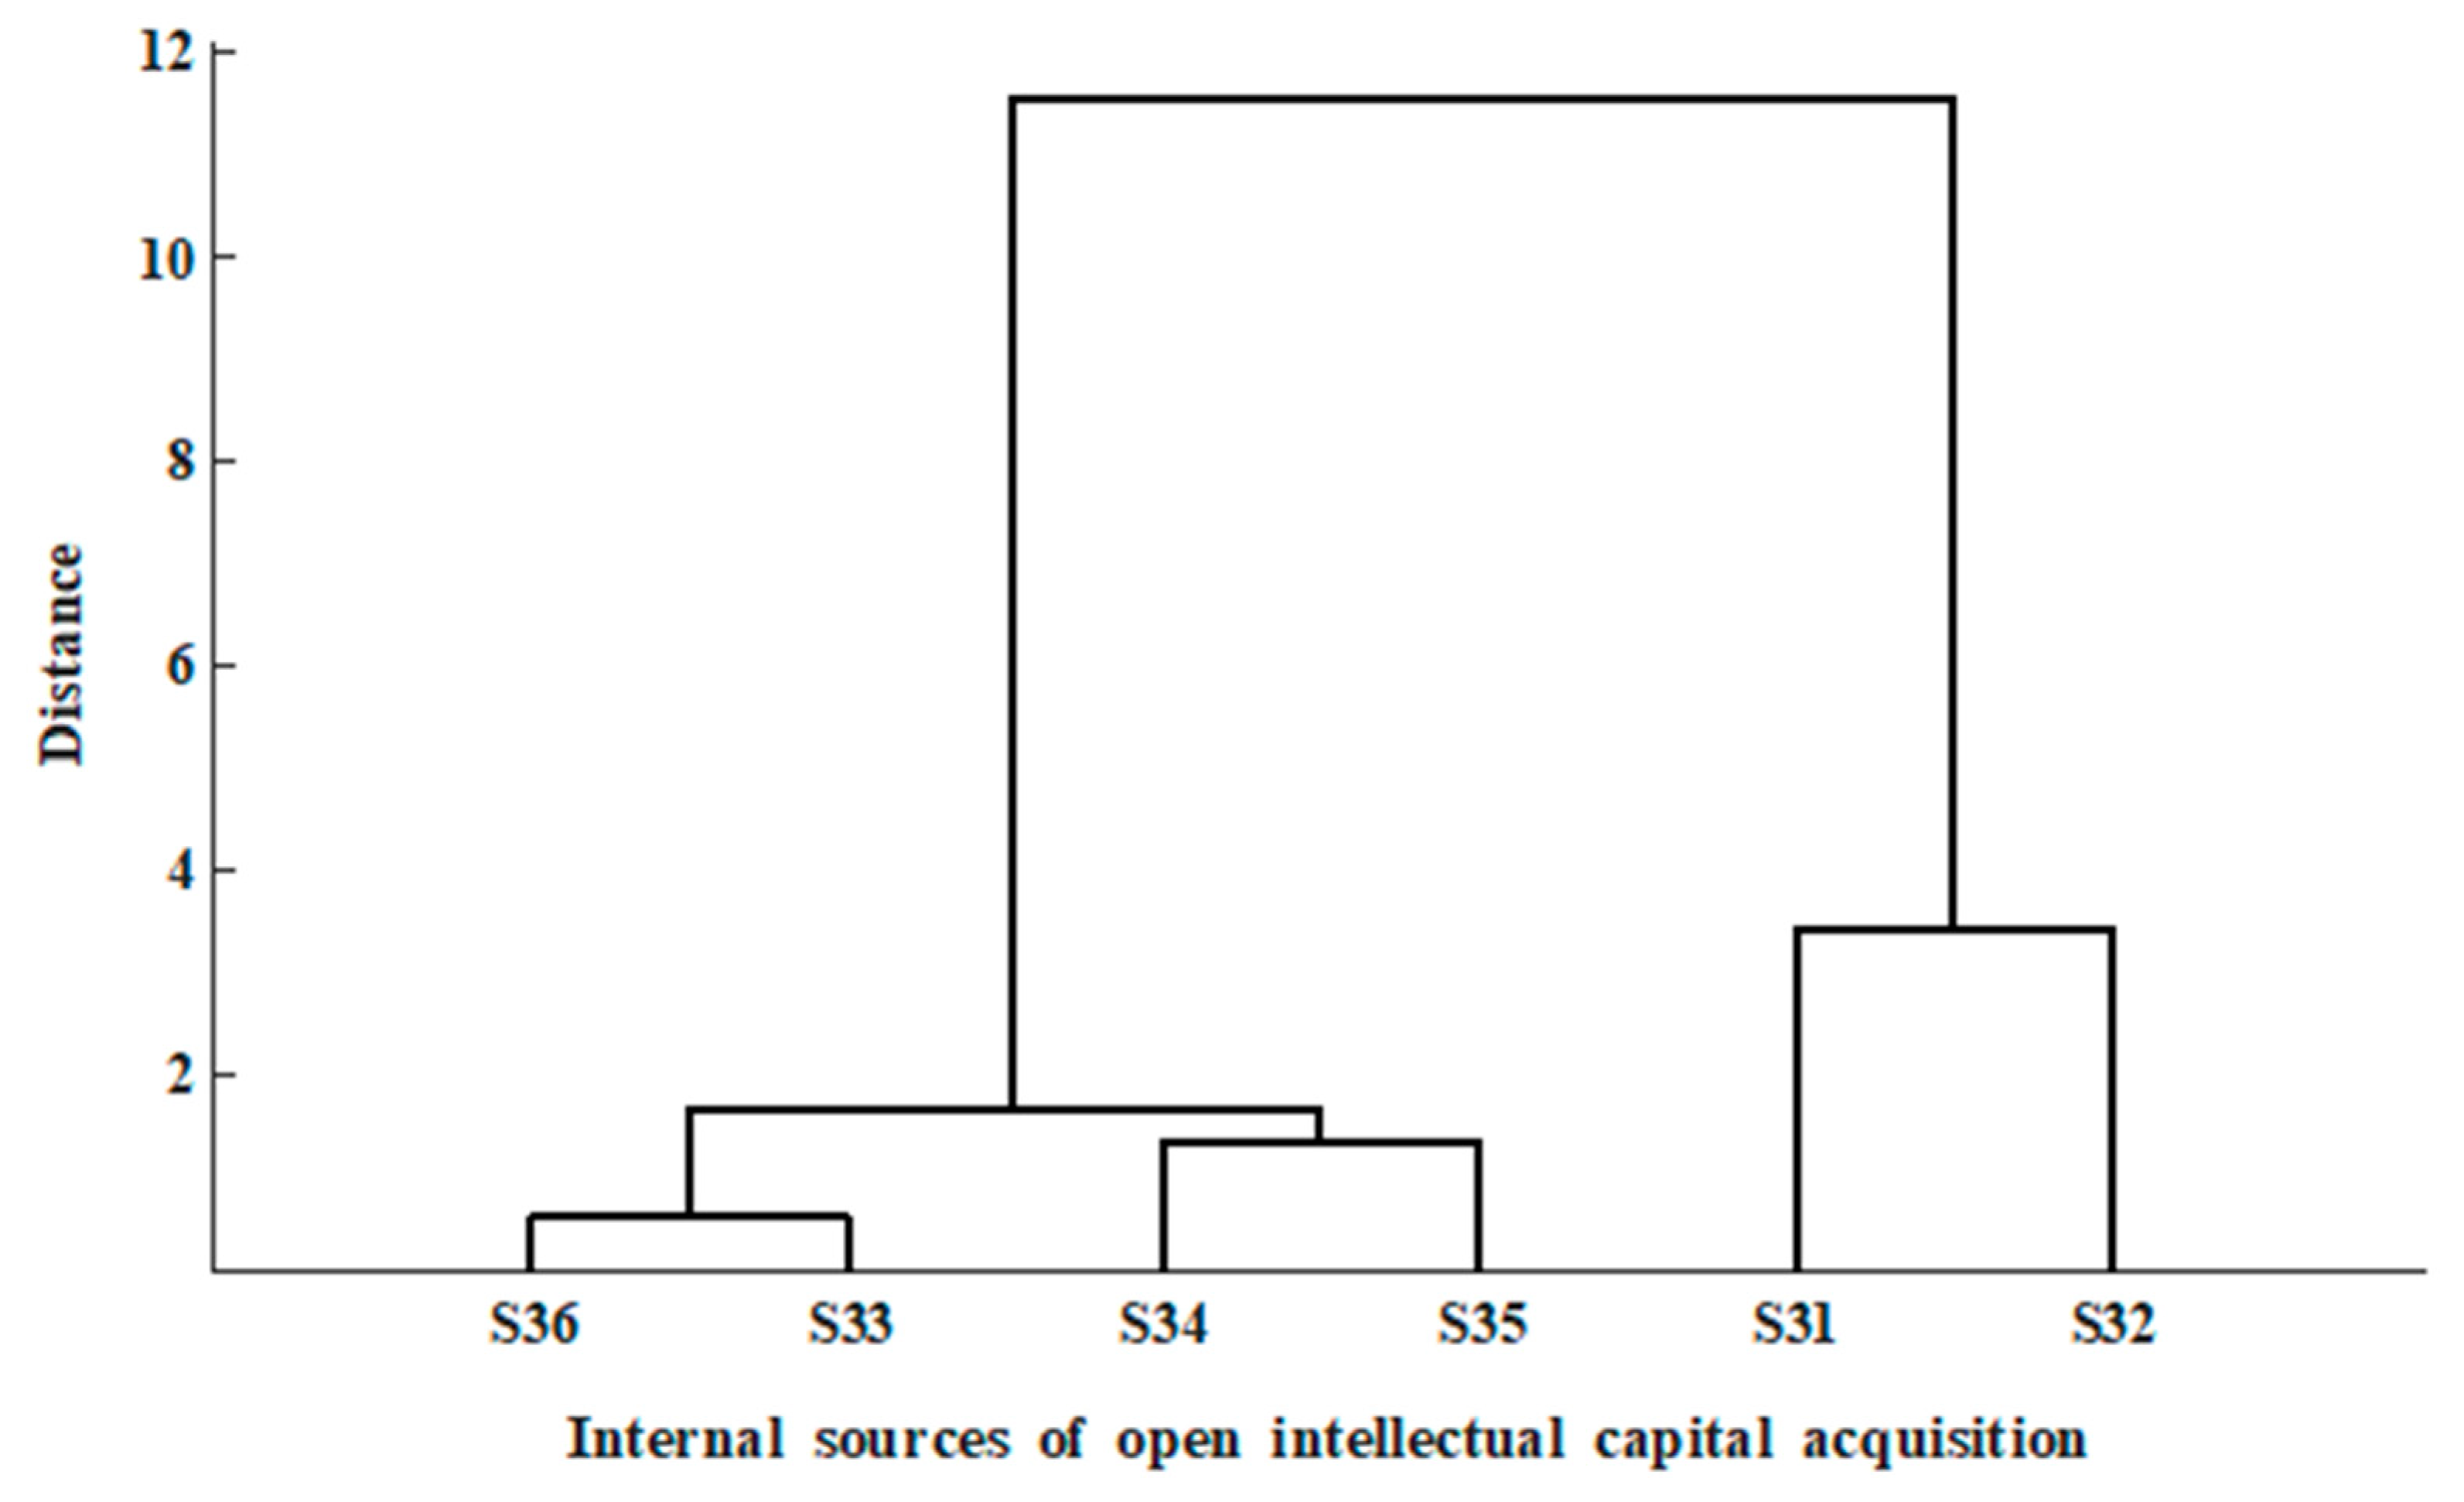
- cluster 1: s31 and s32 represent the OIC acquisition cluster that consists of two OIC acquisition sources: a list of enterprise customers and product development achieved based on an SME’s own research and resources;
- cluster 2: s34 and s35 represent the OIC acquisition cluster that contains sales and marketing departments;
- cluster 3: s33 and s36 represent the OIC acquisition cluster that consists of managers and other departments in the enterprise.
5. Conclusions
6. Future Research
Funding
Institutional Review Board Statement
Informed Consent Statement
Data Availability Statement
Conflicts of Interest
Appendix A
- Each of the seven components of the IC constitutes one diagnostic variable of the OIC acquisition at the components level, separately in the entire internal and external stream.
- The level of acquisition of each diagnostic variable is the number of acquired components belonging to individual OIC components in each year of the research period, as identified by the SMEs in the study. The higher the level of acquisition of the diagnostic variable, the higher the acquisition level of OIC in the entire internal and external stream. Therefore, each of the seven components constituting the seven diagnostic variables stimulates the entire internal and external stream of OIC acquisition separately. Neither the entire internal nor external stream contain destimulants.
- Standardised values of stimulants in each year of the research period were calculated based on Equation (A4).
- 4.
- Selection of the weight estimation method for diagnostic variables and calculation of the value of the taxonomic indicator. The value of the taxonomic indicator was calculated based on Equation (A5).
References
- Alvino, F.; Di Vaio, A.; Hassan, R.; Palladino, R. Intellectual capital and sustainable development: A systematic literature review. J. Intellect. Cap. 2020, 22, 76–94. [Google Scholar] [CrossRef]
- Barney, J.B. Firm Resources and Sustained Competitive Advantage. J. Manag. 1991, 17, 99–120. [Google Scholar] [CrossRef]
- Perrini, F.; Vurro, C. Corporate Sustainability, Intangible Assets Accumulation and Competitive Advantage. Symph. Emerg. Issues Manag. 2010, 2, 25–38. [Google Scholar] [CrossRef]
- Rothaermel, F.T. Strategic Management: Concepts and Cases; McGraw-Hill: New York, NY, USA, 2016. [Google Scholar]
- Dumay, J.C. Intellectual capital measurement: A critical approach. J. Intellect. Cap. 2009, 10, 190–210. [Google Scholar] [CrossRef]
- Edvinsson, L. Developing intellectual capital at Skandia. Long Range Plan. 1997, 30, 366–373. [Google Scholar] [CrossRef]
- Edvinsson, L.; Malone, M.S. Intellectual Capital: Realizing Your Company’s True Value by Finding Its Hidden Brainpower; Harper Business: New York, NY, USA, 1997. [Google Scholar]
- Marr, B.; Roos, G. A Strategy Perspective on Intellectual Capital in Perspectives on Intellectual Capital—Multidisciplinary Insights into Management, Measurement and Reporting; Butter-Worth-Heinemann: Oxford, UK, 2005. [Google Scholar]
- Santis, S.; Bianchi, M.; Incollingo, A.; Bisogno, M. Disclosure of Intellectual Capital Components in Integrated Reporting: An Empirical Analysis. Sustainability 2018, 11, 62. [Google Scholar] [CrossRef]
- Steenhuis, H.-J.; De Bruijn, E.J. Technology and Economic Development: A Literature Review. Int. J. Innov. Technol. Manag. 2012, 9, 1250033. [Google Scholar] [CrossRef]
- Stewart, T.; Ruckdeschel, C. Intellectual Capital: The New Wealth of Organizations; Nicholas Brealey Publishing: London, UK, 1998. [Google Scholar]
- Allameh, S.M. Antecedents and consequences of intellectual capital. J. Intellect. Cap. 2018, 19, 858–874. [Google Scholar] [CrossRef]
- Attar, M.; Kang, K.; Sohaib, O. Knowledge Sharing Practices, Intellectual Capital and Organizational Performance. In Proceedings of the 52nd Hawaii International Conference on System Sciences, Maui, HI, USA, 8–11 January 2019. [Google Scholar] [CrossRef]
- Chen, C.J.; Shih, H.A.; Yang, S.Y. The Role of Intellectual Capital in Knowledge Transfer. IEEE Trans. Eng. Manag. 2009, 56, 402–411. [Google Scholar] [CrossRef]
- Easterby-Smith, M.; Lyles, M.A.; Tsang, E.W.K. Inter-Organizational Knowledge Transfer: Current Themes and Future Prospects. J. Manag. Stud. 2008, 45, 677–690. [Google Scholar] [CrossRef]
- Van Wijk, R.; Jansen, J.P.; Lyles, M.A. Inter and Intra Organizational Knowledge Transfer: A Meta-Analytic Review and Assessment of its Antecedents and Consequences. J. Manag. Stud. 2008, 45, 830–853. [Google Scholar] [CrossRef]
- Wang, Z.; Wang, N.; Liang, H. Knowledge sharing, intellectual capital and firm performance. Manag. Decis. 2014, 52, 230–258. [Google Scholar] [CrossRef]
- Kaplan, R.; Norton, D. Strategy Maps; Harvard Business School Press: Boston, MA, USA, 2004. [Google Scholar]
- Kaplan, R.; Norton, D. The Balanced Scorecard: Translating Strategy into Action; Harvard Business Review Press: Boston, MA, USA, 1996. [Google Scholar]
- Sveiby, K.E. The Invisible Balance Sheet; The Konrad Group: Stockholm, Sweden, 1988. [Google Scholar]
- Sveiby, K.E. The Intangible Assets Monitor. J. Hum. Resour. Costing Account. 1997, 2, 73–97. [Google Scholar] [CrossRef]
- Wang, Q.; Zhao, L.; Chang-Richards, A.; Zhang, Y.; Li, H. Understanding the Impact of Social Capital on the Innovation Performance of Construction Enterprises: Based on the Mediating Effect of Knowledge Transfer. Sustainability 2021, 13, 5099. [Google Scholar] [CrossRef]
- Wang, S.; Noe, R.A. Knowledge sharing: A review and directions for future research. Hum. Resour. Manag. Rev. 2010, 20, 115–131. [Google Scholar] [CrossRef]
- Zheng, T. A Literature Review on Knowledge Sharing. Open J. Soc. Sci. 2017, 5, 51–58. [Google Scholar] [CrossRef]
- Hejase, H.J.; Hejase, A.; Assi, H.T.; Chalak, H.C. Intellectual Capital: An Exploratory Study from Lebanon. Open J. Bus. Manag. 2016, 4, 571–605. [Google Scholar] [CrossRef][Green Version]
- Quintero-Quintero, W.; Blanco-Ariza, A.B.; Garzón-Castrillón, M.A. Intellectual Capital: A Review and Bibliometric Analysis. Publications 2021, 9, 46. [Google Scholar] [CrossRef]
- Barney, J.B.; Hesterly, W.S. Strategic Management and Competitive Advantage; Pearson: Harlow, UK, 2019. [Google Scholar]
- Bontis, N. There is a price on your head: Managing intellectual capital strategically. Bus. Q. 1996, 60, 40–47. [Google Scholar]
- Giampaoli, D.; Sgrò, F.; Ciambotti, M.; Bontis, N. Integrating knowledge management with intellectual capital to drive strategy: A focus on Italian SMEs. VINE J. Inf. Knowl. Manag. Syst. 2021. [Google Scholar] [CrossRef]
- Hall, R. The strategic analysis of intangible resources. Strat. Manag. J. 1992, 13, 135–144. [Google Scholar] [CrossRef]
- Roos, G.; Pike, S. The Strategic Management of Intellectual Capital: Essentials for Leaders and Managers; Routledge: New York, NY, USA, 2018. [Google Scholar]
- Esho, E.; Verhoef, G. A holistic model of human capital for value creation and superior firm performance: The Strategic factor market model. Cogent Bus. Manag. 2020, 7. [Google Scholar] [CrossRef]
- Fischer, M.; Marsh, T. Recognizing Intellectual Capital As An Asset. J. Bus. Econ. Res. 2014, 12, 177. [Google Scholar] [CrossRef][Green Version]
- Johannessen, J.-A.; Olsen, B.; Olaisen, J. Intellectual capital as a holistic management philosophy: A theoretical perspective. Int. J. Inf. Manag. 2005, 25, 151–171. [Google Scholar] [CrossRef]
- Barbieri, B.; Buonomo, I.; Farnese, M.; Benevene, P. Organizational Capital: A Resource for Changing and Performing in Public Administrations. Sustainability 2021, 13, 5436. [Google Scholar] [CrossRef]
- Gogan, L.M.; Duran, D.C.; Draghici, A. Structural Capital—A Proposed Measurement Model. Procedia Econ. Financ. 2015, 23, 1139–1146. [Google Scholar] [CrossRef]
- Qin, N.; Kong, D. Human Capital and Entrepreneurship. J. Hum. Cap. 2021, 15, 513–553. [Google Scholar] [CrossRef]
- Wang, H. An Introduction on the Role of Organization Capital for the Enterprise’s Endogenous Growth. J. Serv. Sci. Manag. 2016, 9, 233–237. [Google Scholar] [CrossRef][Green Version]
- Zhang, L.; Wang, J. Research on the relationship between relational capital and relational rent. Cogent Econ. Financ. 2018, 6, 1431091. [Google Scholar] [CrossRef]
- Marchiori, D.; Franco, M. Knowledge transfer in the context of interorganizational networks: Foundations and intellectual structures. J. Innov. Knowl. 2020, 5, 130–139. [Google Scholar] [CrossRef]
- Zane, L.J. Intellectual capital and the acquisition of human capital by technology-based new ventures. J. Intellect. Cap. 2022. ahead of print. [Google Scholar] [CrossRef]
- Huang, C.-C.; Huang, S.-M. External and internal capabilities and organizational performance: Does intellectual capital matter? Asia Pac. Manag. Rev. 2020, 25, 111–120. [Google Scholar] [CrossRef]
- Abeysekera, I. Intellectual Capital and Knowledge Management Research towards Value Creation. From the Past to the Future. J. Risk Financ. Manag. 2021, 14, 238. [Google Scholar] [CrossRef]
- Burnett, M. Measuring Innovation: Sustaining Competitive Advantage by Turning Idea into Value; BearingPoint Publishers: Bentonville, AR, USA, 2011. [Google Scholar]
- Halid, S.; Choo, H.C.; Salleh, K. Intellectual Capital Management: Pathways to Sustainable Competitive Advantage. Int. J. Acad. Res. Bus. Soc. Sci. 2018, 8, 1086–1101. [Google Scholar] [CrossRef]
- Nazari, J.A. Intellectual Capital Measurement and Reporting Models. In Knowledge Management for Competitive Advantage During Economic Crisis; Ordoñez de Pablos, P., Turró, L.J., Tennyson, R.D., Zhao, J., Eds.; IGI Global: Hershey, PA, USA, 2015; pp. 117–139. [Google Scholar] [CrossRef]
- Rehman, S.U.; Bresciani, S.; Ashfaq, K.; Alam, G.M. Intellectual capital, knowledge management and competitive advantage: A resource orchestration perspective. J. Knowl. Manag. 2021, 26, 1705–1731. [Google Scholar] [CrossRef]
- Hatch, N.W.; Dyer, J.H. Human capital and learning as a source of sustainable competitive advantage. Strat. Manag. J. 2004, 25, 1155–1178. [Google Scholar] [CrossRef]
- Barrena-Martínez, J.; Cricelli, L.; Ferrándiz, E.; Greco, M.; Grimaldi, M. Joint forces: Towards an integration of intellectual capital theory and the open innovation paradigm. J. Bus. Res. 2020, 112, 261–270. [Google Scholar] [CrossRef]
- Najar, T.; Dhaouadi, K.; Ben Zammel, I. Intellectual Capital Impact on Open Innovation: The Case of Technology-Based Sectors in Tunisia. J. Innov. Econ. Manag. 2020, 32, 75–106. [Google Scholar] [CrossRef]
- Matricano, D.; Candelo, E.; Sorrentino, M.; Cappiello, G. Investigating the link between intellectual capital and open innovation processes: A longitudinal case study. J. Intellect. Cap. 2020. ahead of print. [Google Scholar] [CrossRef]
- Rehman, S.U.; Elrehail, H.; Alsaad, A.; Bhatti, A. Intellectual capital and innovative performance: A mediation-moderation perspective. J. Intellect. Cap. 2021, 23, 998–1024. [Google Scholar] [CrossRef]
- Rexhepi, G.; Hisrich, R.D.; Ramadani, V. Open Innovation and Entrepreneurship: An Overview. In Open Innovation and Entrepreneurship: Impetus of Growth and Competitive Advantages; Rexhepi, G., Hisrich, R.D., Ramadani, V., Eds.; Springer: Cham, Switzerland, 2019; pp. 2–8. [Google Scholar]
- Ryu, D.; Baek, K.; Yoon, J. Open Innovation with Relational Capital, Technological Innovation Capital, and International Performance in SMEs. Sustainability 2021, 13, 3418. [Google Scholar] [CrossRef]
- Umrani, W.A.; Ahmad, I.; Rasheed, M.I.; Ahmed, U.; Pahi, M.H.; Jhatial, A.; Abbsai, G.A. Managing intellectual capital: Role of corporate entrepreneurship and absorptive capacity on firm performance. Knowl. Manag. Res. Pract. 2022, 1–13. [Google Scholar] [CrossRef]
- Vale, J.; Miranda, R.; Azevedo, G.; Tavares, M.C. The Impact of Sustainable Intellectual Capital on Sustainable Performance: A Case Study. Sustainability 2022, 14, 4382. [Google Scholar] [CrossRef]
- Boeske, J.; Murray, P.A. The Intellectual Domains of Sustainability Leadership in SMEs. Sustainability 2022, 14, 1978. [Google Scholar] [CrossRef]
- Matos, F.; Vairinhos, V.; Godina, R. Reporting of Intellectual Capital Management Using a Scoring Model. Sustainability 2020, 12, 8086. [Google Scholar] [CrossRef]
- Aljuboori, Z.M.; Singh, H.; Haddad, H.; Al-Ramahi, N.M.; Ali, M.A. Intellectual Capital and Firm Performance Correlation: The Mediation Role of Innovation Capability in Malaysian Manufacturing SMEs Perspective. Sustainability 2021, 14, 154. [Google Scholar] [CrossRef]
- Ying, Q.; Hassan, H.; Ahmad, H. The Role of a Manager’s Intangible Capabilities in Resource Acquisition and Sustainable Competitive Performance. Sustainability 2019, 11, 527. [Google Scholar] [CrossRef]
- Sveiby, K. Methods of Measuring Intangible Assets; Sveiby Knowledge Associates Publisher, 2001; Available online: https://www.sveiby.com/files/pdf/1537275071_methods-intangibleassets.pdf (accessed on 13 September 2022).
- Schwaber, K.; Sutherland, J. Software in 30 Days: How Agile Managers Beat the Odds, Delight Their Customers, and Leave Competitors in the Dus; John Wiley & Sons: Hoboken, NJ, USA, 2012. [Google Scholar]
- Griffin, R.W. Management; Cengage: Boston, MA, USA, 2016. [Google Scholar]
- Yaidraw, A. Managing Organizational Structure: Practical Design and Application; Independently Publisher: New York, NY, USA, 2021. [Google Scholar]
- Ward, J.H. Hierarchical Grouping to Optimize an Objective Function. J. Am. Stat. Assoc. 1963, 58, 236–244. [Google Scholar] [CrossRef]
- Blashfield, R.K. Mixture Model Tests of Cluster Analysis: Accuracy of Four Agglomerative Hierarchical Methods. Psychol. Bull. 1976, 83, 377–388. [Google Scholar] [CrossRef]
- Hands, S.; Everitt, B. A Monte Carlo Study of the Recovery of Cluster Structure in Binary Data by Hierarchical Clustering Techniques. Multivar. Behav. Res. 1987, 22, 235–243. [Google Scholar] [CrossRef]
- Hatcher, L. Advanced Statistics in Research; Shadow Finch Media: Saginaw, MI, USA, 2013. [Google Scholar]
- Hellwig, Z. Wielowymiarowa analiza porównawcza i jej zastosowanie w badaniach wielocechowych obiektów gospodarczych (Translation: Multidimensional comparative analysis and its application in the study of multi-feature economic objects). In Metody i Modele Ekonomiczno-Matematyczne w Doskonaleniu Zarządzania Gospodarką Socjalistyczną; Welfe, W., Ed.; PWE: Warsaw, PL, USA, 1981. [Google Scholar]
- Walesiak, M Visualization of linear ordering results for metric data with the application of multidi-mensional scaling. Ekonometria 2016, 2, 9–21.
- Dykas, P.; Kościelniak, P.; Tokarski, T. Taksonomiczne wskaźniki rozwoju ekonomicznego województw 715 i powiatów (Translation: Taxonomic indicators of economic development of voivodeships and counties). In 716 Statystyczna Analiza Przestrzennego Zróżnicowania Ekonomicznego i Społecznego Polski (Translation: Statistical Analysis of the Spatial Economic and Social Differentiation of Poland); Trojak, T., Tokarski, T., Eds.; Jagiellonian Uniwersity Press: Krakow, PL, USA, 2013; pp. 81–109. [Google Scholar]
- Edigarian, A.; Kościelniak, P.; Tokarski, T.; Trojak, M. Taksonomiczne wskaźniki rozwoju ekonomicznego powiatów (Translation: Taxonomic indicators of economic development of counties). In Capability to Social Progress in Poland’s Regions; Tomczak, D., Ed.; Warsaw University Press: Warsaw, PL, USA, 2011; pp. 13–49. [Google Scholar]
- Sokal, R.R.; Rohlf, F.J. The Comparison of Dendrograms by Objective Methods. Taxon 1962, 11, 33–40. [Google Scholar] [CrossRef]


| Component Stream | Description of Variables Characterizing the Acquiring of OIC |
|---|---|
| Streams of components forming the entire internal stream of acquired OIC, variables s1–s7 | |
| s1 | Stream of human capital component |
| s2 | Stream of organisational capital component |
| s3 | Stream of relational capital component |
| s4 | Stream of technological capital component |
| s5 | Stream of information capital component |
| s6 | Stream of project capital component |
| s7 | Stream of innovation capital component |
| Streams of components forming the entire external stream of acquired OIC, variables s8–s14 | |
| s8 | Stream of human capital component |
| s9 | Stream of organisational capital component |
| s10 | Stream of relational capital component |
| s11 | Stream of technological capital component |
| s12 | Stream of information capital component |
| s13 | Stream of project capital component |
| s14 | Stream of innovation capital component |
| OIC Sources | Description of OIC Acquisition Sources |
|---|---|
| External sources of OIC acquisition, variables s15–s30 | |
| s15 | Cooperation with software companies belonging to the same industry |
| s16 | Other companies in the same industry |
| s17 | Suppliers of equipment, materials, components and standard software licenses |
| s18 | Competitors |
| s19 | Consulting firms, consultants, commercial laboratories, private R&D institutions |
| s20 | Cooperation with Polish Academy of Sciences (PAS) |
| s21 | Cooperation with other national research institutes |
| s22 | Cooperation with foreign institutions |
| s23 | Cooperation with national universities |
| s24 | Conferences, fairs, exhibitions |
| s25 | Scientific, technical and commercial journals and publications |
| s26 | Other scientific, technical and professional societies and associations |
| s27 | Purchased licenses (excluding licenses for standard computer software) |
| s28 | Purchased results of external R&D |
| s29 | Purchased consulting services |
| s30 | Other external sources |
| Internal sources of OIC acquisition, variables s31–s36 | |
| s31 | List of enterprise customers |
| s32 | Product development achieved based on own research and resources |
| s33 | Managers |
| s34 | Sales department |
| s35 | Marketing department |
| s36 | Other departments of the enterprise |
| Year | Number of SMEs |
|---|---|
| 2005 | 213 |
| 2006 | 228 |
| 2007 | 247 |
| 2008 | 278 |
| 2009 | 291 |
| 2010 | 269 |
| 2011 | 306 |
| 2012 | 314 |
| 2013 | 347 |
| 2014 | 338 |
| 2015 | 345 |
| 2016 | 352 |
| 2017 | 367 |
| 2018 | 382 |
| 2019 | 403 |
| Indicator/Stream | Internal Stream | External Stream |
|---|---|---|
| Dynamic rate-of-change | 3.21% | 7.45% |
| OIC Components | Internal Stream | External Stream |
|---|---|---|
| Human Capital | 8.53% | 16.74% |
| Innovation Capital | 6.05% | 6.76% |
| Project Capital | 5.83% | 9.61% |
| Information Capital | 4.78% | 11.23% |
| Relational Capital | 2.61% | 3.81% |
| Organisational Capital | 1.28% | 5.02% |
| Technological Capital | 0.00% | 7.58% |
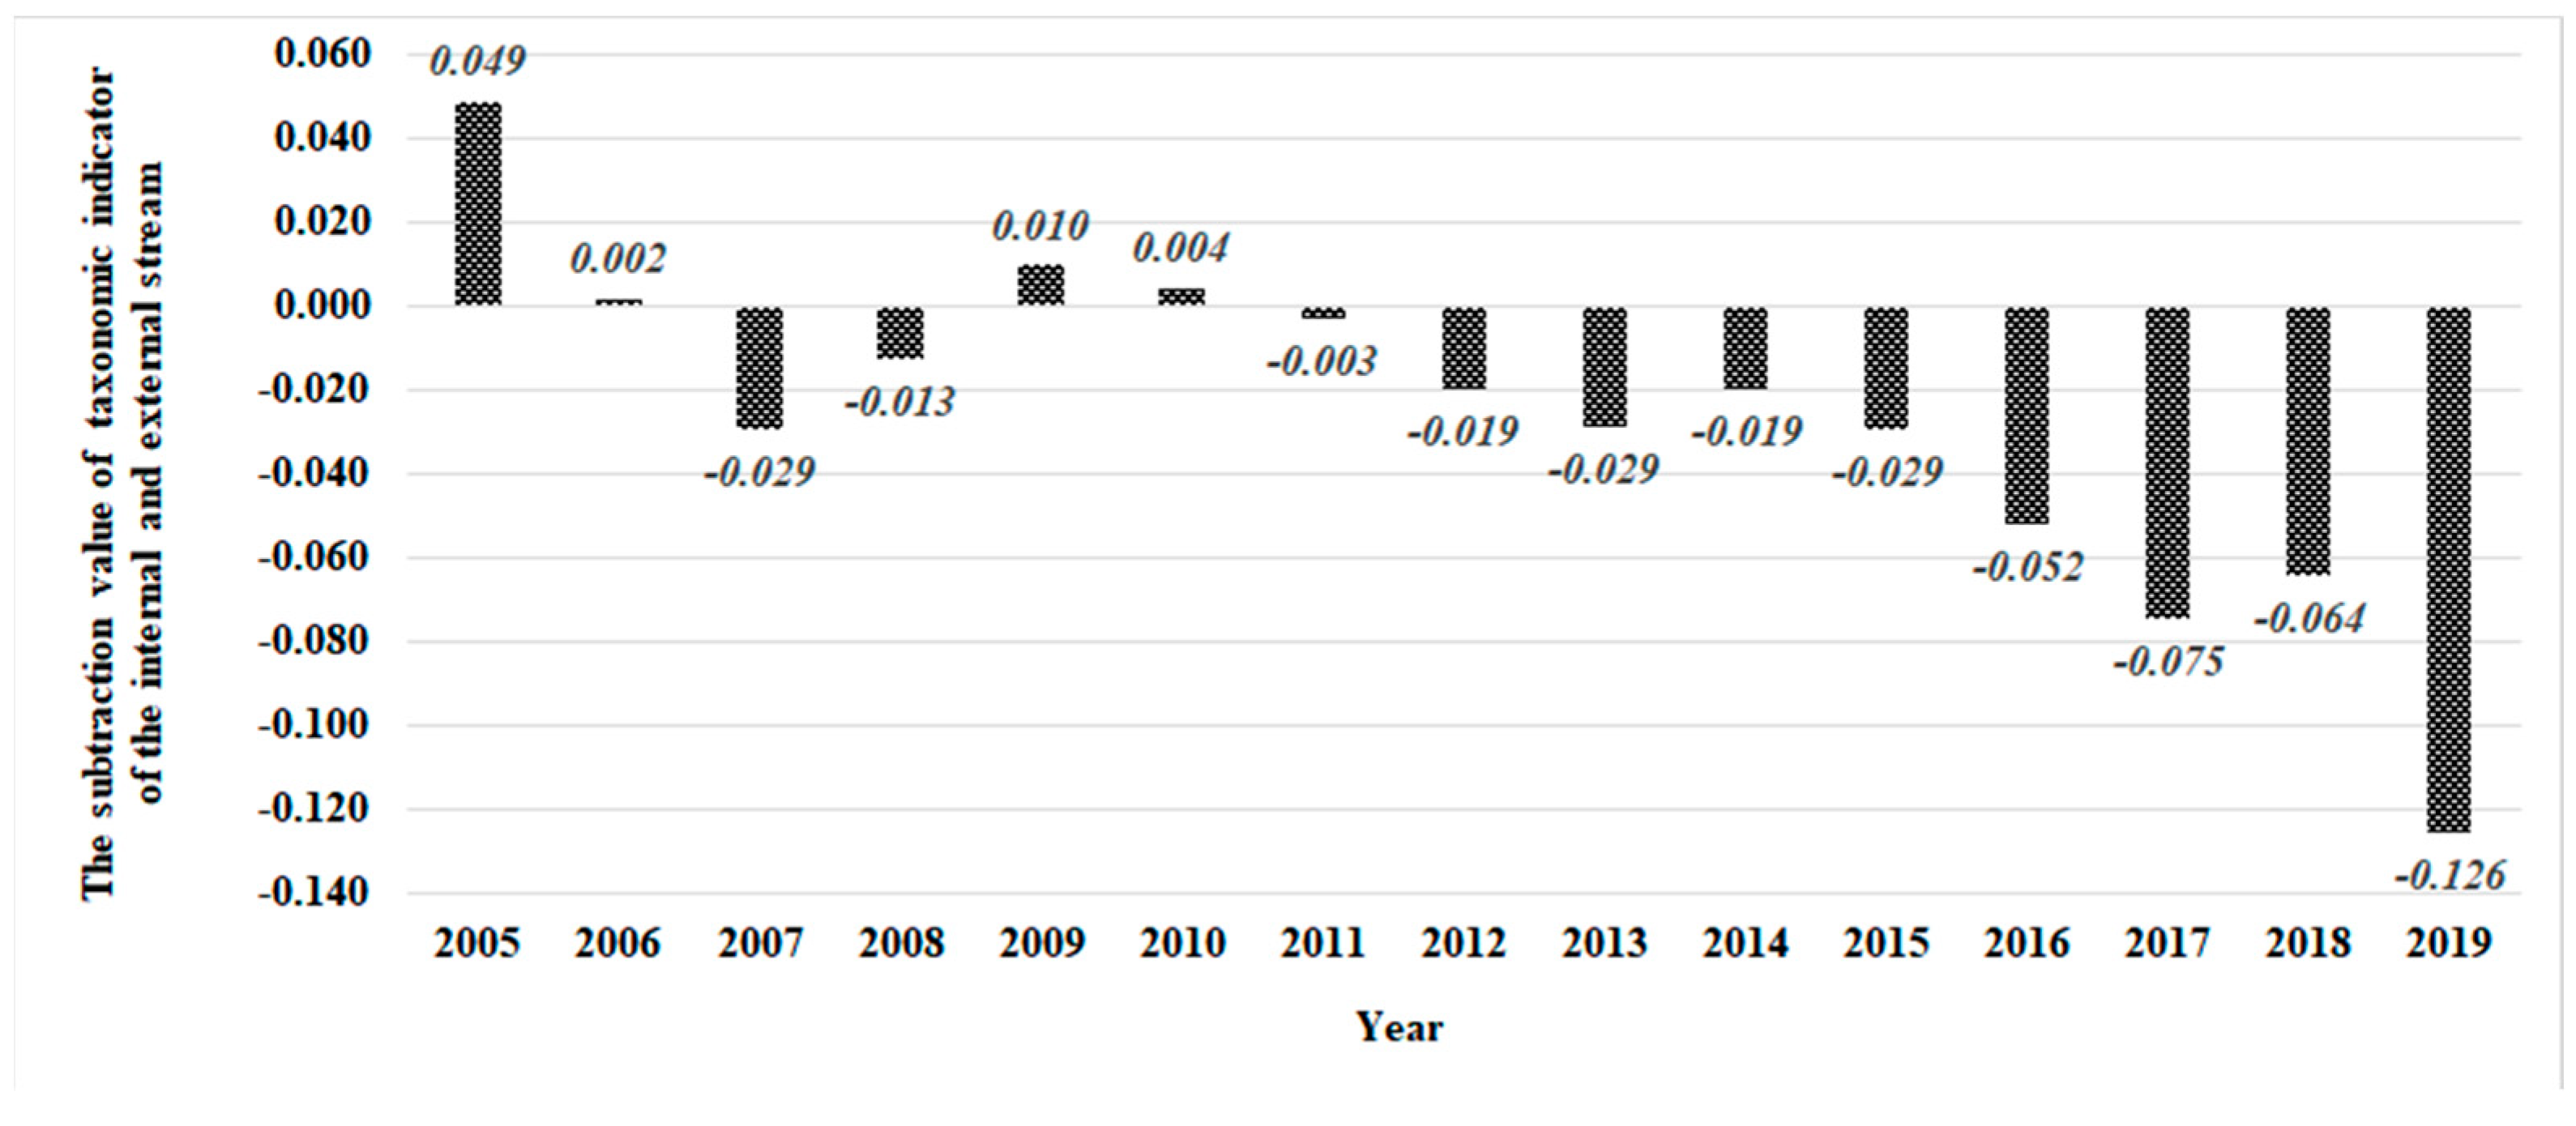
| Year | Itin—Internal Stream | Itout—External Stream | Itin−Itout |
|---|---|---|---|
| 2005 | 0.3154 | 0.2665 | 0.0489 |
| 2006 | 0.3448 | 0.3430 | 0.0017 |
| 2007 | 0.3724 | 0.4016 | −0.0293 |
| 2008 | 0.4042 | 0.4169 | −0.0127 |
| 2009 | 0.4176 | 0.4077 | 0.0098 |
| 2010 | 0.3560 | 0.3516 | 0.0044 |
| 2011 | 0.3881 | 0.3910 | −0.0028 |
| 2012 | 0.3977 | 0.4172 | −0.0195 |
| 2013 | 0.4417 | 0.4704 | −0.0287 |
| 2014 | 0.4366 | 0.4561 | −0.0195 |
| 2015 | 0.4496 | 0.4786 | −0.0291 |
| 2016 | 0.5061 | 0.5579 | −0.0519 |
| 2017 | 0.5427 | 0.6176 | −0.0749 |
| 2018 | 0.5710 | 0.6351 | −0.0641 |
| 2019 | 0.6160 | 0.7419 | −0.1259 |
| Component/Weight | Human Capital | Organisational Capital | Relational Capital | Technological Capital | Information Capital | Project Capital | Innovation Capital |
|---|---|---|---|---|---|---|---|
| ωi | 0.193 | 0.178 | 0.140 | 0.104 | 0.129 | 0.133 | 0.122 |
| OIC Sources | Sources of OIC Acquisition/Stream | Internal Stream | External Stream |
|---|---|---|---|
| s15 | Cooperation with software companies belonging to the same industry | - | 12.98% |
| s16 | Other companies in the same industry | - | 10.87% |
| s23 | Cooperation with national universities | - | 8.08% |
| s24 | Conferences, fairs, exhibitions | - | 8.01% |
| s21 | Cooperation with other national research institutes | - | 7.96% |
| s26 | Other scientific, technical and professional societies and associations | - | 7.06% |
| s25 | Scientific, technical and commercial journals and publications | - | 5.08% |
| s22 | Cooperation with foreign institutions | - | 4.48% |
| s19 | Consulting firms, consultants, commercial laboratories, private R&D institutions | - | −2.03% |
| s17 | Suppliers of equipment, materials, components and standard software licenses | - | −4.27% |
| s20 | Cooperation with Polish Academy of Sciences (PAS) | - | −6.77% |
| s18 | Competitors | - | −8.64% |
| s27 | Purchased licenses (excluding licenses for standard computer software) | - | 0.00% |
| s28 | Purchased results of external R&D | - | 0.00% |
| s29 | Purchased consulting services | - | 0.00% |
| s30 | Other external sources | - | 0.00% |
| s31 | List of enterprise customers | 13.04% | - |
| s32 | Product development achieved based on own research and resources | 10.89% | - |
| s34 | Sales department | 7.75% | - |
| s35 | Marketing department | 6.84% | - |
| s33 | Managers | 1.93% | - |
| s36 | Other departments of the enterprise | 1.57% | - |
| IC Acquisition Stream/Nodes | 1 | 2 | 3 | 4 | 5 | 6 | 7 | 8 | 9 | 10 | 11 |
|---|---|---|---|---|---|---|---|---|---|---|---|
| External stream | 15.17 | 6.82 | 5.75 | 2.85 | 2.35 | 1.44 | 1.34 | 1.00 | 0.93 | 0.84 | 0.52 |
| Internal stream | 11.56 | 3.40 | 1.65 | 1.26 | 0.59 | - | - | - | - | - | - |
Publisher’s Note: MDPI stays neutral with regard to jurisdictional claims in published maps and institutional affiliations. |
© 2022 by the author. Licensee MDPI, Basel, Switzerland. This article is an open access article distributed under the terms and conditions of the Creative Commons Attribution (CC BY) license (https://creativecommons.org/licenses/by/4.0/).
Share and Cite
Sierotowicz, T. Sources of Intellectual Capital Acquisition. Sustainability 2022, 14, 11477. https://doi.org/10.3390/su141811477
Sierotowicz T. Sources of Intellectual Capital Acquisition. Sustainability. 2022; 14(18):11477. https://doi.org/10.3390/su141811477
Chicago/Turabian StyleSierotowicz, Tomasz. 2022. "Sources of Intellectual Capital Acquisition" Sustainability 14, no. 18: 11477. https://doi.org/10.3390/su141811477
APA StyleSierotowicz, T. (2022). Sources of Intellectual Capital Acquisition. Sustainability, 14(18), 11477. https://doi.org/10.3390/su141811477