
Mineralogical, Geochemical Characterization and Physicochemical Properties of Kaolinitic Clays of the Eastern Part of the Douala Sub-Basin, Cameroon, Central Africa
Abstract
:1. Introduction
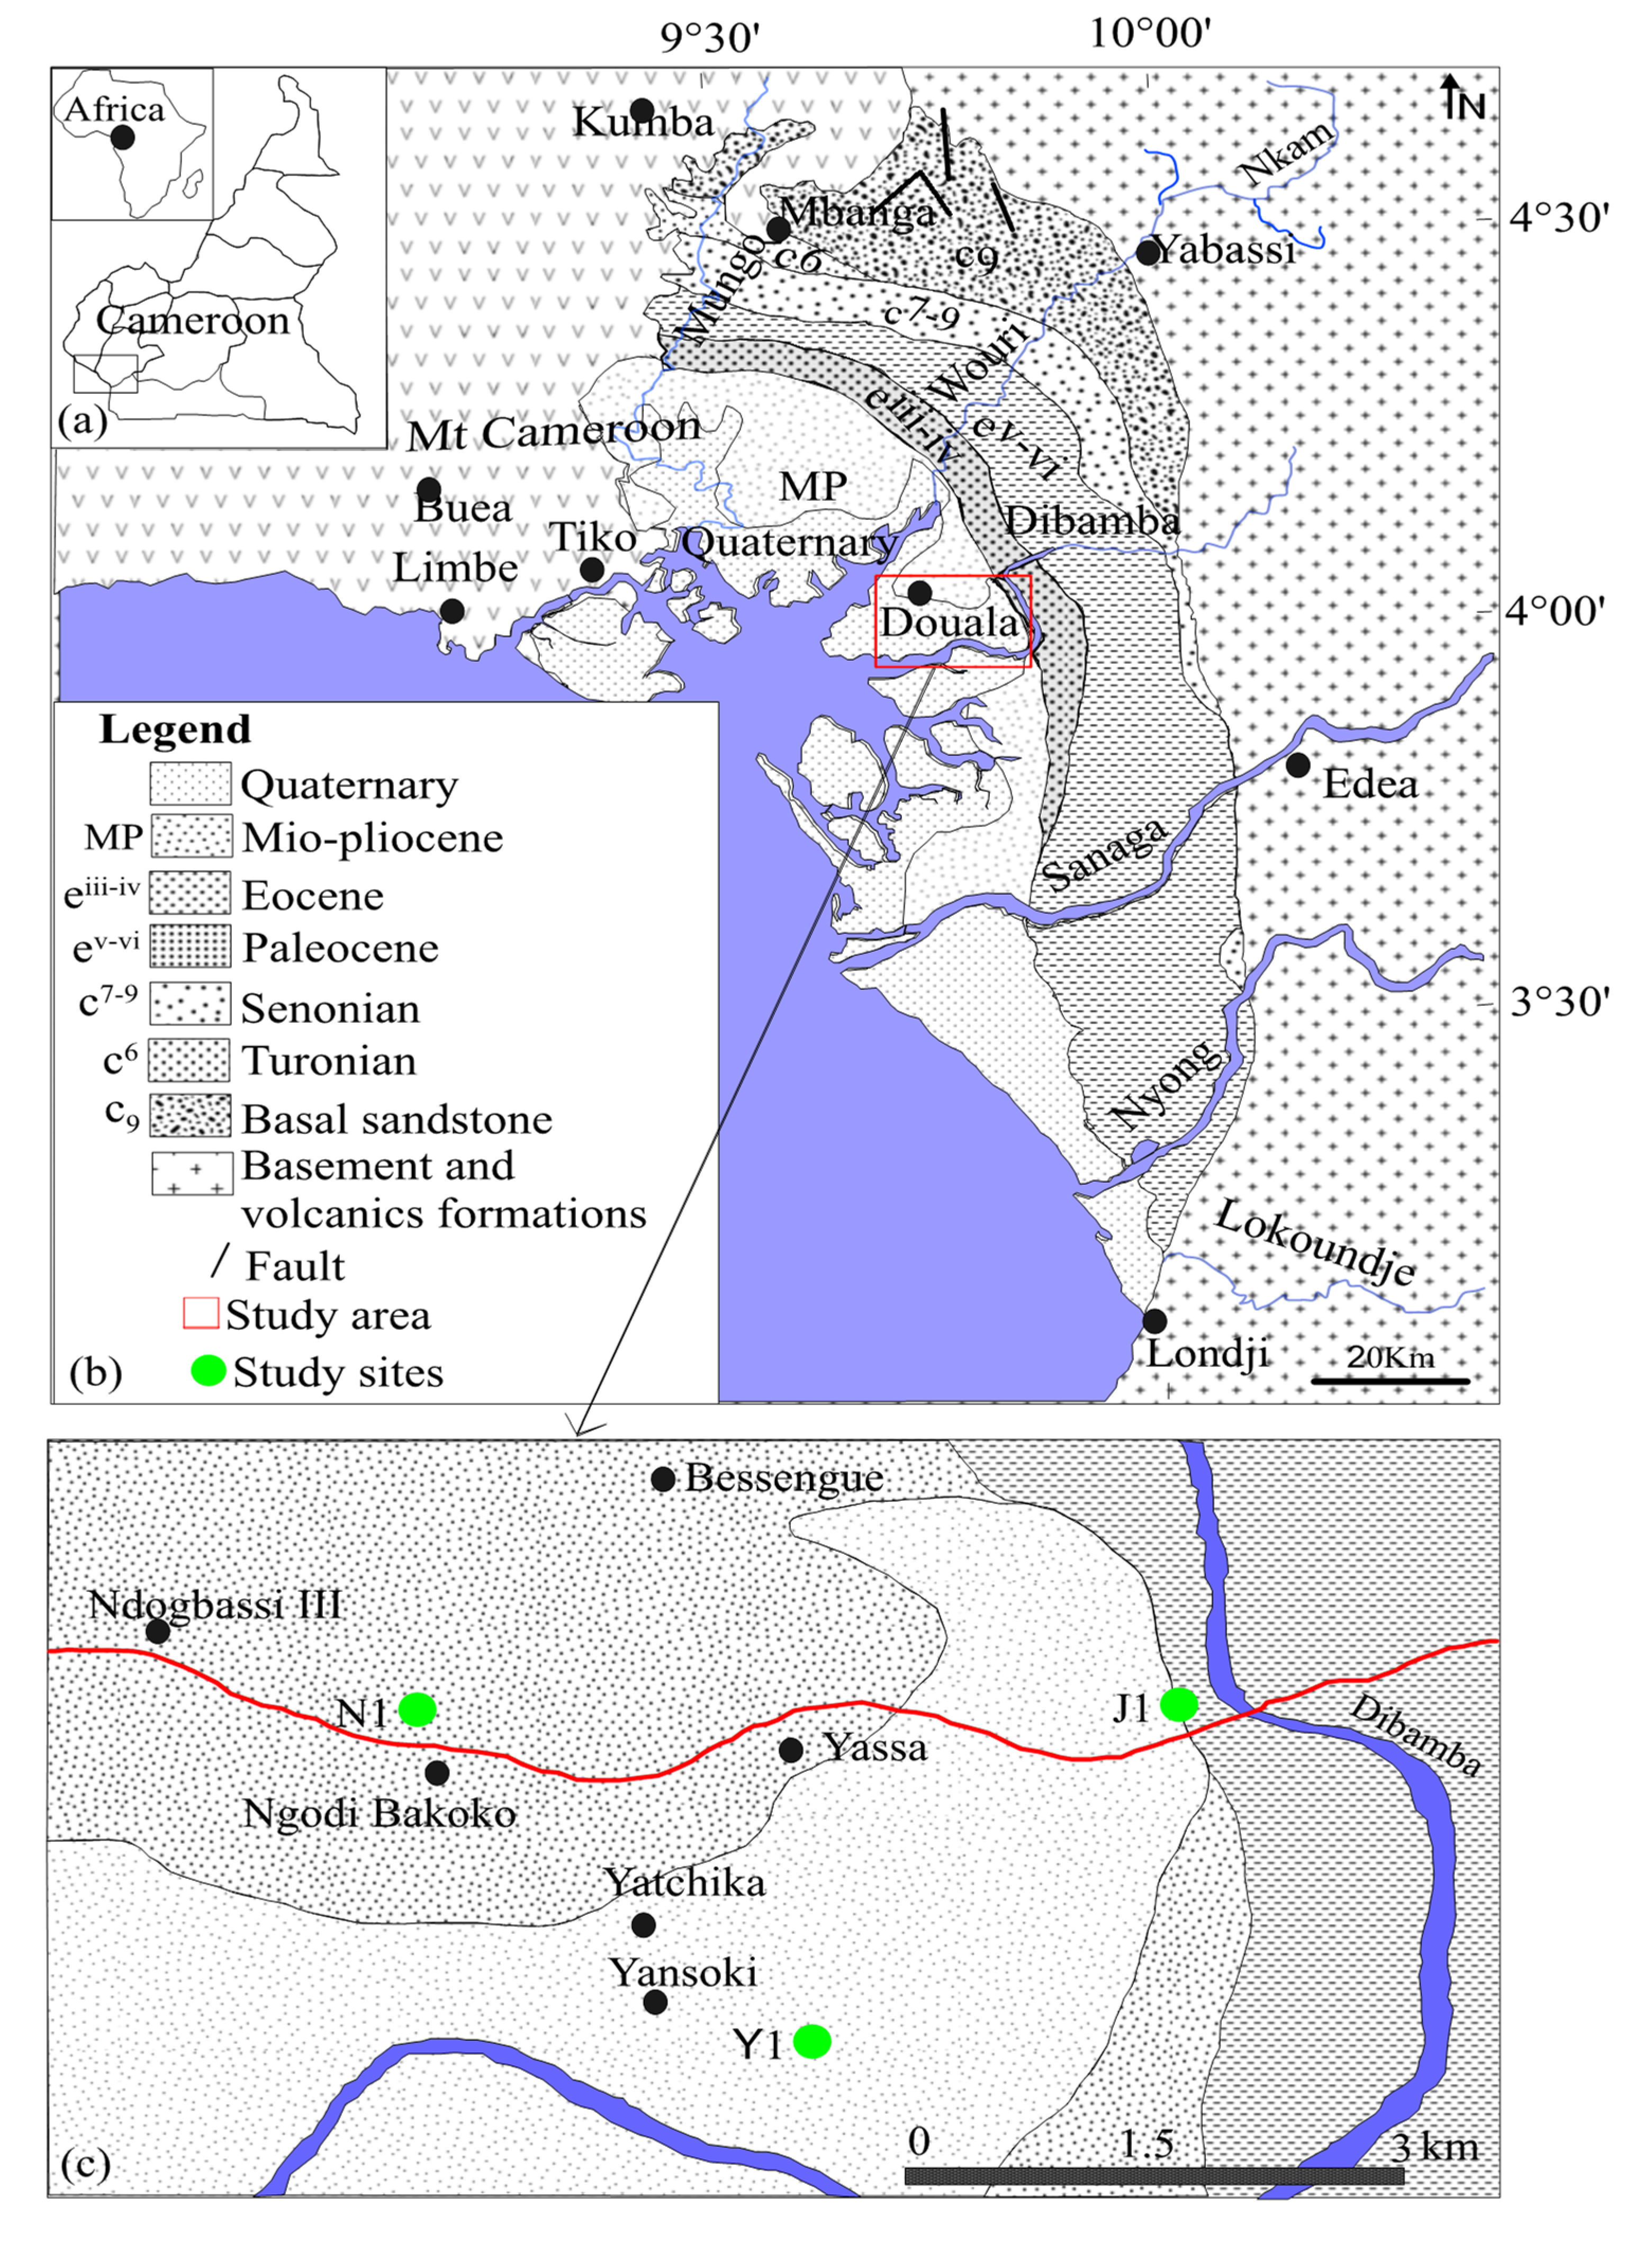
2. Geographical and Geological Setting
3. Material and Methods
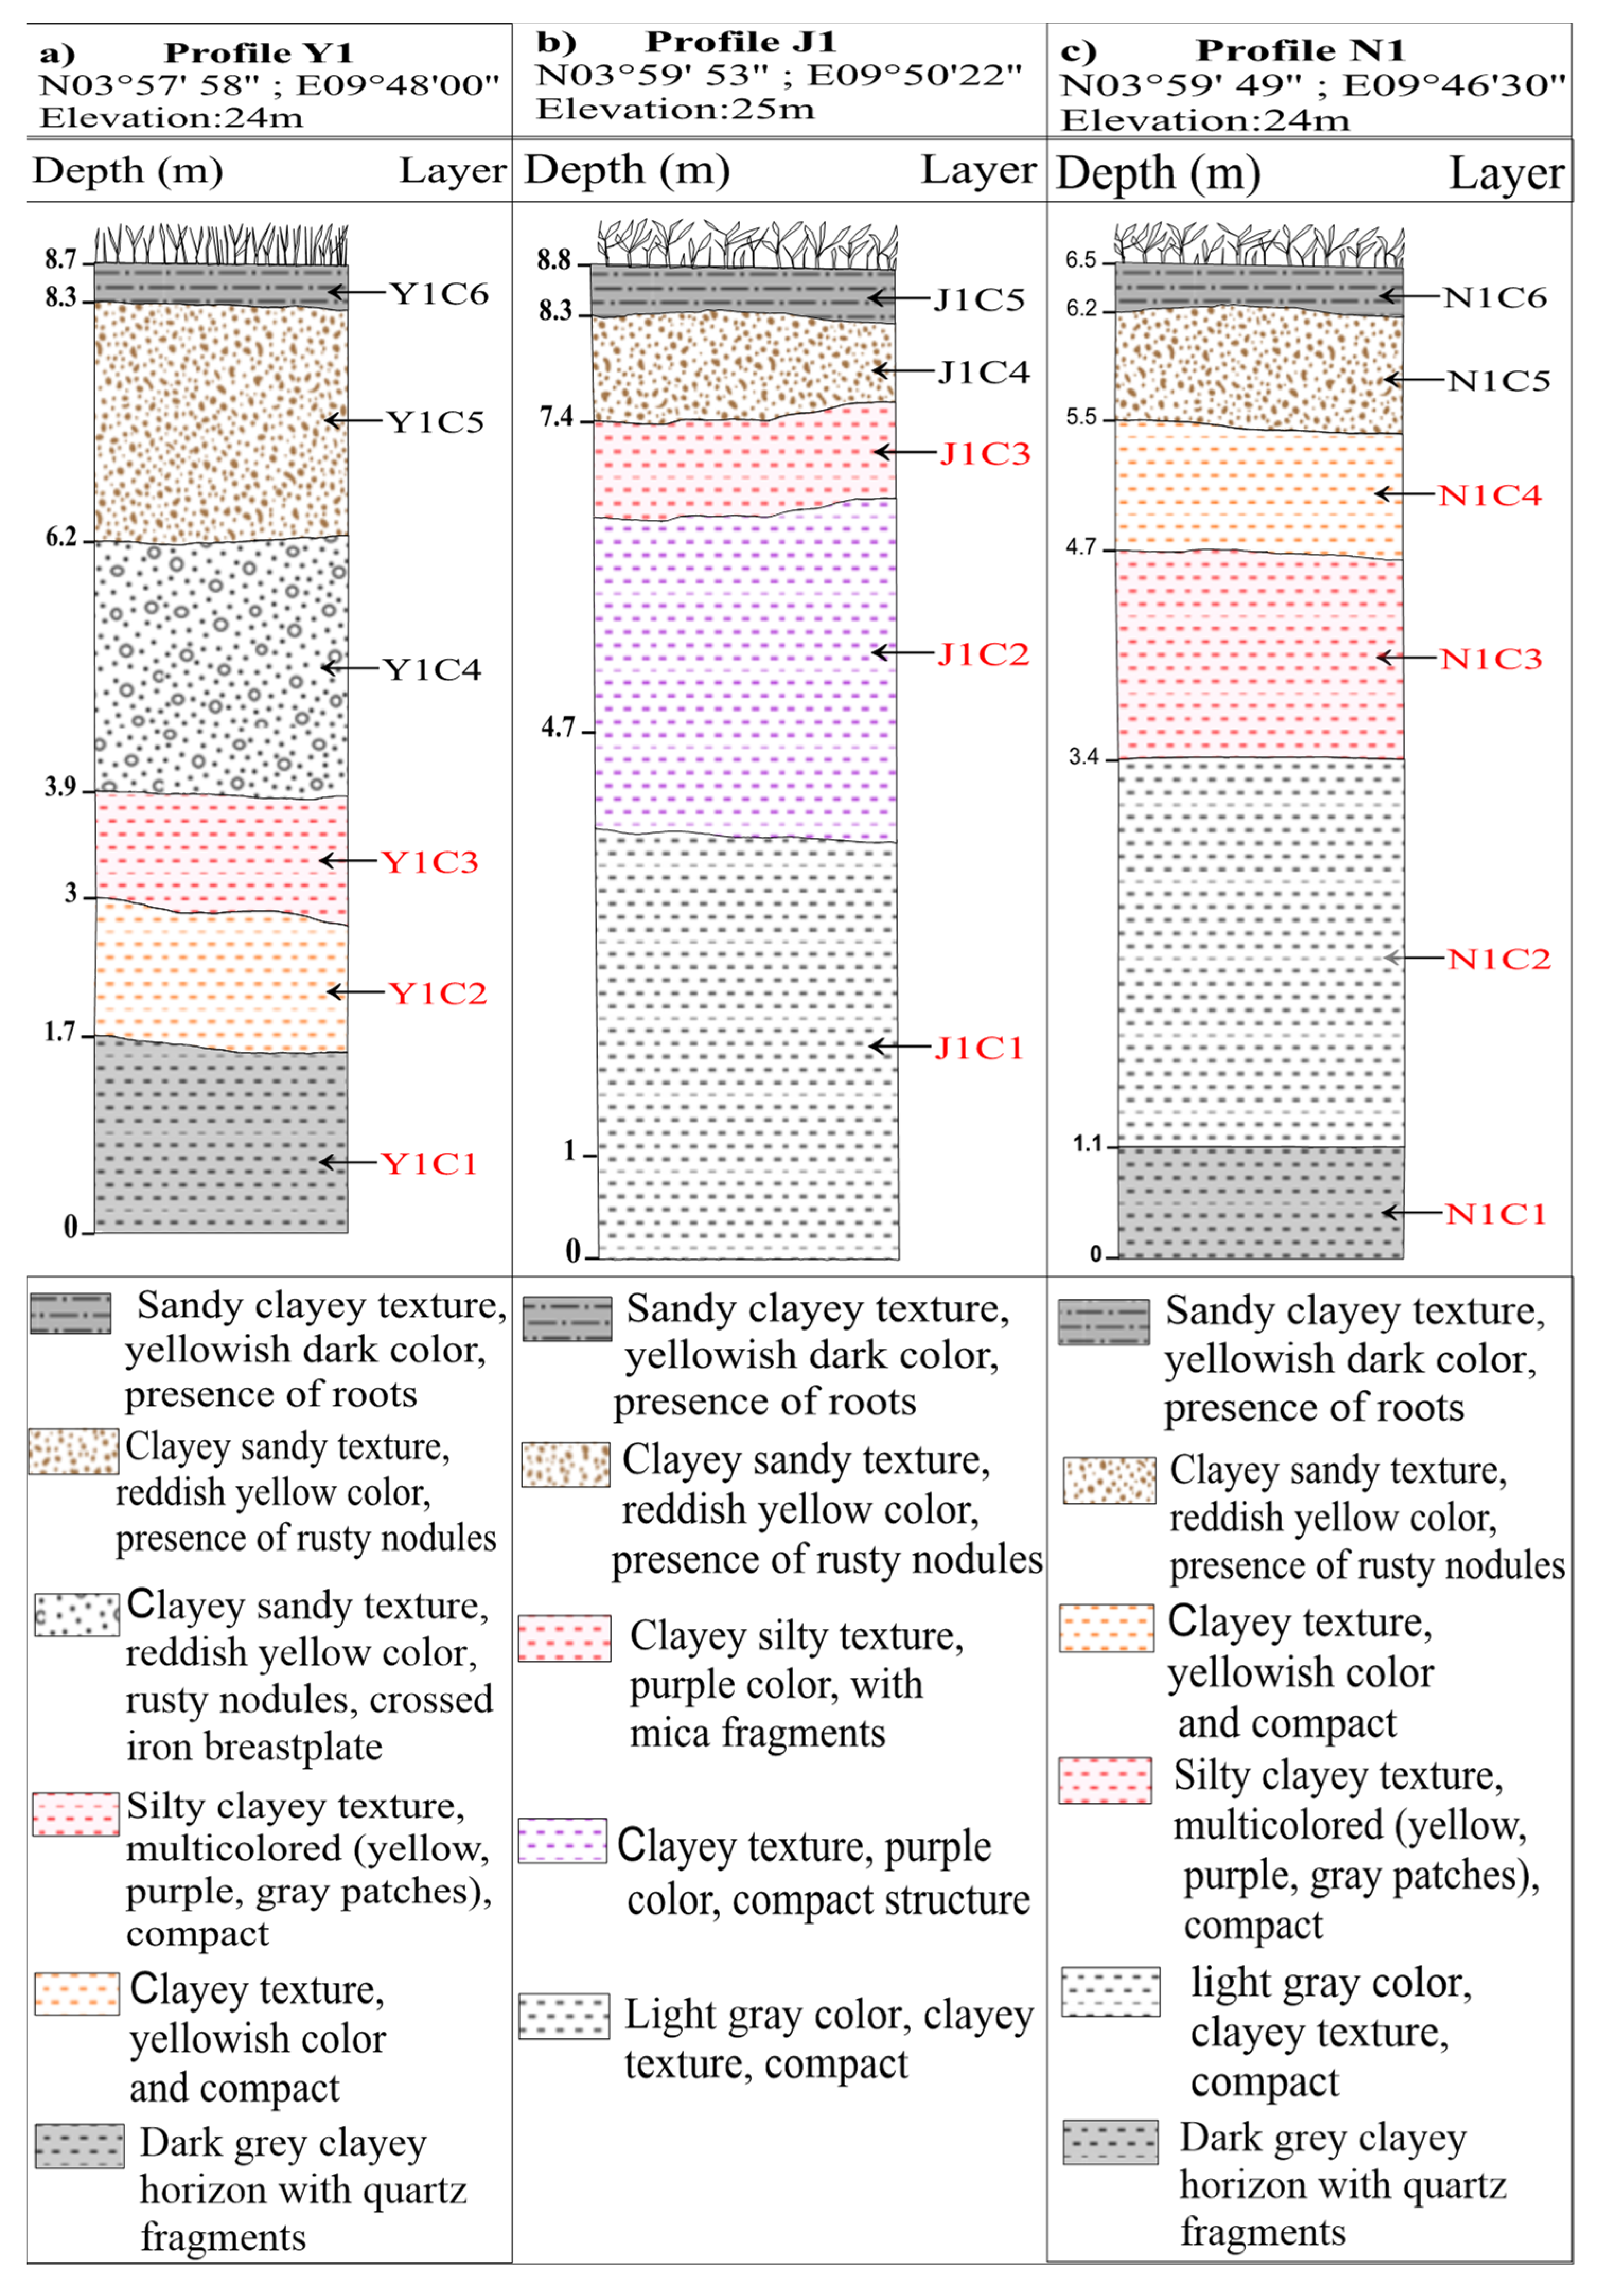
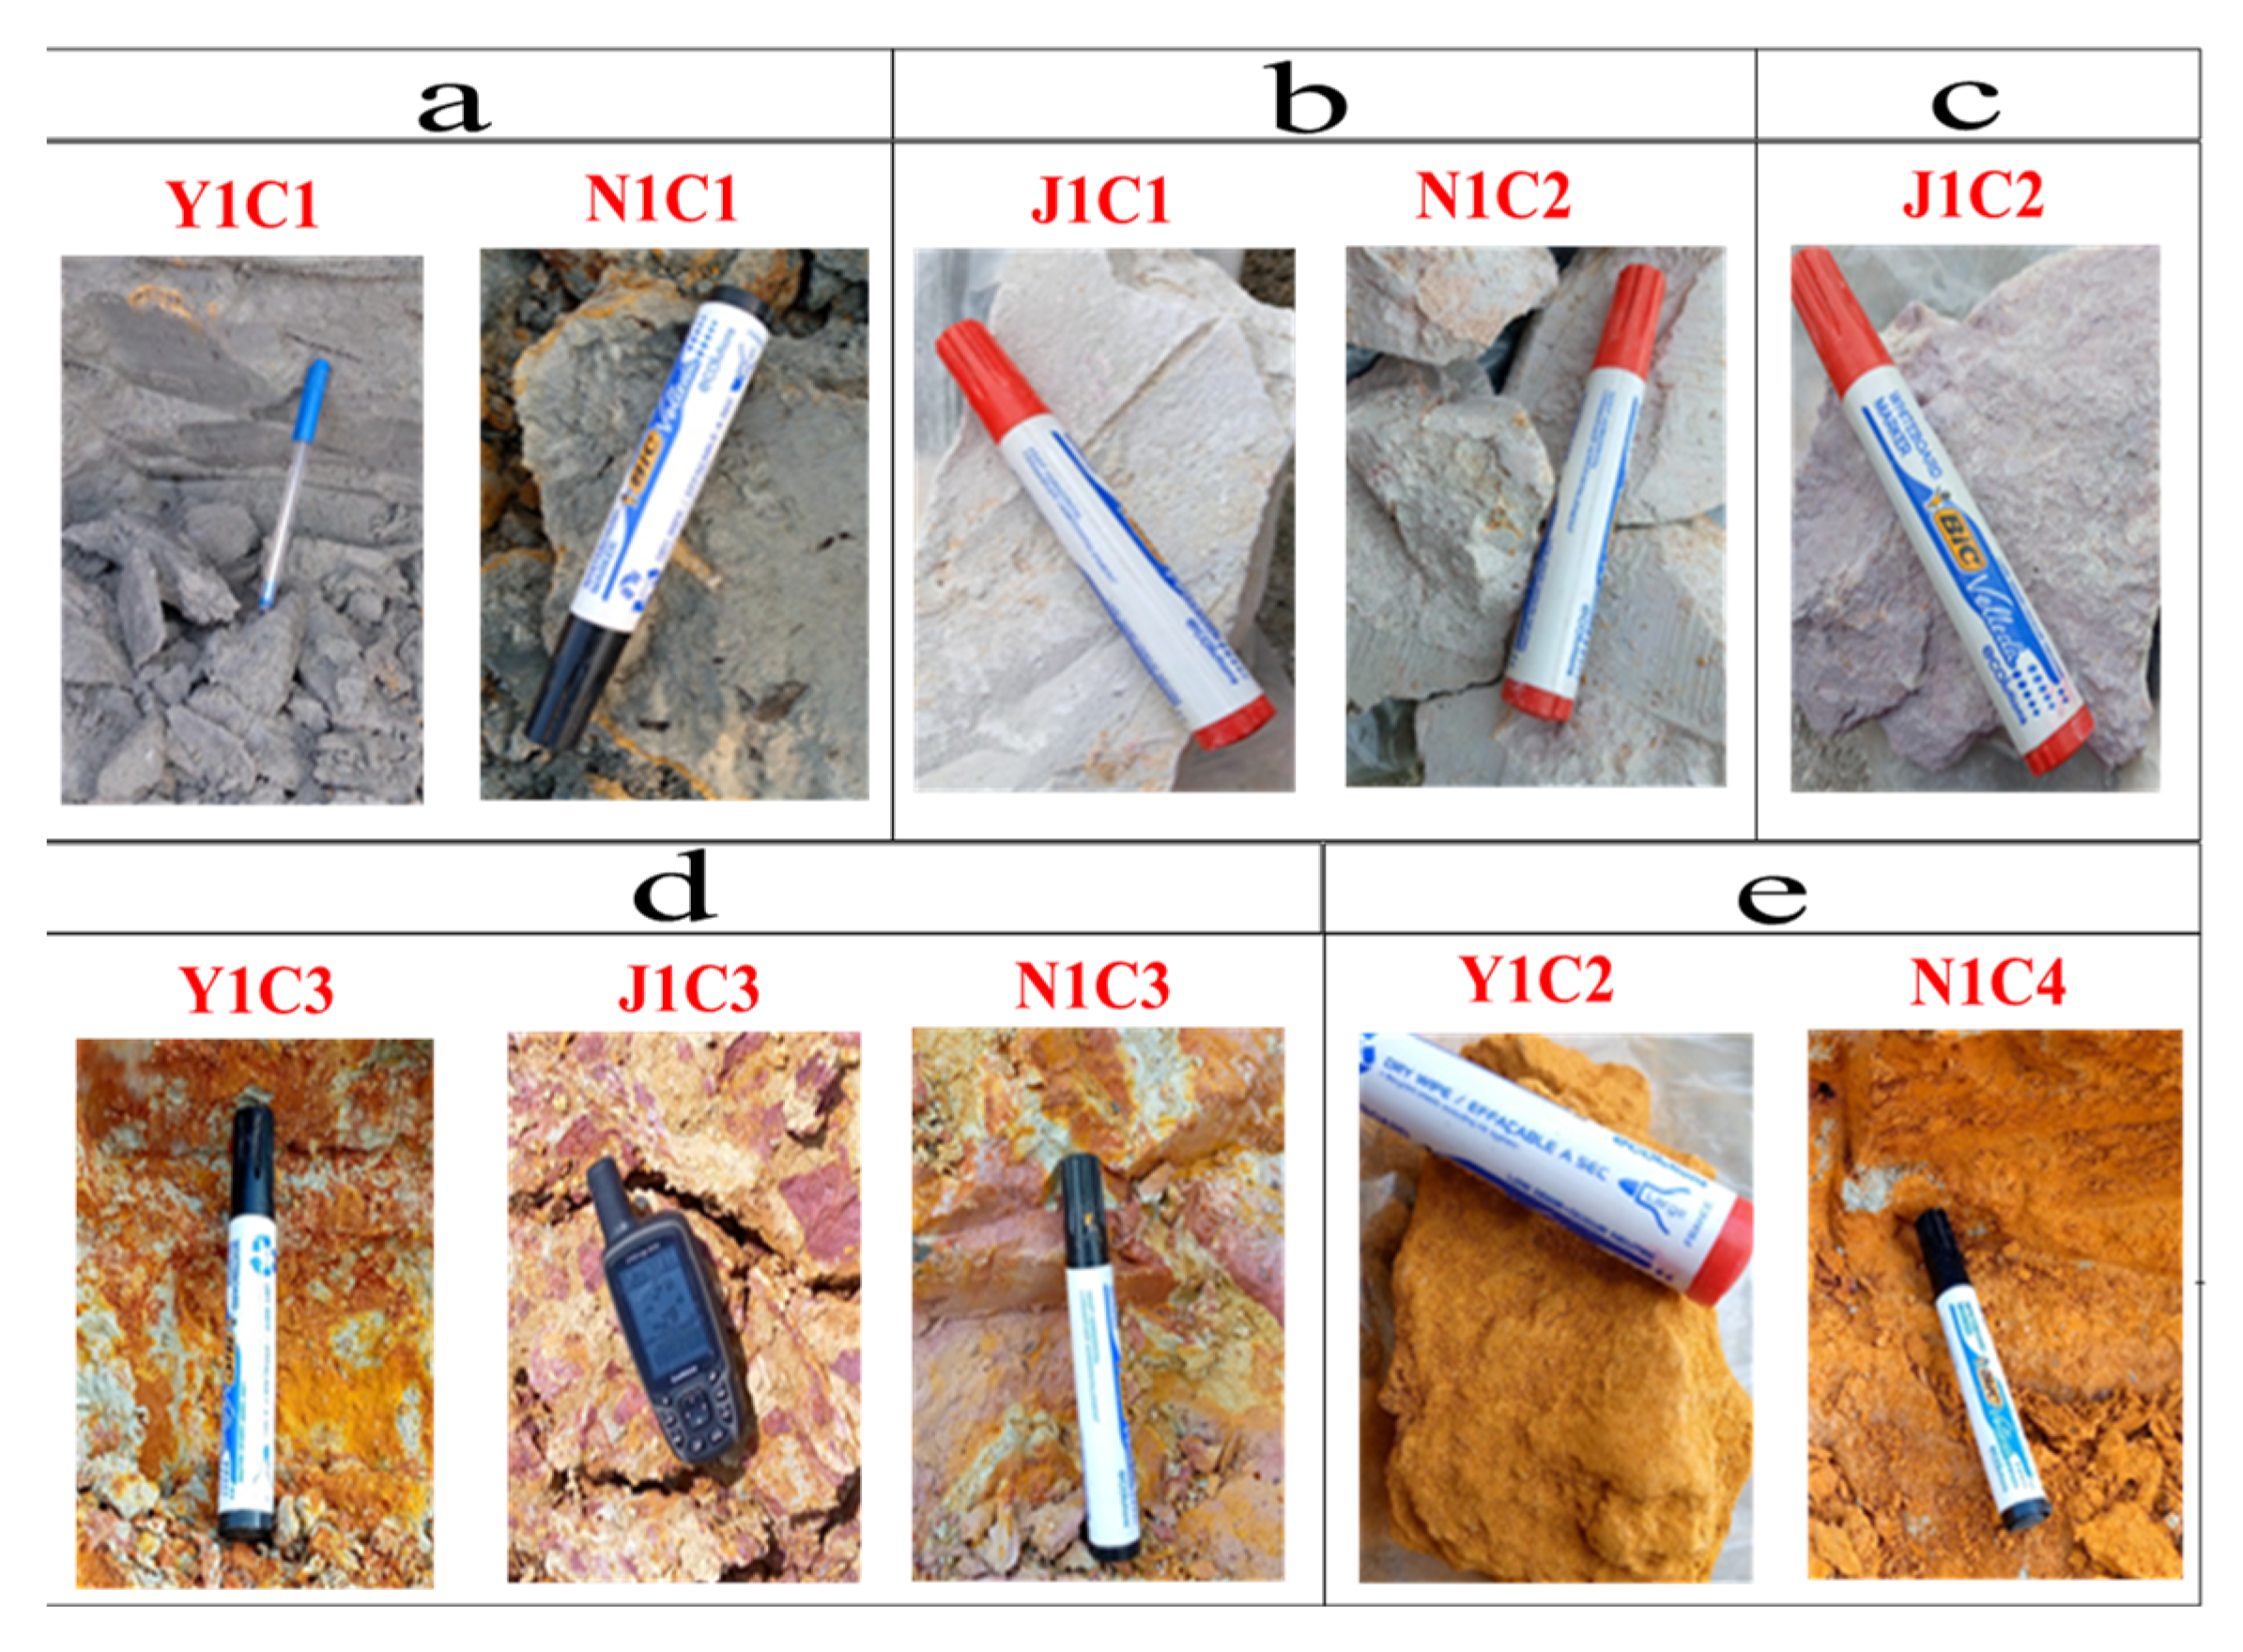
3.1. Samples and Sampling Process
3.2. Analytical Techniques
4. Results and Discussion
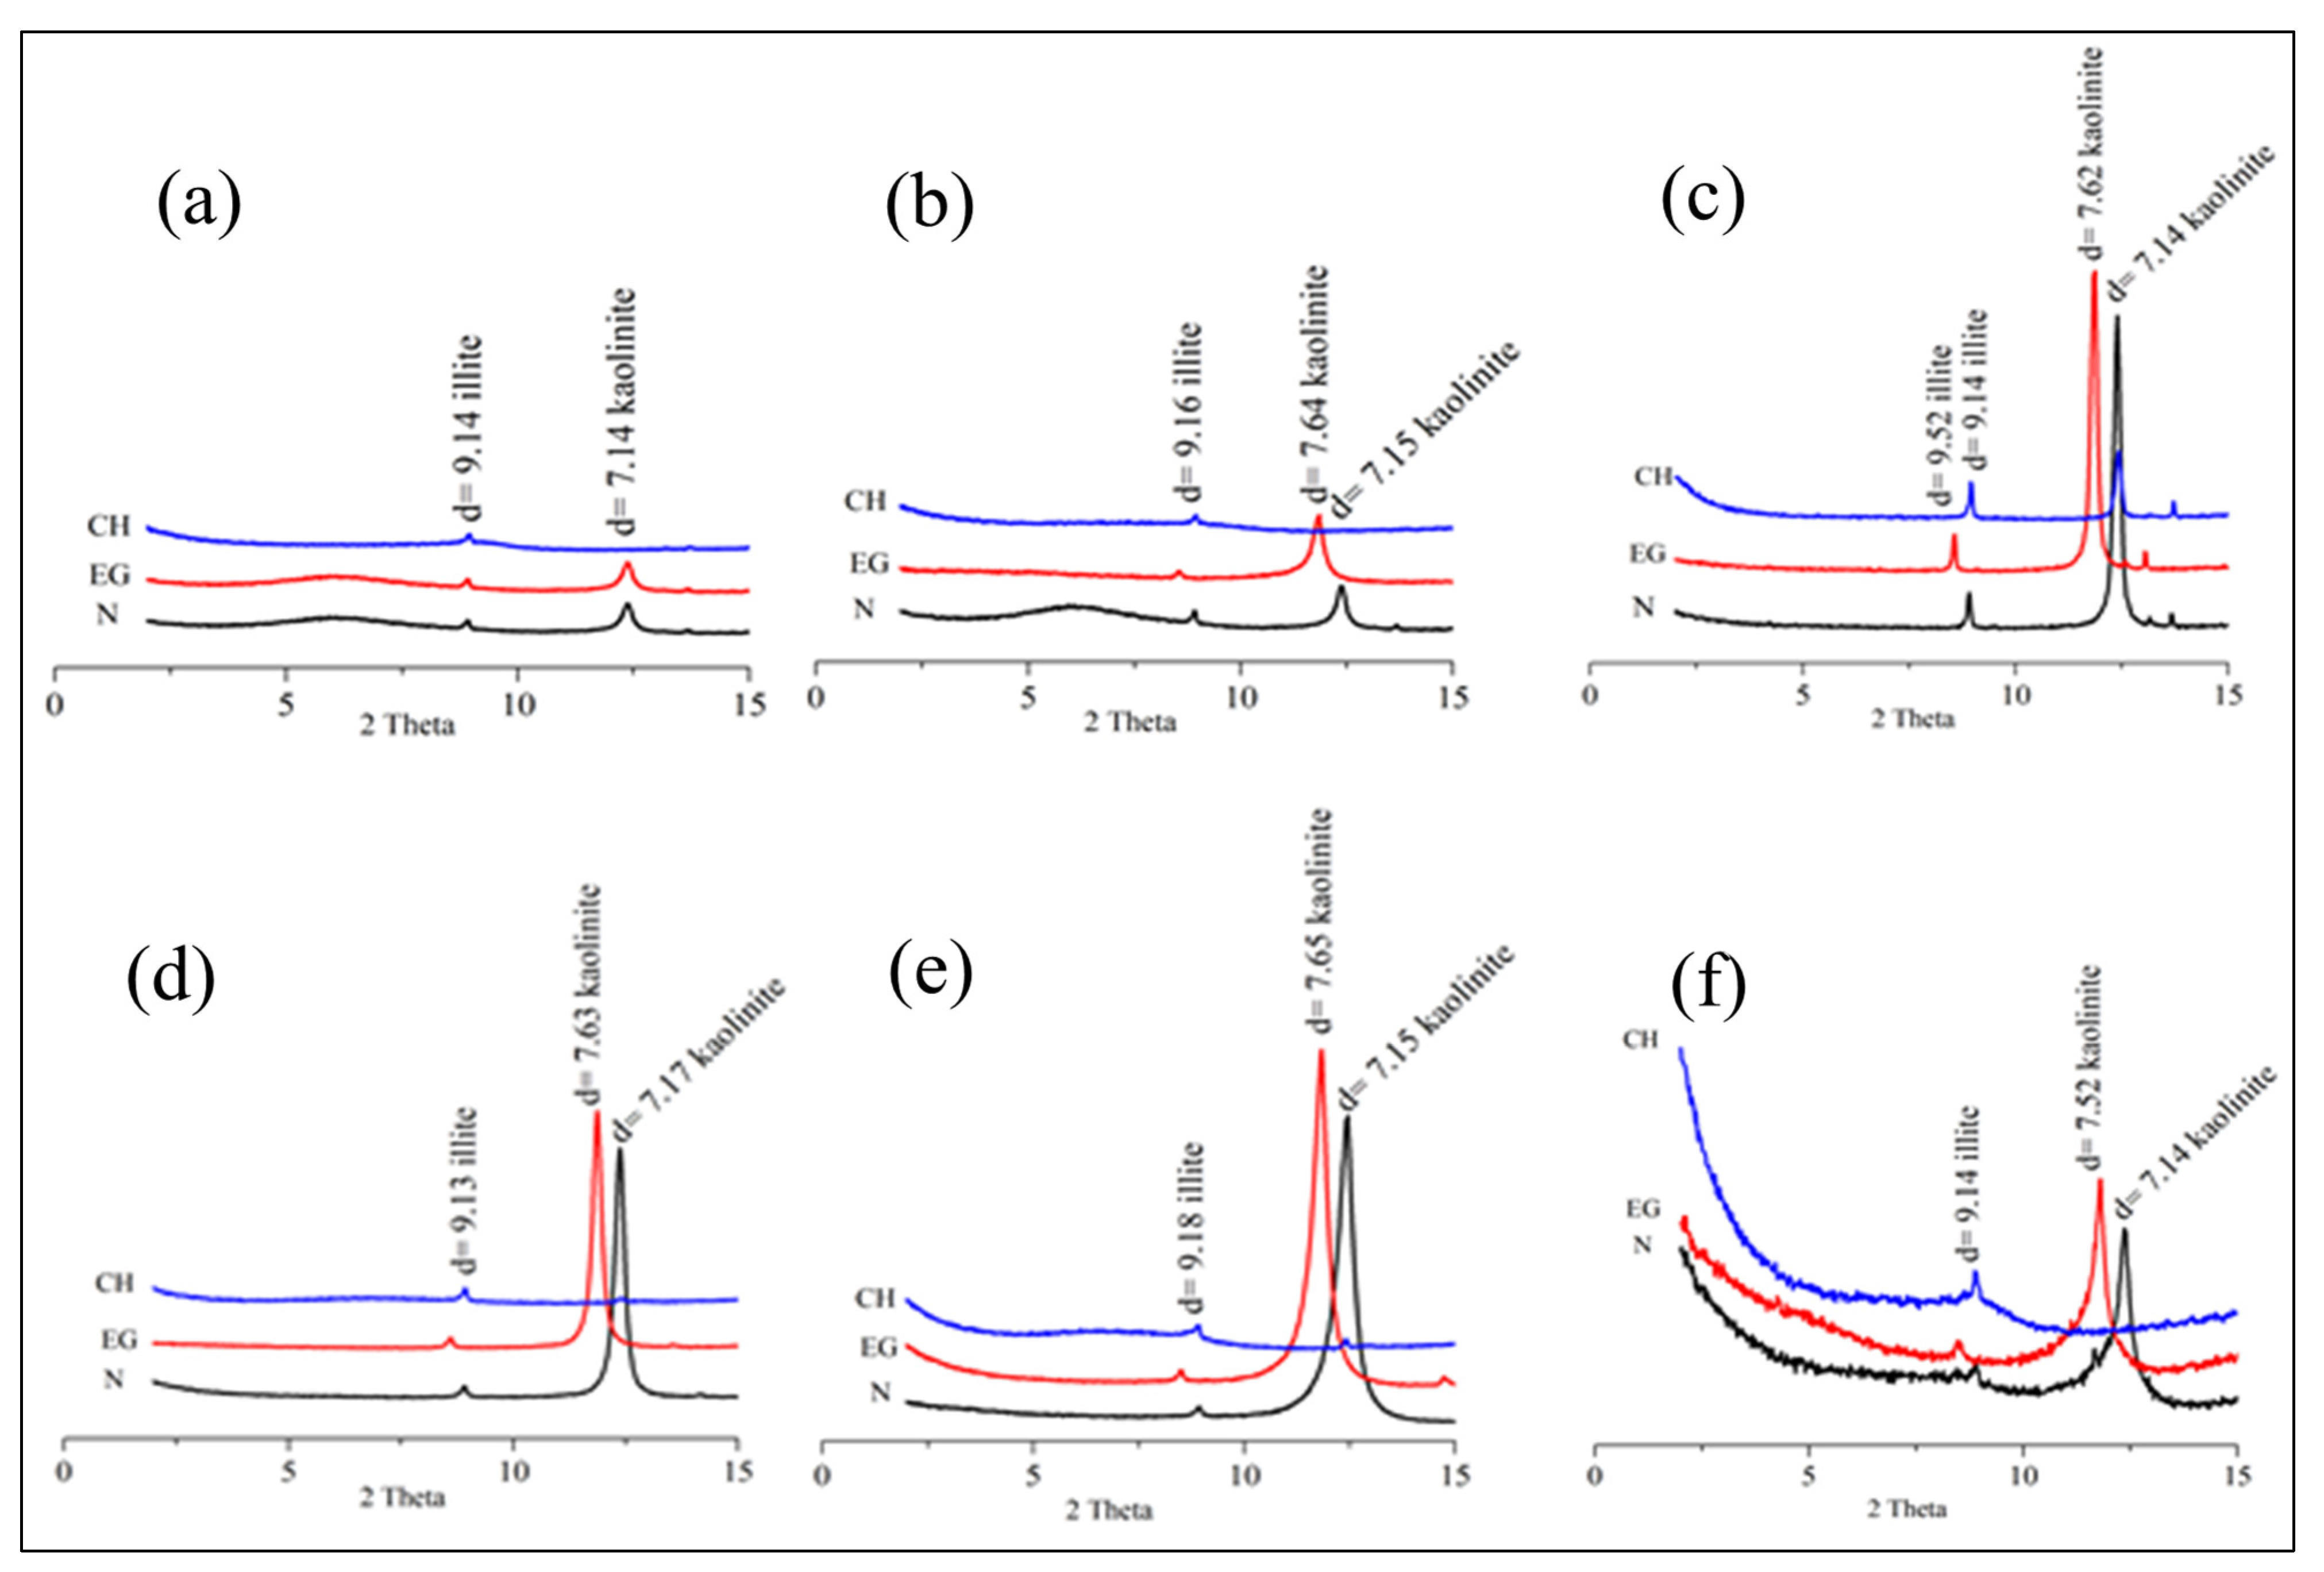
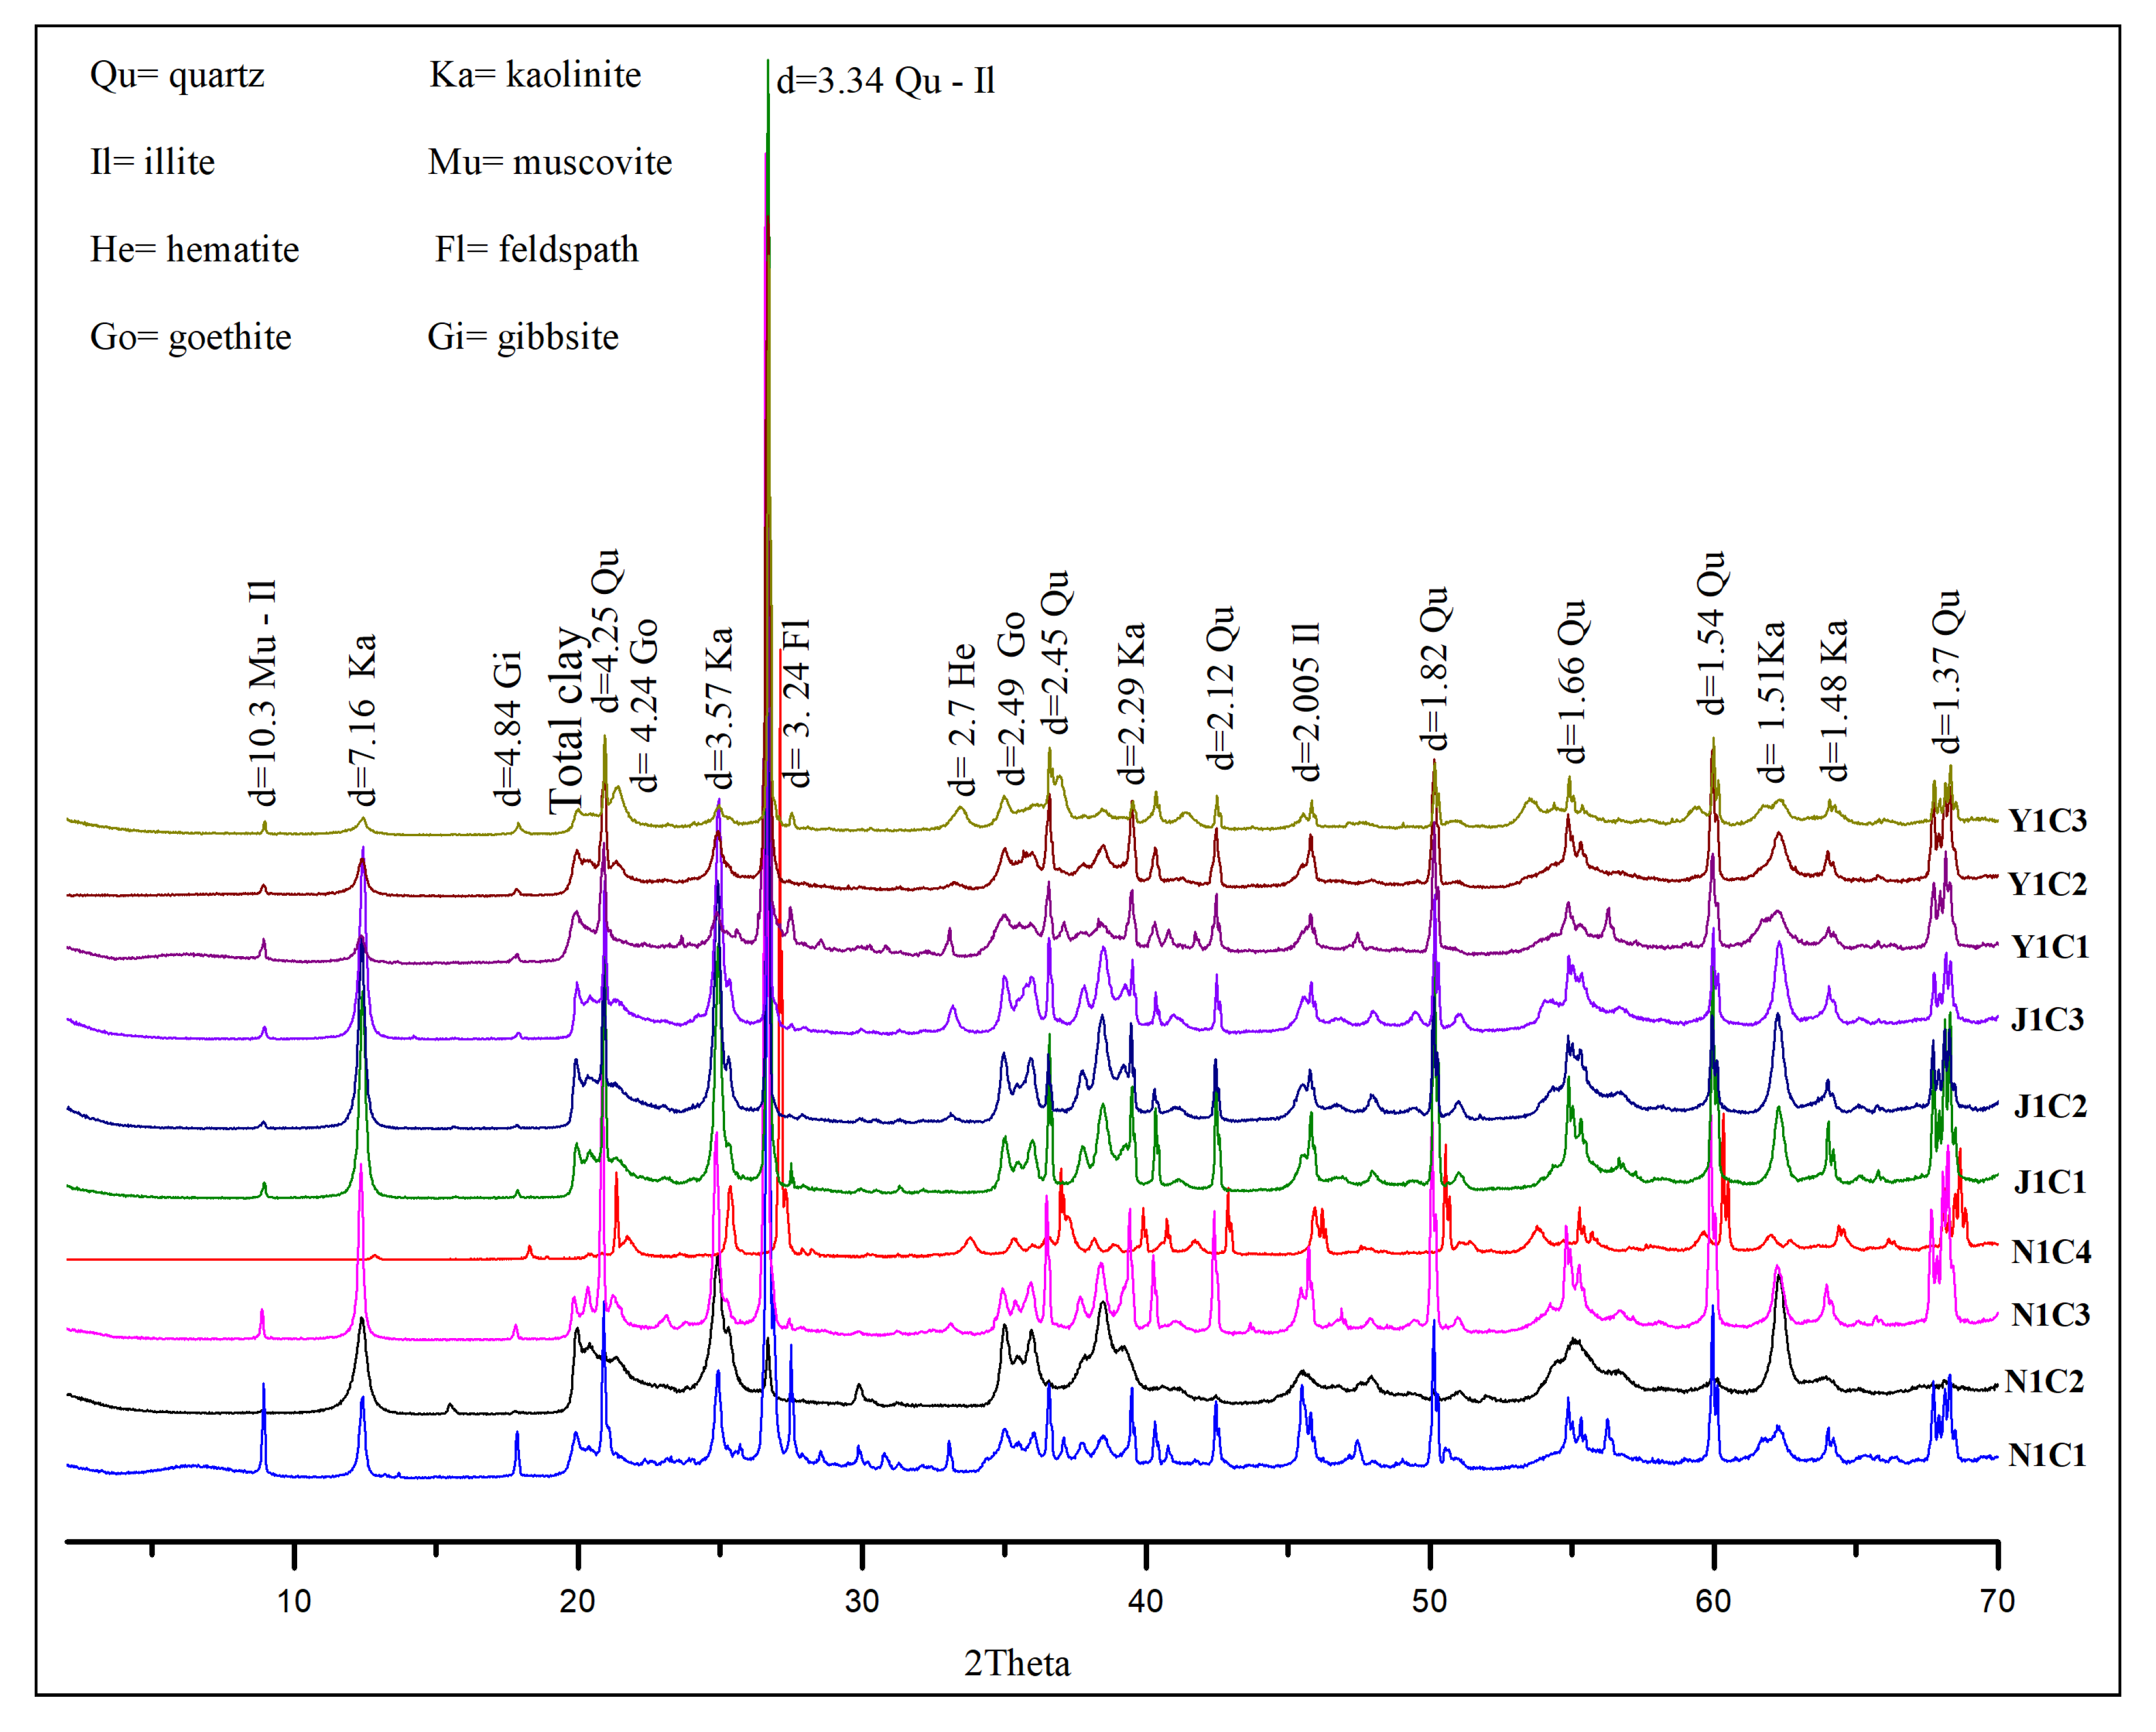
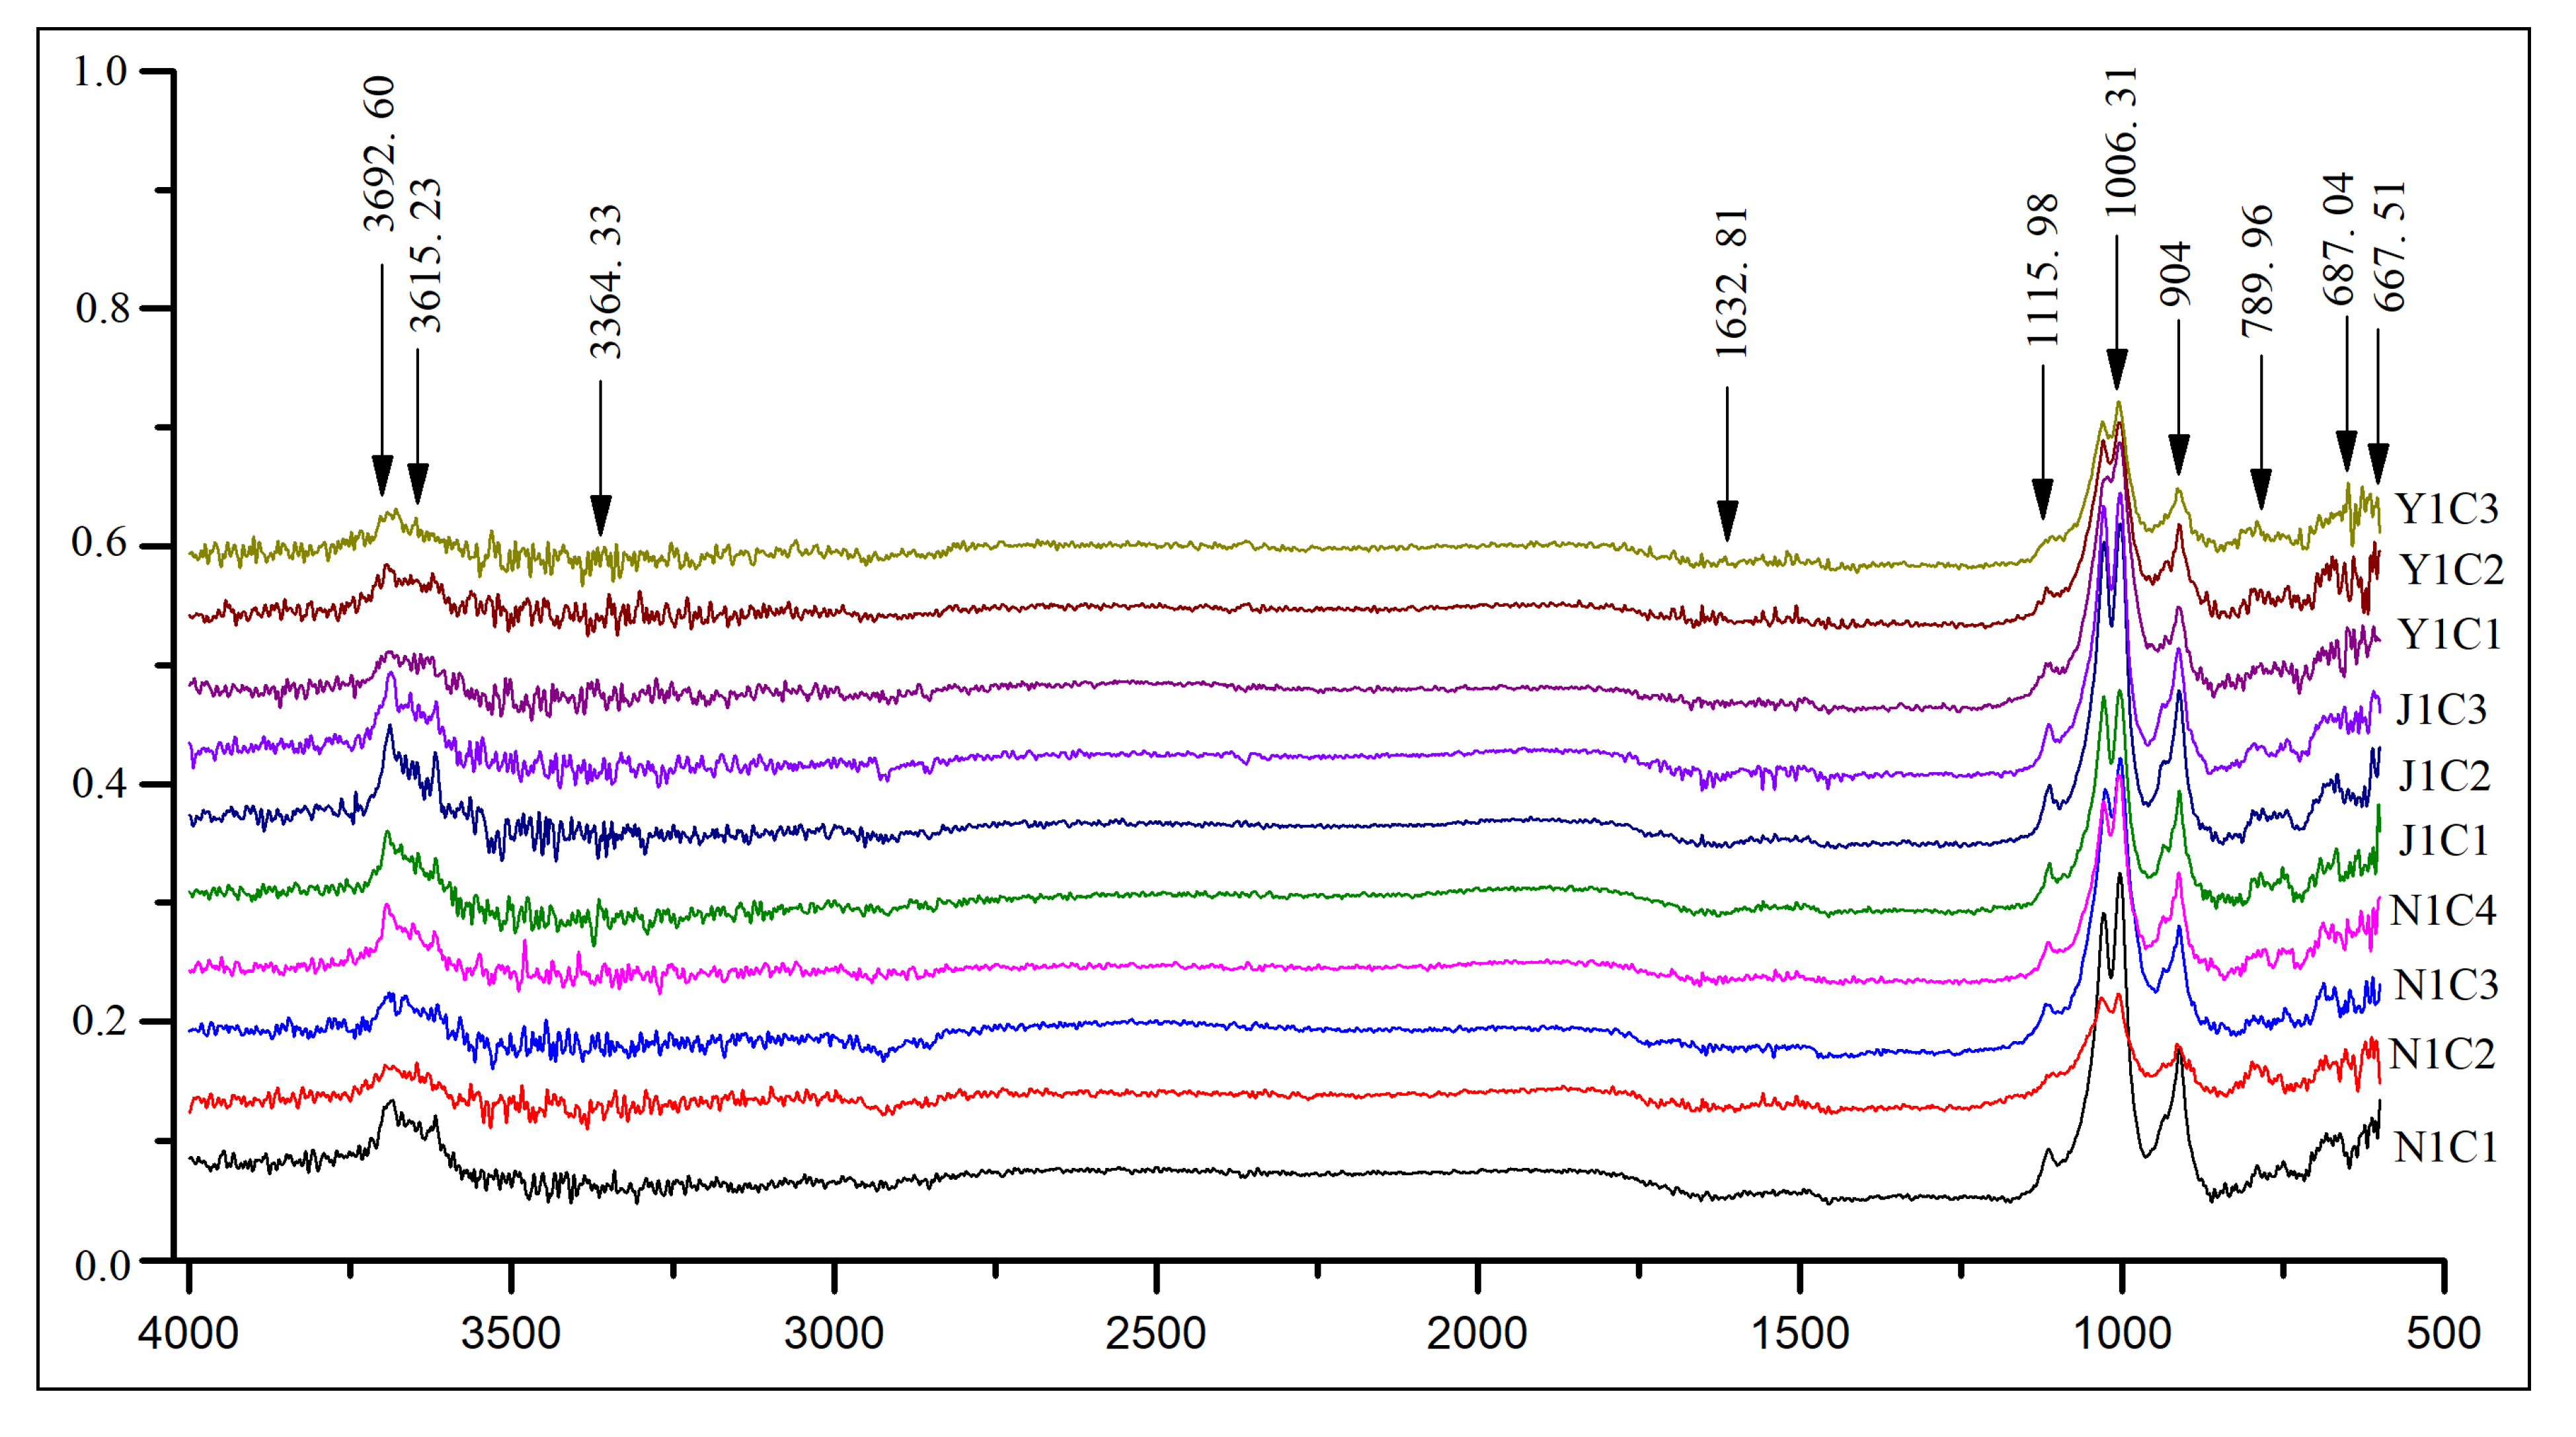
4.1. Mineralogy
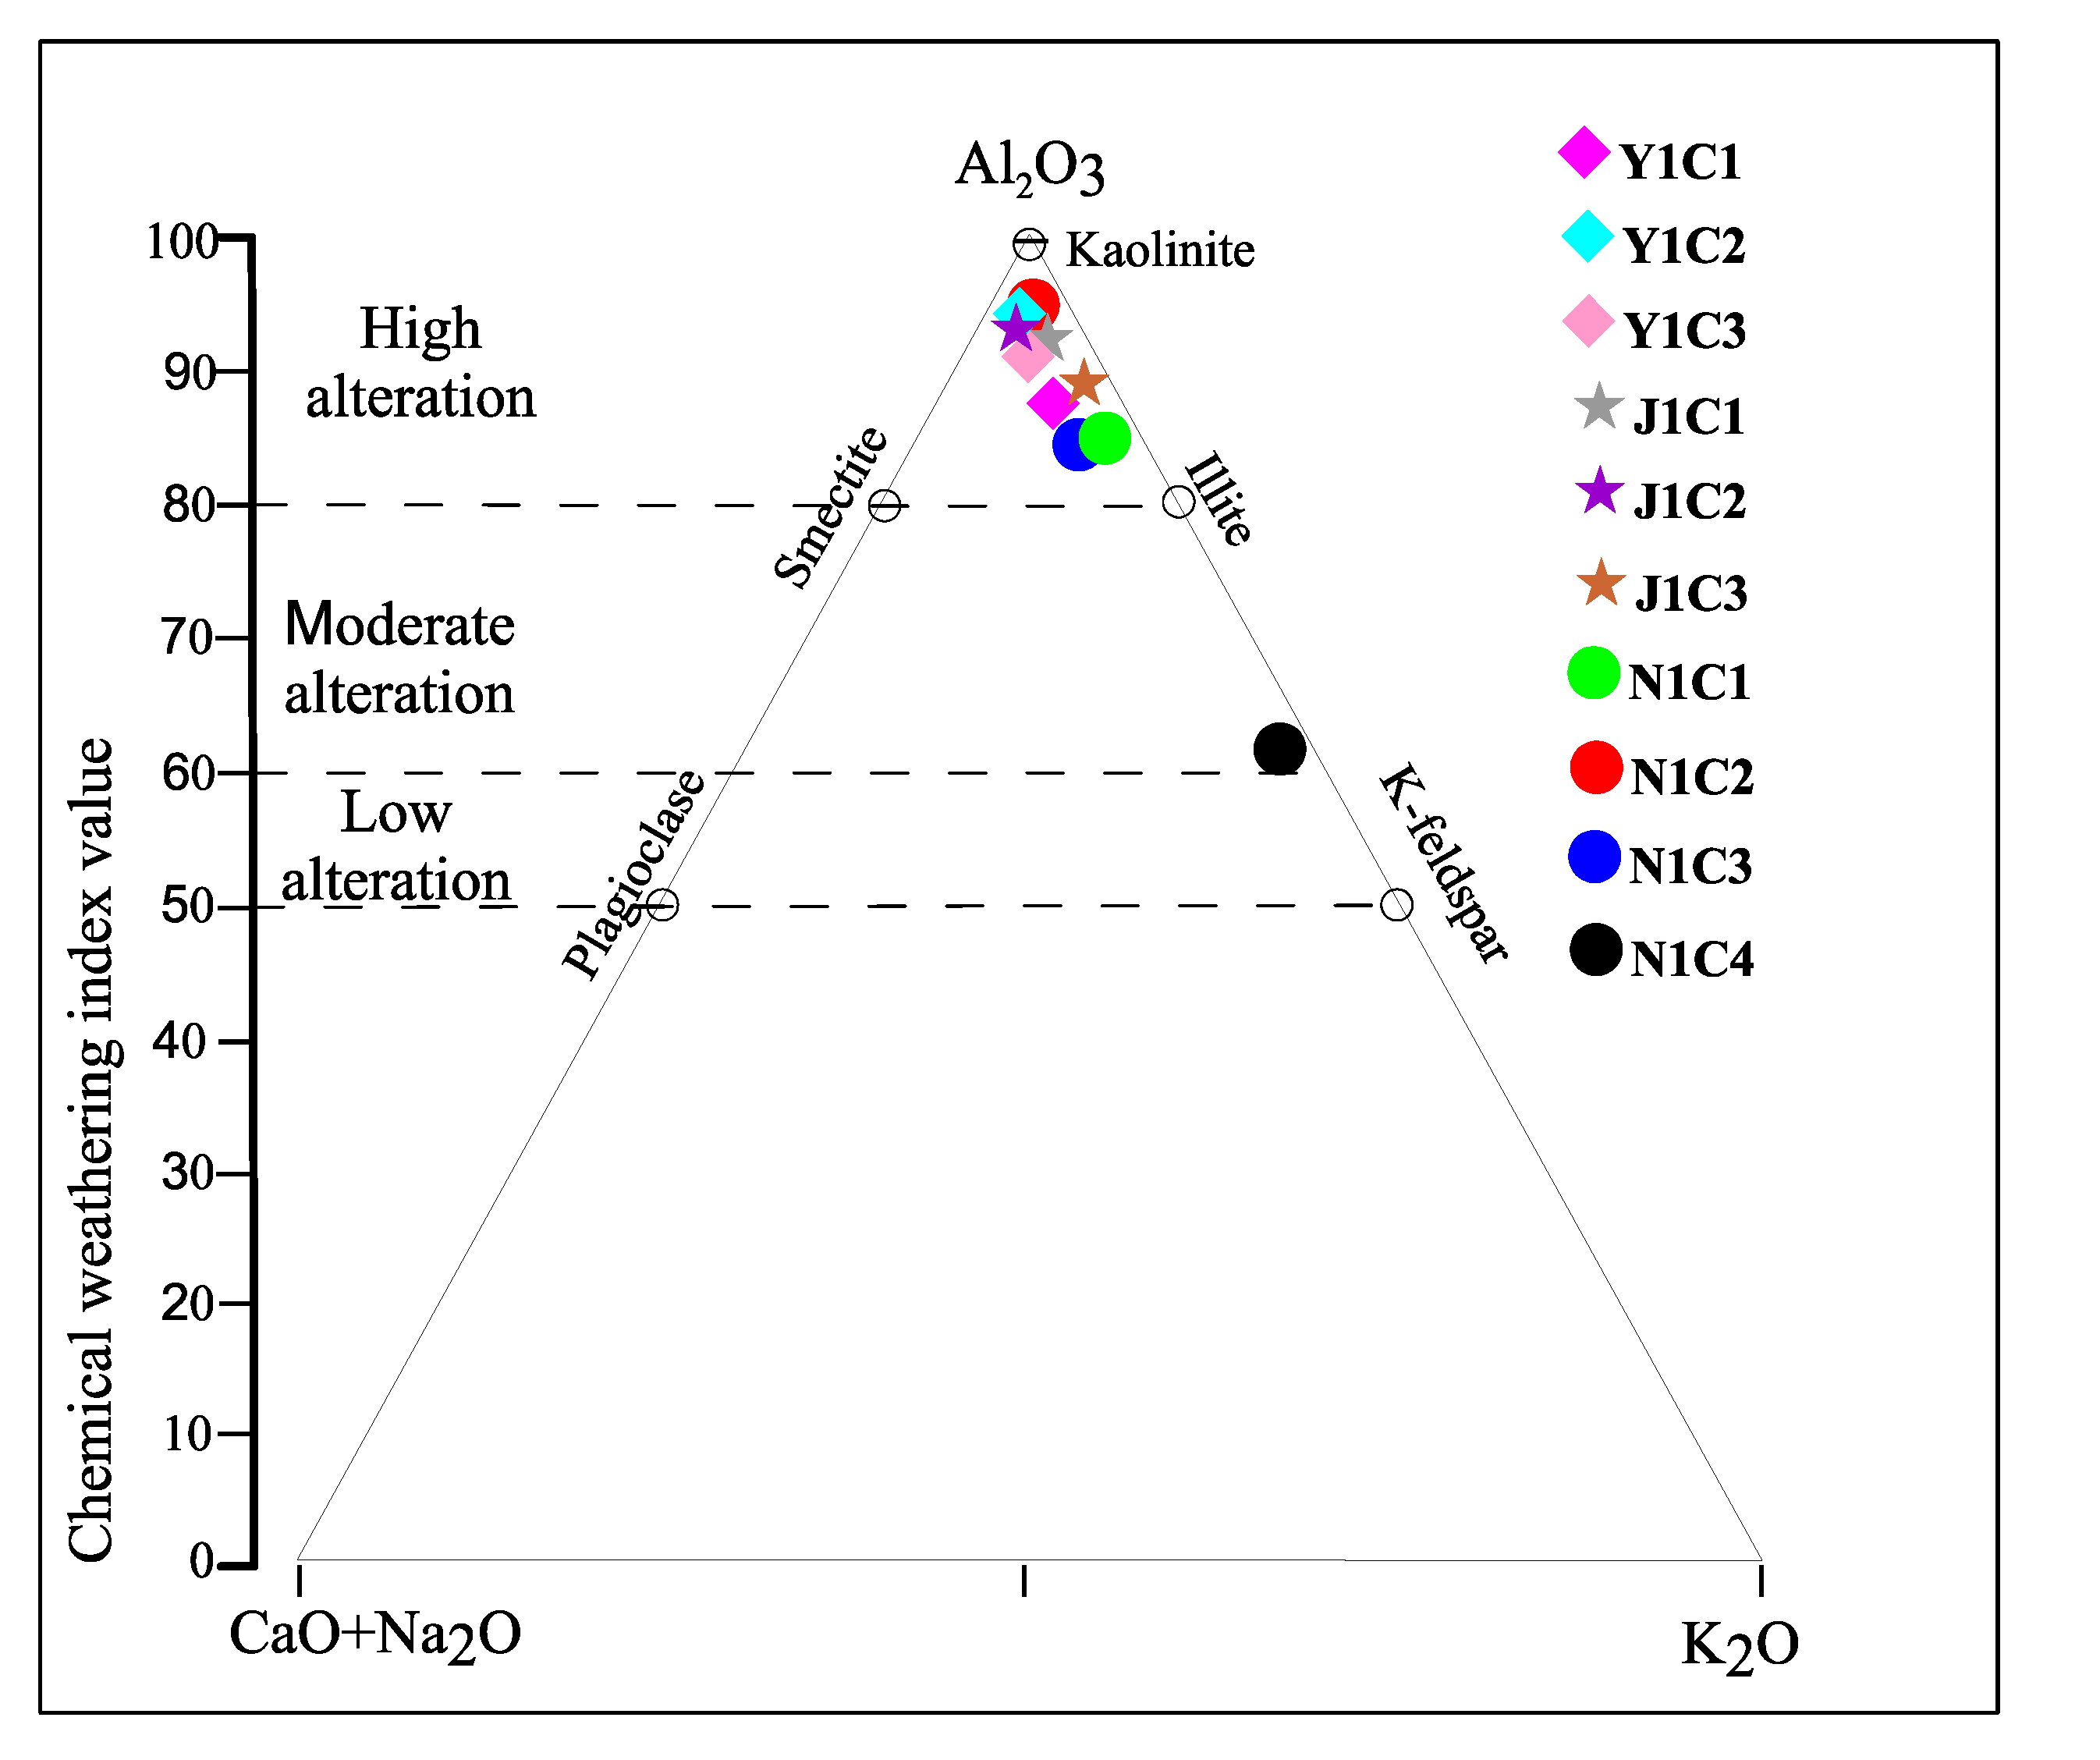
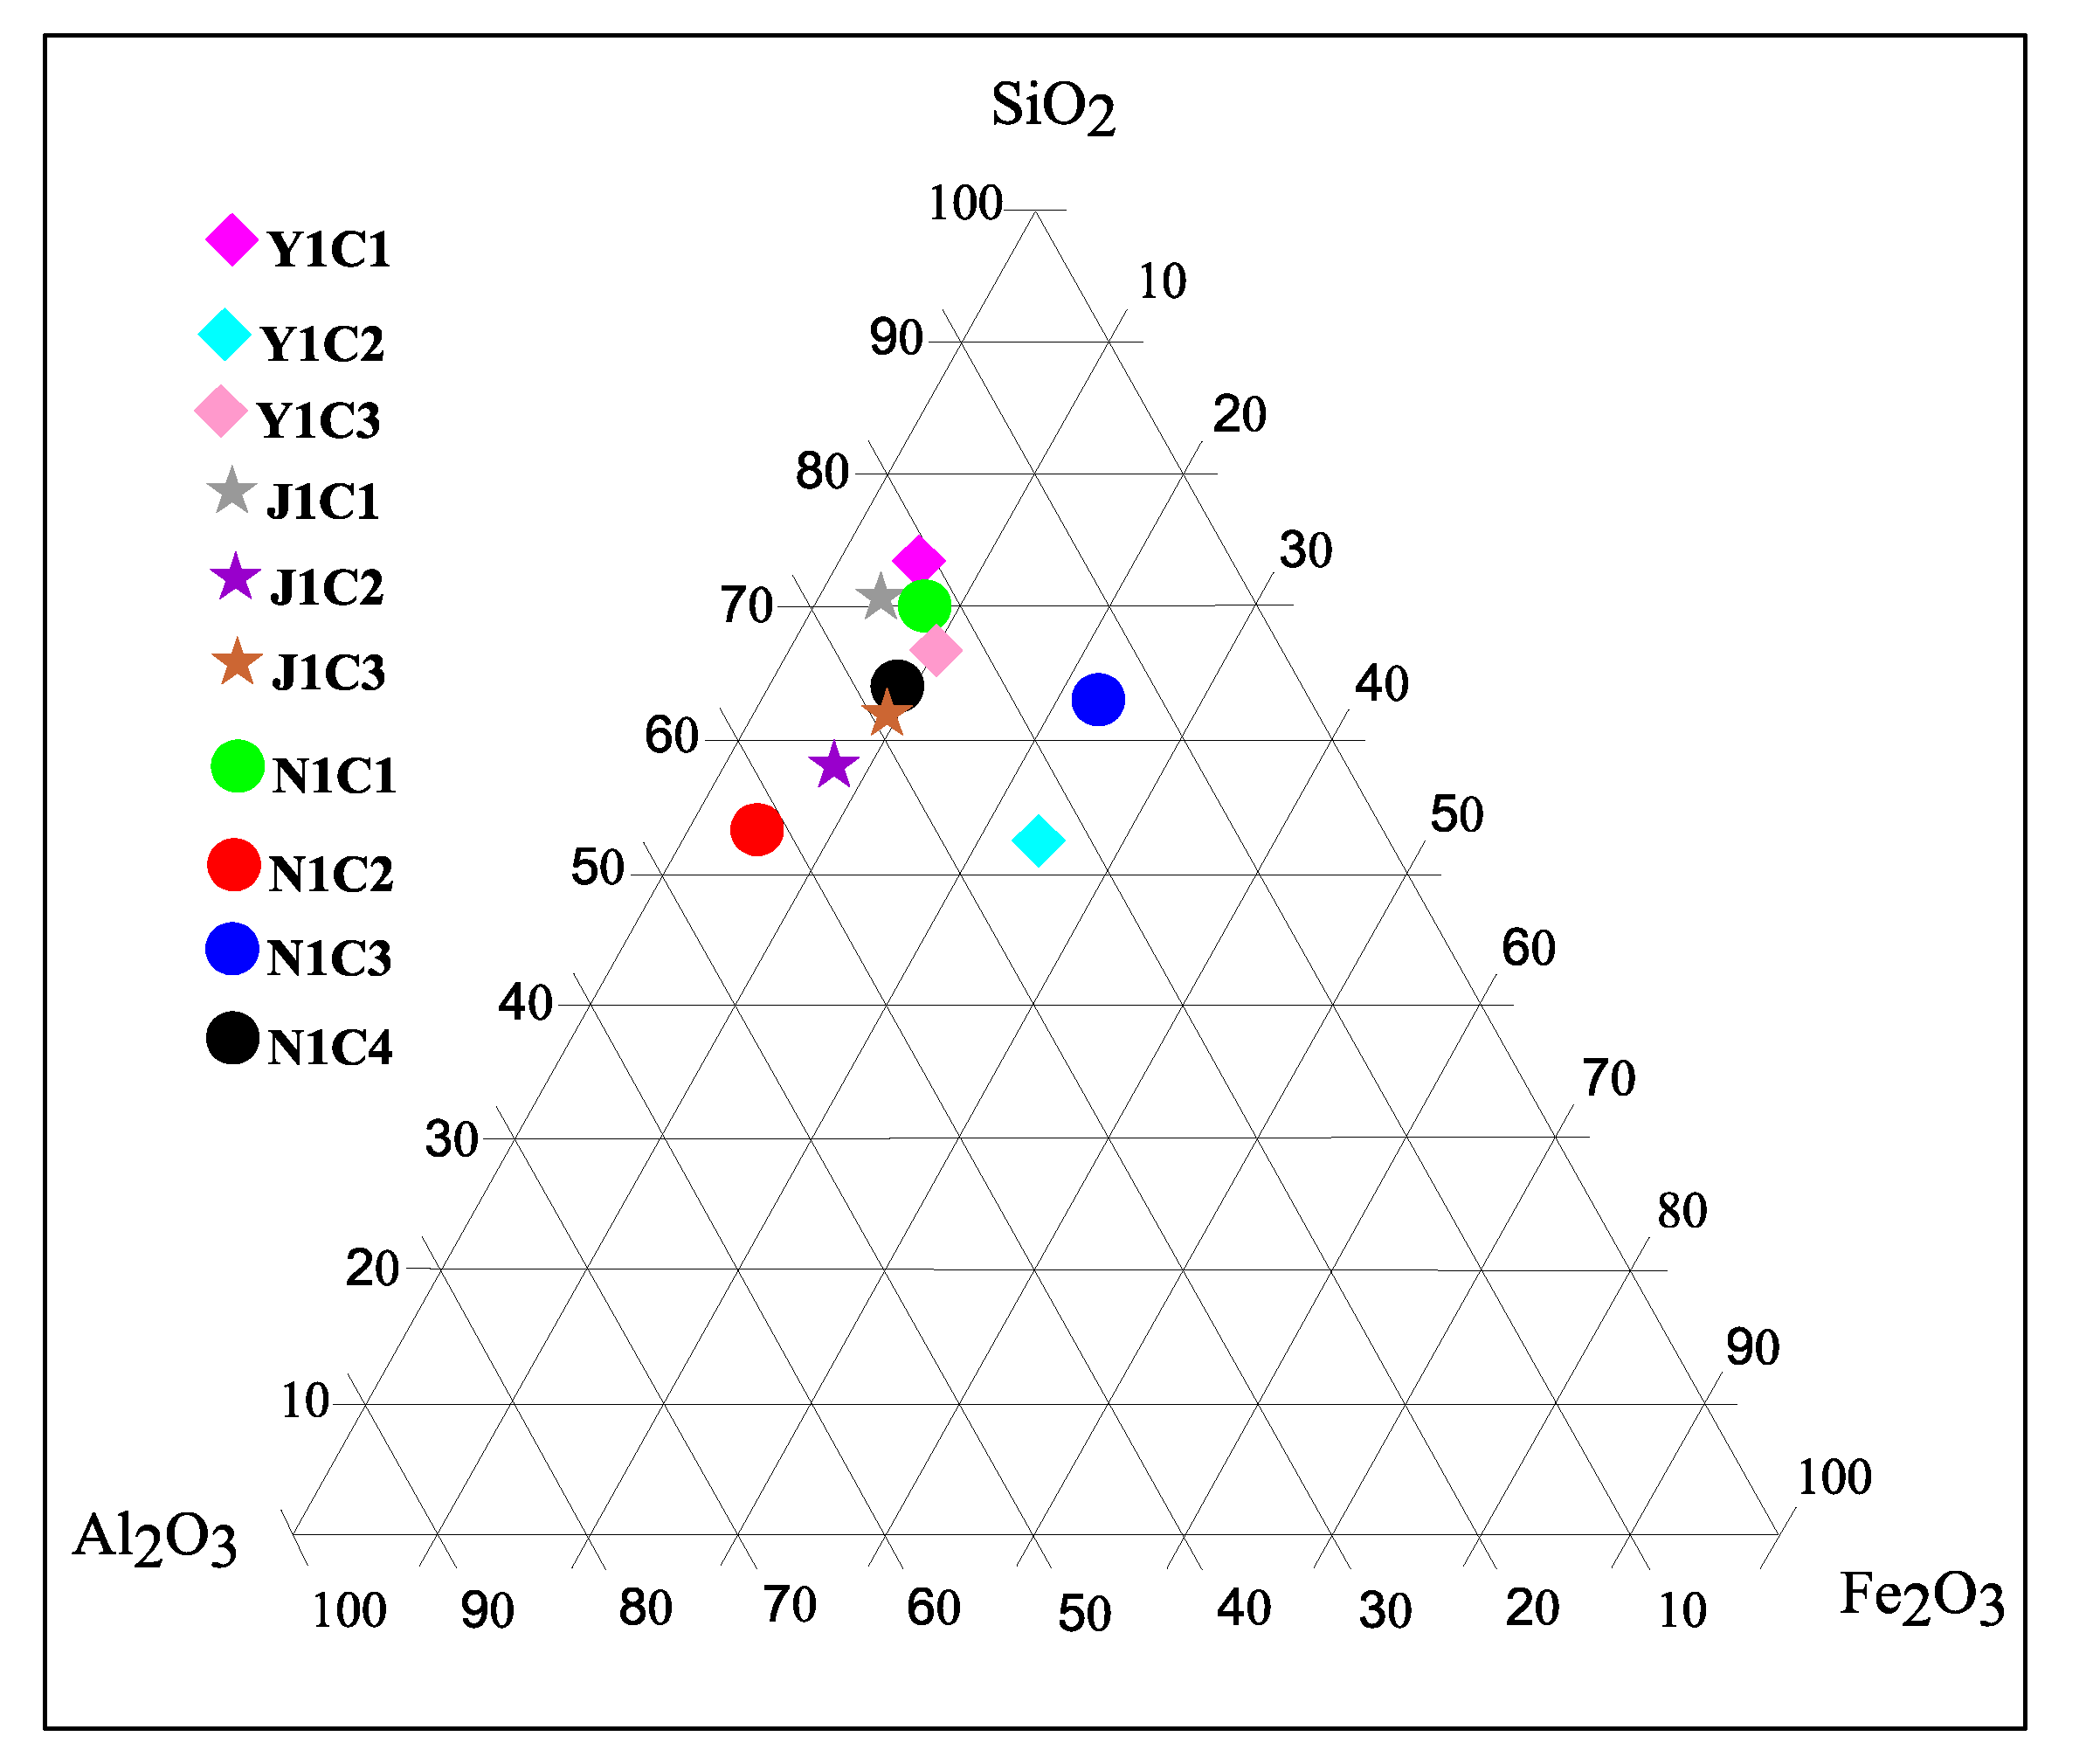
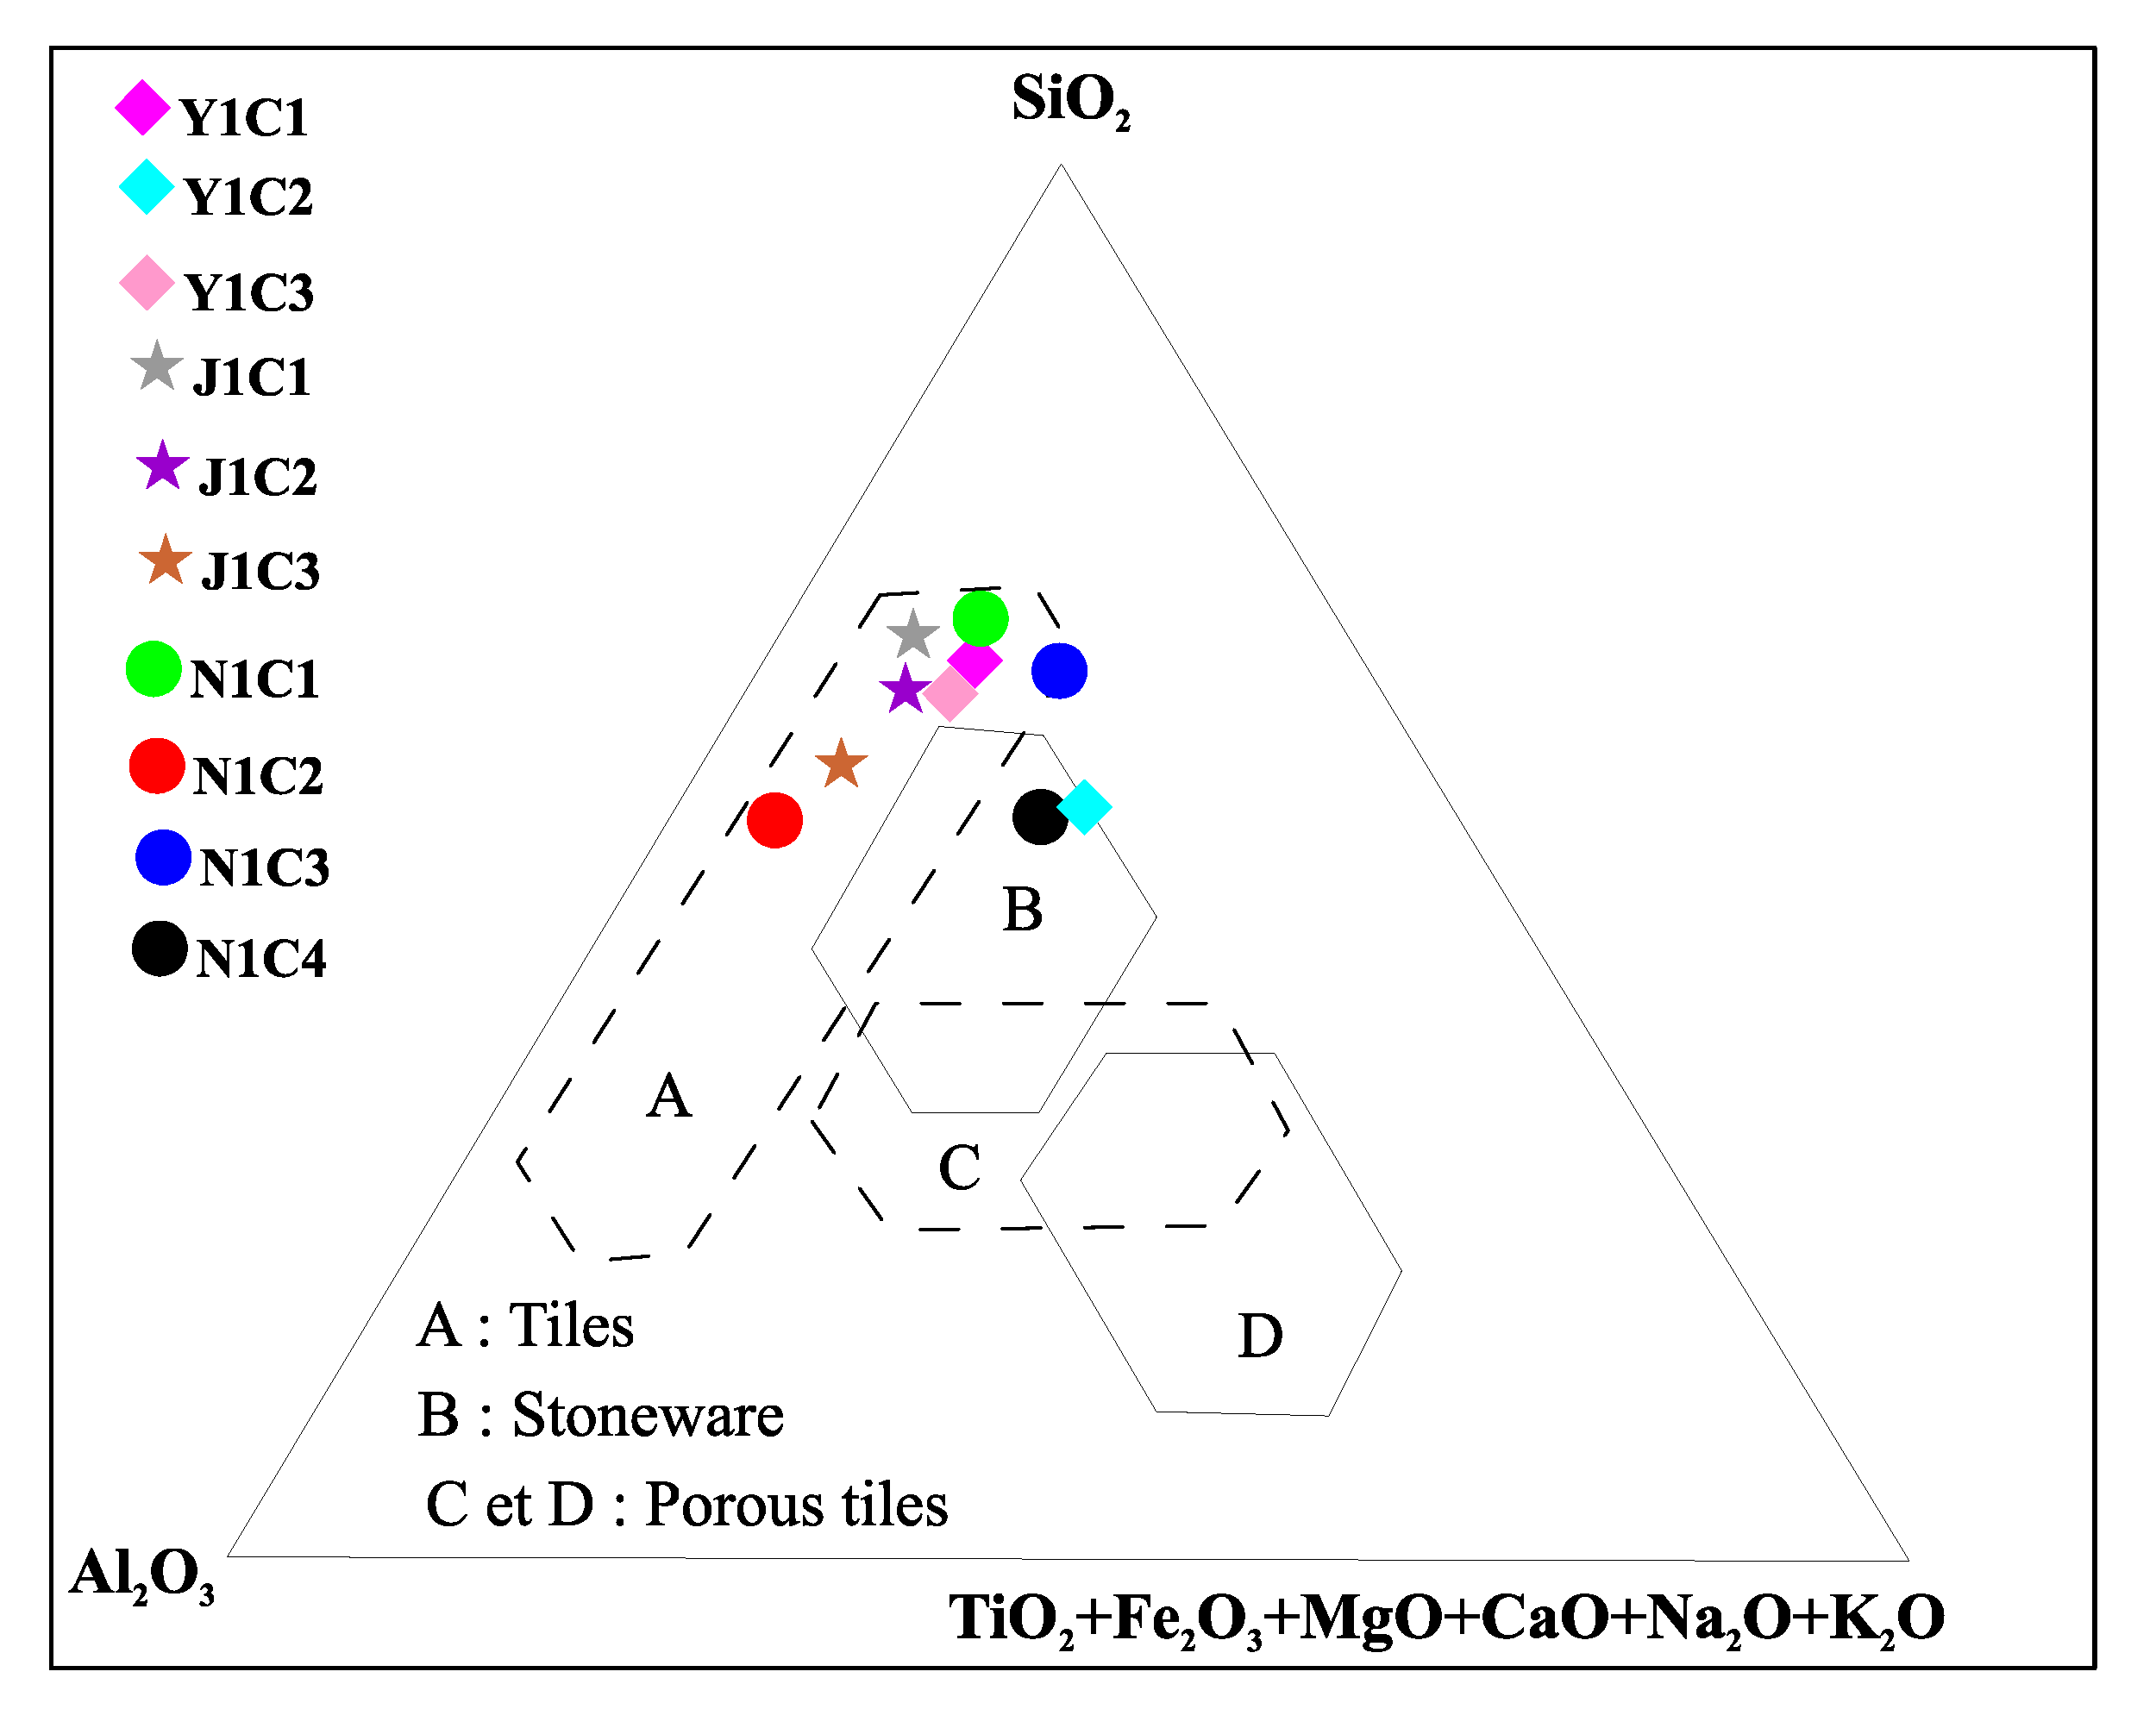
4.2. Geochemistry
4.3. Physicochemical Properties
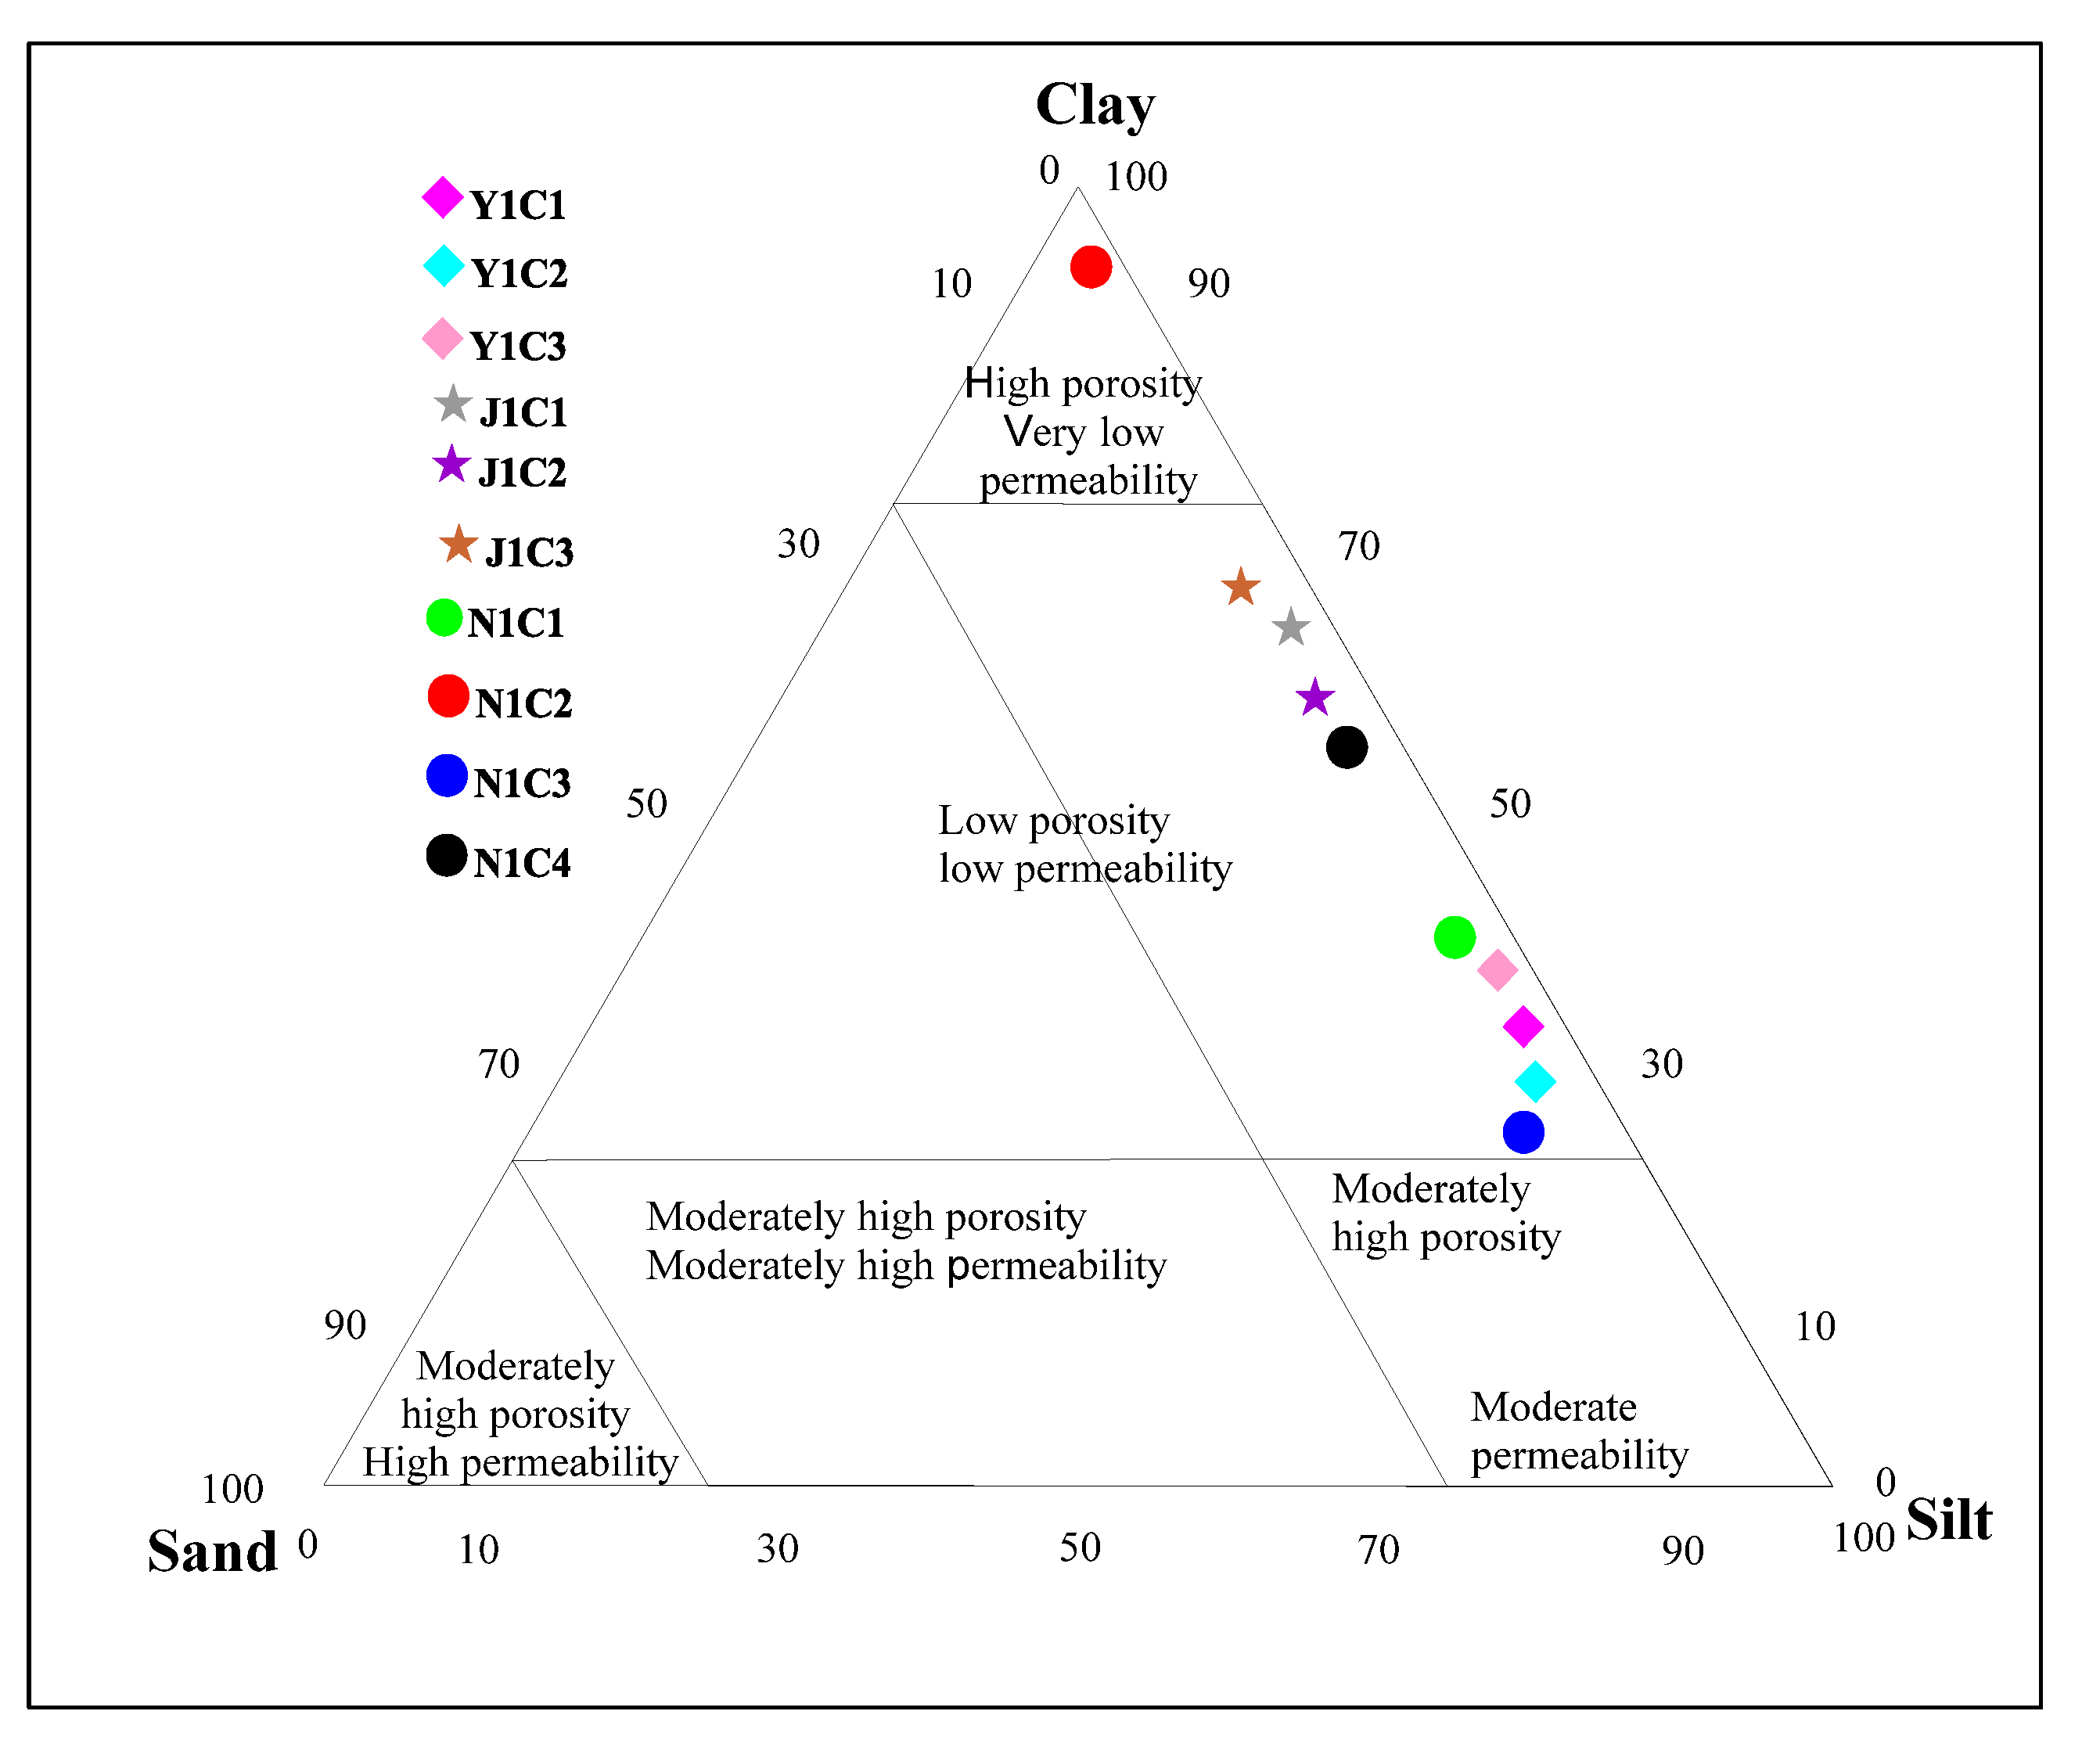
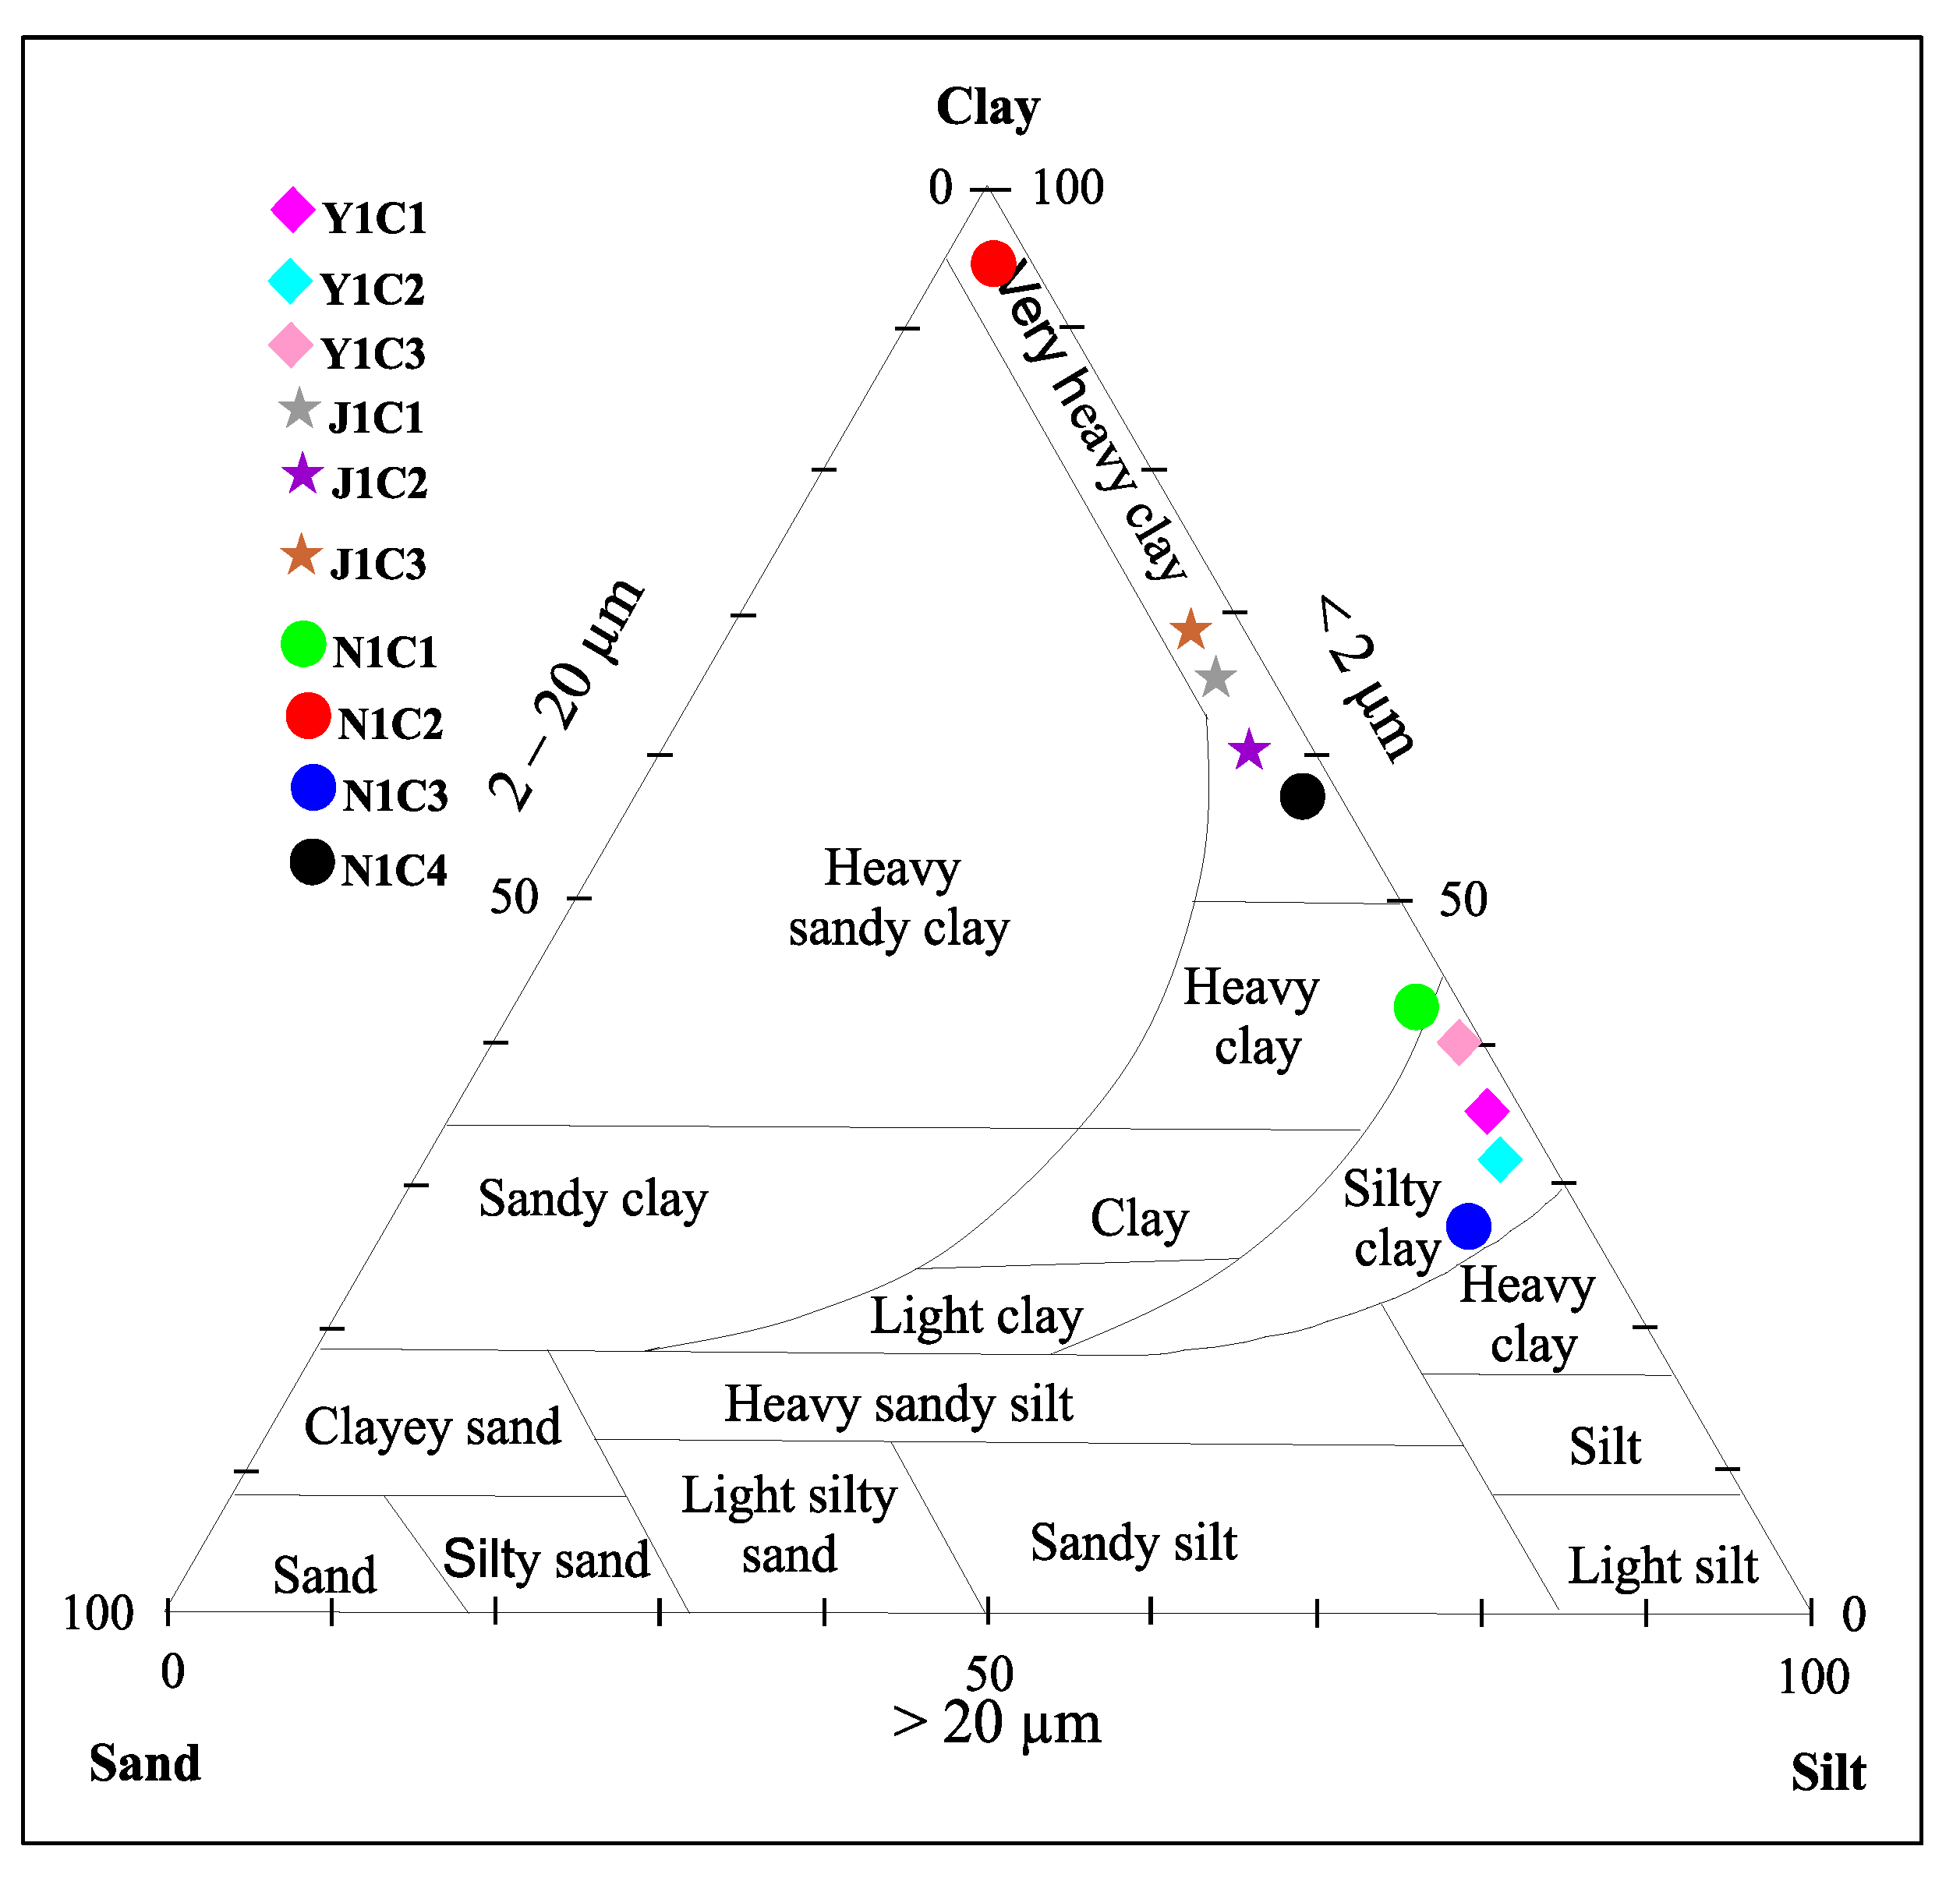
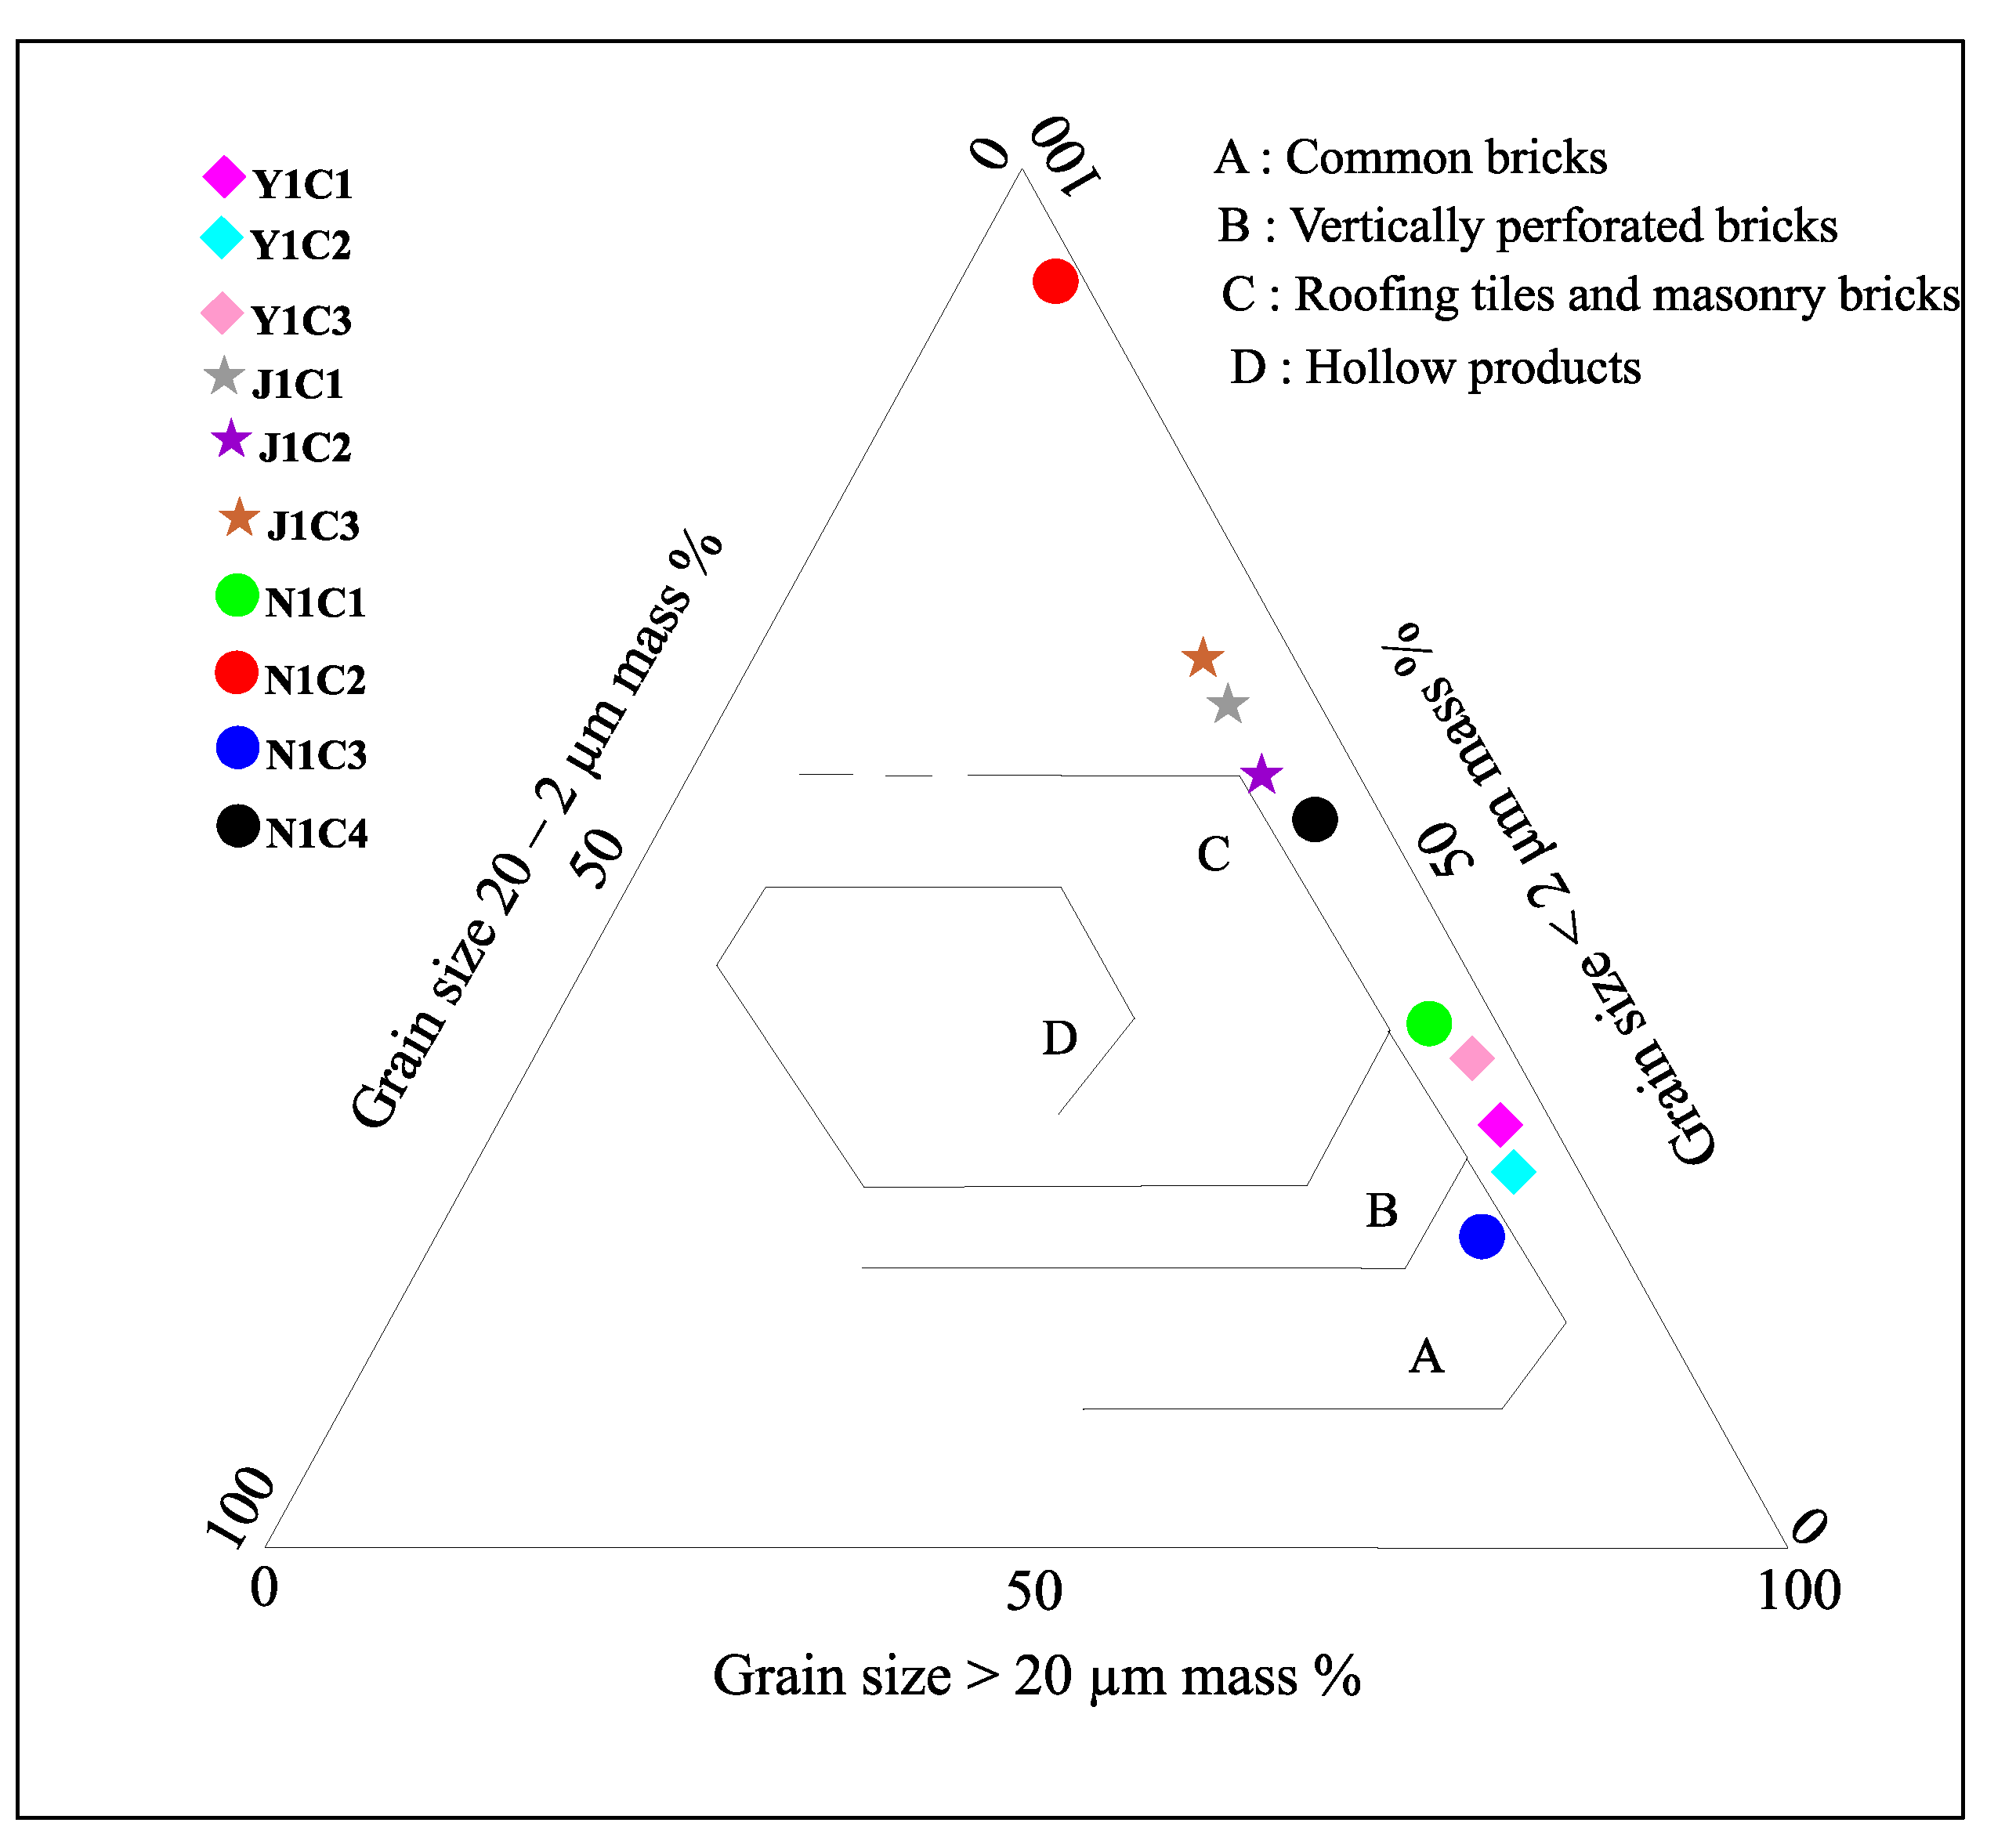
4.3.1. Particle Size Fractions
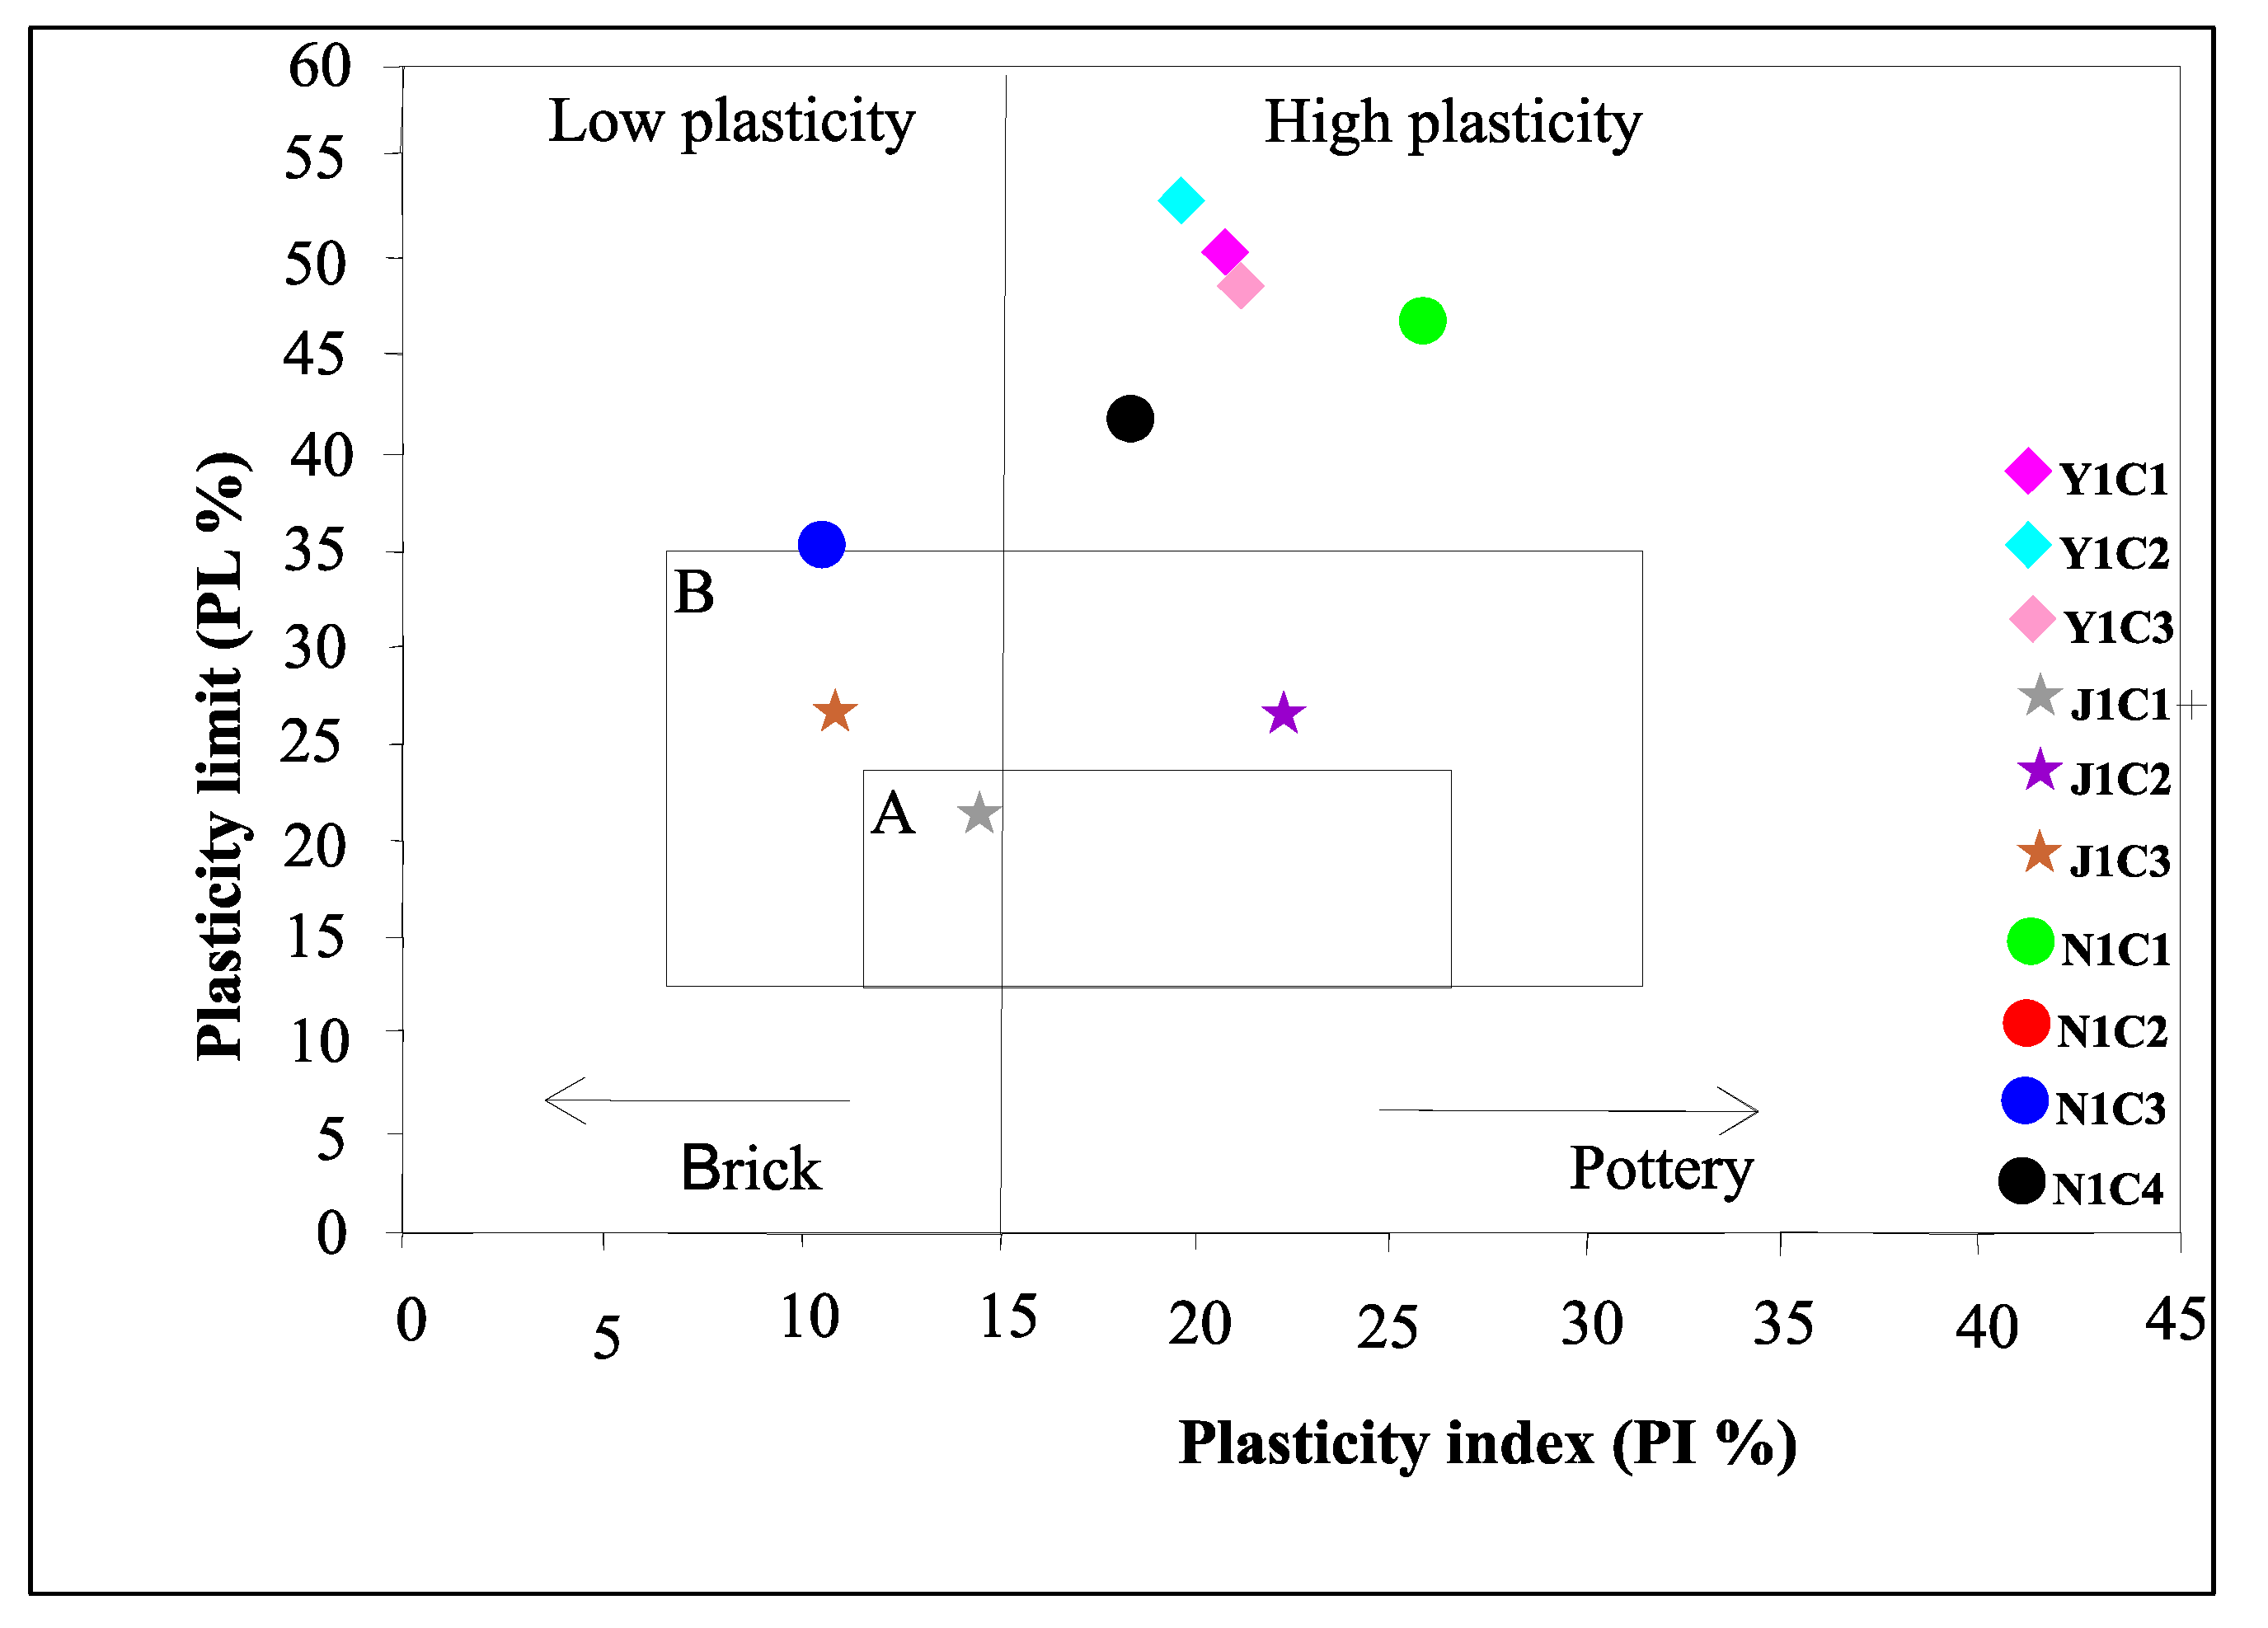
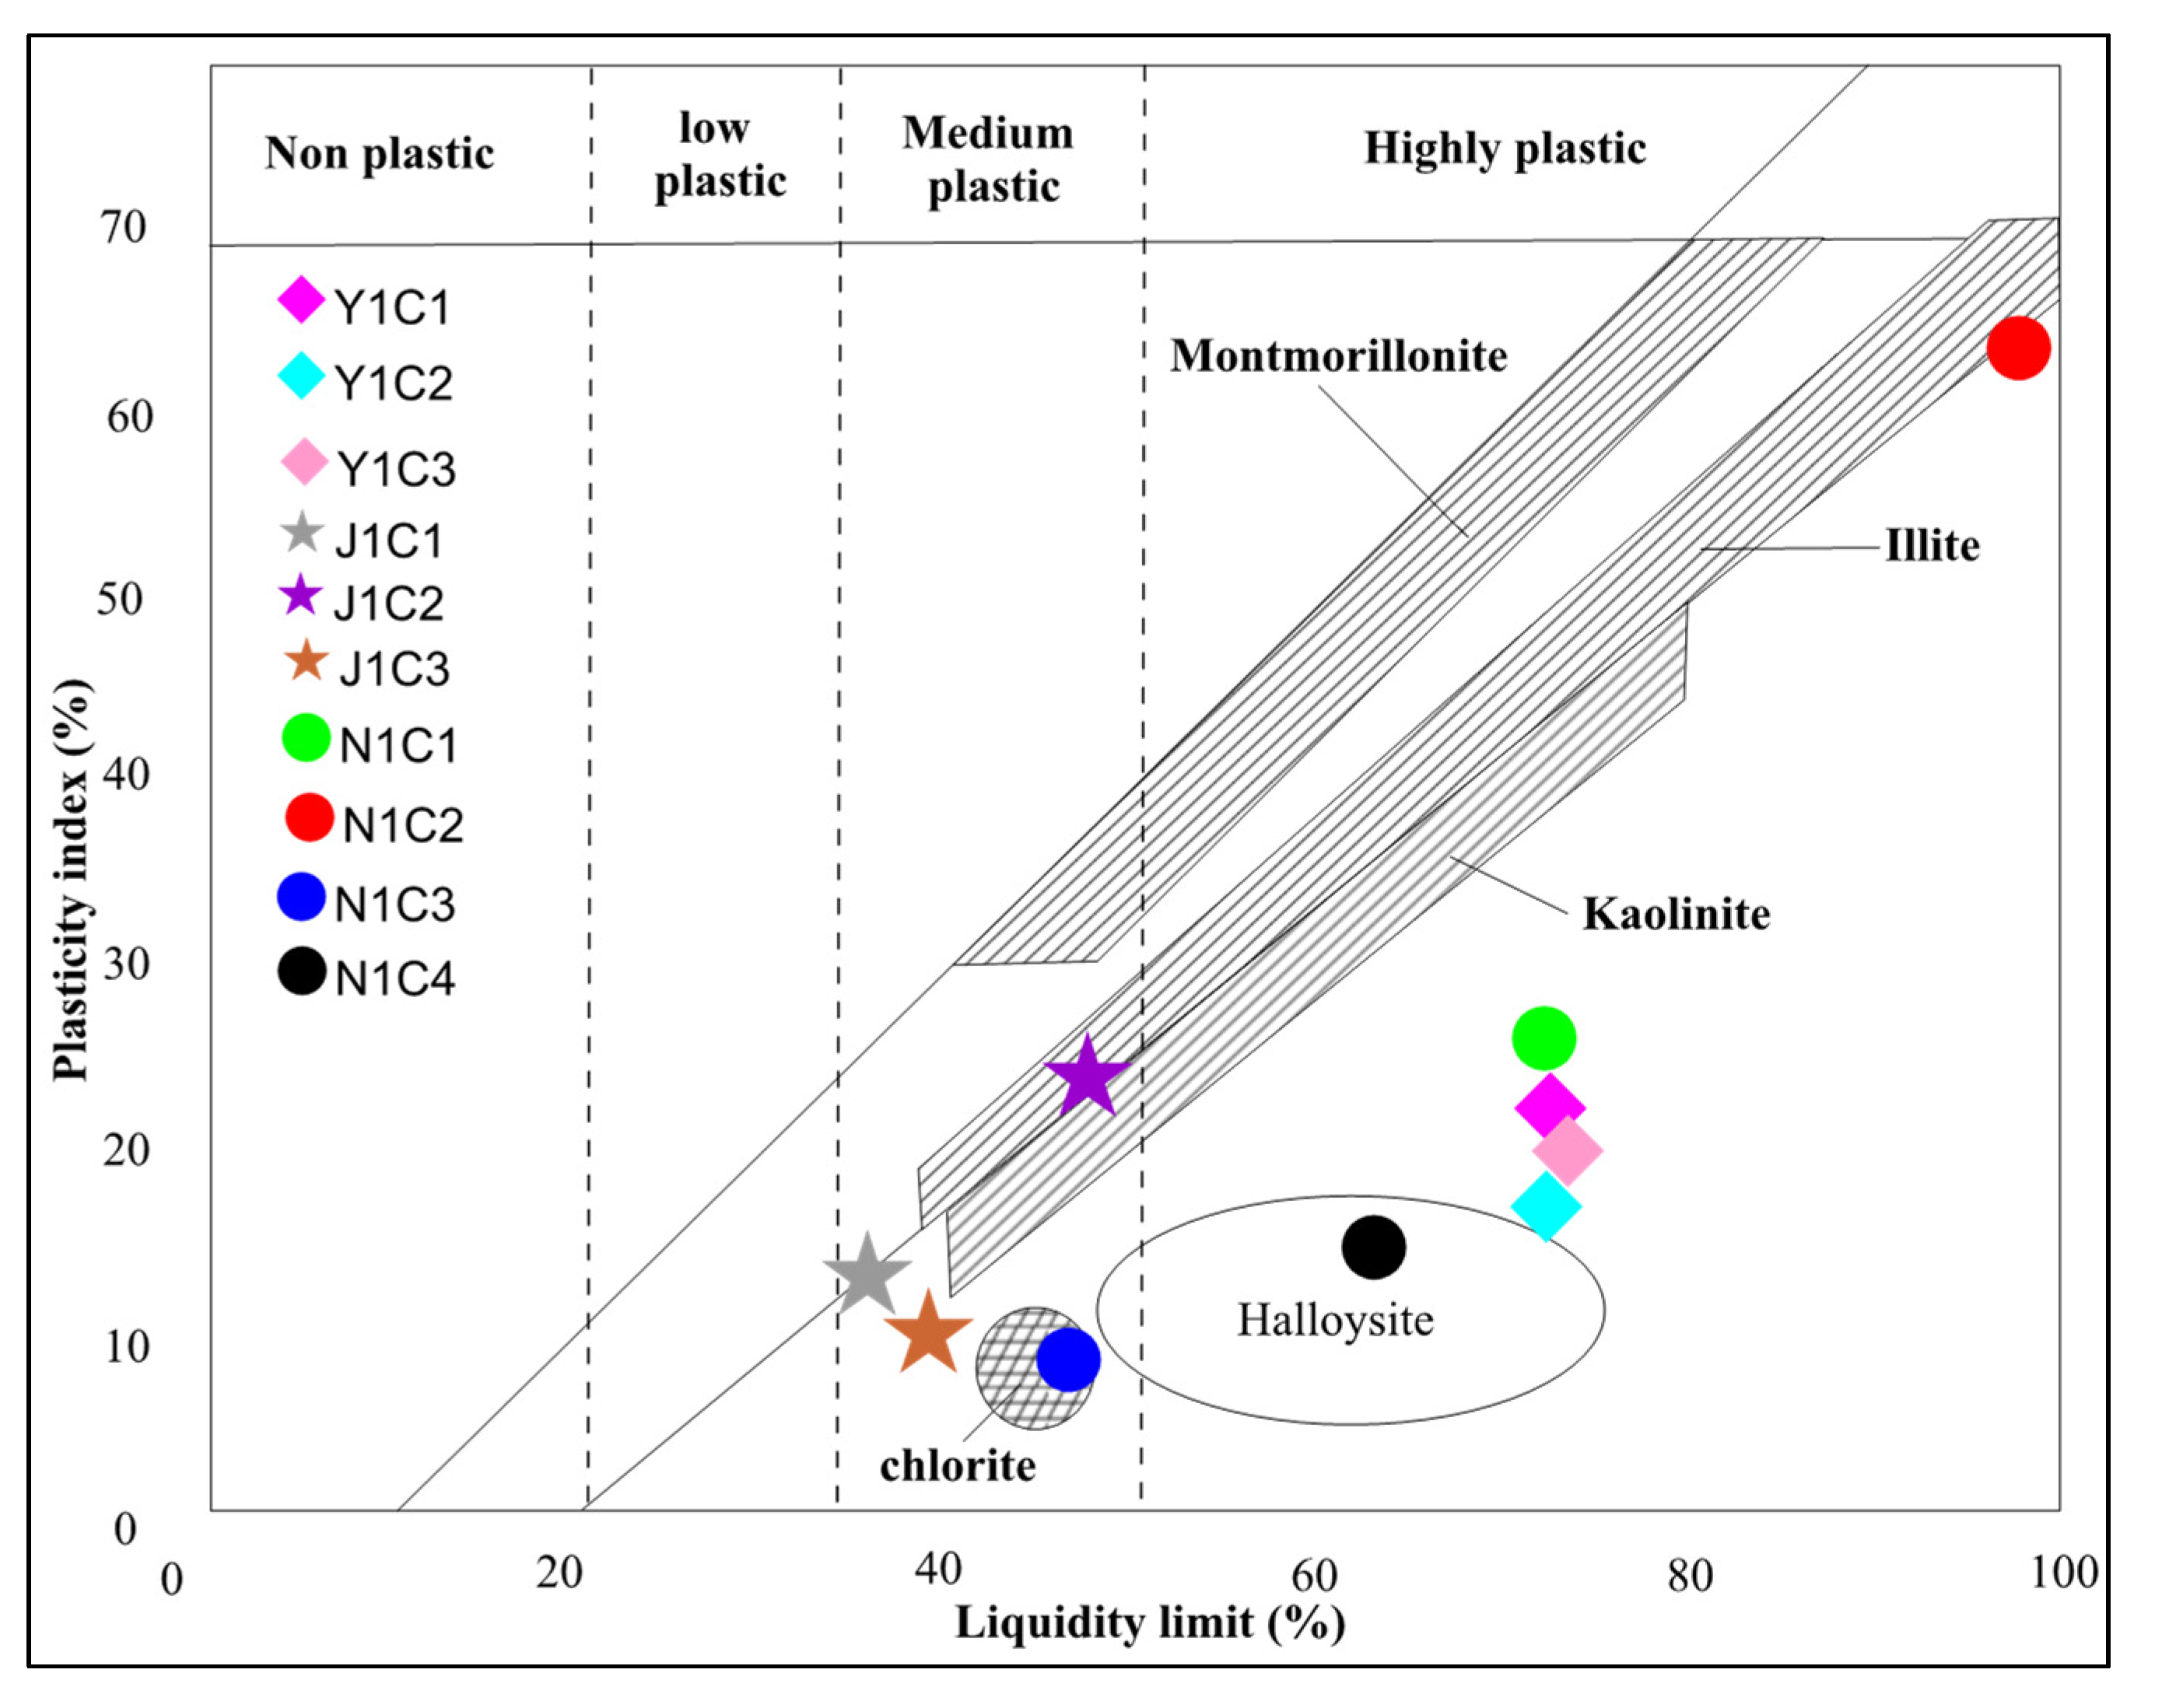
4.3.2. Plastic Properties
4.3.3. Organic Matters
4.3.4. Rate of Swelling
4.3.5. Cation Exchange Capacity (CEC) and the Hydrogen Potential (pH)
5. Conclusions
Author Contributions
Funding
Institutional Review Board Statement
Informed Consent Statement
Data Availability Statement
Acknowledgments
Conflicts of Interest
References
- Temga, J.P.; Mache, J.R.; Balo, M.A.; Nguetnkam, J.P.; Bitom, D.L. Ceramics applications of clay in lake chad basin, Central Africa. Appl. Clay Sci. 2019, 171, 118–132. [Google Scholar] [CrossRef]
- Velde, B. Diagnostic Reaction in Clays; Parker, A., Sellwood, B.W., Eds.; Sediment Diagenesis; Springer: Dordrecht, The Netherlands, 1983; pp. 215–268. [Google Scholar] [CrossRef]
- Murray, H.H. Applied Clay Mineralogy: Occurrences, Processing and Applications of Kaolins, Bentonites, Palygorskite-Sepiolite, and Common Clays; Murray, H.H., Ed.; Developments in Clay Science; Elsevier: Amsterdam, The Netherlands, 2007; Volume 2, p. 180. [Google Scholar]
- Kagonbe, B.P.; Tsozué, D.; Nzeukou, A.N.; Ngos, S., III. Mineralogical, Geochemical and physico-chemical caracterization of clay raw materials from three clay deposits in northern Cameroon. J. Geosci. Envirn. Prot. 2021, 9, 86–99. [Google Scholar]
- Salawudeen, T.; Olalekan Isam, Y.; Qudsieh Nassereldeen, A.; Kabbashi, M.A.; Suleyman, A.; Muyibi, F.Y.; Qusim, S. Effect of Modification on the Physico-chemical and Thermal Properties of Organophilic Clay Modified with Octadecylamine. Int. J. Eng. Technol. IJET-IJENS 2010, 10, 27–35. [Google Scholar] [CrossRef]
- Cerato, A.B.; Lutenegger, A.J. Determination of surface Area of fine grained Soils by the ethylene glycol Monoethyl Ether (EGME) method. ASTM Geotech. J. 2002, 25, 315–321. [Google Scholar]
- Yeliz, Y.A.; Abidin, K. Dependance à la methode des relations entre la surface spécifiques et les proprietés physico-chimiques du sol. Sci. De L’argile Appliquée. 2010, 50, 182–190. [Google Scholar]
- Allègre, J. Les silicates d’alumine (argiles) en thérapeutique, une pratique coutumière ancienne relayée dans la médecine moderne. Mémoire de Thèse, Faculté de Médecine de Bobigny, Léonard de Vinci, Université Paris XIII, Villetaneuse, France, 2012. [Google Scholar]
- Celik, H. Technological characterization and industrial application of two Turkish clays for the ceramic industry. App. Clay Sci. 2010, 50, 245–254. [Google Scholar] [CrossRef]
- Ngun, B.K.; Mohamad, H.; Sulaiman, S.K.; Okada, K.; Ahmad, Z.A. Some ceramic properties of clays from central Cambodia. Appl. Clay Sci. 2011, 53, 33–41. [Google Scholar] [CrossRef]
- Semiz, B. Characteristics of clay-rich raw materials for ceramic applications in Denizli region (Western Anatolia). Appl. Clay Sci. 2017, 137, 83–93. [Google Scholar] [CrossRef]
- Pardo, F.; Jordan, M.M.; Montero, M.A. Ceramic behaviour of clays in Central Chile. Appl. Clay Sci. 2018, 157, 158–164. [Google Scholar] [CrossRef]
- Bennour, A.; Mahmoudi, S.; Srasra, E.; Hatira, N.; Boussen, S.; Ouaja, M.; Zargouni, F. Identification and traditional ceramic application of clays from the Chouamekh region in South-Eastern Tunisia. Appl. Clay Sci. 2015, 118, 212–220. [Google Scholar] [CrossRef]
- Boussen, S.; Sghaier, D.; Chaabani, F.; Jamoussi, B.; Bennour, A. Characteristics and industrial application of the Lower Cretaceous clay deposits (Bouhedma Formation), Southeast Tunisia: Potential use for the manufacturing of ceramic tiles and bricks. Appl. Clay Sci. 2016, 123, 210–221. [Google Scholar] [CrossRef]
- Abdelmalek, B.; Bouazi, R.; Bouftouha, Y.; Bouabsa, L.; Fagel, N. Mineralogical characterization of Neogene clay areas from the Jijel basin for ceramic purposes (NE Algeria-Africa). Appl. Clay Sci. 2017, 136, 176–183. [Google Scholar] [CrossRef]
- Sieffermann, G. Premières déterminations des minéraux argileux des sols du Cameroun. In Proceedings of the Conference Interafricaine des Sols, Dalaba, Guinea, 2–11 November 1959; pp. 139–150. [Google Scholar]
- Nkoumbou, C.; Njoya, A.; Njopwouo, D.; Wandji, R. Intérêts Économiques des Matériaux Argileux. In Proceedings of the First Conference on the Valorisation of Clay Mineral in Cameroon; Nkoumbou, C., Njopwouo, D., Eds.; University of Yaoundé I: Yaounde, Cameroon, 2001; pp. 1–12. [Google Scholar]
- Mbog, M.B.; Ngon Ngon, G.F.; Tassongwa, B.; Tehna, N.; Tedontsah, V.P.L.; Etame, J. Clay deposits of Ngoma (Douala sedimentary sub basin Cameroon, Central Africa): A provenance study. Arab. J. Geosci. 2022, 15, 1122. [Google Scholar] [CrossRef]
- Basga, D.S.; Tsozué, D.; Temga, J.P.; Balna, J.; Nguetnkam, J.P. Land Use Impact on Clay Dispersion/Flocculation in Irrigated and Flooded Vertisols from Northern Cameroon. Int. Soil Water Conserv. Res. 2018, 6, 237–244. [Google Scholar] [CrossRef]
- Nzeukou, N.A.; Tsozué, D.; Kagonbé, P.B.; Balo, M.A.; Fankam, D.; Ngos, S., III; Nkoumbou, C.; Fagel, N. Clayey Soils from Boulgou (North Cameroon): Geotechnical, Mineralogical, Chemical Characteristics and Properties of Their Fired Products. SN Appl. Sci. 2021, 3, 551. [Google Scholar] [CrossRef]
- Elimbi, A.; Njopwouo, D.; Pialy, P.; Wandji, R. Propriétés des Produits de cuisson de deux argiles kaolinitiques de l’Ouest du Cameroun. Silic. Ind. 2001, 66, 121–125. [Google Scholar]
- Djangang, C.N.; Elimbi, A.; Lecomte, G.L.; Soro, J.; Nkoumbou, C.; Yvon, J.; Blanchart, P.; Njopwouo, D. Refractory ceramics from clays of Mayouom and Mvan in Cameroon. Appl. Clay Sci. 2008, 39, 10–18. [Google Scholar] [CrossRef]
- Njike, N.P.R. Palynostratigraphie et Reconstitution des Paléo-Environnements du Crétacé de l’Est du Bassin Sédimen-Taire de Douala (Cameroun). Ph.D. Thesis, Université de Yaoundé I, Yaoundé, Cameroon, 2004. [Google Scholar]
- Mbabi, B.A.; Adatte, T.; Ngon Ngon, G.F.; Ngos, S., III; Bilong, P. Palynology, mineralogy and geochemistry of sed-iments in Tondè locality, northern part of Douala sub-basin, Cameroon, Central Africa: Implication on paleoenvironment. Geosci. J. 2021, 25, 299–319. [Google Scholar] [CrossRef]
- Ngon Ngon, G.F.; Etame, J.; Ntamak-Nida, M.J.; Mbog, M.B.; Maliengoue Mpondo, A.M.; Yongue-Fouateu, R.; Bilong, P. Geological study of sedimentary clayey materials of the Bomkoul area in the Douala region (Douala sub-basin, Cameroon) for the ceramic industry. Compt. Rendus Geosci. 2012, 344, 366–376. [Google Scholar] [CrossRef]
- Logmo, E.O.; Ngon Ngon, G.F.; Samba, W.; Mbog, M.B.; Etame, J. Geotechnical, mineralogical and chemical characterisation of the Missole II clayey materials of Douala Sub-Basin (Cameroon) for construction materials. Open J. Civil. Eng. 2013, 3, 46–53. [Google Scholar] [CrossRef]
- Diko, M.; Ekosse, G.; Ogola, J. Fourier transformin frared spectroscopy nd thermal analyses of kaolinitic clays from South Africa and Cameroon. Acta Geodyn. Geomater. 2016, 13, 149–158. [Google Scholar] [CrossRef]
- Ngon Ngon, G.F.; Mbabi Bitchong, A.; Mbaï, J.S.; Ngos, S., III; Yongue Fouateu, R.; Bilong, P. Geochemistry of pyriteous mudrocks of the cenozoic N’Kapa formation in Douala Sub-basin, western Cameroon (Central Africa): Source rock weath-ering, provenance, paleo-redox conditions and tectonic settings. J. Afr. Earth Sci. 2019, 156, 44–57. [Google Scholar] [CrossRef]
- Lawrence, S.R.; Munday, S.; Bray, R. Regional geology and geophysics of the eastern Gulf of Guinea (Niger Delta to Rio Muni). Lead. Edge 2002, 21, 1113–1117. [Google Scholar] [CrossRef]
- Kankao, O.O.; Ngon Ngon, G.F.; Tehna, N.; Bayiga, E.C.; Mbog, M.B.; Mbai, S.J.; Etame, J. Physicochemical and Mineralogical Characterization of Clay Materials in the Douala Coastal Sedimentary Sub-basin (Cameroon, Central Africa). J. Geosci. 2022, 10, 126–138. [Google Scholar]
- Nguene, F.R.; Tamfu, S.; Loule, J.P.; Ngassa, C. Paleoenvironment of the Douala and Kribi/Campo Subasins in Cameroon West Africa; Curnelle, R., Ed.; Géologie Africaine, 1er Coll. de stratigraphie et paléogéographie des bassins sédimentaires ouest africains, 2 ème coll. africain de micropaléont, Libreville, 1001; Elf Aquitaine: Boussens, France, 1992; pp. 129–139. [Google Scholar]
- Moore, D.M.; Reynolds, R.J.C. X-ray Diffraction and the Identification and Analysis of Clay Materials; Oxford University Press: Oxford, UK, 1989. [Google Scholar]
- Biscaye, P.E. Mineralogy and sedimentation of recent deep-sea clay in the Atlantic Ocean and adjacent seas and oceans. Geol. Soc. Am. Bull. 1965, 76, 803–832. [Google Scholar] [CrossRef]
- Nesbitt, H.W.; Young, G.M. Prediction of some weathering trends of plutonic and volcanic rocks based on thermodynamic and kinetic considerations. Geochim. Cosmochim. Acta 1984, 48, 1523–1534. [Google Scholar] [CrossRef]
- Fiori, C.; Fabbri, B.; Donati, G.; Venturi, I. Mineralogical composition of the clay bodies used in the Italian Tile Industry. Appl. Clay Sci. 1989, 4, 461–473. [Google Scholar] [CrossRef]
- Richer de Forges, A.; Feller, C.; Jamagne, M.; Arrouays, D. Perdus dans le triangle des textures. Étude Gest. Des. Sols. 2008, 15, 97–111. [Google Scholar]
- McManus, J. Grain Size Distribution and Interpretation; Tucker, M.E., Ed.; Techniques in Sedimentology; Blackwell Scientific Publications: Oxford, UK, 1988; pp. 63–85. [Google Scholar]
- Winkler, H.G.F. Bedeutung der Korngrößenverteilung und des Mineralbestandes von Tonen für die Herstellung grobkeramischer Erzeugnisse. Ber. Der Dtsch. Keram. Ges. 1954, 31, 337–343. [Google Scholar]
- Casagrande, A. Plascticity chart for the classification of cohesive soils. Trans. Am. Soc. Civ. Eng. 1948, 113, 901. [Google Scholar] [CrossRef]
- Holtz, R.D.; Kovacs, W.D. An Introduction to Geotechnical Engineering; Prentice Hall Inc.: Hoboken, NJ, USA, 1981. [Google Scholar]
- Bain, A.J. Composition and properties of clays used in various fields of ceramics: Part I. Ceram. Forum Int. 1986, 62, 536–538. [Google Scholar]
- Kjeldahl, J. New method for the determination of nitrogen. Chem. News 1883, 48, 101–102. [Google Scholar] [CrossRef]
- Grim, R. Clay Mineralogy; McGraw-Hill Inc.: New York, NY, USA, 1968; p. 596. [Google Scholar]
- Daoudi, L.; Knidiri, A.; El Idrissi, H.E.B.; Rhouta, B.; Fagel, N. Role of the texture of fibrous cay minerals in the plasticity behavior of host materials (Plateau du Kik, Western High Atlas, Morcco). Appl. Clay Sci. 2015, 118, 283–289. [Google Scholar] [CrossRef]
- Bukalo, N.N.; Ekosse, G.E.; Odiyo, J.; Ogola, J.S. Mineralogical characteristics of cretaceous-tertiary kaolins of the Douala sub-basin, Cameroon. J. Afr. Earth Sci. 2018, 141, 130–147. [Google Scholar] [CrossRef]
- Hinckley, D.N. Variability in “Crystallinity” Values among the Kaolin Deposits of the Coastal Plain of Georgia and South Carolina. Clay Clay Miner. 1962, 11, 229–235. [Google Scholar] [CrossRef]
- Laibi, A.B.; Gomina, M.; Sorgho, B.; Sagbo, E.; Blanchart, P.; Boutouil, M.; Sohounhloule, D.K.C. Caractérisation physico-chimique et géotechnique de deux sites argileux du Bénin en vue de leur valorisation dans l’éco-construction. Int. J. Biol. Chem. Sci. 2017, 11, 499–514. [Google Scholar] [CrossRef]
- Ndjigui, P.D.; Onana, V.L.; Sababa, E.; Bayiga, E.C. Mineralogy and geochemistry of the Lokoundje alluvial clays from the Kribi deposits, Cameroonian Atlantic coast: Implications for their origin and depositional environment. J. Afr. Earth Sci. 2018, 143, 102–117. [Google Scholar] [CrossRef]
- Bachir, L.; Lakhdar, B.; Fagel, N. Mineralogical, Physico-chemical and Geochemical Characterization of Three Kaolinitic Clays (Ne Algeria): Comparative Study. Res. Sq. 2021. [Google Scholar] [CrossRef]
- Cases, J.M.; Lietard, O. Etude des propriétés cristallochimiques, morphologiques, superficielles de kaolinites désordonnées. Bull Min. 1982, 5, 439–456. [Google Scholar] [CrossRef]
- Madejova, J.; Komadel, P. Baseline studies of the clay minerals society source clays: Infrared methods. Clay Clay Miner. 2001, 49, 410–432. [Google Scholar] [CrossRef]
- Madejova, J. FTIR techniques in clay mineral studies: Review. Vib. Spectrosc. 2003, 31, 1–10. [Google Scholar] [CrossRef]
- Kornmann, M. Matériaux de Construction en Terre Cuite: Fabrication et Propriétés. 2005. Available online: https://www.researchgate.net/publication/236942688_Materiaux_de_construction_en_terre_cuite_fabrication_et_proprietes (accessed on 6 September 2022).
- Crook, K.A.W. Lithostratigraphy and Geotectonic: The Significance of Composition Variation in Flysch arenites (Gray-Wackes); Dott, R.H., Shaver, R.H., Eds.; Modern and Ancient Geosynclinal Sedimentation 19, 310; Society of Economic Paleontologists and Mineralogists: Tulsa, OK, USA, 1974. [Google Scholar] [CrossRef]
- Bukalo, N.N.; Ekosse, G.I.; Odiyo, J.O.; Ogola, J.S. Geochemistry of Selected Kaolins from Cameroon and Nigeria. Open Geosci. 2017, 9, 13. [Google Scholar] [CrossRef]
- Lorentz, B.; Shanahan, N.; Stetsko, Y.P.; Zayed, A. Characterization of Florida kaolin clays using multiple technique approach. Appl. Clay Sci. 2018, 161, 326–333. [Google Scholar] [CrossRef]
- Tsozué, D.; Nzeukou, N.A.; Maché, J.R.; Loweh, S.; Fagel, N. Mineralogical, Physico-Chemical and Technological Characterization of Clays from Maroua (Far-North, Cameroon) for Use in Ceramic Bricks Production. J. Build. Eng. 2017, 11, 17–24. [Google Scholar] [CrossRef]
- Temga, J.P.; Nguetnkam, J.P.; Balo Madi, A.; Basga, S.D.; Bitom, D.L. Morphological, physico chemical, mineralogical and ge-ochemical properties of vertisols used in bricks production in the Logone Valley (Cameroon, Central Africa). Int. Res. J. Geol. Min. 2015, 5, 20–30. [Google Scholar]
- Nkalih, M.A.; Njoya, R.Y.; Fouateu, J.R.; Mache, N.A.; Tapon, A.N.; Nzeugang, U.M.; Chinje, P.; Pilate, P.; Flament, S.; Siniapkine, A. Occurrences of kaolin in Koutaba (west Cameroon): Mineralogical and physicochemical characterization for use in ceramic products. Clay Miner. 2015, 50, 593–606. [Google Scholar] [CrossRef]
- Ngon Ngon, G.F.; Abomo, P.S.; Mbog, M.B.; Mbabi, B.A.; Mbaï, J.S.; Ngonlep Minyemeck, T.V.; Yongue Fouateu, R. Geological, mineralogical and geochemical studies of pyrite deposits in the eastern part of Douala sub-basin (Cameroon, central Africa). Int. J. Geosci. 2015, 6, 1–12. [Google Scholar] [CrossRef] [Green Version]
- Rivi, A.; Ries, B. Single-Line Dry Grinding Technology. Ceram. World 1997, 24, 132–141. [Google Scholar]
- De Oliveira Modesto, C.; Bernardin, A.M. Determination of clay plasticity: Indentation method versus Pfefferkorn method. Appl. Clay Sci. 2008, 40, 15–19. [Google Scholar] [CrossRef]
- Nzeukou, N.A.; Fagel, N.; Njoya, A.; Kamgang, B.V.; Medjo, E.R.; Melo, C.U. Mineralogy and physico-chemical properties of alluvial clays from Sanaga valley (Center, Cameroon): Suitability for ceramic application. Appl. Clay Sci. 2013, 83, 238–243. [Google Scholar] [CrossRef]
- Wilding, L.P. Advancement in the knowledge base of vertisols genesis, classification, distribution and management. Rev. Client. Agropec. 2004, 8, 45–54. [Google Scholar]
- Ragab, A.E.R. Physicochemical properties of nano metakaolin on the characteristics of blended limestone cement. J. Build. Pathol. Rehabil. 2019, 4, 9. [Google Scholar] [CrossRef]


| Localities | Yansoki | Japoma | Ndogpassi | |||||||
|---|---|---|---|---|---|---|---|---|---|---|
| Samples | Y1C1 | Y1C2 | Y1C3 | J1C1 | J1C2 | J1C3 | N1C1 | N1C2 | N1C3 | N1C4 |
| Kaolinite | 50.5 | 52.3 | 49.5 | 50.4 | 48.3 | 51.4 | 54.7 | 69.2 | 50.1 | 49.8 |
| Quartz | 40.8 | 39.2 | 41.2 | 35.6 | 39.4 | 38.6 | 26.4 | 20.5 | 31.4 | 33.4 |
| Illite | 3.9 | 3.1 | 4.7 | 2.4 | 8.1 | 3.4 | 8.4 | 3.4 | 9.7 | 10.2 |
| Hematite | 1.4 | 3.5 | - | 2.9 | - | 2.7 | 2.5 | - | 3.8 | 2.6 |
| Goethite | - | 1.9 | 2.4 | 3.5 | 3.2 | 1.4 | 1.7 | 3.6 | 3.3 | 2.3 |
| Feldspar | 2.5 | 1.8 | - | 1.6 | - | - | 3.4 | 1.2 | - | 0.5 |
| Muscovite | 1.9 | 1.4 | 2.2 | 1.8 | - | 1.2 | 2.7 | 1 | - | - |
| Gibbsite | - | 0.6 | - | 1.8 | 1 | 1.3 | 1.8 | 1.1 | 1.7 | 1.2 |
| Localities | Yansoki | Japoma | Ndogpassi | |||||||
|---|---|---|---|---|---|---|---|---|---|---|
| Samples | Y1C1 | Y1C2 | Y1C3 | J1C1 | J1C2 | J1C3 | N1C1 | N1C2 | N1C3 | N1C4 |
| SiO2 | 51.18 | 38.97 | 38.23 | 58.03 | 38.18 | 49.97 | 50.07 | 22.21 | 55.62 | 48.23 |
| TiO2 | 1.09 | 0.06 | 0.75 | 1.68 | 1.47 | 1.43 | 1.13 | 0.98 | 1.16 | 2 |
| Al2O3 | 16.45 | 15.27 | 13.01 | 19.92 | 21.85 | 22.94 | 15.54 | 17.32 | 12.84 | 19.37 |
| Fe2O3 | 4.9 | 17.76 | 5.42 | 3.88 | 3.86 | 6.43 | 4.22 | 1.07 | 17.92 | 6.06 |
| MnO | 0.41 | 0.12 | 0.13 | 0.33 | 0.07 | 0.09 | 0.14 | 0.82 | 1.02 | 0.62 |
| MgO | 0.95 | 0.32 | 0.43 | 0.3 | 0.1 | 0.2 | 0.74 | 0.15 | 0.32 | 0.53 |
| CaO | 0.72 | 0.08 | 0.23 | 0.04 | 0.06 | 0.21 | 0.15 | 0.15 | 0.38 | 0.27 |
| K2O | 1.7 | 0.51 | 0.48 | 0.85 | 0.41 | 0.42 | 2.24 | 0.34 | 1.62 | 11.7 |
| Na2O | 0.06 | 0.02 | 0.34 | 0.37 | 0.03 | 0.2 | 0.08 | 0.01 | 0.19 | 0.11 |
| SO3 | 0.08 | 0.68 | 0.13 | 0.09 | 0.15 | 0.27 | 0.32 | 0.34 | 0.51 | 0.02 |
| P2O5 | 0.13 | 0.11 | 0.05 | 0.05 | 0.06 | 0.07 | 0.02 | 0.16 | 0.02 | 0.17 |
| LOI | 13.2 | 12.77 | 11.21 | 8.37 | 11.23 | 10.06 | 16.11 | 15.4 | 8.19 | 8.58 |
| Total | 90.87 | 86.67 | 70.41 | 93.91 | 77.47 | 92.29 | 90.76 | 58.95 | 99.79 | 97.75 |
| SiO2/Al2O3 | 3.11 | 2.55 | 2.94 | 2.91 | 1.75 | 2.18 | 3.22 | 1.28 | 4.33 | 2.49 |
| TiO2 + Fe2O3 + CaO + MgO + Na2O + K2O | 9.42 | 18.75 | 7.65 | 7.12 | 5.93 | 8.89 | 8.56 | 2.7 | 21.59 | 20.76 |
| CIA | 86.89 | 96.16 | 92.53 | 94.05 | 97.76 | 96.51 | 86.28 | 97.19 | 85.43 | 61.59 |
| YANSOKI | JAPOMA | NDOGPASSI | |||||||||
|---|---|---|---|---|---|---|---|---|---|---|---|
| Samples Codes | Y1C1 | Y1C2 | Y1C3 | J1C1 | J1C2 | J1C3 | N1C1 | N1C2 | N1C3 | N1C4 | |
| Texture | Silty clay | Silty clay | Silty clay | Very heavy clay | Very heavy clay | Very heavy clay | Heavy clay | Very heavy clay | Silty clay | Very heavy clay | |
| Color | Dark gray | Yellow | Multicolored | Light gray | Purple | Multicolored | Dark gray | Light gray | Yellow | Multi-colored | |
| Thickness (m) | 1.7 | 0.7 | 0.9 | 3.7 | 2.7 | 2.7 | 2 | 2.3 | 0.8 | 0.8 | |
| Sand (200 > Φ > 20 µm) % | 0.9 | 1 | 0 | 1 | 0.8 | 1.5 | 0.9 | 0 | 4 | 0,2 | |
| Silt (20 > Φ > 2 µm) % | 68.1 | 68.5 | 71.5 | 41.5 | 40 | 30.5 | 65.1 | 1 | 70 | 43.3 | |
| Clay (Φ < 2 µm) % | 31 | 30.5 | 39.5 | 65.5 | 59.2 | 68 | 34 | 99 | 26 | 56.5 | |
| Liquid limit (LL) | 73.3 | 72.2 | 70.6 | 36.5 | 50.5 | 38.8 | 73.7 | 109.2 | 46.7 | 62.6 | |
| Plastic limit (PL) | 50.4 | 53 | 49.5 | 22.5 | 27.1 | 27.7 | 47.3 | 45.3 | 36.5 | 43.8 | |
| Plasticity index (PI) | 21.9 | 19.2 | 21.1 | 14 | 23.4 | 11.1 | 26.4 | 63.9 | 10.2 | 18.8 | |
| Organic matter (%) | 4 | 1.19 | 1.07 | 2.3 | 2.04 | 1.02 | 6.29 | 2.06 | 0.19 | 2.53 | |
| Sweling rate (T) | 13.6 | 11.4 | 9.1 | 5 | 10 | 5 | 11.4 | 13 | 7.5 | 11.4 | |
| CEC (meq/100 g) | 27.12 | 23.18 | 17.09 | 21.30 | 19.74 | 16.59 | 27.45 | 26 | 26.5 | 38.12 | |
| pH | pH-H2O | 3.4 | 4.8 | 4.7 | 5 | 5 | 4.9 | 2.8 | 4.7 | 5.3 | 4.5 |
| pH-KCl | 2.9 | 4.2 | 3.8 | 4.1 | 4.2 | 3.9 | 2.6 | 3.9 | 4.7 | 4 | |
Publisher’s Note: MDPI stays neutral with regard to jurisdictional claims in published maps and institutional affiliations. |
© 2022 by the authors. Licensee MDPI, Basel, Switzerland. This article is an open access article distributed under the terms and conditions of the Creative Commons Attribution (CC BY) license (https://creativecommons.org/licenses/by/4.0/).
Share and Cite
Oumar, K.O.; Gilbert François, N.N.; Bertrand, M.M.; Nathanael, T.; Constantin, B.E.; Simon, M.J.; Jacques, E. Mineralogical, Geochemical Characterization and Physicochemical Properties of Kaolinitic Clays of the Eastern Part of the Douala Sub-Basin, Cameroon, Central Africa. Appl. Sci. 2022, 12, 9143. https://doi.org/10.3390/app12189143
Oumar KO, Gilbert François NN, Bertrand MM, Nathanael T, Constantin BE, Simon MJ, Jacques E. Mineralogical, Geochemical Characterization and Physicochemical Properties of Kaolinitic Clays of the Eastern Part of the Douala Sub-Basin, Cameroon, Central Africa. Applied Sciences. 2022; 12(18):9143. https://doi.org/10.3390/app12189143
Chicago/Turabian StyleOumar, Kankao Oumla, Ngon Ngon Gilbert François, Mbog Michel Bertrand, Tehna Nathanael, Bayiga Elie Constantin, Mbaï Joel Simon, and Etame Jacques. 2022. "Mineralogical, Geochemical Characterization and Physicochemical Properties of Kaolinitic Clays of the Eastern Part of the Douala Sub-Basin, Cameroon, Central Africa" Applied Sciences 12, no. 18: 9143. https://doi.org/10.3390/app12189143