Article

Hybrid Modeling for Solutions of Sediment Deposition in a Low-Land Reservoir with Multigate Sluice Structure

1
Division of Fluid and Experimental Mechanics, Luleå University of Technology, 97187 Luleå, Sweden
2
Vattenfall, R&D Hydraulic Laboratory, 81426 Älvkarleby, Sweden
3
Department of Civil and Architectural Engineering, Royal Institute of Technology, 10044 Stockholm, Sweden
4
College of Water Conservancy and Hydropower Engineering, Hohai University, Nanjing 210098, China
*
Author to whom correspondence should be addressed.
Appl. Sci. 2022, 12(18), 9144; https://doi.org/10.3390/app12189144
Submission received: 23 August 2022 / Revised: 8 September 2022 / Accepted: 9 September 2022 / Published: 12 September 2022

Abstract

:
At the multigate sluice structure on a fluvial river, undesired sediment deposition affects the normal operation of the reservoir in question. Physical and numerical models are hybridized to help explore flow and sedimentation patterns. Field and laboratory investigations show that the deposition is attributable to the formation of large recirculation zones at low and medium discharges. As a potential countermeasure, an array of guide vanes is recommended to cope with the concern. Their attack angle with the flow is a dominant parameter that needs to be evaluated. Tests in the fixed-bed model demonstrate that the vanes bend the reservoir flow towards the sluice and suppress the circulation zones along both banks. The favorable range of attack angle is 15–20°. With the examination of sedimentation of both bed and suspended loads, the numerical modeling indicates that the sediment-removal efficiency increases with an increase in attack angle. By weighing the flushing efficiency and the risk of local scouring at the vanes, the 15° vane layout is recommended. This study is expected to provide a reference for guide-vane design in similar situations.

1. Introduction

In low-land flood-prone areas, construction of a sluice structure is a common engineering practice for regulation of flood discharge and water stage in a river. Being site-specific, it may also have other functions. The structure consists usually of a number of sluice gates that cover part of the river width. In most cases, the water head is in the range of 5–20 m.
Two distinct features characterize the multigate sluice structure in an alluvial plain [1,2]: (i) the flow often conveys a significant amount of sediment in form of both bed load and suspended load, and (ii) the reservoir is bent, rather than straight, in planform, generating thereby a main current with flow circulations upstream of the structure and resulting in varied sediment-carrying capacity in cross-section. Even asymmetrical operation of the gates generates uneven velocity distributions [3]. As a result, the sediment has a tendency to deposit on one side of the reservoir. With the elapsing of time, the sediment deposition may affect the sluice operation if countermeasures are not properly taken.
As an effective instream training solution, guide vanes modify flow fields and control sediment transport in rivers [4,5,6,7]. They are often vertically placed in the riverbed, either submerged or non-submerged, depending on the local flow situations. Aligned with an attack angle to the approach flow, they induce a secondary flow component, which changes the magnitude and direction of bed shear stresses and leads to a redistribution of flow and sediment [7,8].
The first known installation, proposed by Odgaard and Kennedy [9], is to reduce the bank erosion in a river bend, where the vanes are laid out so that vane-generated secondary currents eliminate the centrifugally induced ones, which is the root cause of bank undermining [10,11]. Likewise, they divert flow away from eroded banks and stabilize the lateral migration. In a curved flume, Odgaard and Wang [12,13] performed experiments with submerged vanes of small, slender, and airfoil shapes. These were shown to modify near-bed flow patterns, redistribute sediment transport, and thereby mitigate channel erosion. To redirect the flow through a bend, vanes are arranged typically in one array or multiple arrays if necessary [14,15]. Many successful applications of the vanes have been made to counteract unfavorable flow and sedimentation patterns [5,16,17,18].
In the connecting straight channel downstream of the bend, guide vanes also facilitate obtaining a relatively uniform flow [19]. The vanes deflect the flow from the bend, re-distribute the main current, and alleviate the uneven sedimentation in cross-section. They are effective in sediment redistribution at diversions [20] and water intakes [8,21]. Strategically placed, the vanes prevent the sediment, especially for bed load, from entering the structures. By modification of flow fields, guide vanes are also an efficient approach for sediment removal. For example, for reservoirs and water intakes facing loss of function with severe deposition, installation of vanes can mitigate its occurrence [21,22,23].
Their efficiency is dictated by several factors, including layout and configuration. Many applications have a simple, rectangular, flat-panel design. Parallelogram and tapered plates and even curved vanes are also used in some cases [4,11]. The vane size, number, and spacing are governed by river width and bend curvature [5,24,25]. Typically, the submerged vane height is 0.2–0.4 times the local water depth. For the non-submerged vane, its crest is usually at the same elevation as the water surface. To minimize the flow interference from the neighboring vanes, both the vane length and lateral spacing are 2–3 times the height. The vane thickness is 0.05–0.50 m, depending on the material. The structure is installed at an attack angle of 10–20° with the flow [4,26]. However, site-specific conditions may require adjustments to these dimensions. Odgaard [4] summarized the state-of-the-art design guidelines and practical applications. With an appropriate design, it is conceivable that—in addition to evening out the flow in cross-section—flow separations are mitigated in the bend.
This study deals with an existing sluice structure located downstream of a river bend, with six bulkhead gates and an abutment on each side. The structure suffers from unbalanced sedimentation in the reservoir. Guide vanes are recommended to address the issue. To evaluate their performance, a physical fixed-bed model is first built in the laboratory, which is then complemented by numerical modeling of a movable bed. The combination of the two approaches enables an identification of the flow and sediment transport pattern in the reservoir. The main purposes of this study are (1) to understand flow patterns and sediment movement under typical sluice operation conditions and (2) to evaluate the vanes as a potential countermeasure for sediment deposition mitigation. The goal is the recommendation of a reliable solution essential for maintaining its normal operations and extending its life span.

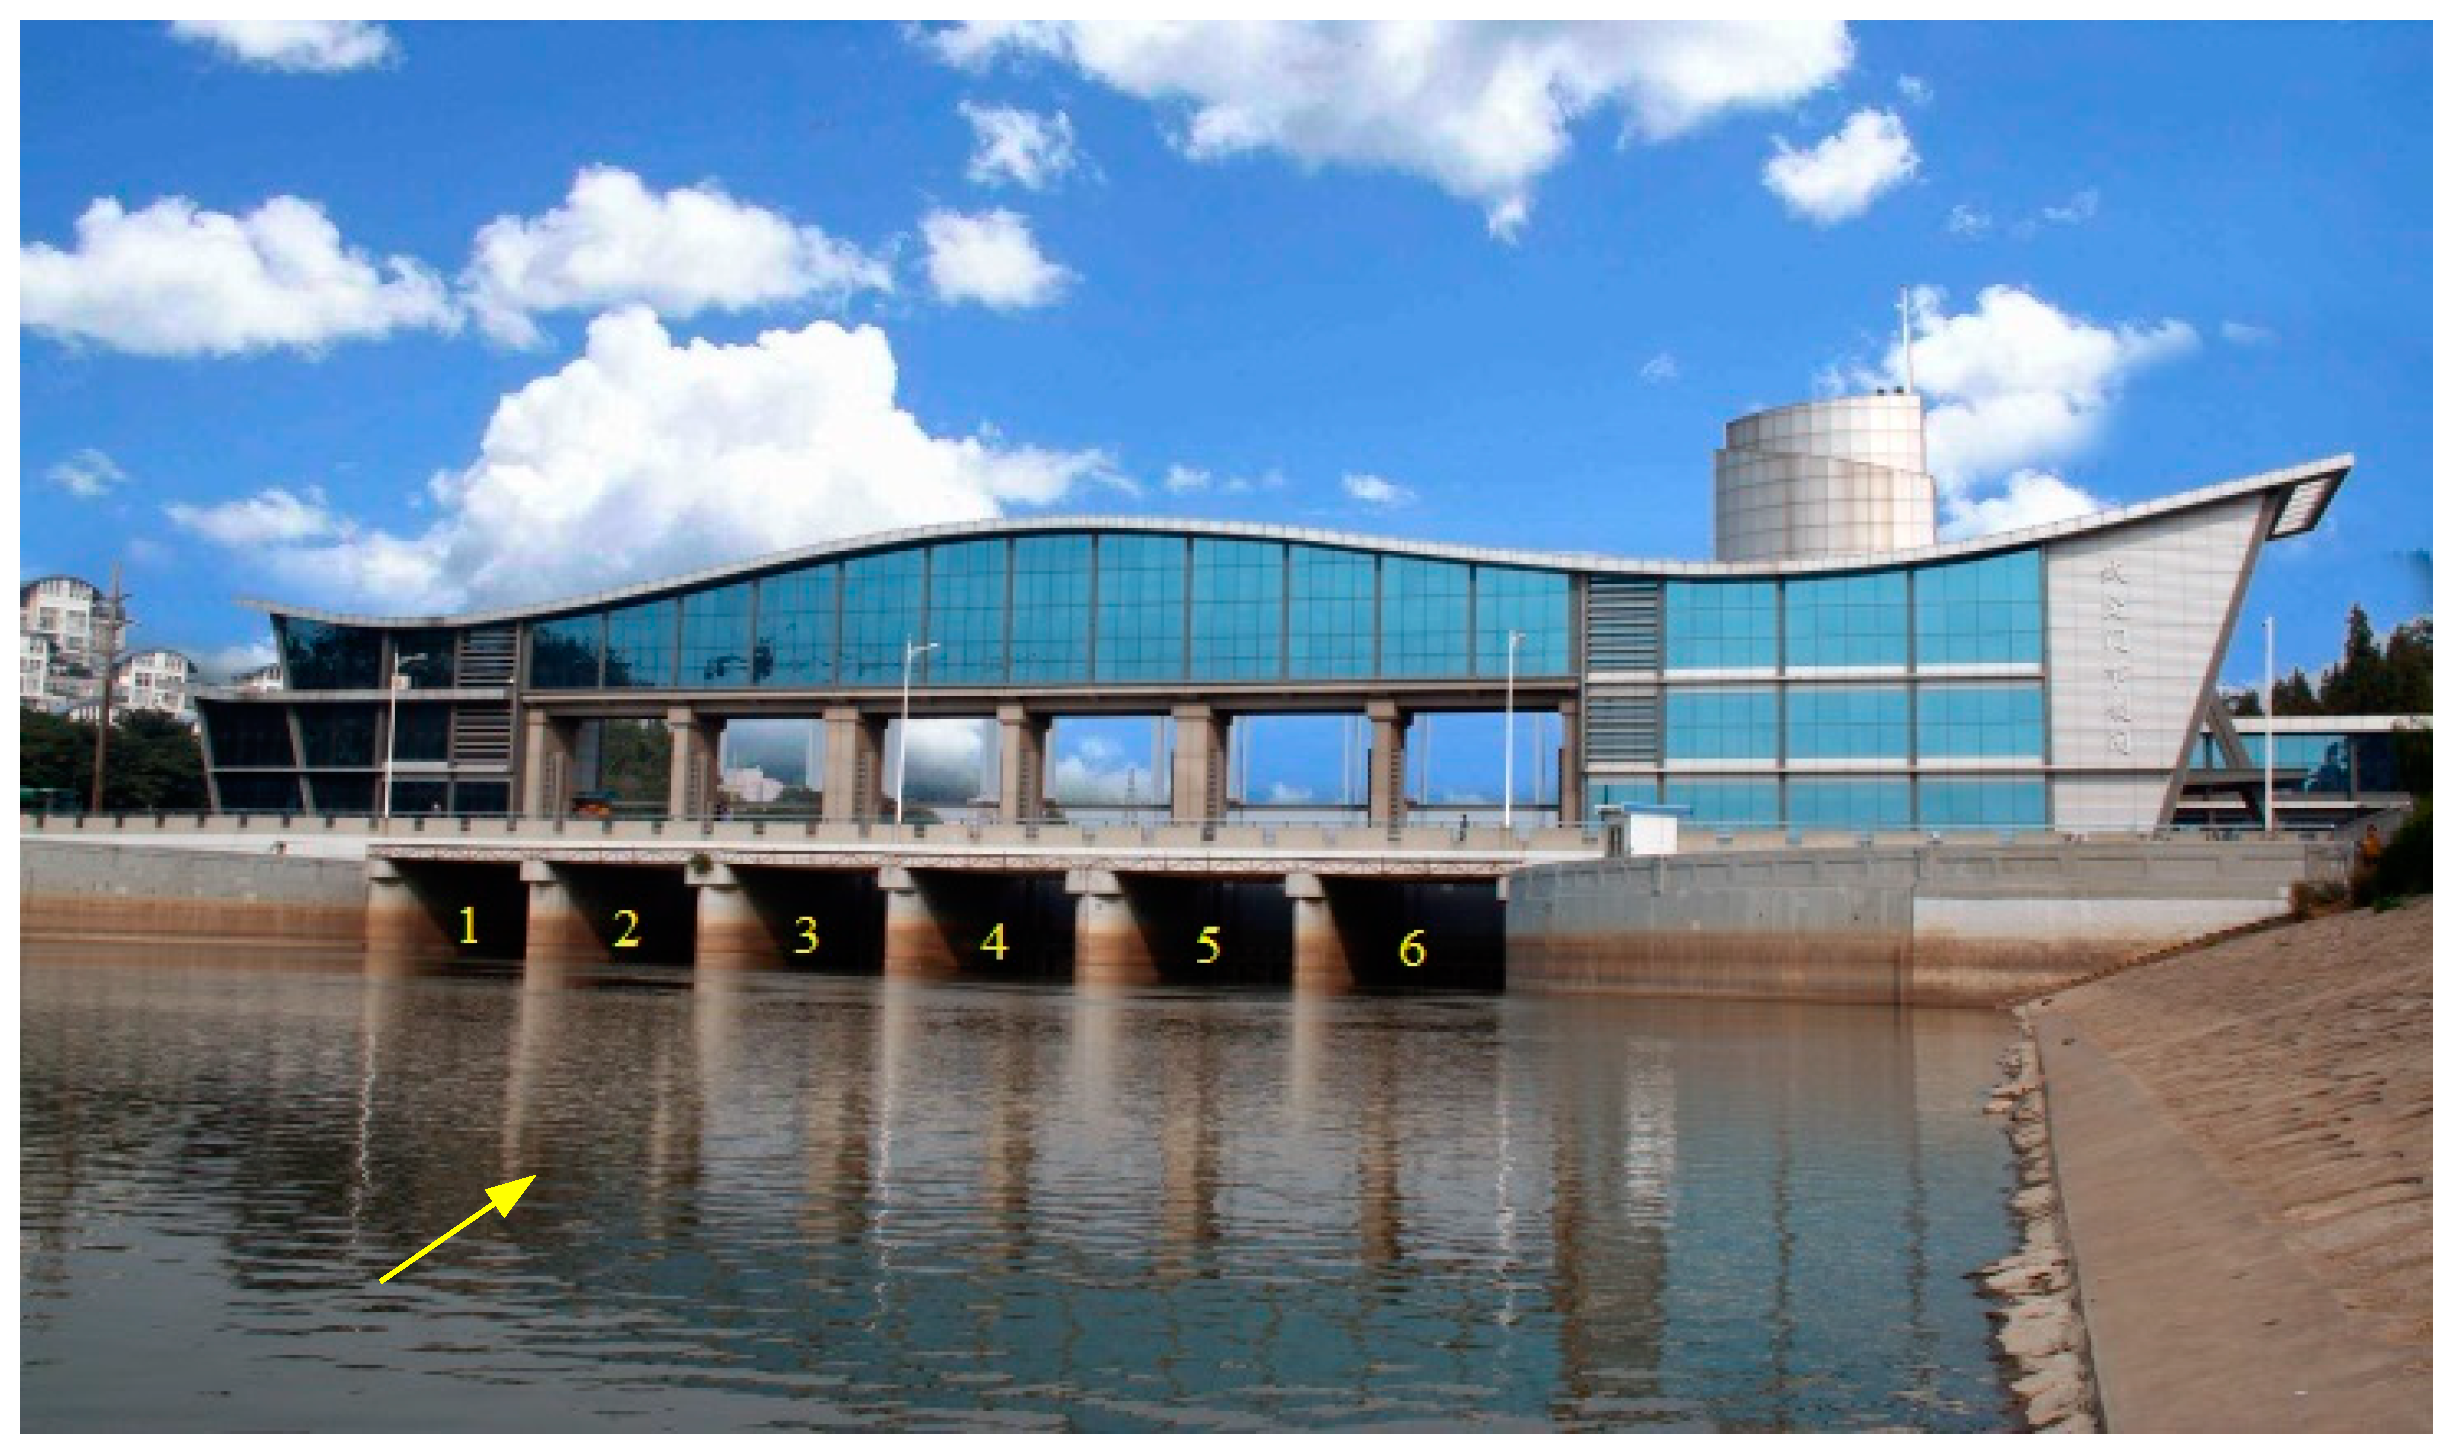
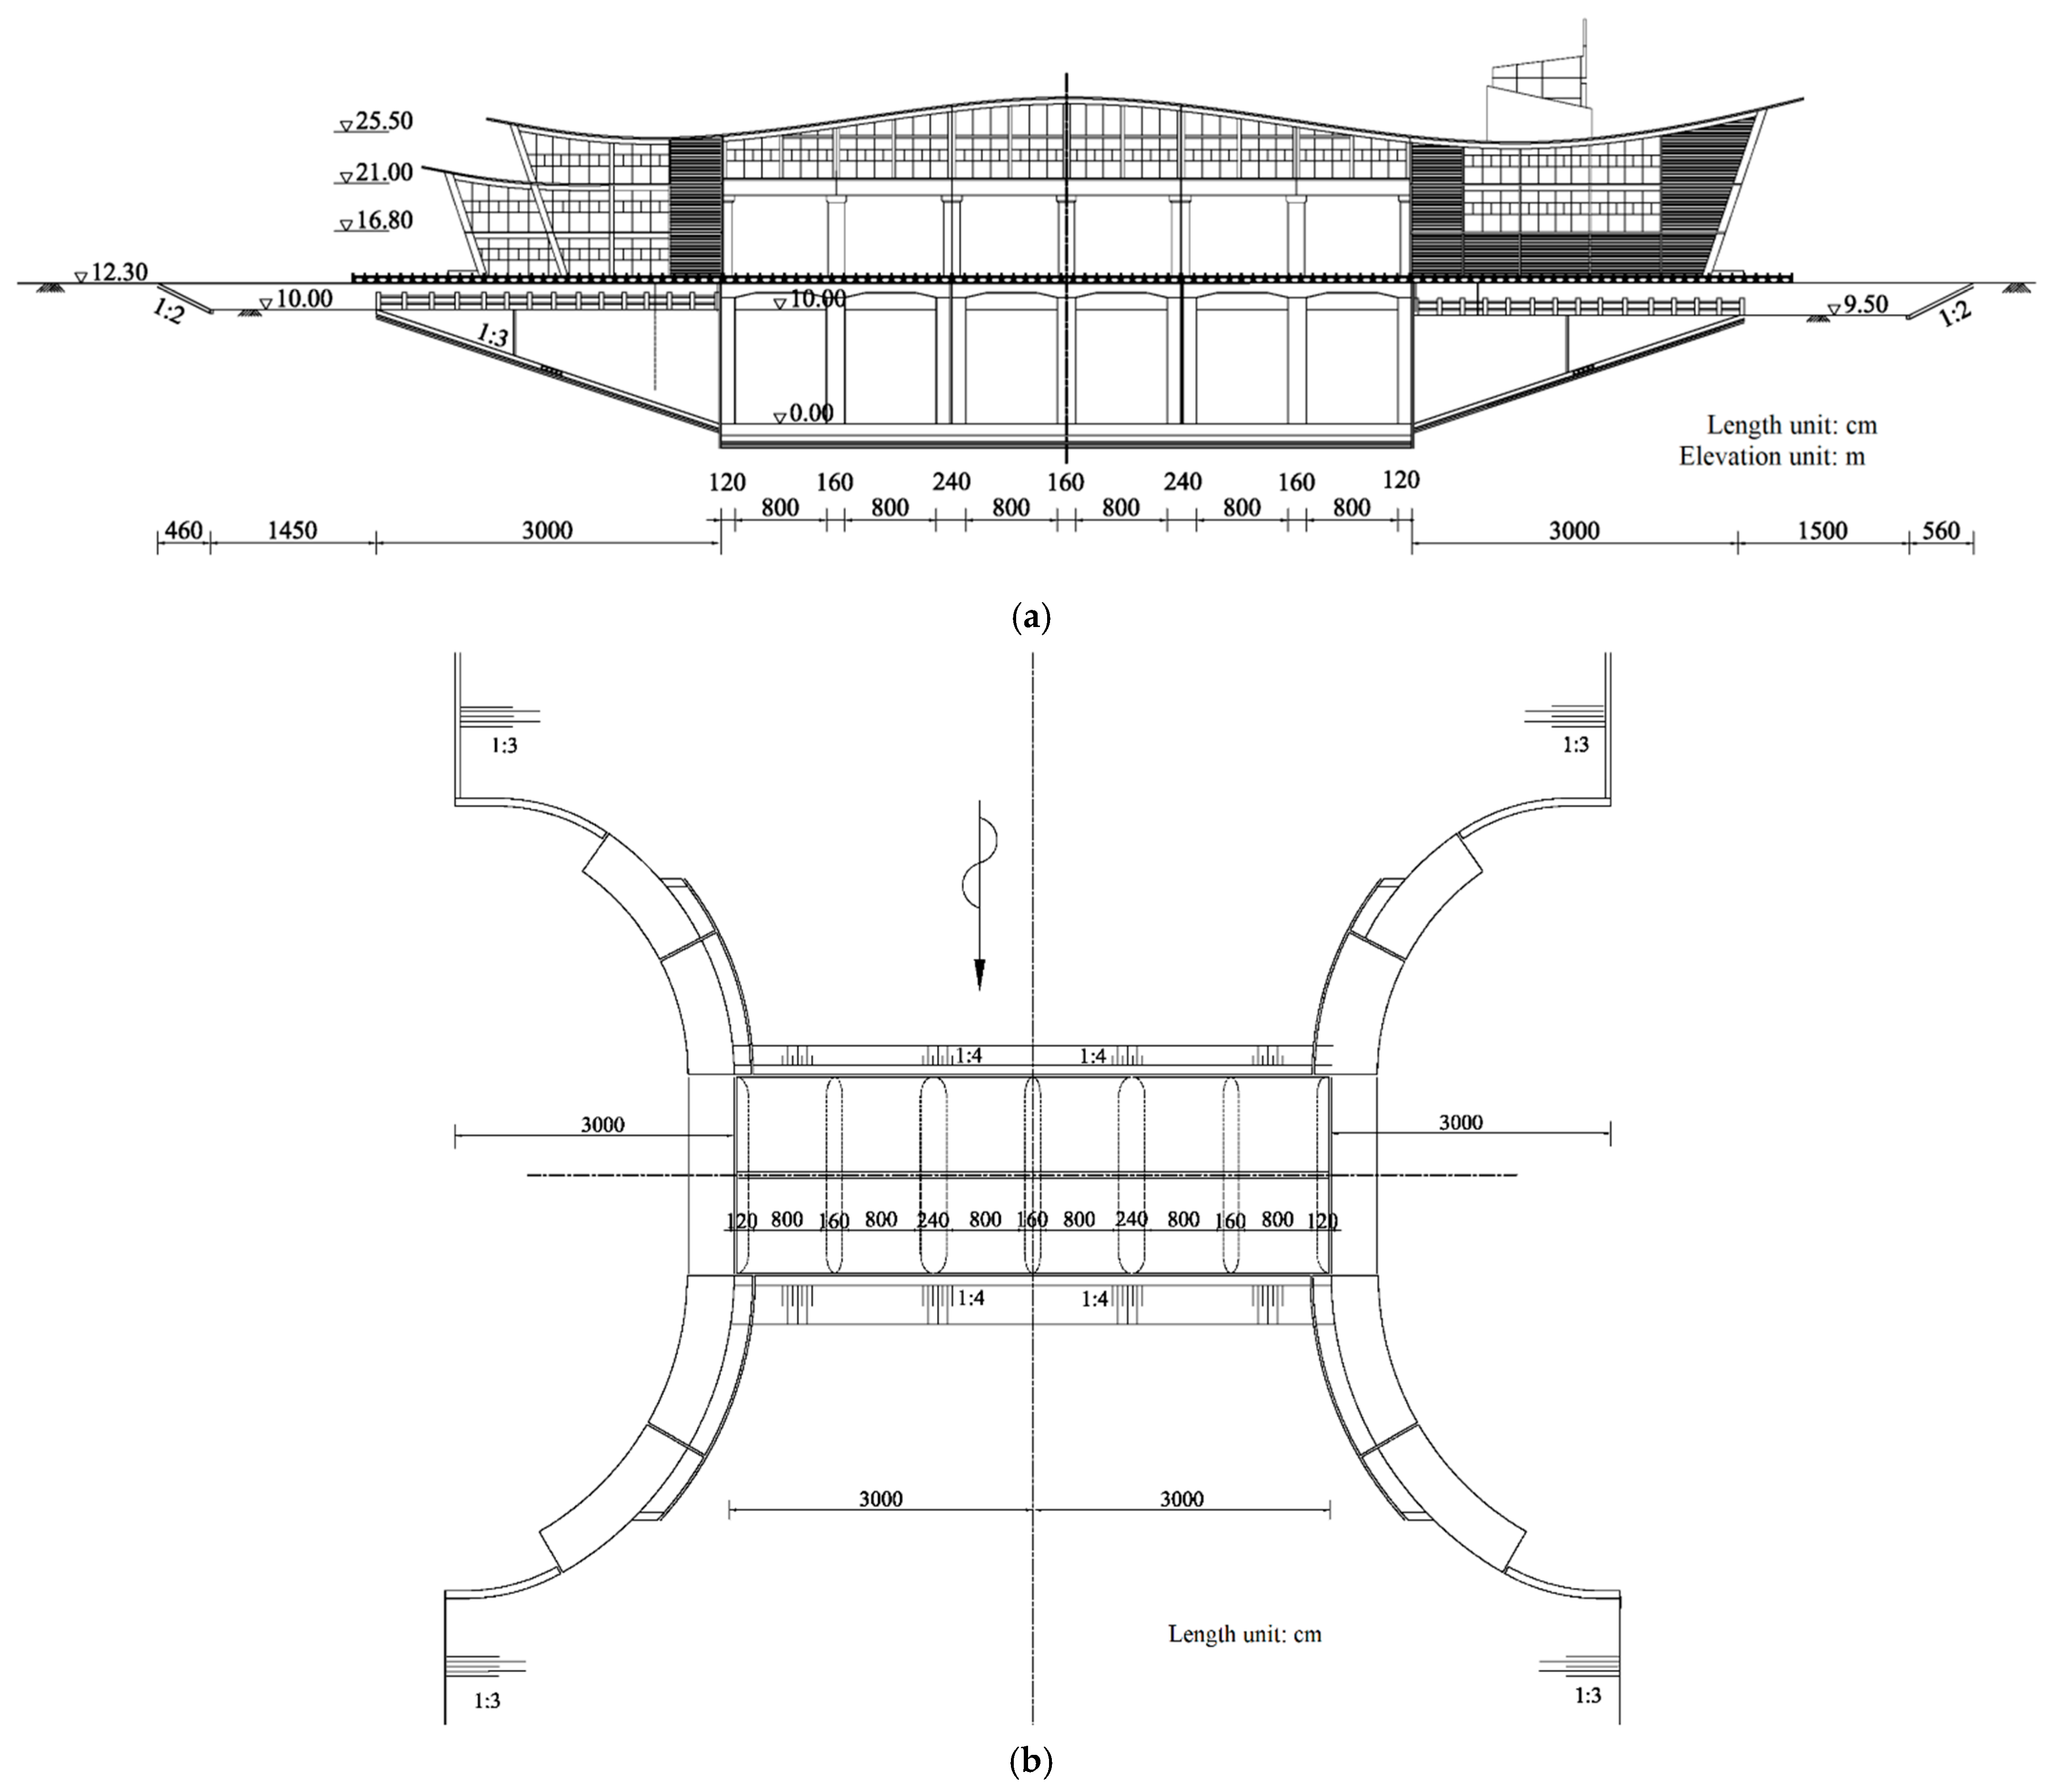
2. Reservoir and Sluice Structure

The sluice facility in question was commissioned in 1960 and comprises six bulkhead gates connected on each side with an abutment to the riverbank. After almost four decades in service, it was refurbished during 2007–2008, with replacements of all the gates and hoisting equipment and reinforcement of the concrete structure. Figure 1 shows a photo of the facility seen from upstream; Figure 2 illustrates its layout with dimensions. At the sluice site, the river is ~120 m wide. The multigate sluice is centrally placed and occupies approximately half the river width.
As shown in the cross-sectional profile, the gate threshold is placed at elevation +0.00 m. The gates are founded on a platform sloping at rise:run = 1:4 both up- and downstream. The river has a roughly trapezoidal cross-section, with the bank slope rise:run = 1:3 on each side. Seen from upstream, the gates are numbered 1–6 from left to right. The gates are mounted along the same axis along the structure, equipped with wire hoists for operation. Five piers are 1.60 m thick, and two piers adjacent to the central pier are somewhat thicker—2.40 m. The gates, all 10 m high, have the same net width—bg = 8.00 m. Including all the seven piers, the sluice structure is 60 m long.
Based on underwater laser-scanning data in 2015, the river bathymetry is shown in Figure 3. The river course is relatively uniform in cross-section and bends ~41° to the left in the reservoir area. Immediately downstream of the sluice, the riverbed is lowest in elevation, corresponding to the location of the stilling basin. In the reservoir, the lowest bed elevation ranges between 0 and +2 m MSL. The design retention water stage (DRWS) is +11.37 m MSL, at which the water-surface width varies between 90 and 150 m and the water depth amounts to 10–11 m at maximum. During a year, the river runoff varies significantly. The multiyear average river discharge is ~38 m3/s, and the discharge during a wet season can be as high as 400 m3/s.
Based on multiyear flow data, the discharge variations and the flow frequency are shown in Figure 4. The representative operation conditions of the sluice are at low and medium flow discharges (denoted as cases 1 and 2).
The flow carries fine sediment in the form of both bed load and suspended load. Field measurements are conducted to determine its composition, which shows that the grain size is D = 0.002–0.90 mm and the median grain size is D50 = 0.014 mm (Figure 5). In light of the grain-size distribution, the sediment material is classified as sand (0.05–2 mm), silt (0.005–0.05 mm), and clay (<0.005 mm) [27]. On average, the suspended load of cohesive silt and clay accounts for ~85% and the bed load of non-cohesive sand is ~15%.
Table 1 summarizes the operational parameters of the three typical cases examined, in which Z = water level (m ASL), with subscripts u and d denoting up- and downstream, Q (m3/s) = river-flow discharge, S (kg/m3) = suspended load concentration, e (m) = gate opening height, and b (m) = total net flow width at the sluice, depending on the number of opened gates (N). The first two cases are the design conditions for the proposed guide vanes, while case 3 is for checking their local scouring risk. Governed by the operation requirements, three gates are opened at low discharges (N = 3). At medium and high discharges, all the gates must be operated (N = 6). Once opened, all the gates have the same e value.
Due to the river bend, the inflow into the reservoir tends to follow the right bank. Driven by this, a zone of flow circulation is formed on the left side of the reservoir. Field investigations show that over the years of the sluice operations, a significant amount of sediment settles undesirably on the reservoir’s left side. Deposition also occurs in the close vicinity of the structure. At high discharges, all the gates are at the fully opened positions, thus leading to effective flushing of the sediment into the reservoir. However, the daily operation conditions are at low and medium discharges, which carry an appreciable amount of sediment. In the long run, a proper countermeasure is necessary to guarantee the normal operation of the sluice structure.

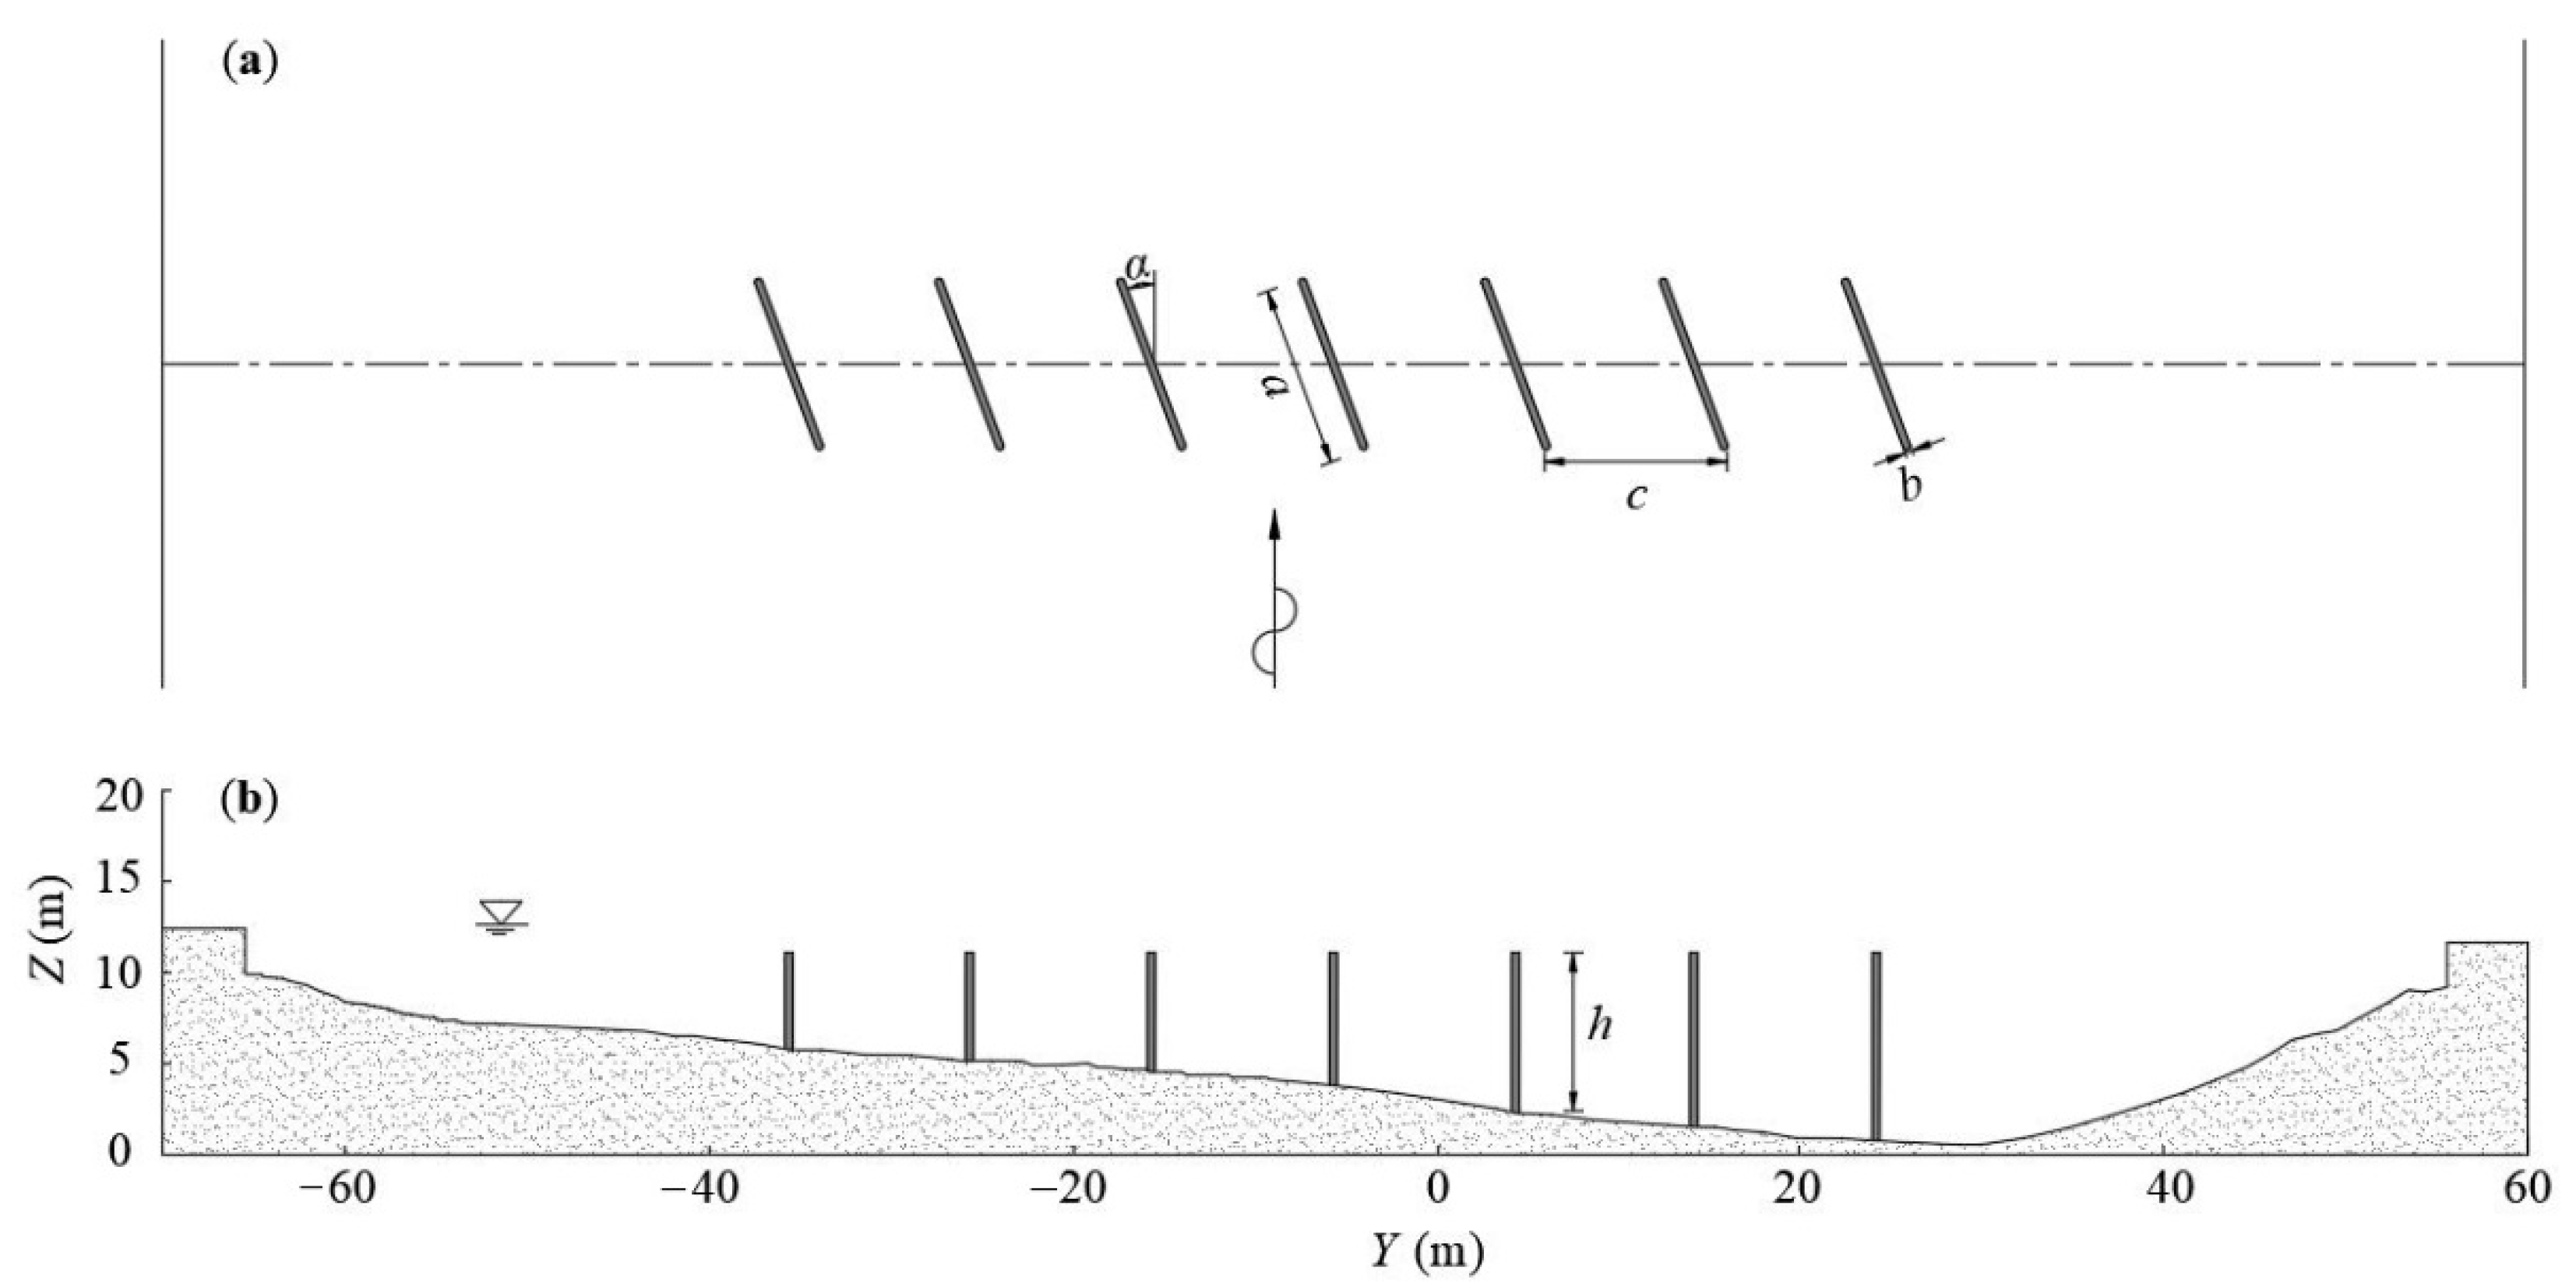
3. Guide-Vane Layout

To counteract the undesired reservoir sedimentation, necessary measures are required. River training approaches are commonly used, which include construction of spur dikes [28,29,30], rock vanes, and bendway weirs [31,32], various types of revetments [33], and dredging [34]. Each approach has its advantages and limitations. The choice is also dictated by the local conditions. For example, the presence of riparian structures precludes the use of spur dikes. All these approaches are discussed in the course of the pre-study. However, limited by the practical situation, they are excluded for use at the site.
Guide vanes are instead chosen as the alternative. The layout of guide vanes refers to their positions and configuration (form, length, width, and height) and is usually associated with a number of factors, including reservoir bathymetry, its shape in planform, and riparian structures. Field investigations show that the main current downstream of the river bend runs obliquely towards the right bank and generates, depending on flow discharge, flow circulations of significant size. The guide vanes are oriented in such a manner that the main reservoir current is effectively deflected to follow the direction towards the gates. In addition, the vane configuration should be as simple as possible.
Figure 6 shows the sketch of the layout. Based on field investigations, an array of parallel vanes is suggested, running along a cross-section downstream of the bend. The vanes are vertically placed and straight in planform, with equal distance between and both ends slightly rounded. A (X, Y) coordinate system is set up, with X running along the central sluice pier’s centerline (positive upstream) and Y along the cross-channel axis of the bulkhead gates (positive towards right bank). Let a, b, h, c and α denote vane length, thickness, height, distance between two neighboring vanes and angle (positive anticlockwise) that the vanes form with X. The exact positioning of the vanes in the reservoir and the geometric parameters are finalized in the physical model tests.
It should be pointed out that, from the hydraulic point of view, the proposed position of the guide vanes may not be the most favorable. However, the practical conditions here limit the possibility to place them further upstream or somewhere else. A curved vane shape or a varying vane width is not examined in the study.

4. Hybrid Modeling

To cope with the sedimentation issue, the study incorporates a hybrid approach of physical and numerical simulations. In an early stage, a physical model of a fixed bed is constructed to examine the reservoir flow patterns and assess guide-vane layouts. With difficulties in reasonably reproducing boundary conditions for suspended sediment, a 2D numerical model of a movable bed is set up to map sediment motions. Their combination identifies the sedimentation patterns and evaluates the use of guide vanes as a means for alleviating the sediment deposition.

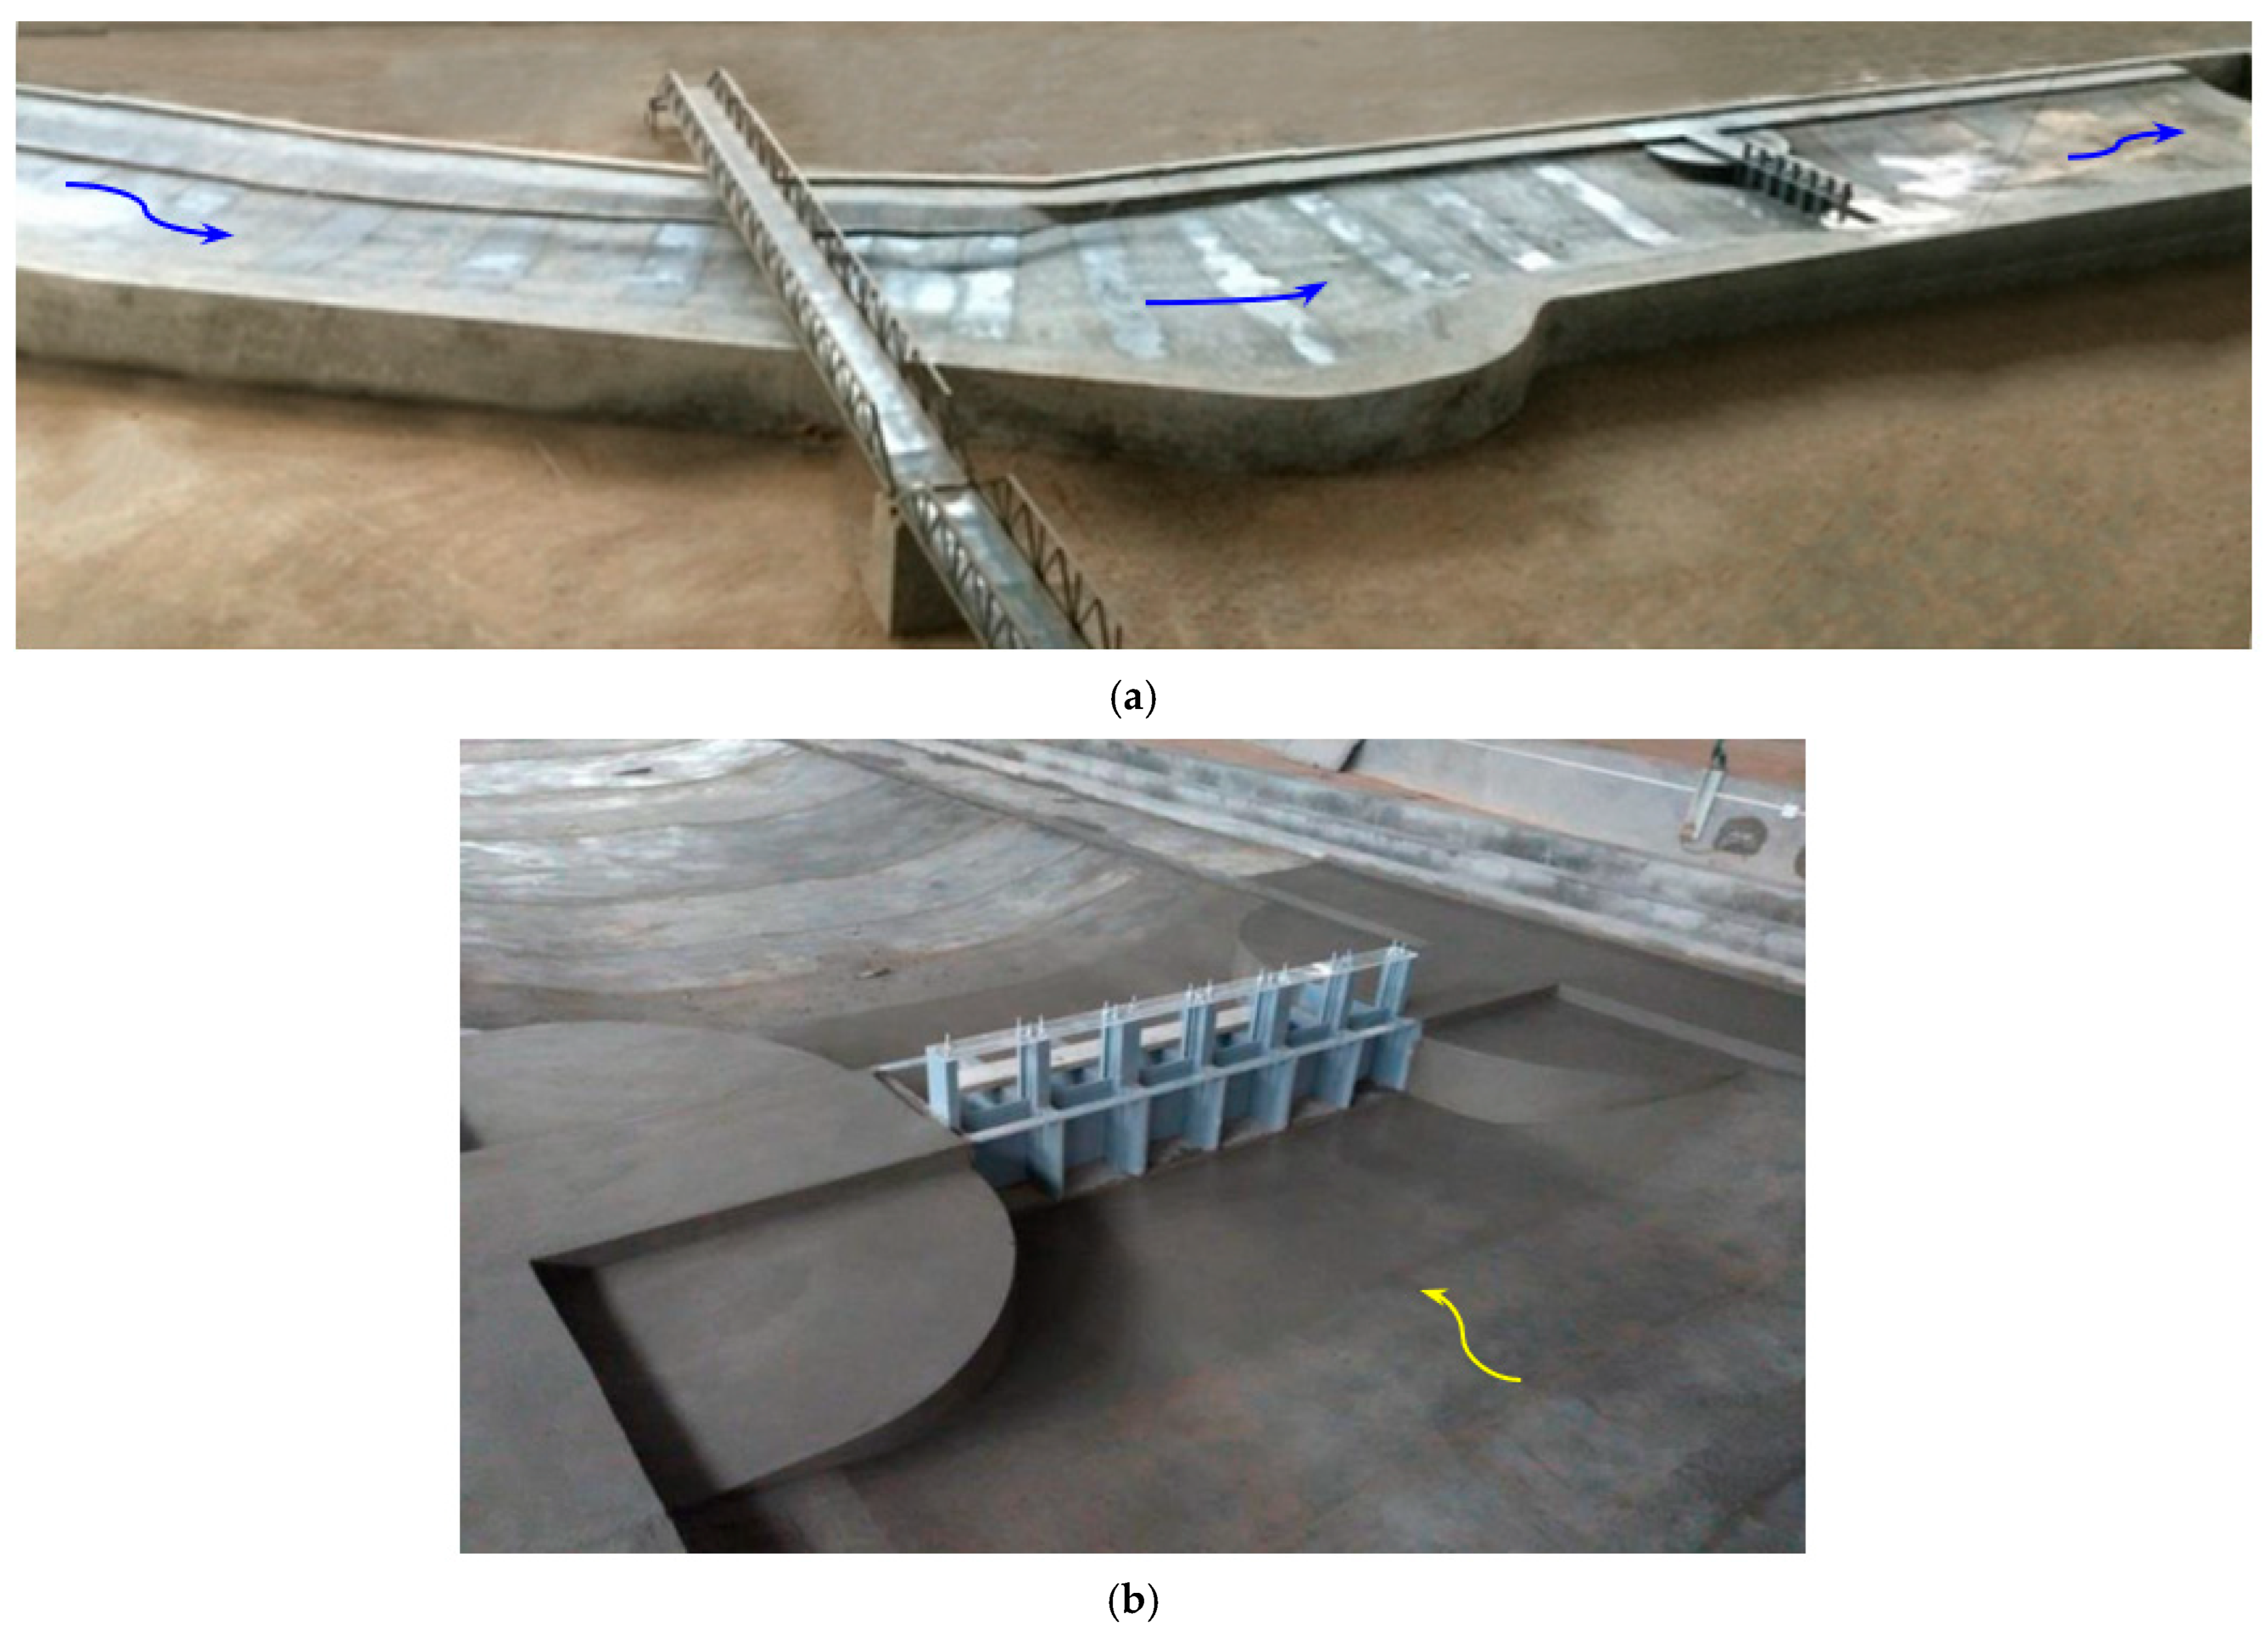
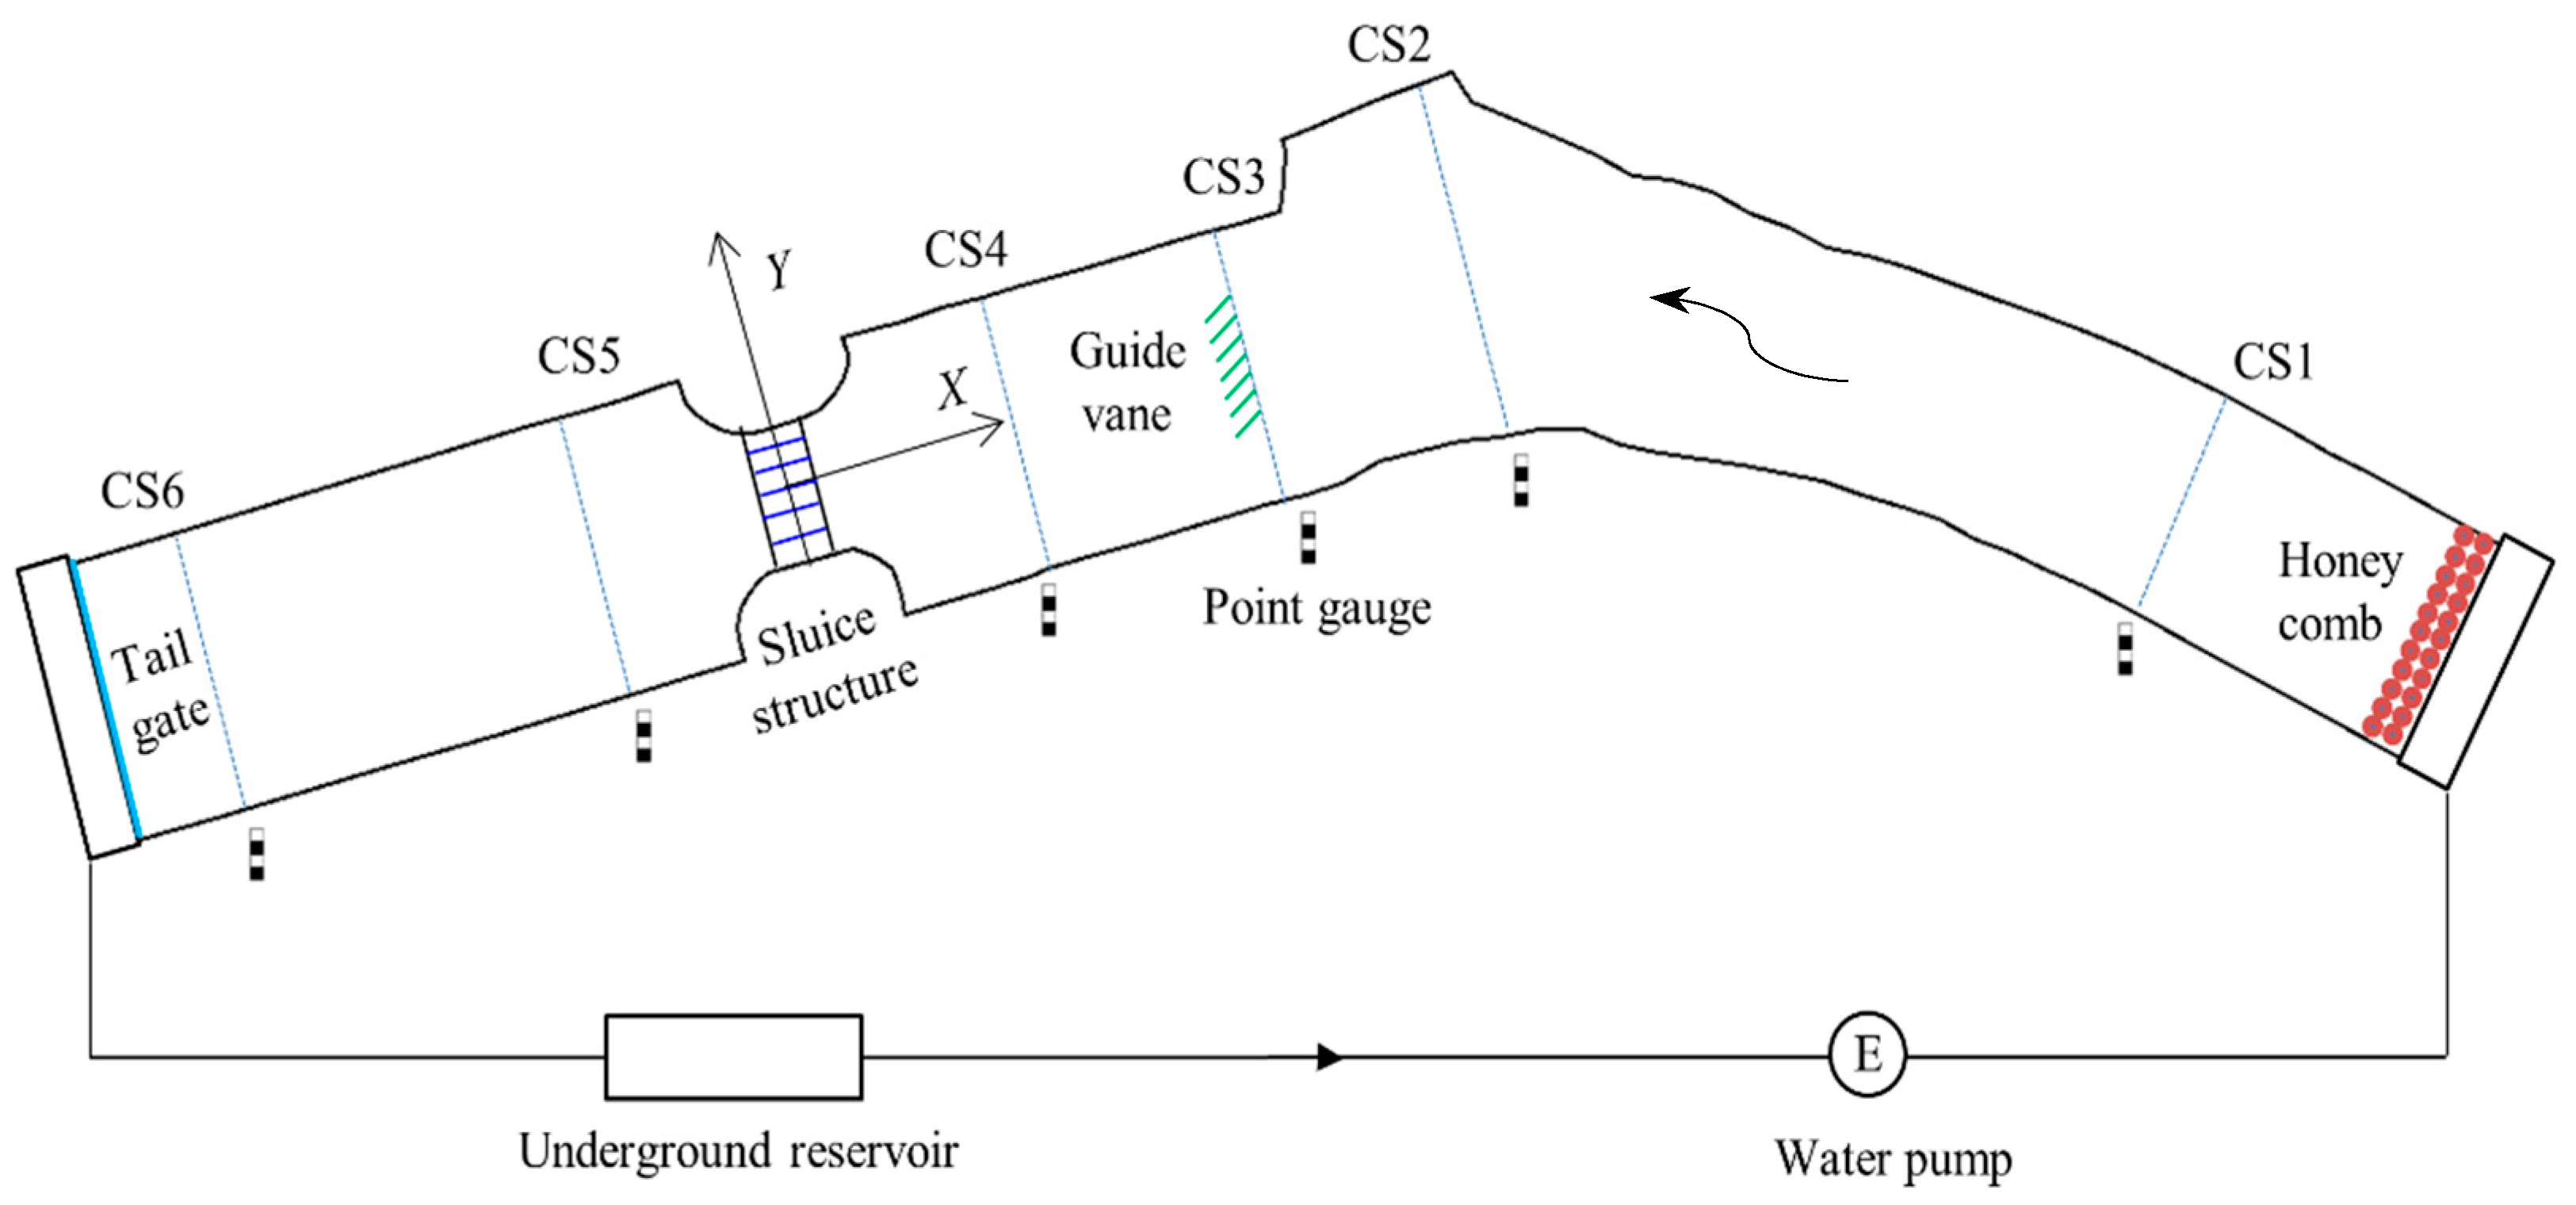
4.1. Physical Model Tests

The fixed-bed model is based upon the Froude law of gravity similitude. The reservoir bathymetry is acquired via echo-sounding from a remotely controlled vehicle. The reservoir length is 820 m. The sluice outflow being affected by the tailwater, a 380 m river reach downstream is also included.
The model scale is λ = Lpt/Lm = 40, where L = length and subscripts pt and m refer to prototype and model. Figure 7 shows a photograph over the model. Measured along the river centerline, the model is ~30 m long and ~4 m wide in cross-section. At the upstream inlet, a honeycomb is installed to calm the inflow. At the outlet, a flip gate regulates tailwater levels in the light of the discharge-water stage relationship at the location. The sluice structure is manufactured with accuracy. Each gate opening is 0.2 m wide. Including all the piers, the sluice structure is 1.5 m long in the Y direction.
From prototype to model, the conversion scales for Manning’s roughness coefficient (n), flow pressure (p), time (t), flow velocity (u), and flow rate (Q) are λn = λ1/6, λp = λ, λt = λ0.5, λu = λ0.5, and λQ = λ2.5, respectively. The errors in terrain production are, on average, below ±4 mm vertically and ±7 mm horizontally. Efforts are made to achieve corresponding surface roughness so that Manning’s criterion is approximately followed.
Figure 8 shows the experimental setup. The water is supplied from a circulation system. A calibrated 90° sharp-crested weir measures flow rates, with a relative error below ±(2–3)%. From up- to downstream, six cross-sections, denoted as CS1–CS6, are defined to facilitate the documentation. Measured along the river centerline, Table 2 lists their distance (denoted as L0) to the Y axis. All except CS1 are parallel to Y. Near the left bank at each cross-section, a point gauge monitors the water levels (denoted as Z). The measurement inaccuracy is in the order of ±0.2 mm. The water levels at CS4 and CS5 correspond to Zu and Zd.
Under the roof of the laboratory building, a particle image velocimetry (PIV) system, comprising nine industrial digital cameras at ~10 m height above the floor, is set up to capture surface flow velocities. The measurement error is 0.10 cm/s. The tracers are customized plastic particles 2.5 cm in diameter. Instantaneous flow images are captured at 10 Hz frequency, and the duration for data collection is 10 s. The time-averaged results are used when the flow fields are compared.
Scale effects of viscous and surface-tension forces are always an issue of discussion in physical modeling of free-surface flows [35,36], defined by Reynolds number R = (UH)/υ and Weber number W = U/(σ/ρH)0.5, where U (m/s) = depth-averaged velocity, H (m) = flow depth, ρ (kg/m3) = water density, σ (N/m) = surface-tension coefficient, and υ (m2/s) = water kinematic viscosity. Along the main stream in the model, R = (0.5–2.0) × 104 and W = 3.5–5.0 in case 1, and R = (2.0–9.0) × 104 and W = 4.0–5.5 in case 2. In the flow circulation zones, they are lower. As indicated by Heller [35,37,38] and Peakall and Warburton [35,37,38], if R > (0.4–4.0) × 104 and W > 3.3–10, their effects become insignificant. Even though there is no consensus on a single critical condition, either the R or W criterion is not always satisfied throughout the reservoir. At the bulkhead gates, both numbers are well above the threshold conditions. This implies that the viscous and surface-tension forces play certain roles in the results of the flow modeling. A surfactant is thus used to reduce the surface-tension effect in the tests.

4.2. Numerical Simulations

In solutions of river flow and sedimentation issues, a variety of codes can be used, e.g., Delft3D [39], MIKE21 [40] and Telemac-Mascaret [41]. As reported in [42] and [43], some other recently developed models are also available for simulation of the hydro–sediment–morphodynamic processes. In the present study, Delft3D is adopted to simulate both the flow and morphological changes. Its governing equations include mass continuity, flow momentum, sediment transport, and bed deformation. Instead of the k-ε turbulence model, the k-ω model is used to reasonably reproduce the reservoir flow with circulations. The suspended load transport is expressed by an advection–diffusion (mass balance) equation, and the bed-load transport is calculated with the van Rijn formula [44]. The bed-form changes are simulated with the specification of the bed-stability coefficient and the bed resistance. For a detailed description of the mathematical formulation, refer to the Delft3D website (https://oss.deltares.nl/web/delft3d, accessed on 1 January 2011) and some published results, such as [45,46].
As known, sediment transport modeling suffers from uncertainty due to the complexity of the hydrodynamics and the variety of the governing factors. Most of the sediment transport formulae are a function of bed shear stress developed using specific data sets [47]. The van Rijn formula is calibrated based on both field measurements and flume studies. Previous studies show that it is suitable for situations where suspended load dominates [48].
For suspended load transport, the 3D equation reads
S t + u S x + v S y + ω ω s S z = x ε s , x H S x + y ε s , y H S y + z ε s , z H S z F S
where x, y and z = coordinates, u, v, ω (m/s) = longitudinal, transversal and vertical velocity components, t (s) = time, ωs (m/s) = sediment settling velocity, εs,x, εs,y and εs,z (m2/s) = eddy diffusivity of sediment fraction and Fs = function of riverbed deformation. Fs is dependent on sediment erosion and deposition, given by
γ 0 Z b t = F s
F s = D b E b
D b = ω s S b 1 τ τ d τ τ d 0 τ d < τ
E b = M τ τ e 1 τ τ e 0 τ < τ e
where Zb (m) = change in bed elevation, γ0 (kg/m3) = bulk weight of bed material, Db (kg/(m2s)) = sediment flux of deposition, Eb (kg/(m2s)) = sediment flux of erosion, τ (N/m2) = bed shear stress, τd and τe (N/m2) = critical stresses of deposition and erosion, M (kg/m2s) = bed scouring rate, and Sb (kg/m3) = near-bottom sediment concentration.
In light of the van Rijn formula [44], the bed load in the form of fine sand is entrained into the flow by imposing a concentration Sb (kg/m3) at a reference height above the bottom (delimiting bed load and suspended load), which is dependent on current-related effective roughness height. Sb (kg/m3) is calculated by:
S b = 0.015 ρ s D 50 T 1.5 a D * 0.3
where   ρ s (kg/m3) = density of sediment material, D * = dimensionless particle parameter, and T = dimensionless bed shear stress.
According to the van Rijn formula [44], the transport rate of bed load, qb (kg/(m·s)), is expressed as
q b = 0.006 ρ s ɷ s D 50 M s 0.5 M e 0.7
The transport rate of suspended load, qs (kg/(m·s)), reads
q s = f cs H U S b
where Ms = sediment mobility number, Me = excess sediment mobility number, fcs = a shape factor, H (m) = water depth, and U (m/s) = depth-averaged velocity.
The computations are performed in prototype size, with the same river length (1200 m) as in the physical model studies. Starting with a coarse mesh, global and local refinements are made to achieve a fine mesh. Several meshes of varied cell size are evaluated to ensure grid independence, which is checked through steady-state calculations. Figure 9 shows the horizontal mesh, with an enlarged view at the multigate sluice. Irrespective of local water depth, the sluice piers are treated as dry cells. The guide vanes are represented by an array of infinitely thin objects that prohibit flow exchange between the two adjacent cells. The vane crest can be below, at, or above the water surface. In the plan, the domain is covered by 15,350 cells, comprising 307 streamwise and 50 transverse. Smaller cells, 1.5 m in size, are used in the sluice to account for large velocity gradients.
Boundary conditions are defined in terms of both flow and sediment, which are based on in situ measurements. At the upstream boundary, Q and S are given; at the downstream one, Zd is specified (Table 1). For the riverbed and banks, a nonentry condition specifies a zero-normal gradient of sediment content. Table 3 summarizes the other model parameters, i.e., ωs, τd, τe, M and γ0.
To achieve numerical stability, the time step ∆t = 0.01 s is chosen. In a coupled process, the flow, sediment, and morphology are updated from one time step to another. The simulation terminates when the solution becomes independent of iterations. For computing a steady-state case, the wall-clock time is ~12 h.

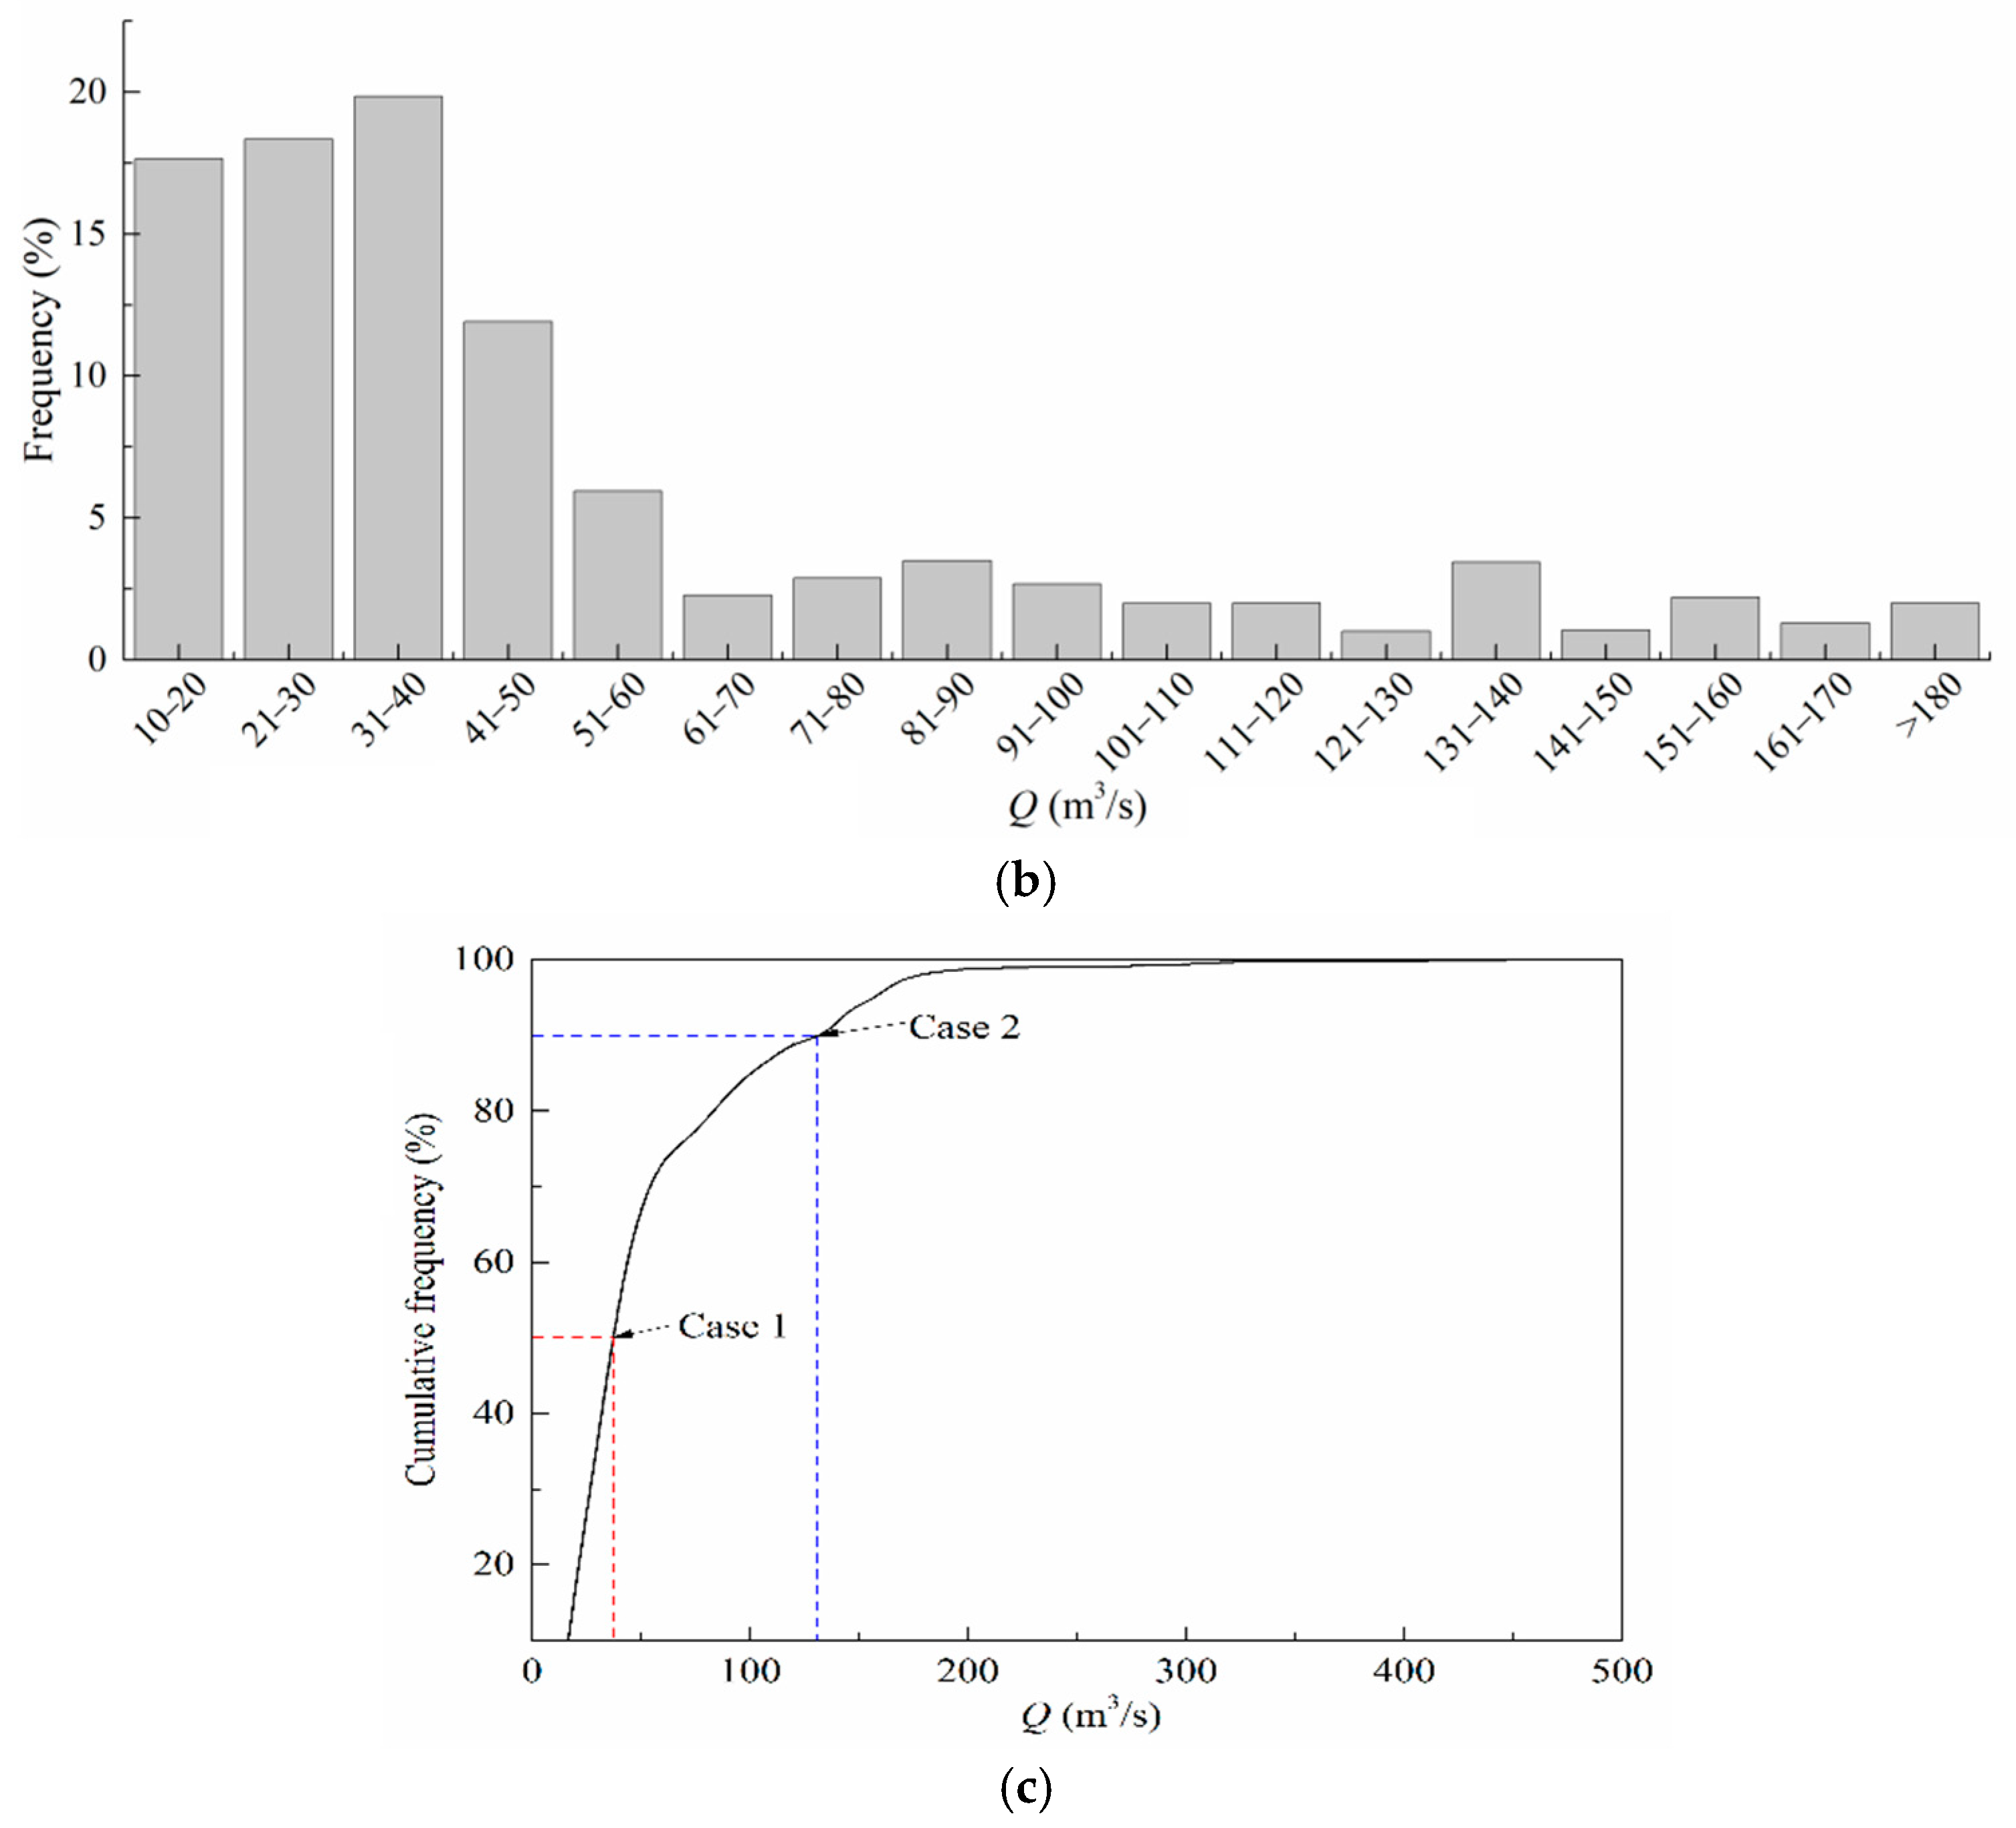
5. Results and Discussion

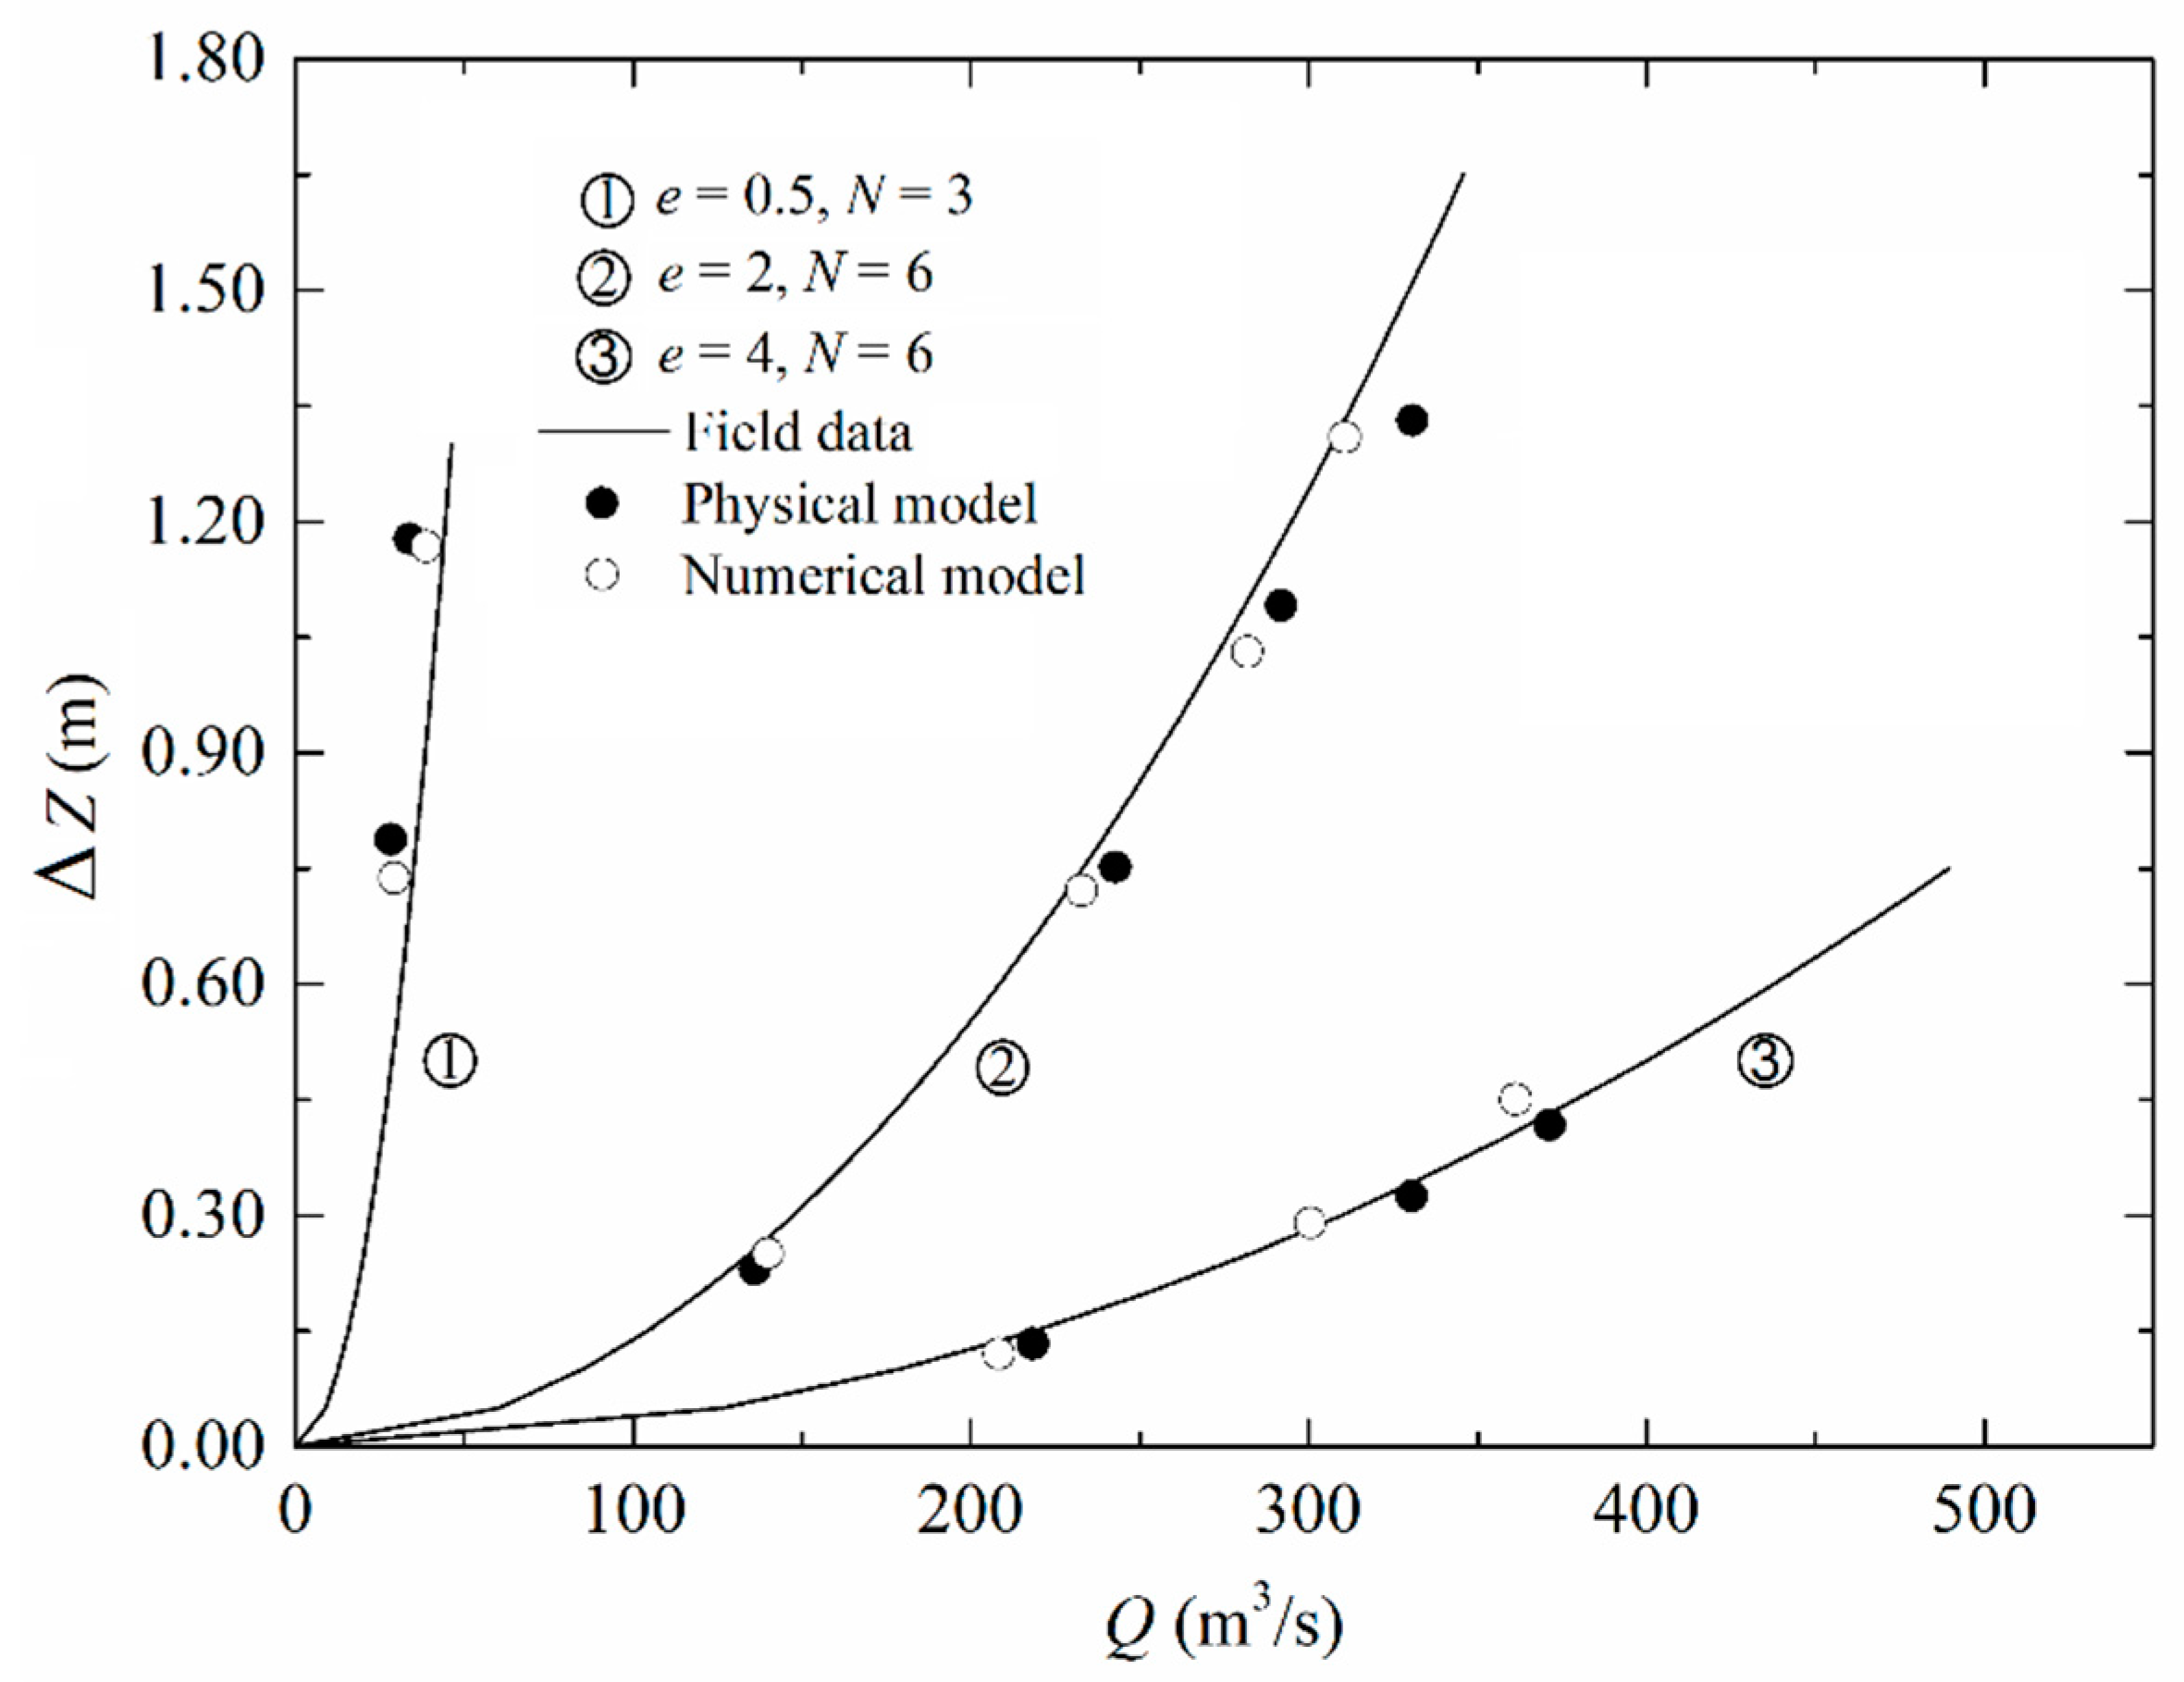
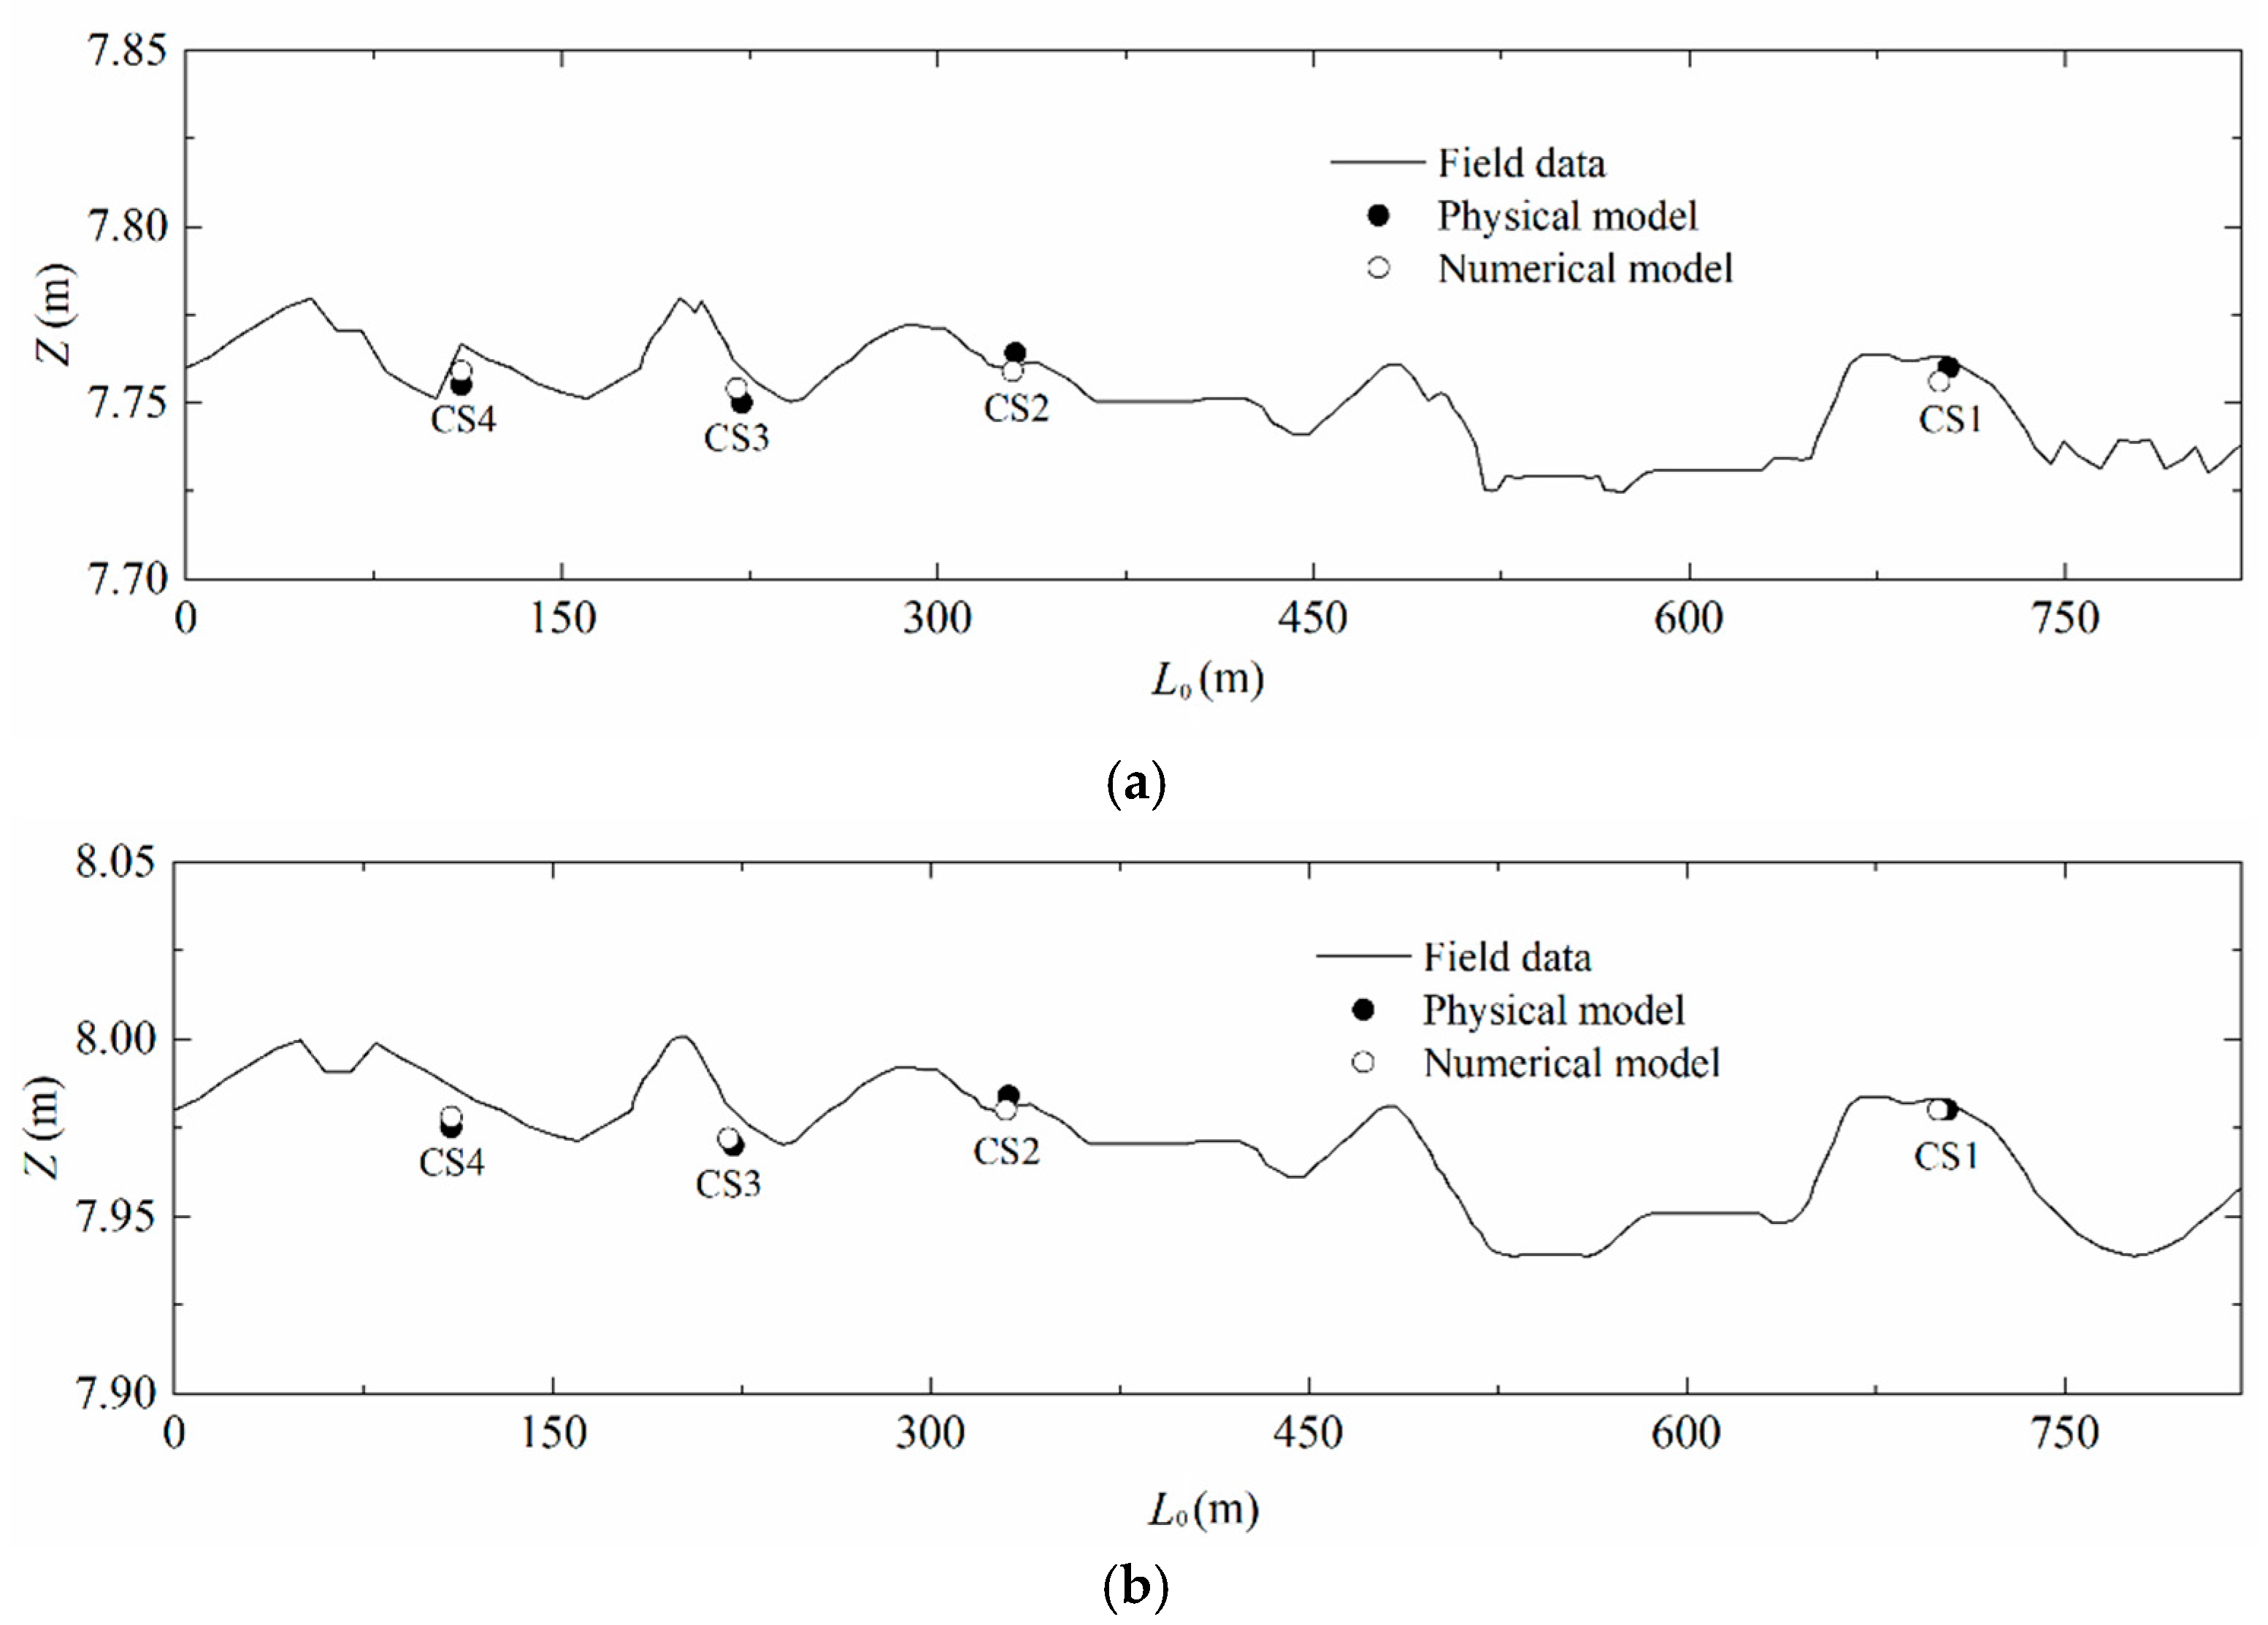
5.1. Comparisons with Prototype Measurements

To appraise the modeling accuracy, both numerical and physical, the results of sluice flow discharge and water stage are compared. With the ACDP technique, field measurements are also made on several occasions to determine river discharges under varying operation conditions. Analysis of the field data leads to Manning’s npt = 0.022–0.026, which is used in the numerical model. To satisfy λn = npt/nm = λ1/6, nm = 0.012–0.015, which is achieved through repeated surface finishing in the physical model.
For three e and N combinations, Figure 10 compares the sluice discharge capacity, i.e., the Q variations as a function of ΔZ, where ΔZ (m) = Zcs4Zcs5 = ZuZd. It shows that the model tests and the numerical simulations give comparable results and their agreement with the field data is generally good. At e = 0.5 and N = 3, the results are slightly underestimated. At e = 2 and N = 6, the modeling leads to some overestimation. At e = 4 and N = 6, the results are much closer to each other. As shown in Figure 11, the modeled reservoir water levels at CS1–CS4 in cases 1 and 2 are compared with the field data. The modeled results fit the field data well, with errors below ±3–5 cm (in prototype dimension), which indicates good performance of both models. The study also demonstrates that it is essential to satisfy the roughness criterion (λn), which would otherwise give rise to significant errors in water stage.

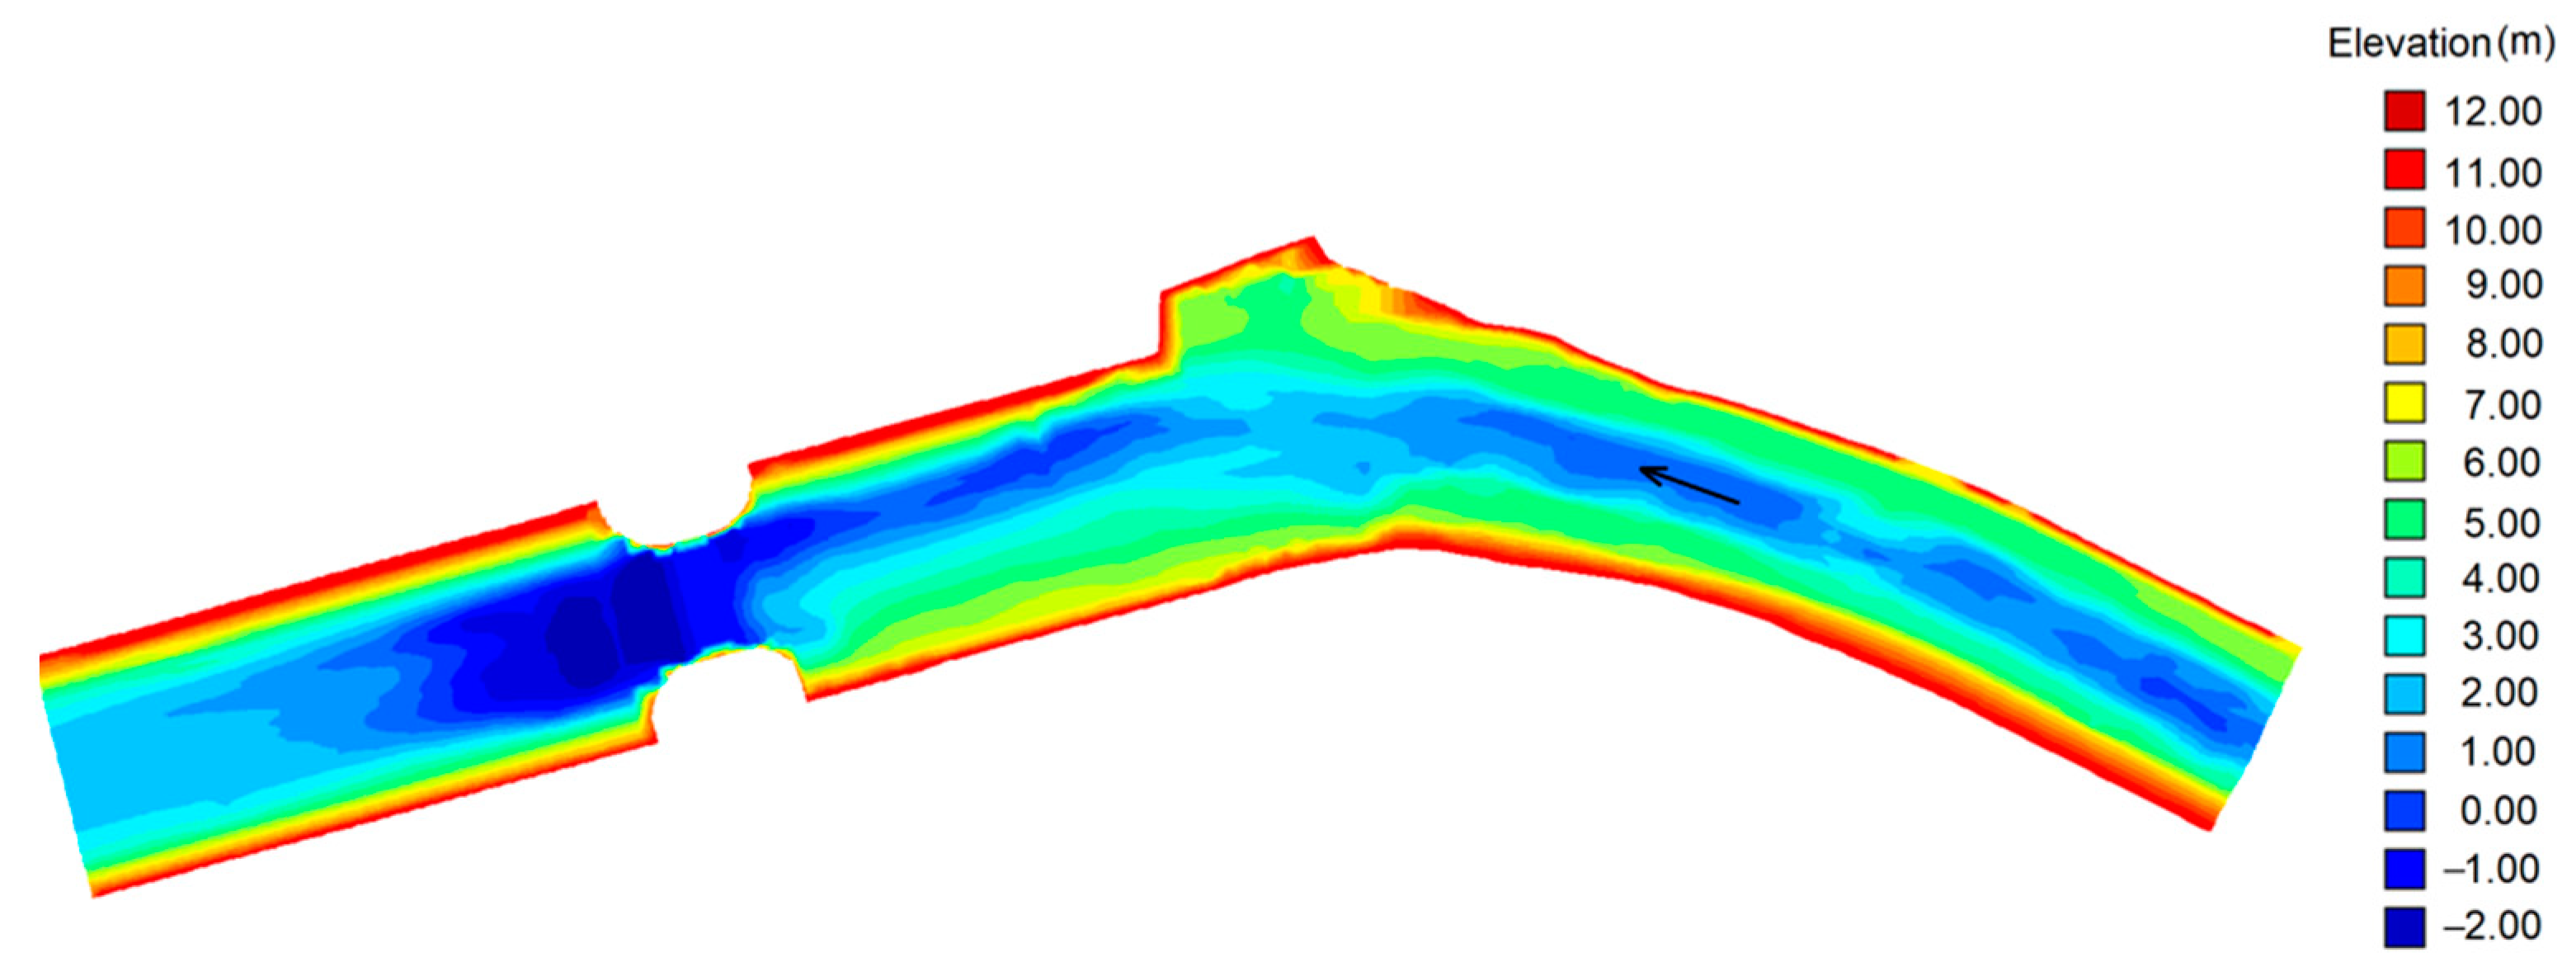
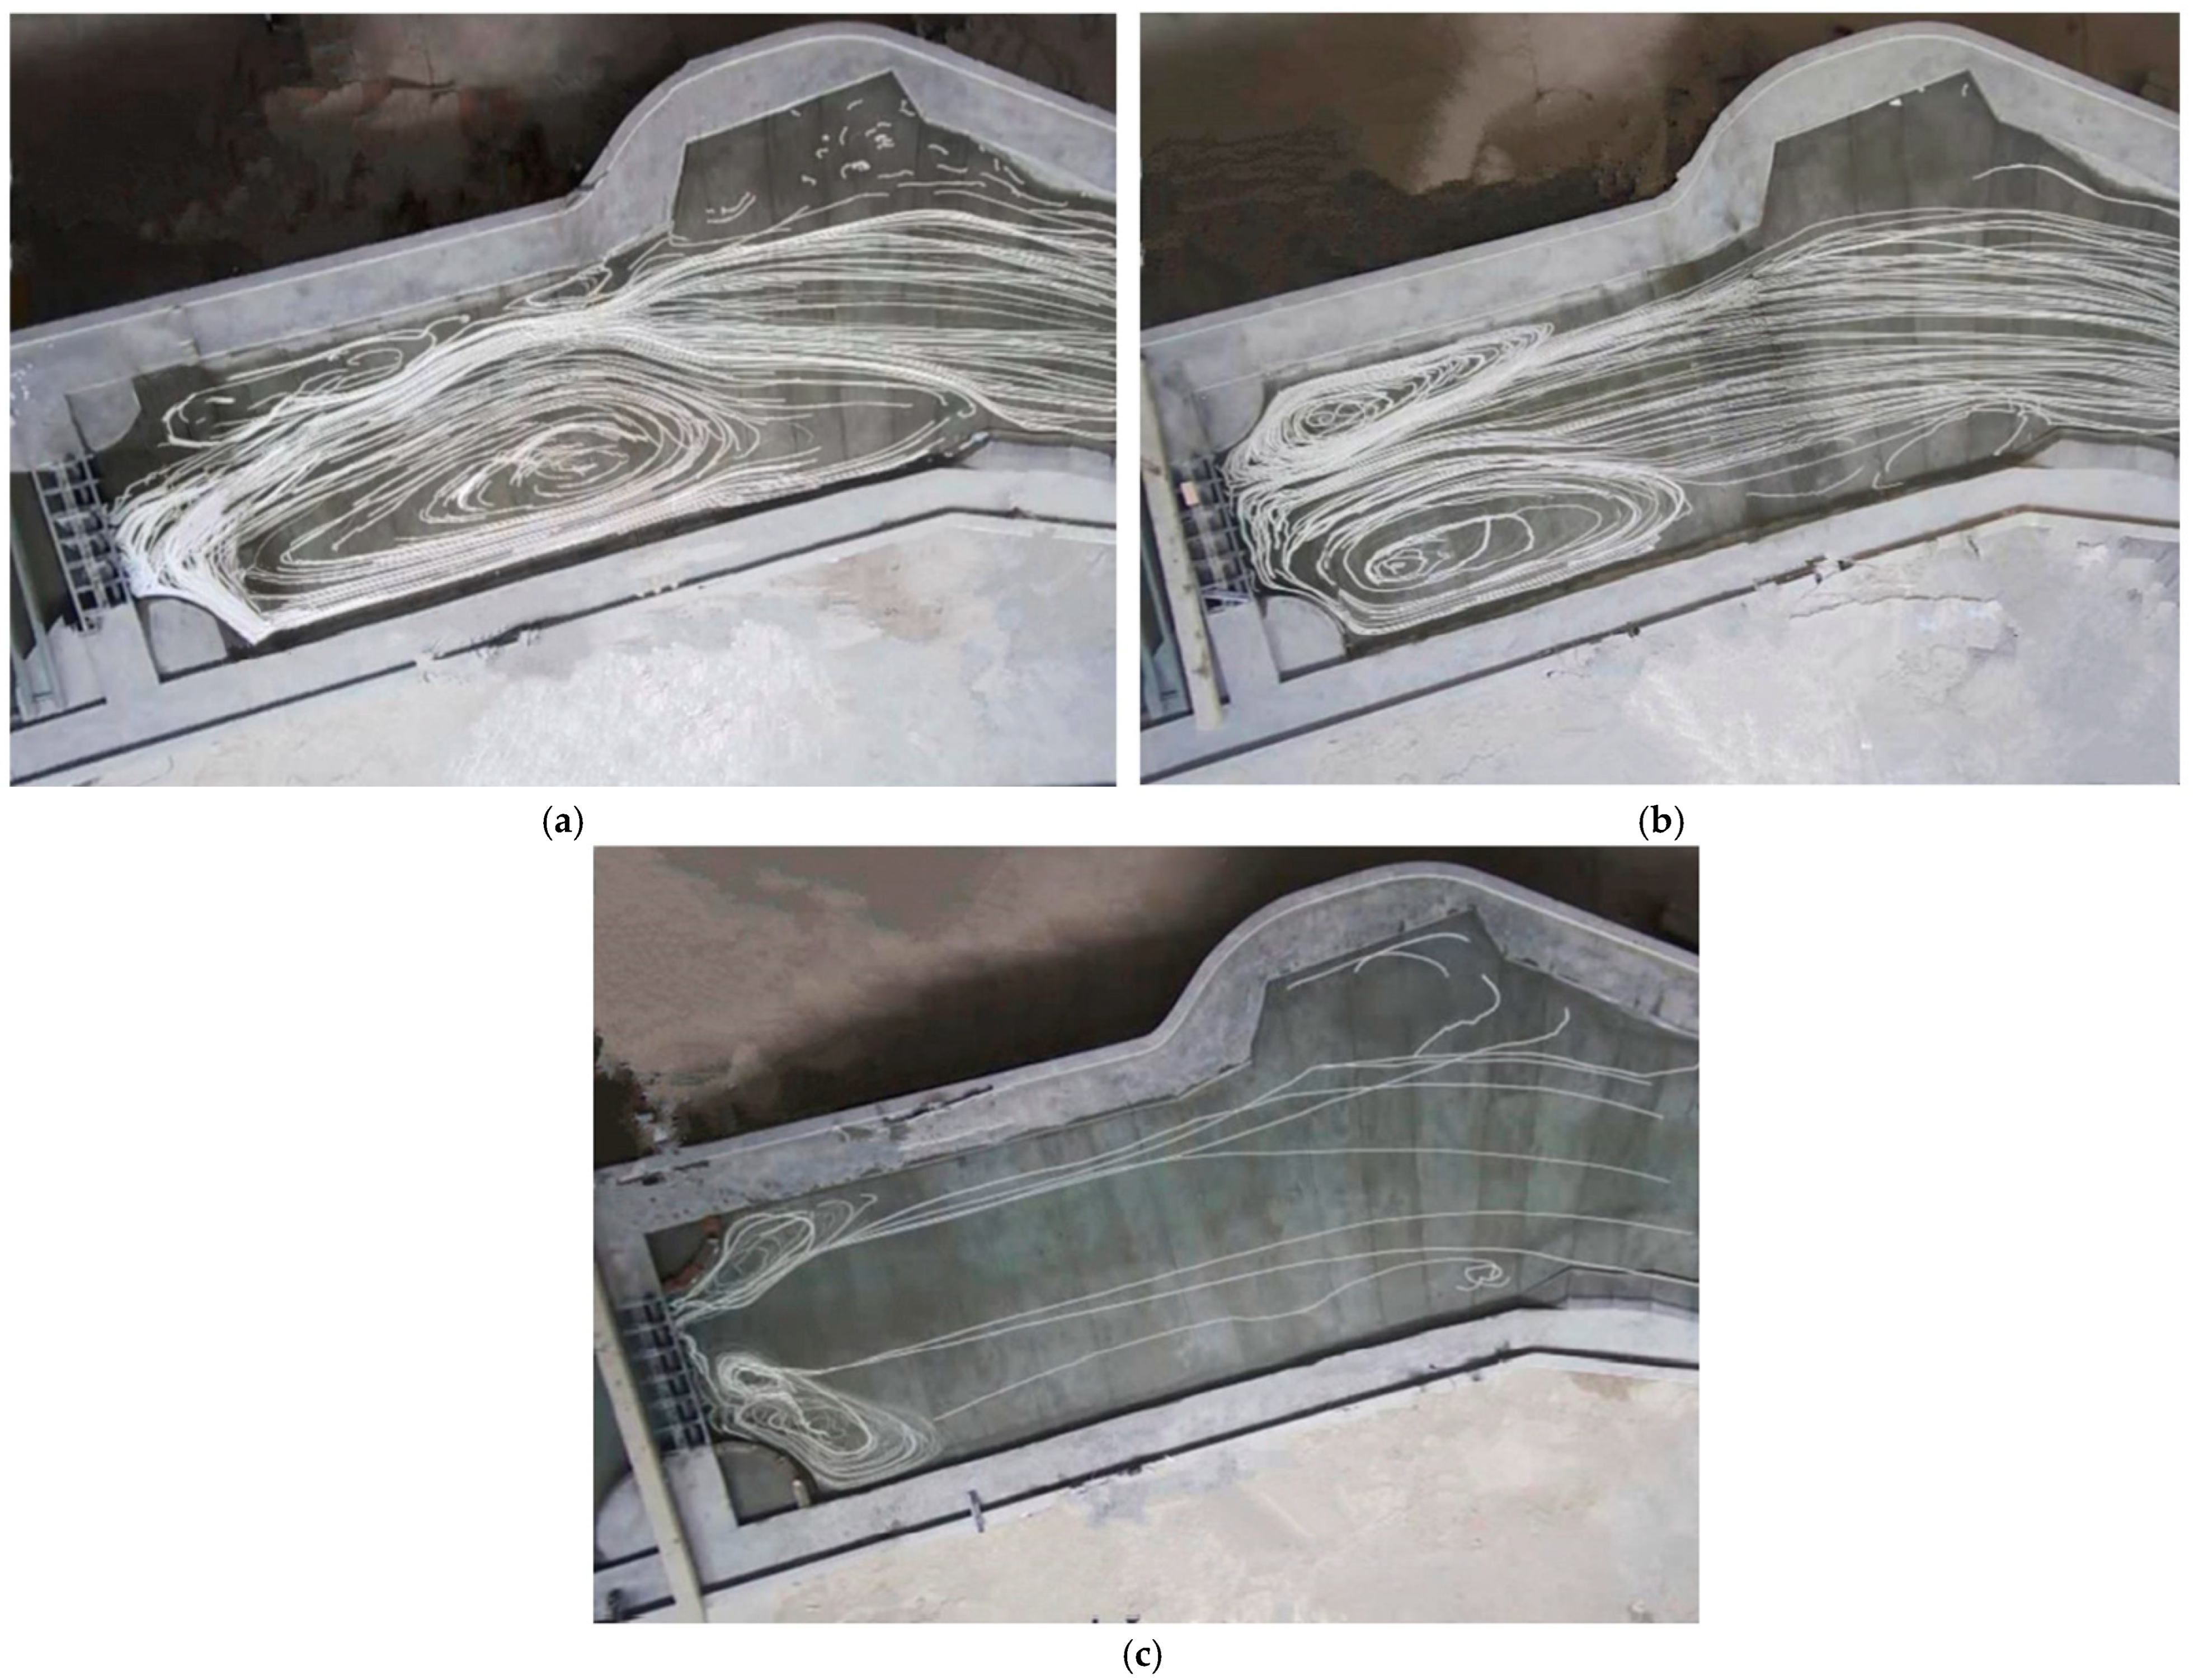
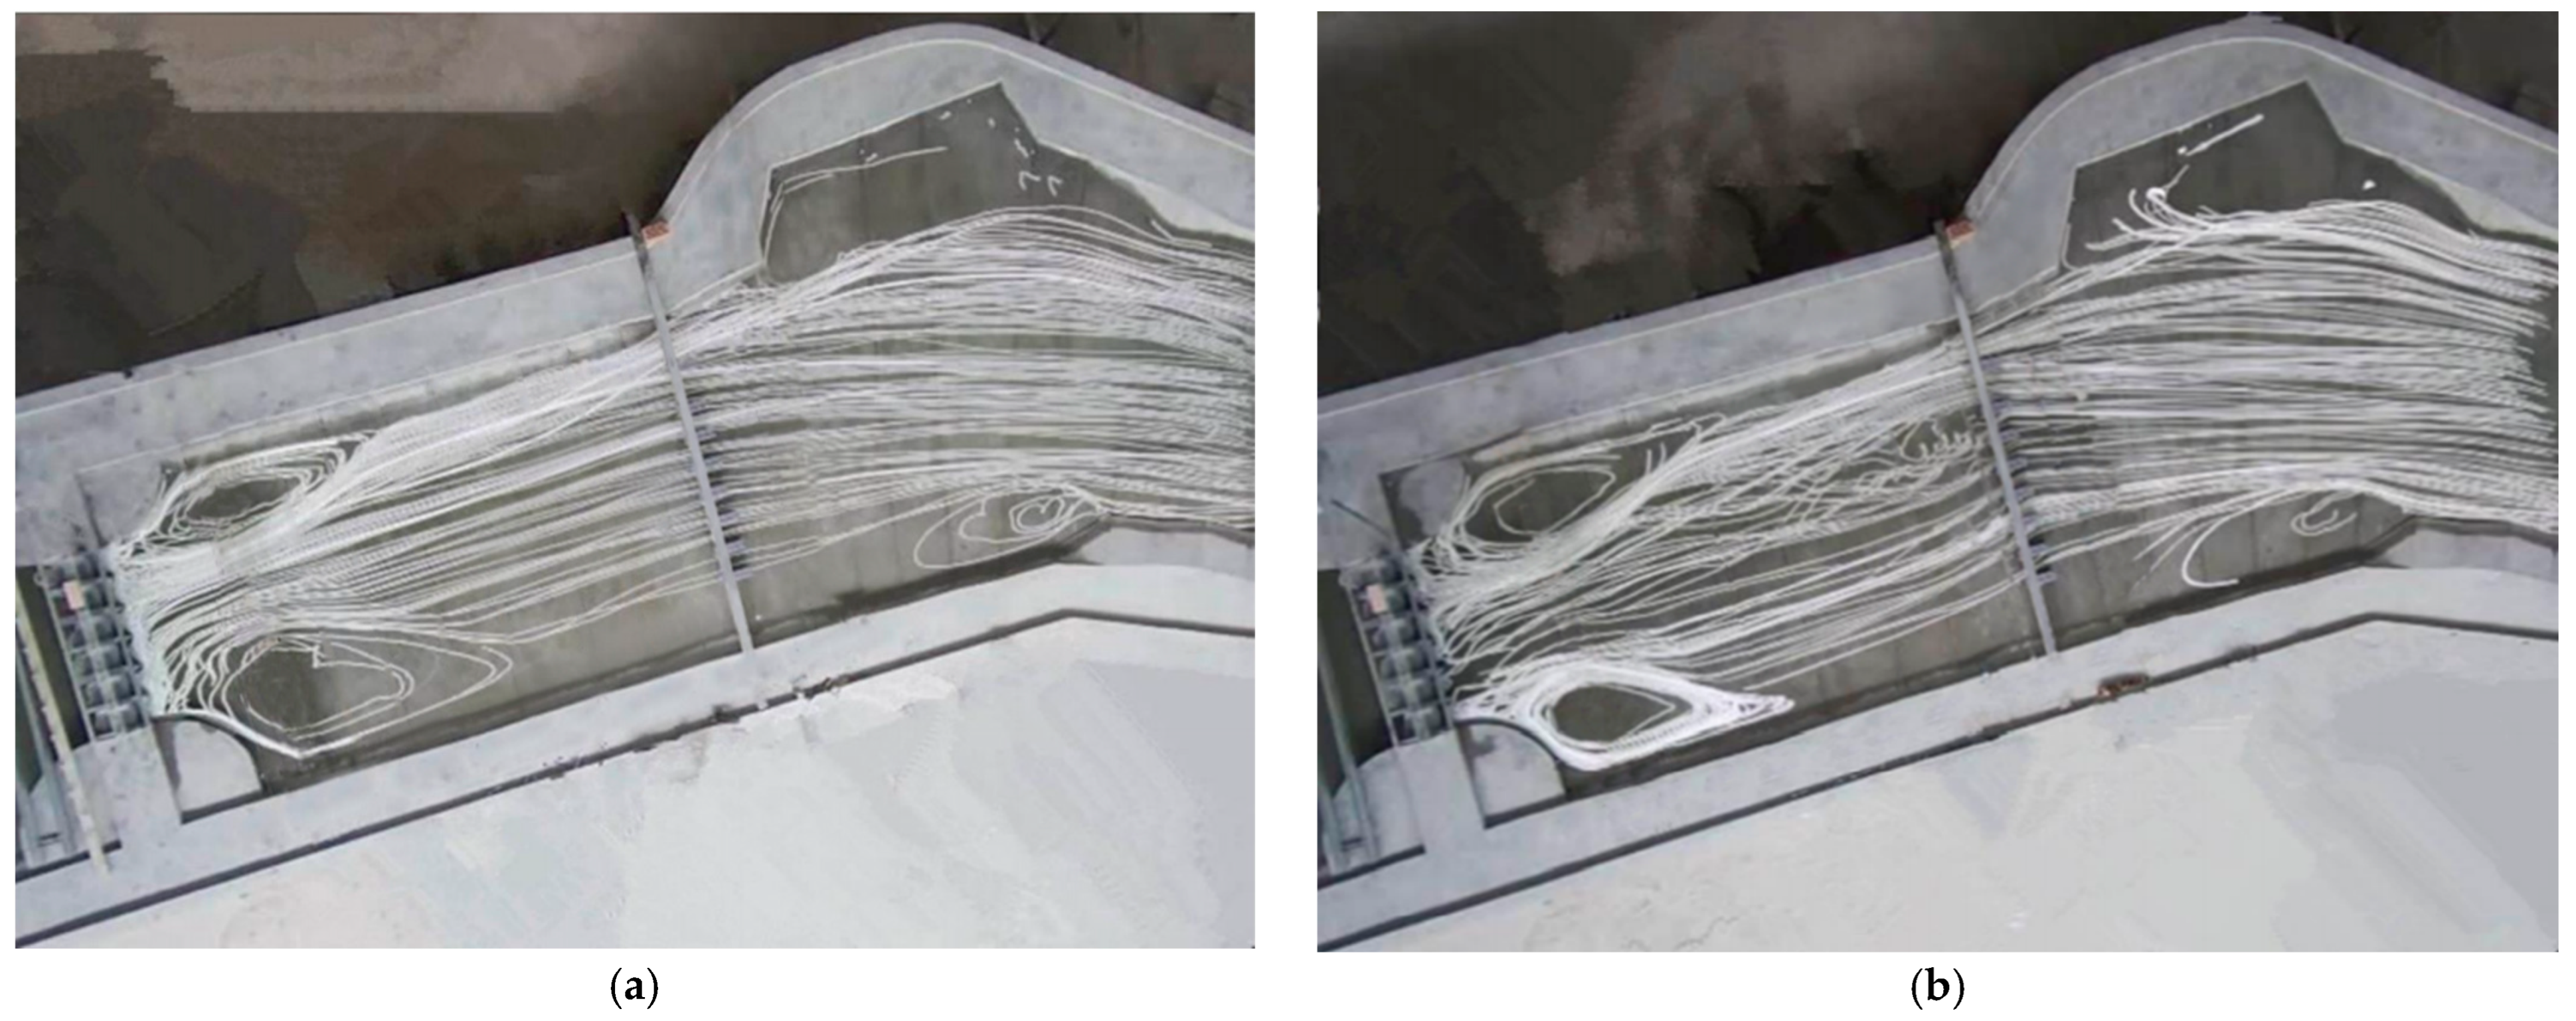
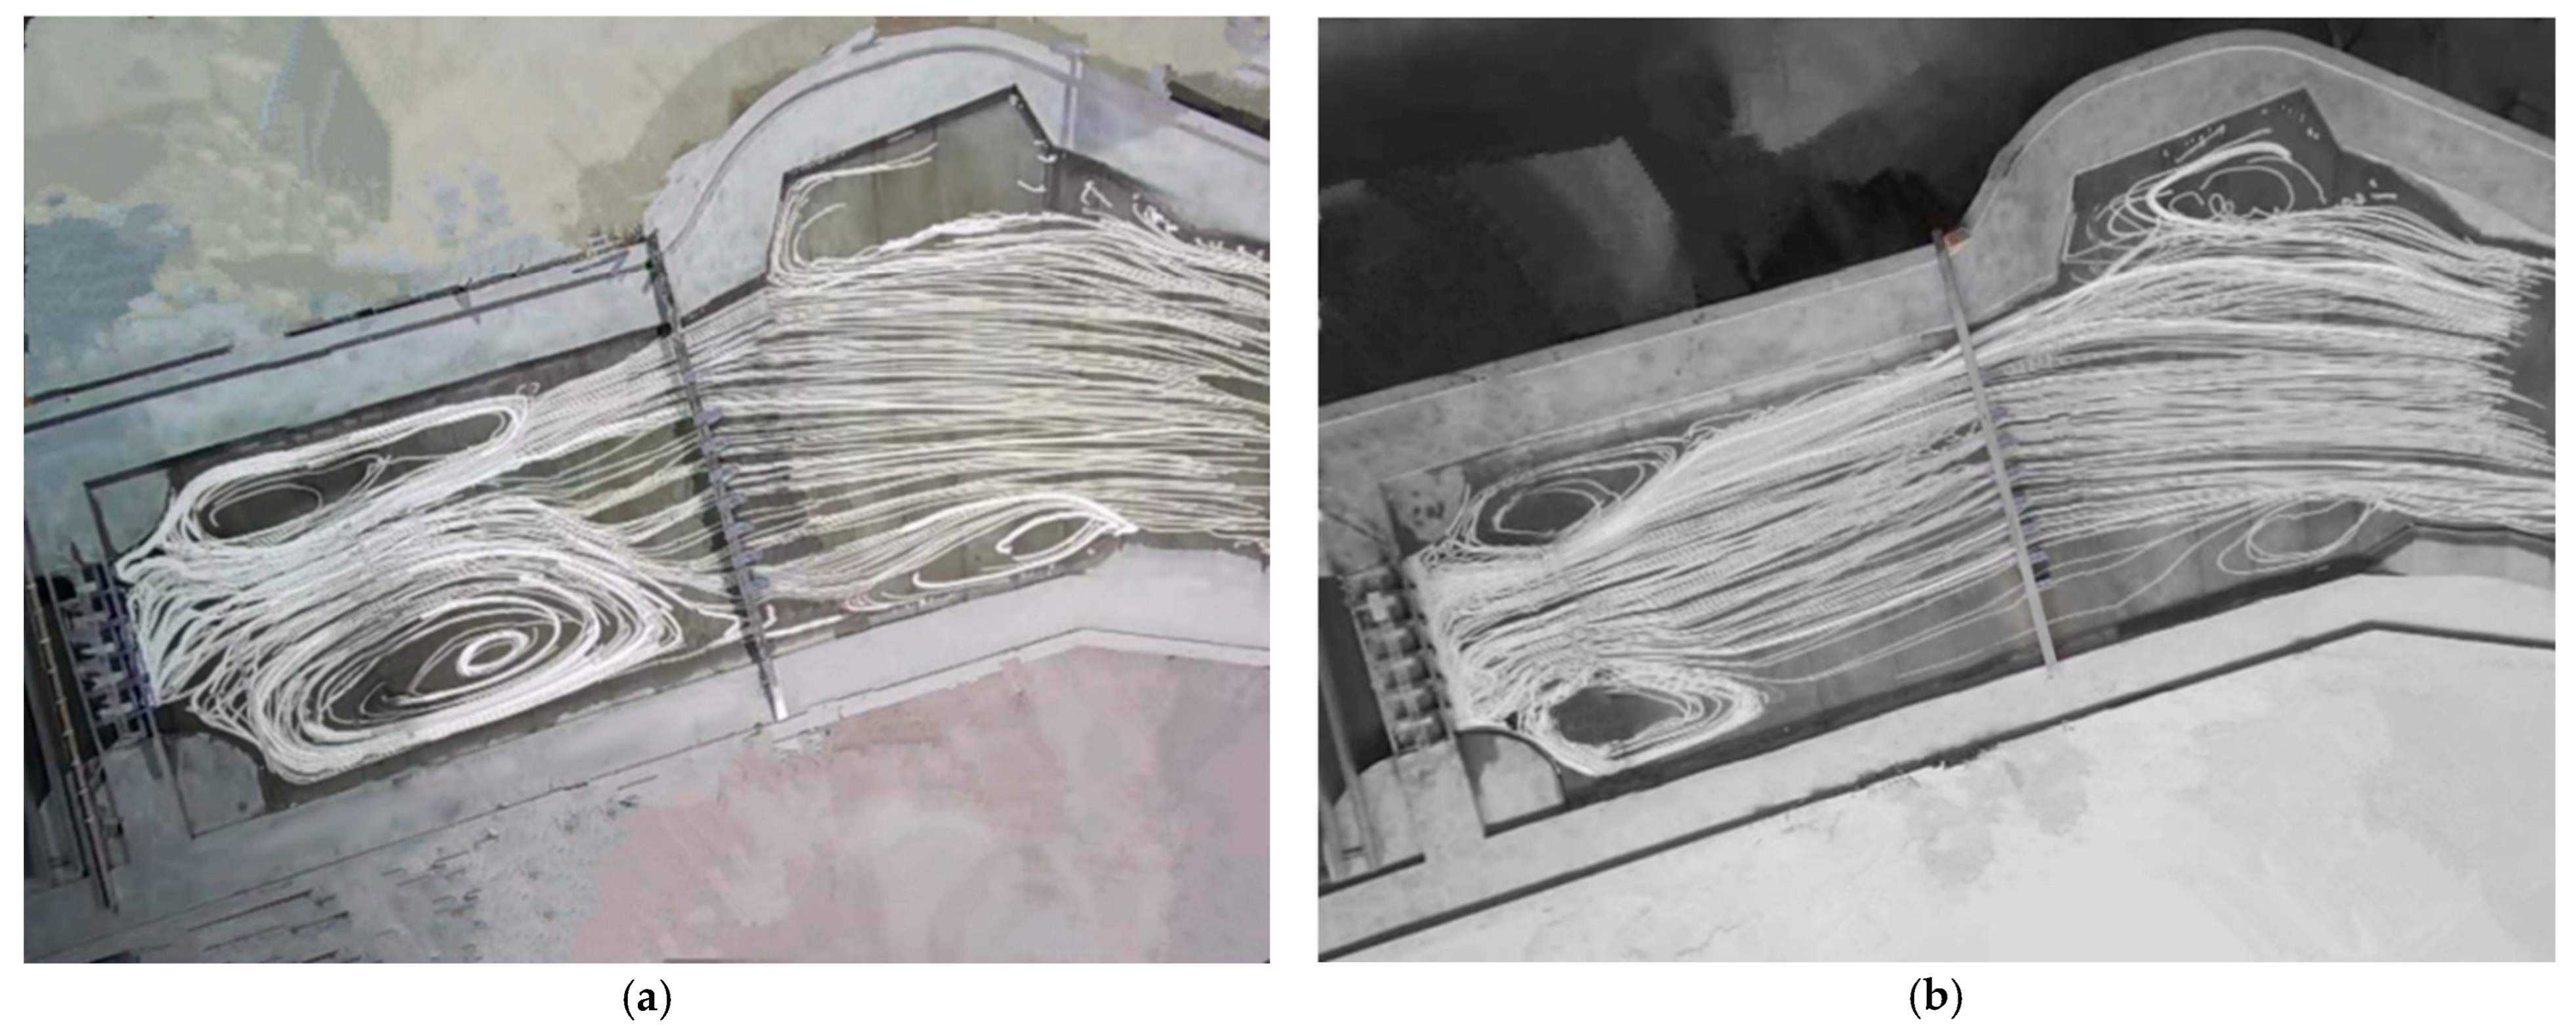
5.2. Existing Reservoir Flow Patterns

The reservoir sedimentation is intrinsically dependent upon the flow patterns. One of the major tasks in the experiments is to delineate them at varying flow rates, a prerequisite for laying out the guide vanes. Figure 12 shows the surface water trajectories for the cases.
In case 1, the relatively uniform flow gradually converges downstream of the bend, forming a narrow, jet like mainstream that runs along the right bank. Driven by this main current, a large zone of counterclockwise circulations is generated to its left, occupying the overwhelming part of the reservoir in cross-section. The zone measures at maximum ~90 m in width and ~335 m in length. Close to the sluice along the right bank, there are also secondary thin zones of clockwise flow circulations. The flow pattern corresponds to openings 2, 3, and 4 in operation. Different gate combinations lead to slightly different flow patterns immediately upstream of the gates. However, the overall patterns remain.
With an increase in discharge (case 2), the main flow after the bend takes up a major part of the reservoir width and runs nearly centrally in cross-section. As a result, the large circulation zone that appears in case 1 becomes suppressed. Two zones of comparable sizes are instead formed close to the sluice. The left counterclockwise zone is somewhat larger than the right clockwise one: their length is 170 and 140 m, respectively. In case 3, the flow occupies virtually the whole reservoir width, while two zones of flow circulation remain in the corners, however much smaller.
Obviously, appreciable differences exist among the flow cases, exhibiting the influences from the river bend, reservoir bathymetry, and flow magnitude. At large flows (e.g., case 3), all the gates operate at large or full openings and the incoming suspended load is readily released through the sluice, with insignificant deposition.
In a circulation zone, the tangential velocity decreases towards its center and the velocity is generally low, which creates conditions for sediment deposition. Accordingly, prescribed by the frequent occurrences of low and medium inflows (e.g., cases 1 and 2), sediment becomes deposited on the left side of the reservoir. The laser-scanned bathymetry in 2015 (Figure 3) demonstrates a deeper streamwise channel, indicative of deposition to its right. The experimental findings corroborate in a qualitative manner the field deposition pattern.

5.3. Configurating Guide Vanes

The second aspect in the model tests is to outline and assign dimensions to the guide vanes. Because the sediment is efficiently flushed at high flows, the design is based on the low and medium flows (cases 1 and 2). With a number of test combinations and comparisons, it is decided that the cross-channel axis of the vane array is placed at X = 220 m, i.e., along the CS3 section, and the vane number is set to be seven with c = 10.0 m. The spacing between two neighboring vanes is so determined that their flow fields should not interfere much with each other. By trial and error, it is chosen that a = 10.0 m, b = 0.5 m, and the vane crest is put 2.0 m below the DRWS. The vane orientation (α) is a primary parameter that needs to be evaluated.
The first step is to find the acceptable α range (α ≥ 0). All the vanes are given the same angle. In the model, the vanes are installed in such a way that is easily adjustable to another angle. Figure 13 showcases the flow patterns in the presence of the vanes at α = 0° and 30° (case 2). At α = 0°, the vanes follow virtually the flow direction, and their effect is limited. With a step-up in α, they bend the flow in a more efficient way and the flow is more directed away from the right bank and towards the middle of the sluice. The two zones of flow circulations also become suppressed in size. The layout at α = 30° is, for example, more effective than the one at α = 20°. However, the α = 30° vanes generate local flow separations and moderate vortex wakes in the middle portion of the river. In consideration of potential deterioration at high discharges, the angle α = 30° is seemingly the upper limit of the vane arrangement.
The choice of α is a trade-off between attaining a favorable flow pattern in the reservoir and avoiding unacceptable risk of erosion around the vanes. In the second step, repeated tests show that α should preferably be in the range of 10–20°. For both cases, Figure 14 presents the resulting flow patterns at α = 15°. Obviously, the flow patterns are, in a noticeable manner, improved, with the flow directed towards the gates and the zones of circulation suppressed to much smaller dimensions. In case 1, for example, the left circulation zone shrinks from ~335 to ~195 m in length and from ~80 to ~45 m in width. In similar river studies, Odgaard [4] stated that the typical α range is 10–20° and the use of larger angles should be handled with caution.
At a given flow rate, the flow patterns are similar within the α = 10–20° range. It is not easy to discern which angle is more favorable. Limited by laboratory conditions, it is not possible to experiment with suspended load in the model. To be convincing in the choice of vane layout, sediment deposition (amount) should be taken into consideration, which is the task of numerical modeling.

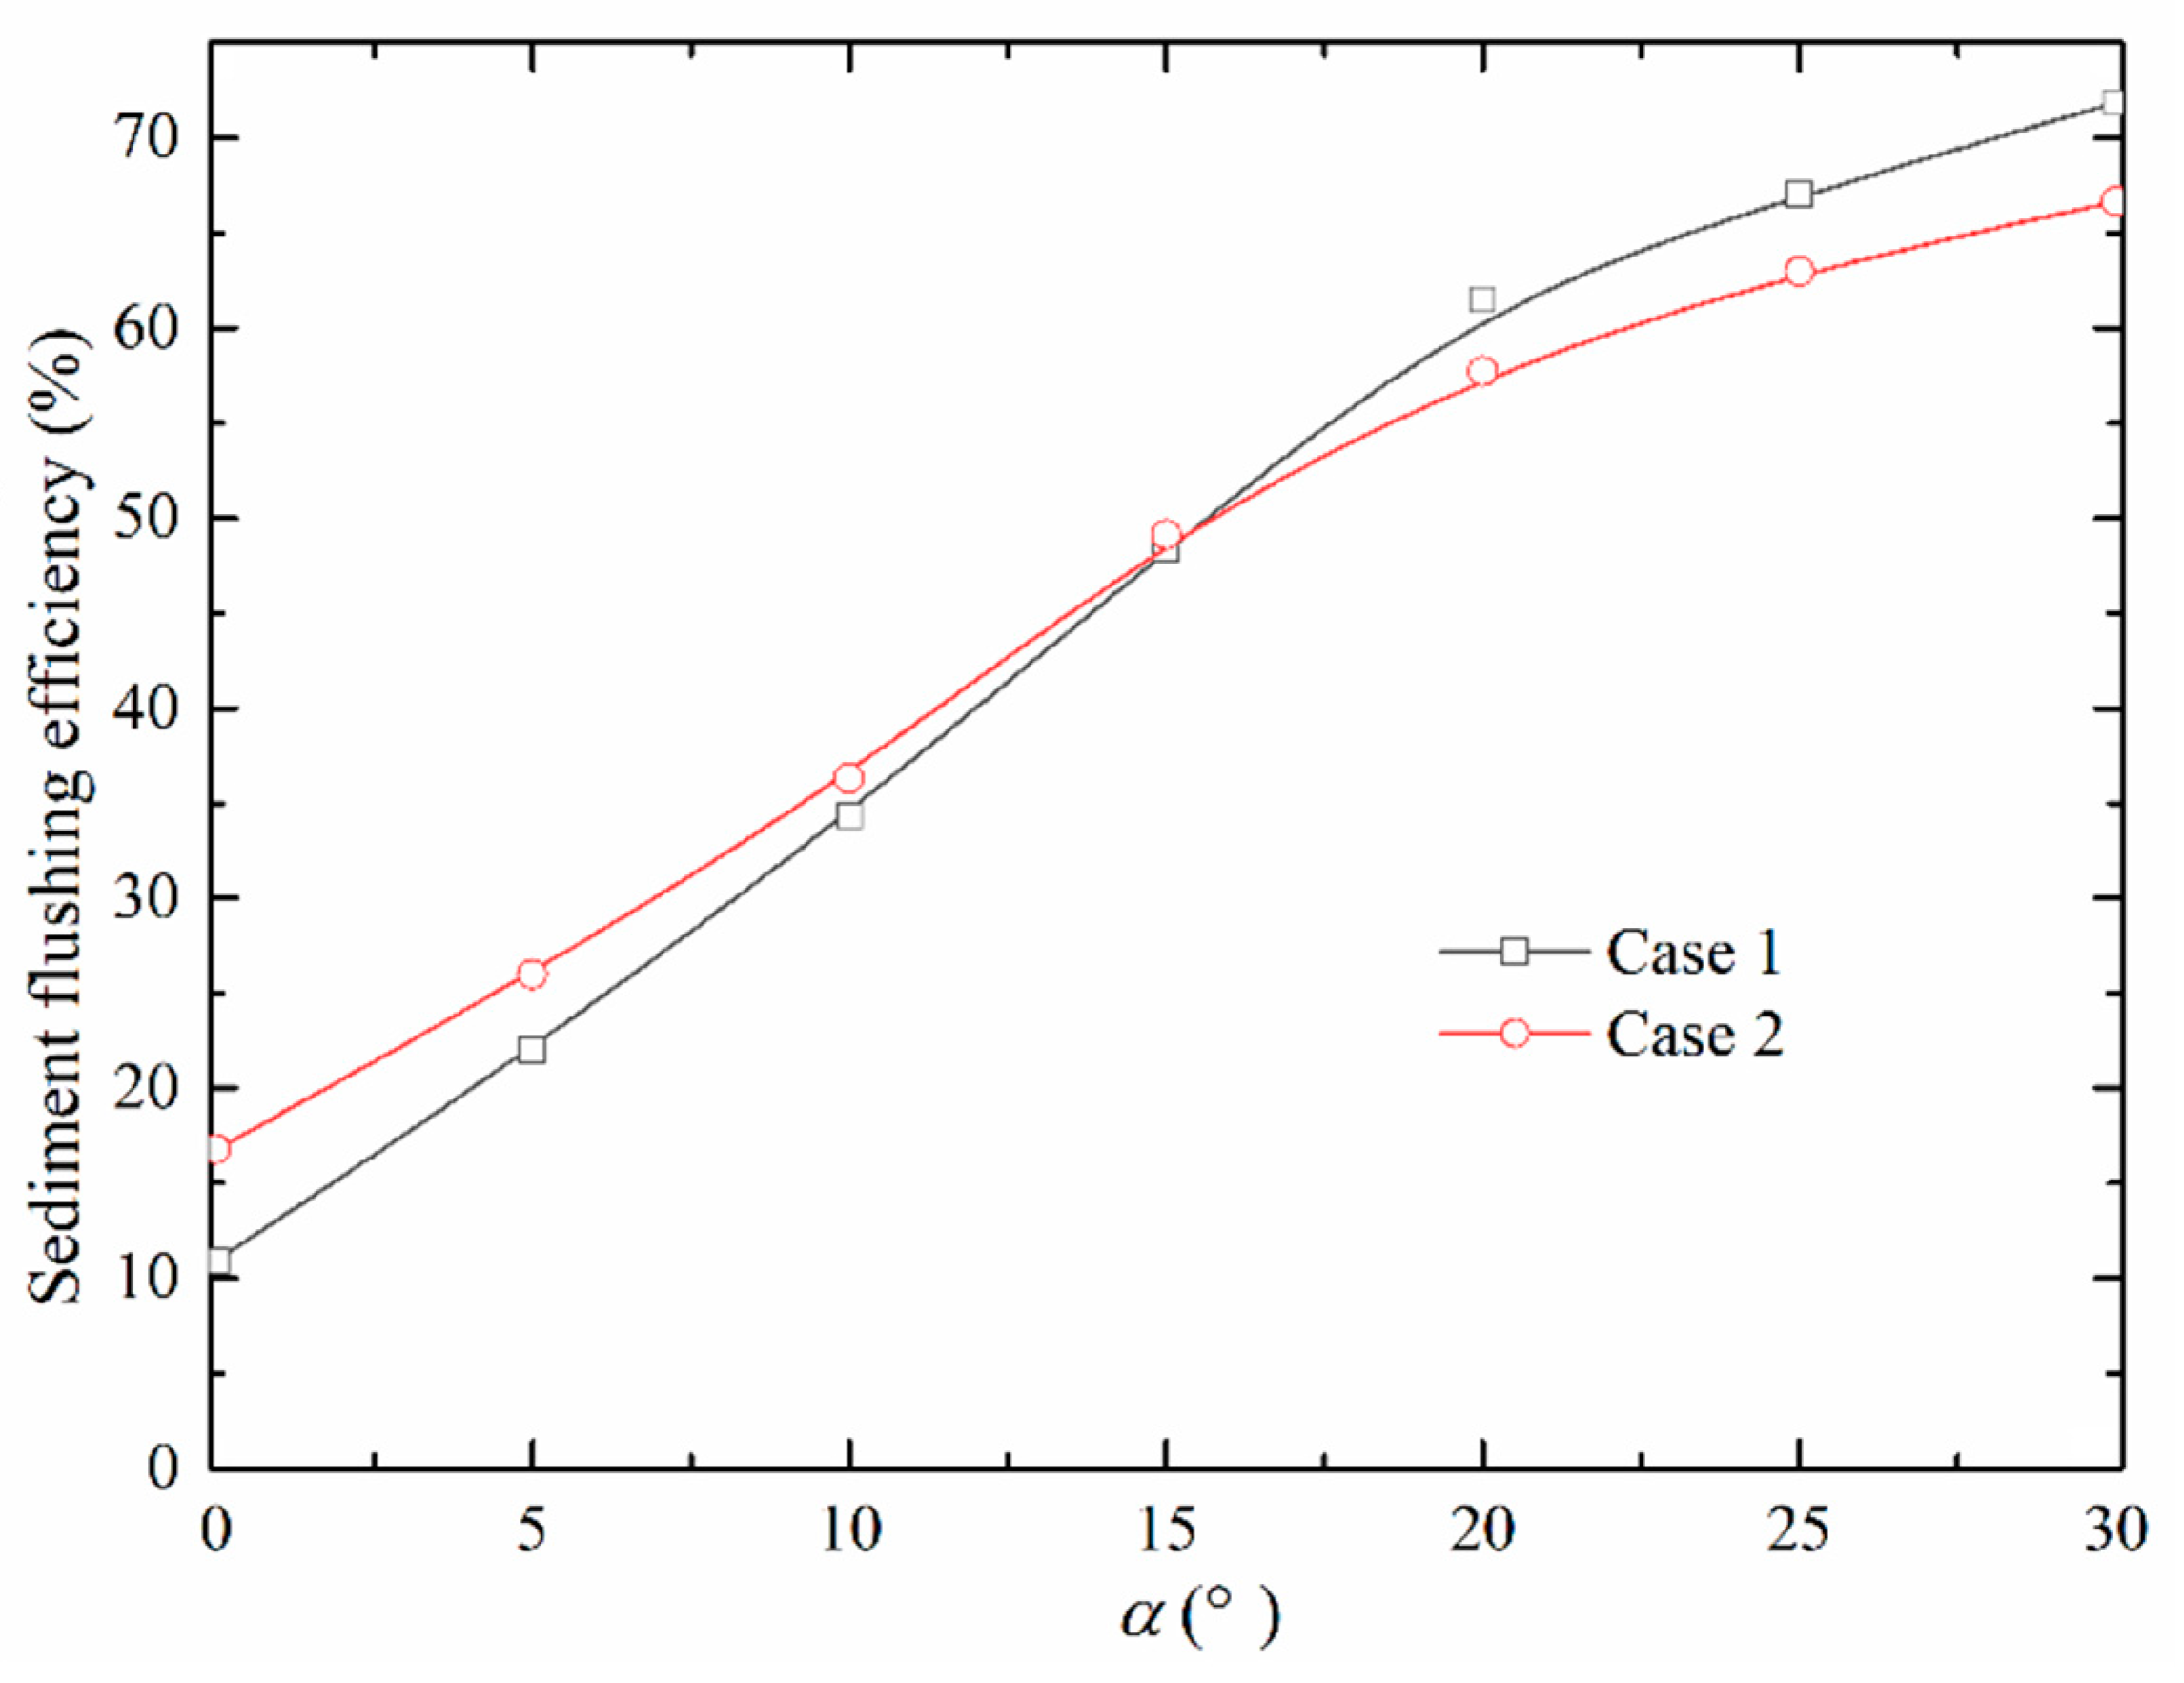
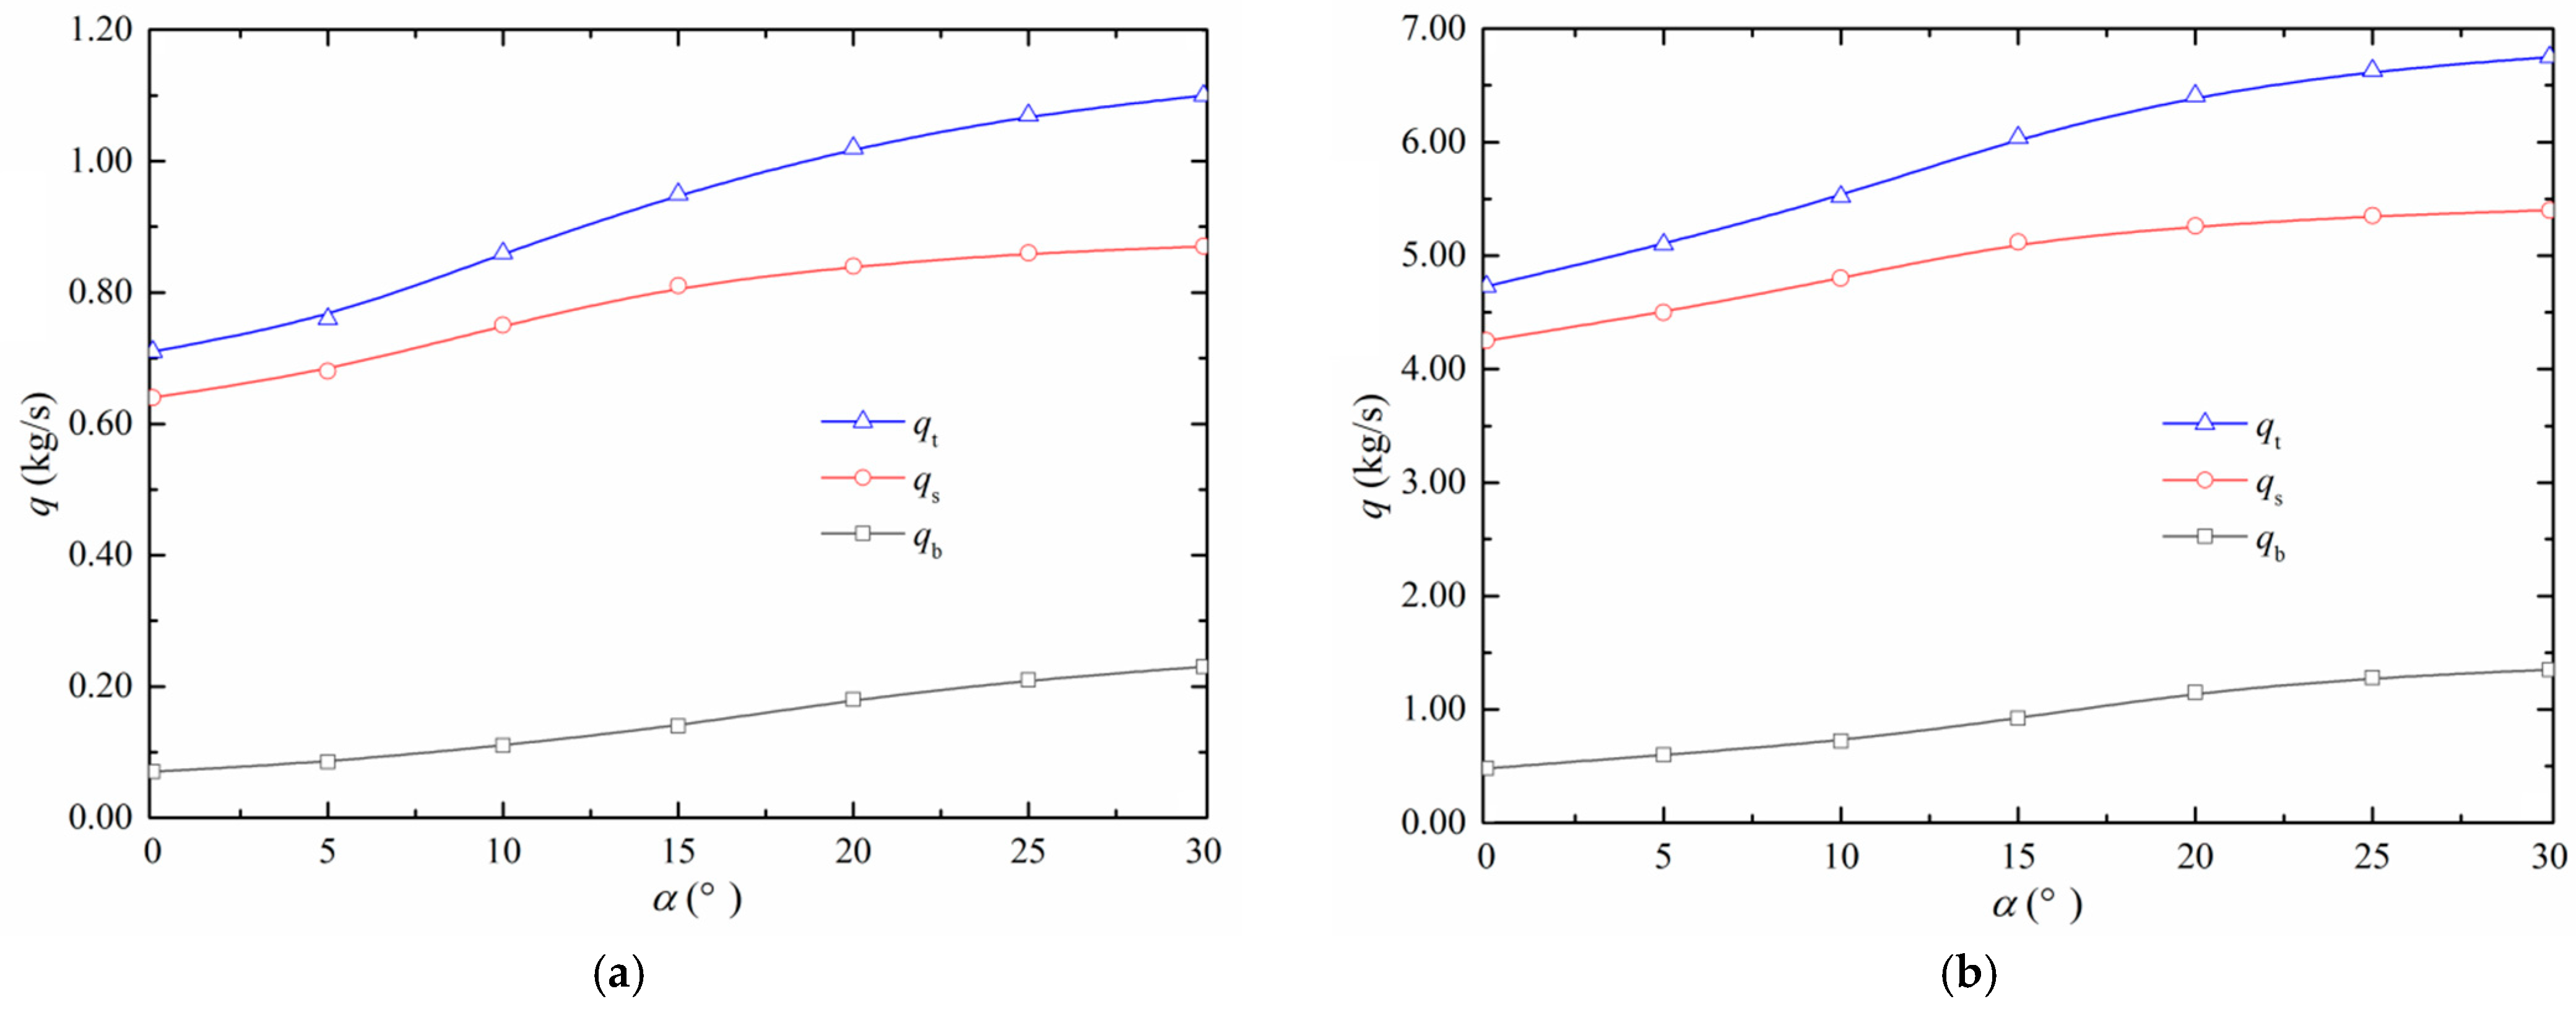
5.4. Sedimentation Patterns and Flushing Efficiency

To elucidate the erosion and deposition patterns, numerical simulations of the movable bed are performed, ranging from α = 0° to 30° at an interval of 5°. With the gradual change in orientation, changes in reservoir sedimentation are easily observed.
The modeling indicates that at α = 0–5°, the reservoir is still subjected to siltation, implying that the deposition on the left side is not removed. Local deposition, though not significant, occurs at the trailing edge of the vane. A similar pattern was also observed by Odgaard [4] through laboratory tests. The orientation is not effective.
At α = 15–20°, the results show that improvements induced by vanes become significant, in which the siltation in the reservoir is mitigated, especially in the previous circulation zones. Figure 15 compares, at α = 15°, the bed-elevation changes in the form of isolines. In either case, the results refer to the initial bed elevations minus the resulting bathymetry. The 2015 underwater laser-scanning data (Figure 3) are the initial condition. Positive values denote erosion and negative ones deposition. The vane-induced erosion is ~1 m at maximum, which is positive. The two flow circulation zones, with an appreciable reduction in size, as also demonstrated in the physical tests, shift from deposition to erosion, and the eroded depth is on average ~0.35 m. Local deposition in the vane vicinity is observed, which is somewhat enhanced with an increase in angle.
At α = 25–30°, the vanes generate similar reservoir erosion and deposition pattern, as at α = 15–20°. However, the flow seems to be overly deflected. As a result, deposition occurs behind the first vane nearest the right bank, with a thickness of ~1.20 m at maximum. The most undesirable is that flow separation and severe local scour take place around the four vanes on the right, which is unfavorable to the vane foundation and stability. The situation is even checked at the high river discharge (case 3), showing that the trend is enhanced and becomes more obvious, which is undesirable.
The sediment flushing efficiency, i.e., the ratio of bypassed to incoming sediment flux (qt) including both bed load (qb) and suspended load (qs), is an essential index in the context. For both cases, Figure 16 plots the qt changes as a function of α. The results show that the flushing efficiency, similar at low and medium flows, becomes enhanced with an increase in guide-vane angle. Up to about α = 20°, the increment is almost linear. At α = 30°, the flushing efficiency amounts to 65–70%.
Figure 17 shows, as a function of guide-vane angle, the flux of the bypassed sediment through the sluice structure. The incoming bed-load flux is limited in the reservoir, and the overwhelming portion is suspended load. It is essential that the guide vanes function satisfactorily for suspended sediment.
Considering the effectiveness of sediment mitigation and also the structural stability of the guide vanes, they are preferably not aligned more than α = 20° with the approaching flow direction. The layout of α = 15° is thus recommended, suitable at both medium and low discharges at which the flushing efficiency amounts to 50%. The designer should make sure that the vanes do not lose structural stability at high flow discharges.

6. Conclusions

In the bent reservoir with the multigate sluice, the unfavorable sedimentation is an issue of concern, especially at low and medium river discharges. To counteract the problem, installation of guide vanes is proposed. By virtue of field, physical, and numerical modeling, the study deals with its typical flow and sediment transport features. Both bed load and suspended load are modeled in the numerical simulations. The main conclusions are as follows.
In the reservoir, anticlockwise flow circulations are generated, whose formation is due to the river bend and the asymmetric gate operation. The circulation zones are characterized by low flow velocity, leading to significant sediment deposition, which is unfavorable for sluice operation.
The guide vanes modify the flow patterns and suppress the flow circulations in the reservoir. This deflects the flow away from the outer bank of the bends and mimics the straight reach. Its effectiveness is considerably affected by the angle of attack with the flow. The fixed-bed model study shows that the vane layout at a 10–20° angle with the approaching flow with the incoming flow generates favorable flow patterns.
Numerical modeling of the movable bed quantifies the efficiency of the guide vanes. Taking into consideration flushing efficiency and risk of local scouring at the vanes, a configuration of around 15° is recommended. The corresponding flushing efficiency is about 50%. Structural stability should be guaranteed at high flood discharges.
The hybrid approach enhances the understanding of flow and sediment features in the reservoir and provides reference for applications in similar situations. In the project, the same angle is used for all the vanes. If necessary, the angle of each vane can be adjusted separately to obtain more favorable flow conditions. Even curved vanes are an option.

Author Contributions

J.Y. and Q.X. conceptualized and formulated the research. J.C. managed the physical model tests and Q.X. performed the numerical simulations. Q.X. and J.Y. analyzed the results and wrote the manuscript, with comments from T.S.L. All authors have read and agreed to the published version of the manuscript.

Funding

As part of the research project within river flow and sediment transport, Q.X. is financed by the Chinese Scholarship Council (CSC, grant number 201700260184) and the Swedish StandUp for Energy project. The research was supervised by S.L. and J.Y.

Institutional Review Board Statement

Not applicable.

Informed Consent Statement

Not applicable.

Data Availability Statement

Data are available on request from the corresponding author.

Acknowledgments

J.Y. thanks Anders Ansell of KTH Royal Institute of Technology and Holger Ecke of Vattenfall R&D for assistance and coordination of diverse issues.

Conflicts of Interest

The authors declare no conflict of interest.

References

  1. Da Silva, A.M.F.; Yalin, M.S. Fluvial Processes, 2nd ed.; CRC Press, Taylor & Francis Group: London, UK, 2017. [Google Scholar]
  2. Robert, A. River Process—An Introduction to Fluvial Dynamics, 1st ed.; Routledge: London, UK, 2003. [Google Scholar]
  3. Chen, Y.; Yang, J.; Yu, J.; Fu, Z.; Chen, Q. Flow expansion and deflection downstream of a symmetric multi-gate sluice structure. KSCE J. Civ. Eng. 2020, 24, 471–482. [Google Scholar] [CrossRef]
  4. Odgaard, A.J. River Training and Sediment Management with Submerged Vanes-American Society of Civil Engineers; ASCE Press: Reston, VA, USA, 2009. [Google Scholar]
  5. Lee, B.O.; Fitzpatrick, F.A.; Hoopes, J.A. Effectiveness of submerged vanes for stabilizing streamside bluffs. J. Hydraul. Eng. 2021, 147, 04020093. [Google Scholar] [CrossRef]
  6. Siefken, S.; Ettema, R.; Posner, A.; Baird, D.; Holste, N.; Dombroski, D.E.; Padilla, R.S. Optimal configuration of rock Vanes and bendway weirs for river bends: Numerical-model insights. J. Hydraul. Eng. 2021, 147, 04021013. [Google Scholar] [CrossRef]
  7. Marelius, F. Vane Applications and Vane Induced Flow. Ph.D. Thesis, KTH-Royal Institute of Technology, Stockholm, Sweden, 2001. [Google Scholar]
  8. Wang, Y.; Odgaard, A.J.; Melville, B.W.; Jain, S.C. Sediment control at water intakes. J. Hydraul. Eng. 1996, 122, 353–356. [Google Scholar] [CrossRef]
  9. Odgaard, A.J.; Kennedy, J.F. River-bend bank protection by submerged vanes. J. Hydraul. Eng. 1983, 109, 1161–1173. [Google Scholar] [CrossRef]
  10. Odgaard, A.J. River Management with Submerged Vanes. In River System Analysis and Management; Springer: Singapore, 2017; pp. 251–261. [Google Scholar]
  11. Ouyang, H.-T.; Lai, J.-S. Design optimization of a submerged vane with streamlined profile for sediment management in rivers. J. Mar. Sci. Technol. 2013, 21, 325–332. [Google Scholar]
  12. Odgaard, A.J.; Wang, Y. Sediment management with submerged vanes. I: Theory. J. Hydraul. Eng. 1991, 117, 267. [Google Scholar] [CrossRef]
  13. Odgaard, A.J.; Wang, Y. Sediment management with submerged vanes. II: Applications. J. Hydraul. Eng. 1991, 117, 284–302. [Google Scholar] [CrossRef]
  14. Ouyang, H.-T. Investigation on the dimensions and shape of a submerged vane for sediment management in alluvial channels. J. Hydraul. Eng. 2009, 135, 209–217. [Google Scholar] [CrossRef]
  15. Ouyang, H.-T.; Lai, J.-S.; Yu, H.; Lu, C.-H. Interaction between submerged vanes for sediment management. J. Hydraul. Res. 2008, 46, 620–627. [Google Scholar] [CrossRef]
  16. Endreny, T.; Soulman, M. Hydraulic analysis of river training cross-vanes as part of post-restoration monitoring. Hydrol. Earth Syst. Sci. 2011, 15, 2119–2126. [Google Scholar] [CrossRef] [Green Version]
  17. Radspinner, R.; Diplas, P.; Lightbody, A.F.; Sotiropoulos, F. River training and ecological enhancement potential using in-stream structures. J. Hydraul. Eng. 2010, 136, 967–980. [Google Scholar] [CrossRef]
  18. Bhuiyan, F.; Hey, R.D.; Wormleaton, P.R. Bank-attached vanes for bank erosion control and restoration of river meanders. J. Hydraul. Eng. 2010, 136, 583–596. [Google Scholar] [CrossRef]
  19. Han, S.; Ramamurthy, A.; Biron, P.M. Characteristics of flow around open channel 90° bends with vanes. J. Irrig. Drain. Eng. 2011, 137, 668–676. [Google Scholar] [CrossRef]
  20. Rodríguez-Amaya, C.; Durán-Ariza, A.; Duarte-Méndez, S. Submerged vane technology in Colombia: Five representative projects. Water 2020, 12, 984. [Google Scholar] [CrossRef]
  21. Aminian, P.; Ahmadi, A.; Emamgholizadeh, S. Experimental investigation on the deviated sediment and flow to sediment bypass tunnels (SBTs) using submerged plates. J. Hydraul. Struct. 2019, 5, 18–31. [Google Scholar]
  22. Beiramipour, S.; Qaderi, K.; Rahimpour, M.; Ahmadi, M.M.; Kantoush, S.A. Effect of Submerged Vanes in front of Circular Reservoir Intake on Sediment Flushing Cone. Proc. Inst. Civ. Eng. Water Manag. 2021, 174, 252–266. [Google Scholar] [CrossRef]
  23. Türkben, A.B. Experimental Study of Submerged Vanes in Intakes under Sediment Feeding Conditions. E3S Web Conf. 2018, 40, 03016. [Google Scholar] [CrossRef]
  24. Barani, G.A.; Sardo, M.S. Experimental investigation of submerged vanes’ shape effect on river-bend stability. J. Hydraul. Struct. 2013, 1, 37–43. [Google Scholar]
  25. Sharma, H.; Jain, B.; Ahmad, Z. Optimization of submerged vane parameters. Indian Acad. Sci. 2016, 41, 327–336. [Google Scholar] [CrossRef]
  26. Odgaard, A.J.; Spoljaric, A. Sediment Control by Submerged Vanes. Design basis. In River Meandering; American Geophysical Union: Washington, DC, USA, 1989; Volume 12, pp. 127–151. [Google Scholar]
  27. Wang, Z.-Y.; Lee, J.H.; Melching, C.S. River Dynamics and Integrated River Management; Springer Science & Business Media: Berlin, Germany, 2014. [Google Scholar]
  28. Giglou, A.N.; Mccorquodale, J.A.; Solari, L. Numerical study on the effect of the spur dikes on sedimentation pattern. Ain Shams Eng. J. 2018, 9, 2057–2066. [Google Scholar] [CrossRef]
  29. Ezzeldin, R.M. Numerical and experimental investigation for the effect of permeability of spur dikes on local scour. J. Hydroinform. 2019, 21, 335–342. [Google Scholar] [CrossRef]
  30. Shih, D.-S.; Lai, T.-Y. Study of Bend Scour and Spur Protection for Fengshan River of Taiwan. In Proceedings of the World Environmental and Water Resources Congress 2020: Hydraulics, Waterways, and Water Distribution Systems Analysis, Henderson, NV, USA, 17–21 May 2020; pp. 220–224. [Google Scholar]
  31. Hemmati, M.; Daraby, P. Erosion and sedimentation patterns associated with restoration structures of bendway weirs. J. Hydro-Environ. Res. 2019, 22, 19–28. [Google Scholar] [CrossRef]
  32. Siefken, S. Computational Fluid Dynamics Models of Rio Grande Bends Fitted with Rock Vanes or Bendway Weirs. Master’s Thesis, Colorado State University, Fort Collins, CO, USA, 2019. [Google Scholar]
  33. Oberhagemann, K.; Haque, A.; Thompson, A. A century of riverbank protection and river training in Bangladesh. Water 2020, 12, 3018. [Google Scholar] [CrossRef]
  34. Van Vuren, S.; Paarlberg, A.; Havinga, H. The aftermath of “Room for the River” and restoration works: Coping with excessive maintenance dredging. J. Hydro-Environ. Res. 2015, 9, 172–186. [Google Scholar] [CrossRef]
  35. Heller, V. Scale effects in physical hydraulic engineering models. J. Hydraul. Res. 2011, 49, 293–306. [Google Scholar] [CrossRef]
  36. Chadwick, A.; Morfett, J.; Borthwick, M. Hydraulics in Civil and Environmental Engineering, 5th ed.; CRC Press: Boca Raton, FL, USA, 2013. [Google Scholar]
  37. Peakall, J.; Warburton, J. Surface tension in small hydraulic river models—The significance of the Weber number. J. Hydrol. 1996, 35, 199–212. [Google Scholar]
  38. Maxwell, W.; Hall, C.; Weggel, J. Surface tension in Froude models. J. Hydraul. Div. 1969, 95, 677–704. [Google Scholar] [CrossRef]
  39. Deltares. Delft3D-Flow, User Manual; Deltares: Delft, The Netherlands, 2014. [Google Scholar]
  40. Mike21. Sediment Transport and Morphological Modelling—User Guide; DHI Water and Environment: Horsholm, Denmark, 2007. [Google Scholar]
  41. Telemac-Mascaret. TELEMAC-2D User Manual; EDF: Paris, France, 2007. [Google Scholar]
  42. Hu, P.; Lei, Y.; Han, J.; Cao, Z.; Liu, H.; He, Z. Computationally efficient modeling of hydro-sediment-morphodynamic processes using a hybrid local time step/global maximum time step. Adv. Water Resour. 2019, 127, 26–38. [Google Scholar] [CrossRef]
  43. Hu, P.; Lyu, B.; Li, J.; Sun, M.; Li, W.; Cao, Z. A new two-phase shallow water hydro-sediment-morphodynamic model based on the HLLC solver and the hybrid LTS/GMaTS approach. Adv. Water Resour. 2022, 166, 104254. [Google Scholar] [CrossRef]
  44. Van Rijn, L.C. Principles of Sediment Transport in Rivers, Estuaries and Coastal Seas; Aqua Publications: Amsterdam, The Netherlands, 1993. [Google Scholar]
  45. Baar, A.W.; Albernaz, M.B.; van Dijk, W.M.; Kleinhans, M.G. Critical dependence of morphodynamic models of fluvial and tidal systems on empirical downslope sediment transport. Nat. Commun. 2019, 10, 4903. [Google Scholar] [CrossRef] [PubMed]
  46. Rinaldi, M.; Mengoni, B.; Luppi, L.; Darby, S.E.; Mosselman, E. Numerical simulation of hydrodynamics and bank erosion in a river bend. Water Resour. Res. 2008, 44, W09428. [Google Scholar] [CrossRef]
  47. Yang, S.-Q. Formula for sediment transport in rivers, estuaries, and coastal waters. J. Hydraul. Eng. 2005, 131, 968–979. [Google Scholar] [CrossRef]
  48. Olsen, N.R. Two-dimensional numerical modelling of flushing processes in water reservoirs. J. Hydraul. Res. 1999, 37, 3–16. [Google Scholar] [CrossRef]
  49. Partheniades, E. Erosion and deposition of cohesive soils. J. Hydraul. Div. 1965, 91, 105–139. [Google Scholar] [CrossRef]
  50. Partheniades, E. Turbidity and Cohesive Sediment Dynamics. In Marine Interfaces Ecohydrodynamics; Elsevier Oceanography Series; Elsevier: Amsterdam, The Netherlands, 1986; Volume 42, pp. 515–550. [Google Scholar]
Figure 1. Sluice structure centrally placed in the river course, with six bulkhead gates and connecting abutment on each side (looking downstream).
Applsci 12 09144 g001
Figure 2. Layout of the sluice structure. (a) cross-sectional view (looking downstream); (b) plan view. Including all the piers, the concrete sluice structure is 60 m long.
Applsci 12 09144 g002
Figure 3. Reservoir and tailwater bathymetry (based on the 2015 underwater laser scanning).
Applsci 12 09144 g003
Figure 4. Hydrological data at the sluice site. (a) Multiyear averaged flow discharge; (b) flow frequency at a 10 m3/s interval; (c) cumulative flow frequency.
Applsci 12 09144 g004aApplsci 12 09144 g004b
Figure 5. Grain-size distribution of sediment, with D = 0.002–0.90 mm and D50 = 0.014 mm.
Applsci 12 09144 g005
Figure 6. Schematic layout of guide vanes, placed in an array downstream of the bend. (a) Plan view; (b) cross-sectional view, looking downstream.
Applsci 12 09144 g006
Figure 7. Laboratory model of the sluice with six bulkhead gates constructed in scale λ = 1:40, with a 30 m length measured along the river centerline and a 4 m width in cross-section. (a) View from the right bank; (b) sluice structure, looking downstream.
Applsci 12 09144 g007
Figure 8. Experimental layout, with an inlet honeycomb to calm the inflow and an outlet flip gate to regulate the tailwater at a given flow rate. Near the left bank at each of CS1–CS6, a point gauge monitors the water level, a velocimeter records flow velocities, a 90° sharp-crested weir measures flow rates, and a PIV system, mounted under the roof, captures the surface flow velocity across the model.
Applsci 12 09144 g008
Figure 9. Meshed computational domain. The domain is covered by 15,350 cells, comprising 307 streamwise and 50 transverse.
Applsci 12 09144 g009
Figure 10. Comparisons of the QZ relationship among physical, numerical, and prototype measurement results.
Applsci 12 09144 g010
Figure 11. Prototype Z comparisons among physical model, numerical model, and field data. (a) case 1; (b) case 2.
Applsci 12 09144 g011
Figure 12. Flow patterns upstream of the sluice structure: (a) case 1; (b) case 2; (c) case 3. The flow runs from right to left.
Applsci 12 09144 g012
Figure 13. Modified flow patterns with the guide vanes (case 2). (a) α = 0°; (b) α = 30°.
Applsci 12 09144 g013
Figure 14. Modified flow patterns in the presence of guide vanes at α = 15°. The water flows from right to left. (a) case 1; (b) case 2.
Applsci 12 09144 g014
Figure 15. Riverbed changes in the reservoir with the installation of seven guide vanes, all aligned at α = 15°. (a) case 1; (b) case 2. Compared with the 2015 river bathymetrical data, a positive value denotes erosion and a negative one deposition.
Applsci 12 09144 g015
Figure 16. Sediment flushing efficiency as a function of guide-vane angle.
Applsci 12 09144 g016
Figure 17. Bypassed sediment flux through the sluice gates. (a) case 1; (b) case 2. The dominating portion of sediment is suspended load.
Applsci 12 09144 g017
Table 1. Typical flow and sediment cases of the sluice structure.
CaseQ (m3/s)S (kg/m3)Zu (m)Zd (m)e (m)B (=N × bg) (m)
1320.0267.756.490.524 (=3 × 8)
21350.0407.977.752.048 (=6 × 8)
33800.12810.289.734.048 (=6 × 8)
Table 2. Location of cross-sections CS1–CS6, measured along the river centerline.
Cross-SectionCS6CS5Y AxisCS4CS3CS2CS1
L0 (m)2801000110220330700
Table 3. Parameter values adopted in the model.
ParameterData RangeSource
ω s (m/s)0.0002Field measurements
τ d (N/m2)0.06–0.10[49]
τ e (N/m2)0.10–0.20[50]
M (kg/m2s)0.0002–0.02[50]
γ 0 (kg/m3)1460Field measurements
Publisher’s Note: MDPI stays neutral with regard to jurisdictional claims in published maps and institutional affiliations.

