1. Introduction
The Association of Southeast Asian Nations (ASEAN) is an economic union comprising 10 member countries (Malaysia, Indonesia, Brunei-Darussalam, Singapore, Cambodia, Laos PDR, Myanmar, the Philippines, Thailand, and Vietnam) in Southeast Asia [
1]. The liberalized electricity markets have been central to achieving efficiency gains, increasing competitiveness, providing high standards of service, reducing electricity prices and carbon dioxide (
emissions, and promoting the wider adoption of renewable energy (RE) sources for electricity generation [
2,
3,
4,
5,
6,
7]. The ASEAN energy markets have, thus, been undergoing substantial reforms through different stages of liberalization, with an aim to establish competitive and efficient electricity markets [
8,
9].
The electricity market liberalization process is a very important step in the electricity sector, as it has impacted the economies of different countries, but most of all it has substantial impact on electricity consumers. Affordable electricity prices for businesses and consumers are key to the ASEAN economies. Given the liberalized power sectors of the Philippines and Singapore, the electricity prices in these countries are amongst the highest in Southeast Asia.
Fossil-fuel-generated electricity accounts for a significant share of the global energy-generated
emissions. The ASEAN region is one of the few regions of the world where coal-fired electricity generation has been expanding [
1]. Reducing the share of coal-generated electricity is, therefore, a challenge towards achieving a sustainable future. Interestingly, the region has taken steps to reduce the production of coal-generated electricity and a greater emphasis has been placed on electricity generation from RE sources. As compared to 9.4% in 2014, the region is aiming to produce 23% of its total primary energy from RE-based sources by 2025 [
10]. Several countries in the region have established innovative policy and investment frameworks to promote all forms of renewables. The adoption of national and regional RE targets, combined with active efforts to reduce
emissions under the 2015 Paris agreement, signal the region’s well-founded commitment to transforming the energy sector. Liberalization is an important policy step to generate electricity with improved efficiency and to reduce the
emissions from the electricity generation sector. The liberalized electricity market also allows the development of emission trading markets and the augmentation of RE sources. Therefore, to achieve the set targets, the countries in the region have made rigorous efforts to develop policy frameworks and taken steps towards the liberalization of their electricity markets.
The development of liberalized electricity markets in the ASEAN region has sped up in recent years. Since 2001, Singapore has progressively opened up its electricity retail market to competition, and the market was progressively extended to all consumers across Singapore in November 2018 [
8,
9]. In the case of the Philippines, most of the important liberalization steps have been implemented since the electric power industry reform act (EPIRA) was passed in 2001 [
8]. In this connection, in 2013, the introduction of retail competition and the open access to distribution networks marked the final step. Malaysia also announced its second reform series in 2018 [
8]. The country is, thus, likely to be the third ASEAN country with a liberalized electricity market. Furthermore, market liberalization efforts have also been implemented in Thailand [
11,
12].
Creating a fully liberalized electricity market is very challenging both technically and politically, and a flawed liberalization process could result in inefficiencies, blackouts, increased electricity prices, failure to deliver environmentally sustainable electricity, and an electricity market crisis [
13,
14,
15]. It is, therefore, crucial to assess the outcomes of the liberalized electricity markets of both Singapore and the Philippines and to suggest policy recommendations to support the electricity market liberalization drive in ASEAN countries. Studies focusing on the experiences of the Philippines and Singapore in liberalizing their electricity markets [
8,
9] have appeared in the literature; however, empirical assessments of the impacts of these liberalized electricity markets have not been pursued. The objectives of this study are, therefore, to:
- (a)
Assess the impact of electricity market liberalization on electricity prices, electricity-generated emissions, and RE-based electricity contributions in Singapore and the Philippines during the period 2015–2020;
- (b)
Provide a set of policy recommendations on appropriate measures for achieving reduced electricity prices and emissions and improved RE contributions in the ASEAN liberalized electricity markets.
The study applies a regression analysis statistical methodology to assess the impacts of liberalization on the expected outcomes in both countries. First, for the period 2005–2020, the input parameters are selected to represent the driving variables for the expected outcomes (outputs). The regression analysis is then carried out to establish relevant models that correlate the output data with the statistically significant input data. The resulting regression models are then extended to include liberalization as a control variable to assess the impact of liberalization during the period 2015–2020. Since the analyzed period of 2015–2020 is the specific period of the market liberalization, the results, analysis, and policy recommendations can have implications for the countries that have liberalized or are liberalizing their electricity markets, or that have monopolized their electricity markets and are evaluating different liberalization models.
The paper is organized as follows. In
Section 2, a literature review is presented.
Section 3 provides the background on the liberalization of electricity markets in Singapore and the Philippines. The materials and methods and empirical results are presented in
Section 4 and
Section 5, respectively.
Section 6 presents a summary discussion and provides crucial policy recommendations for ASEAN countries on the track to liberalizing their electricity markets.
Section 7 concludes the paper. Additionally, the limitations of this study and the future research directions are highlighted in
Section 7.
2. Literature Review
The deregulation of electricity markets has been progressing all over the world and there have been few detailed assessments of the effects of the liberalization of electricity markets in several countries.
In [
16], Steiner examined the impact of market reform indicators on electricity retail prices and efficiency in a panel of organization for economic co-operation and development (OECD) countries. In [
15], Joskow established that the reforms such as restructuring, deregulation, privatization, regulation, and competition do not guarantee lower electricity prices. Zhang et al. [
17] investigated the effects of privatization, competition, and regulation on the electricity generation industry performance in developing countries. Their study established that the introduction of competition in the electricity generation leads to increased generating capacity and improved industry performance. In [
18], the market prices of Japan electric power exchange (JEPX) are investigated using regression equations, of which explanatory variables are a value related to demand and the electricity price.
The authors in [
19] studied Slovenian electricity markets during a specific period of market deregulation and price liberalization. To investigate the drivers of electricity price and consumption by industry and households, the authors based their study on regression analysis. The study established that electricity prices in the European energy exchange (EEX) market were significantly linked with the primary energy prices. The study also suggested that the Slovenian daily maximum electricity power prices were significantly related with the EEX market electricity prices.
The studies in [
20,
21] revealed that in the liberalization of the energy market process, the government is an important factor to achieve increased efficiency and develop energy systems that generate welfare for the environment and consumers. Nevertheless, the distortion in the transition is a problem for reducing
emissions and promotion of RE sources [
22,
23,
24]. The authors in [
3], investigated the effect of energy liberalization, on policies that support RE in a panel of OECD countries. The authors established that energy market liberalization raises the public support for RE. The positive effect of liberalization is wholly driven by a reduction in entry barriers, while the support for RE policies decreases with the privatization.
Ponce et al. [
5] evaluated the effect of the liberalization of the internal energy market on carbon emissions in the European union. The regression analysis-based study suggested that this step was helpful in reducing
emissions.
For a deeper review of the literature on liberalization and electricity deregulation, interested readers are advised to refer to [
25,
26,
27].
3. Deregulation and Liberalization of the Electricity Market
3.1. Electricity Market Liberalization in Singapore
Singapore’s electricity market is the first liberalized electricity market in the ASEAN region. The country’s electricity market is characterized by open access to its transmission and distribution networks; the separation of contestable and non-contestable market segments; wholesale bidding market and full retail competition.
Restructuring of Singapore’s electricity market started in 1995 when the electricity and gas undertakings under the state-owned public utilities board (PUB) were corporatized, and Singapore Power (SP) was created to stimulate competition in the energy sector. SP served as the holding company for a number of companies that included: (a) Power Senoko and Power Seraya (generation companies); (b) Power Grid (a transmission and distribution company); and (c) Power Supply Limited (a retail electricity supply company). Tuas Power was established as an independent power generating company directly under Temasek Holdings (a holding company of SP).
In April 1998, the Singapore electricity pool (SEP) was launched to facilitate the wholesale electricity trading under a competitive wholesale market. In addition, after conducting a full review of the electricity sector in 1999, the government decided in 2000 to continue with the electricity sector liberalization to reap the benefits of full competition.
In 2001, energy market authority (EMA) was created to oversee the electricity industry and further the energy market liberalization efforts. As an independent regulator of electricity industry, EMA’s main goal was to ensure reliable and secure electricity supply to its consumers at competitive prices.
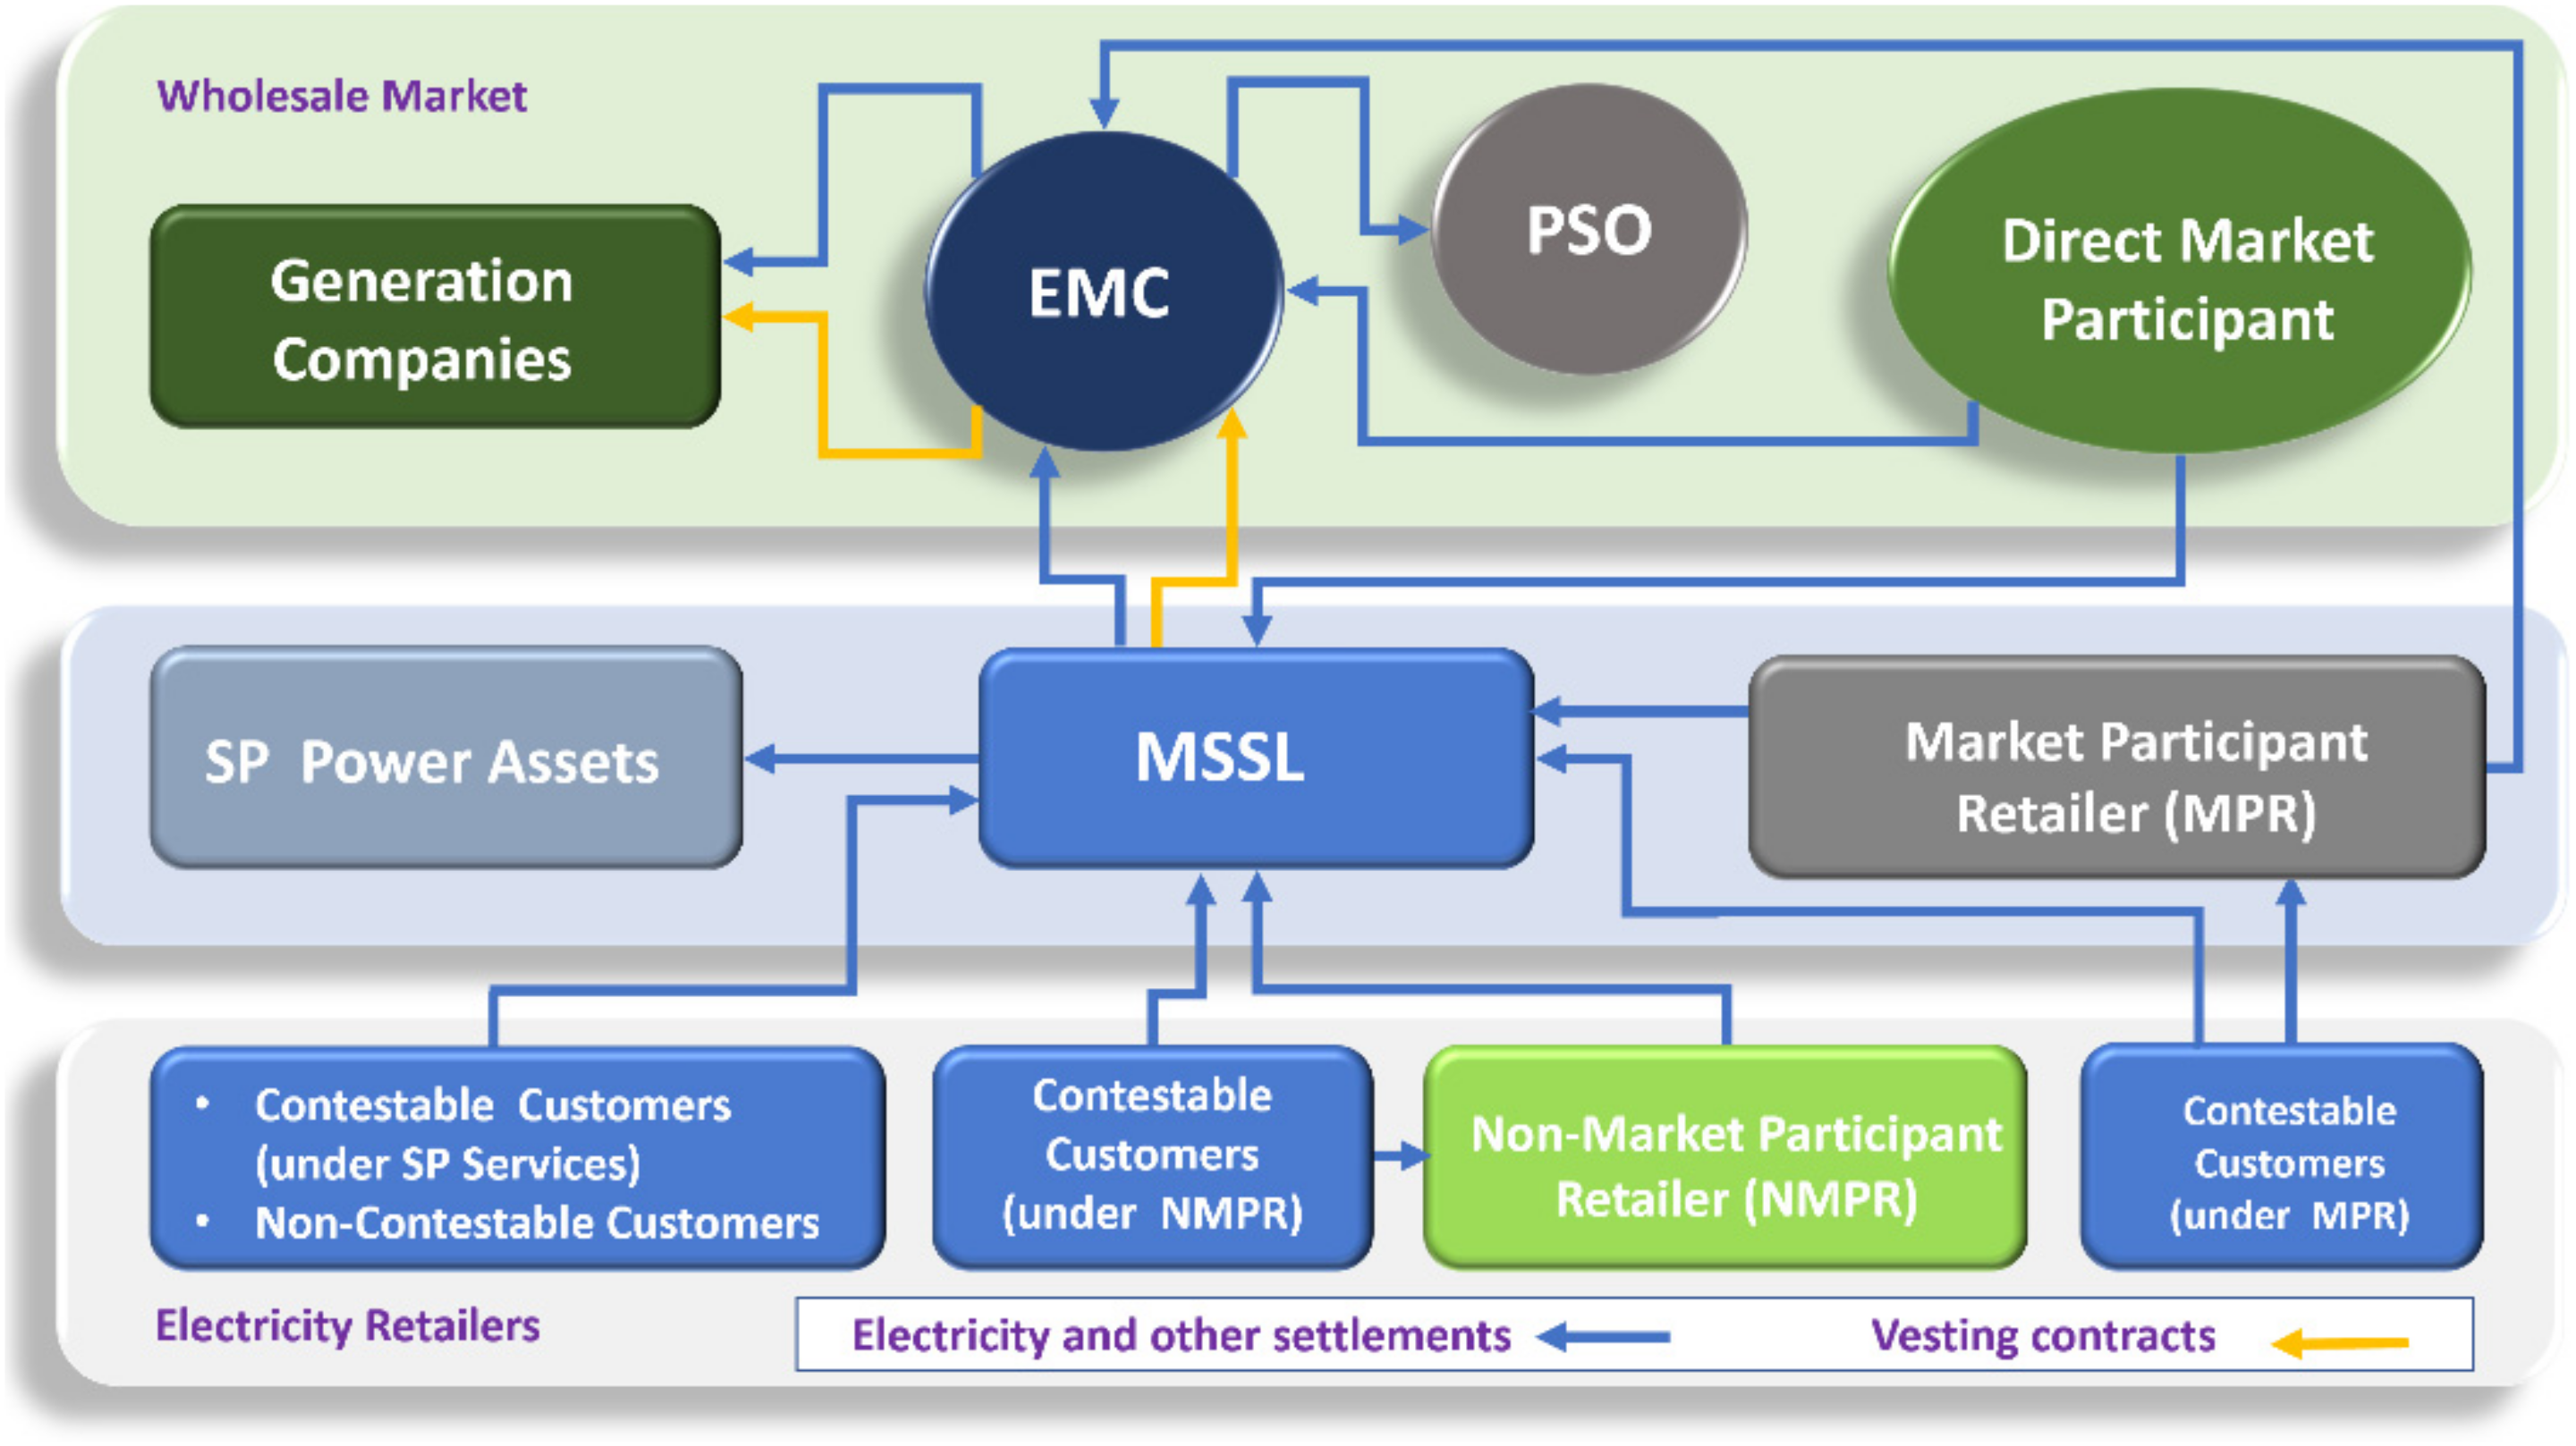
Competition in Singapore’s electricity market is achieved by separation of ownership of non-contestable transmission and distribution services from the contestable generation and retail services. Singapore’s electricity market facilitates competitive wholesale and retail electricity trading at the national electricity market of Singapore (NEMS) operated by the energy market company (EMC), a subsidiary of EMA. NEMS establishes the wholesale prices at which electricity generating companies are paid by matching electricity supply and demand at regular intervals of 30 min. To ensure secure operation of the system, a division under the EMA acts as the power system operator (PSO). The NEMS governance is shown in
Figure 1. Notice that EMA, PSO, EMC, transmission licensee (SP Power Assets), generators, market support services licensee (MSSL) (SP Services), retailers and consumers are key players in NEMS [
28]. For respective descriptions of these participants, interested reader is advised to refer to [
8].
Since 2001, EMA has progressively opened Singapore’s retail electricity market to competition. Instead of buying electricity at the regulated tariff from SP Services, the customers are given the flexibility to buy electricity from a retailer of their choice at a price plan suiting their need or from the wholesale market at the half-hourly wholesale electricity prices. Electricity consumers with a maximum power requirement of 2 MW and above gained retail electricity market access as contestable consumers in July 2001. The consumption volume threshold for contestability was lowered to 20,000 kWh in June 2003, 10,000 kWh in February 2006 and 2000 kWh in July 2015. In April 2018, EMA marked the soft launch of the open electricity market (OEM), where all businesses and households in Jurong area were allowed to buy electricity from a retailer of their choice at a price plan suiting their needs. From November 2018, this open electricity market initiative is extended progressively to all consumers across Singapore by zones. The key milestones of Singapore’s electricity market reform journey since 2000 are summarized in [
9].
Singapore has no hydro resources, and its mean tidal range and wind speeds are low. It generates small amounts of RE based electricity from biomass and solid waste management. Solar PV energy is the most viable RE option for Singapore. The country is targeting to meet 5% of its peak electricity demand from RE sources by 2020 and 4% of total generated electricity from RE sources by 2030 [
29].
In addition, Singapore is exploring the potential of harnessing geothermal energy. The geothermal energy could thus be a new and additional source of RE besides solar PV based electricity generation in Singapore.
3.2. Electrcity Market Liberalization in the Philippines
The Asian financial crisis in 1997 and the high electricity prices led the government of the Philippines to substantial restructuring of its electricity sector to make the country’s electricity reliable, affordable, accessible, and sustainable.
At the start of the electricity sector’s restructuring, the state-owned national power company (NPC) owned most of the generation and transmission in the national electricity supply system. NPC was the main electricity producer and the single buyer from independent power producers (IPPs). Distribution was owned and operated by energy cooperatives and distribution utilities (of which the Manila electric company (MERALCO) was the main distributor in Luzon).
This journey of competition in the electricity sector started with the approval of the EPIRA in June 2001. The EPIRA called for restructuring of electric power industry and privatization of assets of the NPC. In 2001, TransCo was established and in 2003, it started operation and management of the country’s power transmission system. The EPIRA also created the energy regulatory commission (ERC). In capacity of an independent, quasi-judicial regulator, ERC was entrusted to promote competition, ensure customer choice, encourage market development, and penalize abuse of market power. ERC was also tasked to regulate electricity rates and enforce the implementation of EPIRA rules and regulations.
In 2001, under the EPIRA, power sector assets and liabilities management (PSALM) corporation was established. PSALM fully owned TransCo and assumed the corresponding liabilities of the transmission assets. The NPC took over the ownership of NPC’s assets, contracts, and real estate. In addition, PSALM assumed NPC’s liabilities. The EPIRA directed the PSALM to manage privatization of these generation and transmission assets.
Rules, and regulations with regards to the wholesale electricity spot market (WESM) conduct were announced in 2002. The Philippine electricity market corporation (PEMC) was established in 2003, by the department of energy (DOE), to operate the WESM, and in 2007, national grid corporation of the Philippines (NGCP) was awarded the TransCo franchise to operate, manage, and expand the national transmission system.
The commercial operation of WESM in Luzon commenced on 26 June 2006. Visayas grid was also included into the WESM, and its commercial operation started in December 2010. In September 2018, the control of WESM was passed to the independent electricity market operator of the Philippines (IEMOP).
In 2013, the retail competition and open access (RCOA) was launched. In the beginning, RCOA contestability threshold in Luzon and Visayas started with 1 MW. In May 2016, electricity customers with an average monthly peak demand of at least 750 kW were also allowed to enter agreements for retail electricity supply. In February 2021, RCOA threshold was further lowered to 500–749 kW level.
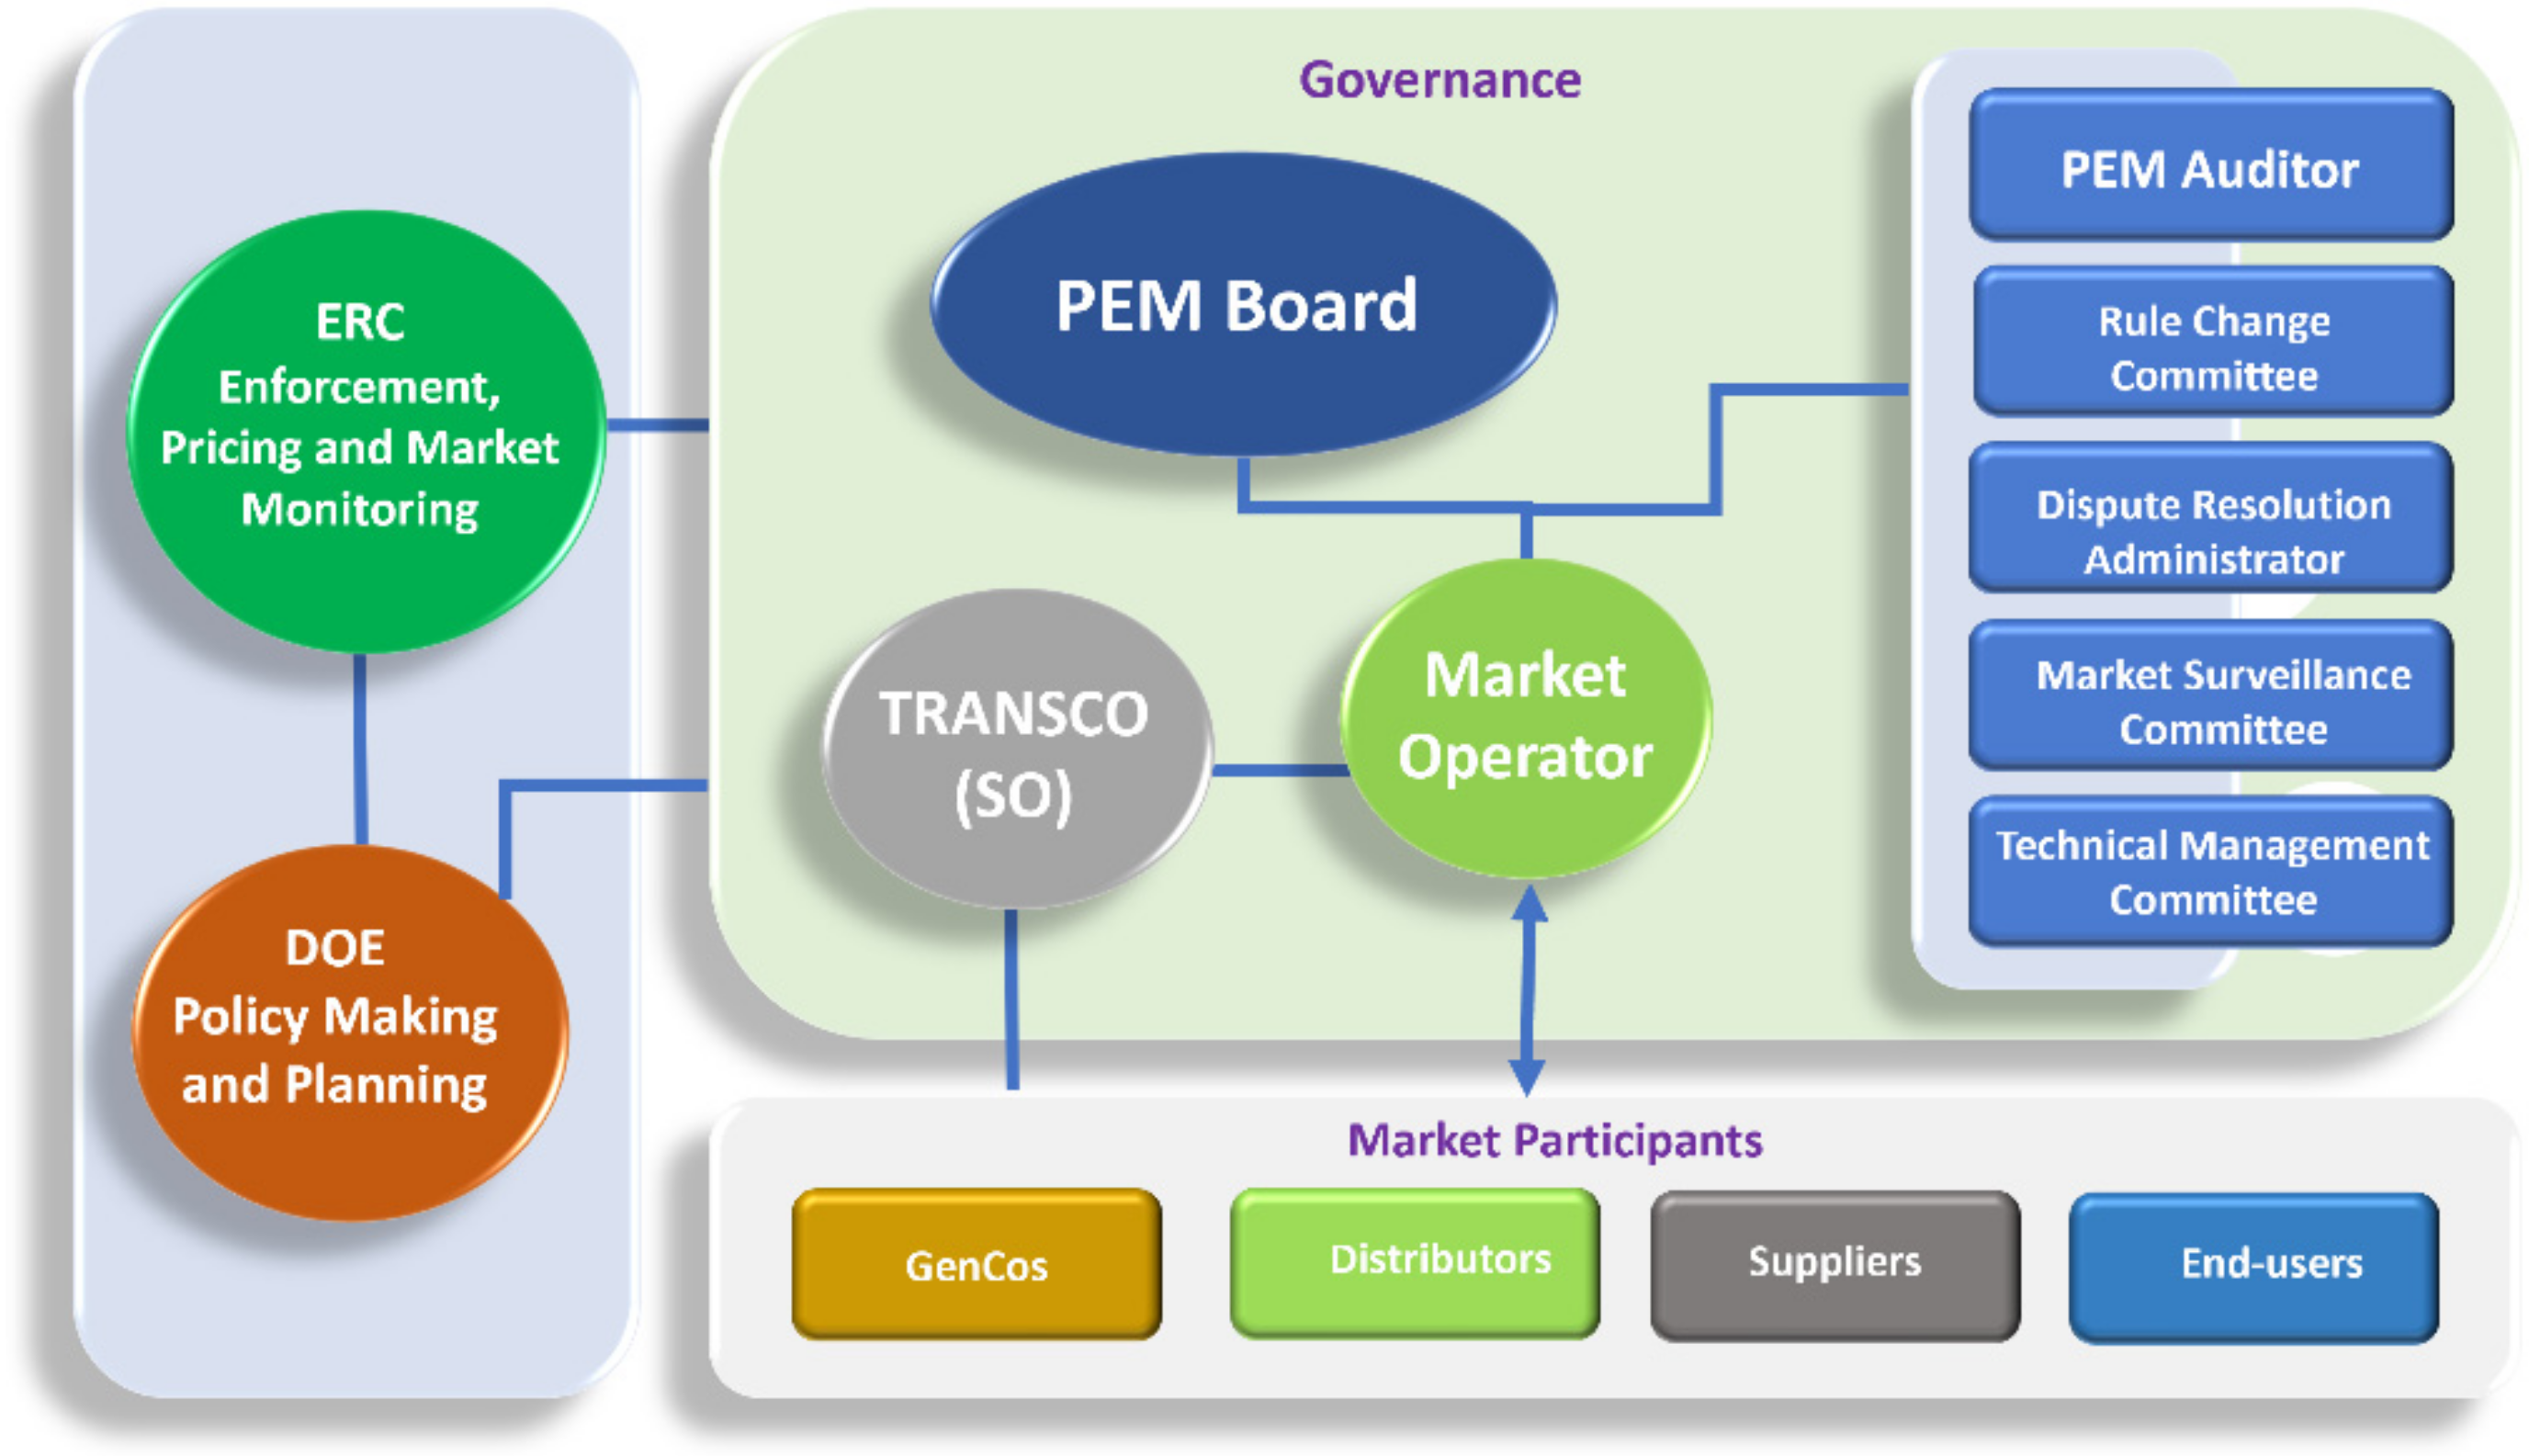
Figure 2 shows the WESM governance structure [
8]. WESM participants include generation companies (GenCos), distribution utilities (DUs), retail electricity suppliers (RESs) and directly connected customers (DCC) [
30]. As of April 2018, there were 113 WESM participating GenCos in the Luzon-Visayas grid [
31]. The demand side comprises of DUs, RESs and DCCs. DUs provide open access to its system and wheeling services to the end-users. RESs provide supply of electricity to the contestable customers. The DCCs are the grid connected bulk electricity customers that directly receive electricity from a GenCo, NPC or PSLAM [
32].
The national renewable energy program (NREP) functions as the blueprint for the implementation of the RE Act of 2008. In 2011, under NREP, the Philippines government set an ambitious target to raise its RE based generation capacity to an estimated 15.3 GW by 2030. In December 2021, IEMOP, started the green energy option program (GEOP) under which consumers are provided an option to choose RE sources for their electricity supply.
Electricity rates in the Philippines are high compared to its neighbors due to the presence of domestic taxes and some inefficiencies in the system. Due to this, the country’s manufacturing has shifted towards less power-intensive and more labor-intensive subsectors.
Philippines has large sources of hydro, geothermal, onshore wind and solar power. The current energy mix in the Philippines is dominated by coal fired electricity generation. As of 2020, coal-fired electrcity generation constituted 57.2% of the electricity generation mix [
33]. Oil and gas fired electricity generation comprised 2.4% and 19.2% of the electricity generation mix. Furthermore, the RE share was 21.2% in the generation mix. This is a reduction from 32.7% in 2005 [
34]. On the other hand, in 2020, the country’s installed RE capacity expanded by 16% [
35]. The country has set up a target of expanding its renewable capacity to 15,234.3 MW by 2030 [
29].
4. Materials and Methods
A two-step methodology is adopted. In Step 1, for the period 2005–2020, the conventional input parameters are selected to represent driving variables for expected outcomes (outputs) in Singapore (Philippines). Regression analysis is carried out to establish relevant models that correlate the output data with the statistically significant input data. For this, the following hypotheses are numerically tested using regression analysis:
Hypothesis 1 (H1). Electricity generated emissions in Singapore (Philippines) are significantly related to carbon pricing, percentage of fossil fuel generated electricity, gross domestic product (GDP) per capita, annual population growth, prices of primary energy sources (gas, oil and coal).
Hypothesis 2a (H2a). Household electricity prices in Singapore (Philippines) are significantly related to average family income, electricity consumption by households, prices of primary energy sources, annual population growth, and GDP per capita.
Hypothesis 2b (H2b). Electricity prices for industry in Singapore (Philippines) are significantly related to industrial production index (IPI) (volume of production index (VoPI)), electricity consumption by industry, GDP per capita, and prices of energy sources.
Hypothesis 3 (H3). RE share in Singapore (Philippines) is significantly related to emissions from electricity generation, carbon pricing, and prices of energy sources.
In Step 2, the impact of electricity market liberalization on the expected outcomes in Singapore (Philippines) is assessed for the period 2015–2020. For this, the following hypotheses are empirically tested using regression analysis.
Hypothesis 4 (H4). With the electricity market liberalization, emissions in Singapore (Philippines) have declined.
Hypothesis 5a (H5a). With electricity market liberalization, the electricity price for households has declined.
Hypothesis 5b (H5b). With electricity market liberalization, the electricity prices for industry have declined.
Hypothesis 6 (H6). With the electricity market liberalization, RE share in Singapore (Philippines) has increased.
For H4–H6 testing, Step 1 regression models are extended to include liberalization as a control variable to assess the impact of liberalization during the period 2015–2020.
4.1. Drivers of Emissions
Despite advances in RE energy sources, fossil fuels generated electricity remains the primary source of carbon emissions from generated electricity. Raising carbon prices provides an incentive to reduce emissions through energy efficiency improvements. In [
36,
37], it is shown that variables such as population size, fossil fuel energy generation, energy consumption are positively linked to emissions. A study developed by Alam et al. [
38], investigates the impacts of energy consumption, population growth and income on
emissions for China, Brazil, India, and Indonesia. Studies in [
39,
40,
41] suggest an inverse relationship between the GDP per capita and
emissions. Wider use of RE can also immediately and significantly underpin global
emissions. The studies in [
42,
43] used RE and non-RE variables to determine their impact on
emissions.
4.2. Drivers of Electricity Prices
Electricity generation in ASEAN countries is heavily dependent on fossil fuels. The percentage share of fossil fuel generated electricity in the overall electricity generation mix and associated rise in coal, oil and liquefied natural gas (LNG) prices significantly impact electricity prices. The prices of these primary energy resources are generally expressed in US dollars. Therefore, any exchange rate fluctuations also impact the electricity prices.
An important factor affecting regional electrical prices is demand due to consumption which is linked with the country’s economic developments which are reflected through GDP, industry growth, and average household income. The increase in electricity demand is also linked with the population growth. If the population of a country is growing faster than its electricity production capacity, it creates lots of pressure on increasing electricity prices.
Several other factors affecting electricity prices have been investigated in literature [
19]. These include delivery time, weather conditions, electricity transmission networks, economic developments, RE integration, and economic developments. These factors have had a great impact on electricity prices in different countries.
4.3. Drivers of RE Electricity Generation
RE sources are critical for the global transition to a low or zero-carbon economy. Therefore, RE electricity generation capacity has been developed with the strong support of government policies, incentives and subsidies.
An increasingly large variety of carbon pricing schemes have been introduced around the world. Some studies have investigated how tax on carbon emissions would broaden the prospectus of renewables. Several studies have also analyzed the relationship between RE energy and liberalization. A number of studies suggest that liberalization of energy market is necessary to support the consumption of RE [
3,
44,
45]. Scholars such as Chapman and Itaoka [
46] suggest that the diversity of energy resources will lead consumer to be made by environmental reasoning. These studies suggest that the effect can cause more efficient power generation using environmentally friendly sources. However, the effect can be contrary to what was expected.
4.4. Methodology
Different approaches can be applied to estimate drivers of electricity prices,
emissions and RE sources [
47,
48,
49,
50]. Choosing a correct technique is a tough grind as each method has its own advantages and disadvantages. However, there has been a growing number of studies concerning regression analysis of electricity prices, environmental pollution reduction and solar power generation [
5,
19,
51,
52,
53]. Advantages of this technique include a clear relationship between input and output variables, and the ease implementation and analysis. In addition, linear regression performs exceptionally well for linearly separable data. The method also allows easy inclusion of categorical variables in regression models through coding to obtain meaningful results. For these reasons, regression analysis was used for this study.
Simple linear regression (SLR) [
54] compares the response of a dependent variable given a change in some explanatory variable. However, dependent variables such as electricity prices,
emissions and RE share cannot be explained by only one variable. A multiple linear regression (MLR) model [
55] accommodates several explanatory variables and examines how multiple independent variables are related to one dependent variable. Therefore, for this study, multiple regression analysis was used in a two-step approach.
In
Step 1, regression analysis was used to estimate the drivers of
emissions, electricity prices, and RE share in Singapore and the Philippines using yearly data 2005–2020. Under this step, the impact of different control variables on these outputs was studied using the MLR model:
where
represents the dependent variable,
is a vector of coefficients that are estimated,
is a vector that represents relevant control variables detailed in
Table 1, and
represents the error term. The subscript
i represents the country
i =
Singapore,
Philippines in the period
.
Technically, “endogeneity” in data will occur when a control variable in the regression model is correlated with the error term in the regression model and would lead to the biased estimates of the regression coefficient. Some common sources of endogeneity include omitted variable, measurement error, and simultaneity. For the MLR models used in this study, all fundamental control variables behind dependent variables have been included. Furthermore, no known models of simultaneity do exist between control variables and the dependent variables for both countries. Moreover, data was selected from reliable resources (rather than relying on surveys and/or interviews). It is therefore probability of errors in the data has been discarded. No control variables in the MLR models are thus suspected to be endogenous.
In regression, “multicollinearity” refers to control variables that are correlated with other control variables. Multicollinearity leads to poor interpretation of the regression analysis results and decreases its accuracy. In a set of multiple regression variables, variance inflation factor (VIF) is a measure of the amount of multicollinearity [
56]. A high VIF indicates that the associated independent variable is highly collinear with the other variables in the model. To deal with the multicollinearity problem, variables displaying VIF of greater than 10 were dropped from the regression analysis. The explanatory variables that were not statistically significant were also dropped. Important variables that contributed the expected outputs in both the countries were thus filtered out.
Since the aim was to assess the effect of liberalization policy over the time period 2015–2020, the model Equation (1) was revised as under
where,
is a vector representing the statistically significant control variables from model (1), to improve robustness and better assessment of the model. The dummy variable
captures the effect of liberalization during the liberalization years of interest. It is assigned a value 1 for the years 2015–2020 and a value of zero for the other years.
An appropriate data sample size was needed so that inferences about the population based on that sample can be drawn using regression models (1) and (2). With a too small data sample, the model may over fit the data. Additional data is always good; however, a too large sample size will result in wastage of efforts and resources. In regression analysis, despite the development of procedures for calculating sample size as a function of relevant effect size parameters, rules of thumb tend to persist in designs of multiple regression studies [
57]. Many researchers take at least 10 observations per variable as a rule of thumb.
In this study, for model 1 (model 2), a priori minimum sample size was calculated for anticipated effect size parameter (f2) of 0.15 (0.35), desired statistical power of 0.8 and probability level of 0.05. The modelling methodology adopted the historical annual data from 2005 to 2020, with a total of 16 observations per variable. The effective sample size for models (1) and (2) was therefore greater than both the a priori minimum sample size and the rule of thumb approach.
4.5. Data and Summary Statistics of Variables
Data on annual
emissions in million tons (
) from electricity generation in Singapore and the Philippines were obtained from [
58]. The annual GDP per capita data in billion US
$ and annual population percentage growth data was obtained from World Bank national accounts data [
59]. Gas prices in US
$/MMBtu (LNG Japan data) and oil prices in US
$/bbl (Brent data) were obtained from Asian oil and gas updates 2021 [
60]. The annual Australian coal prices in US
$/ton were obtained from the World Bank commodity prices data (pink sheet) [
61].
The price of electricity for households in Singapore (in Singapore Cents/kWh) was obtained from EMA [
62]. Industry electricity prices are generally very close to the wholesale electricity prices. The uniform Singapore energy price (USEP) is the price at which all electricity retailers in Singapore buy from the wholesale market. Annualized USEP tariff in S
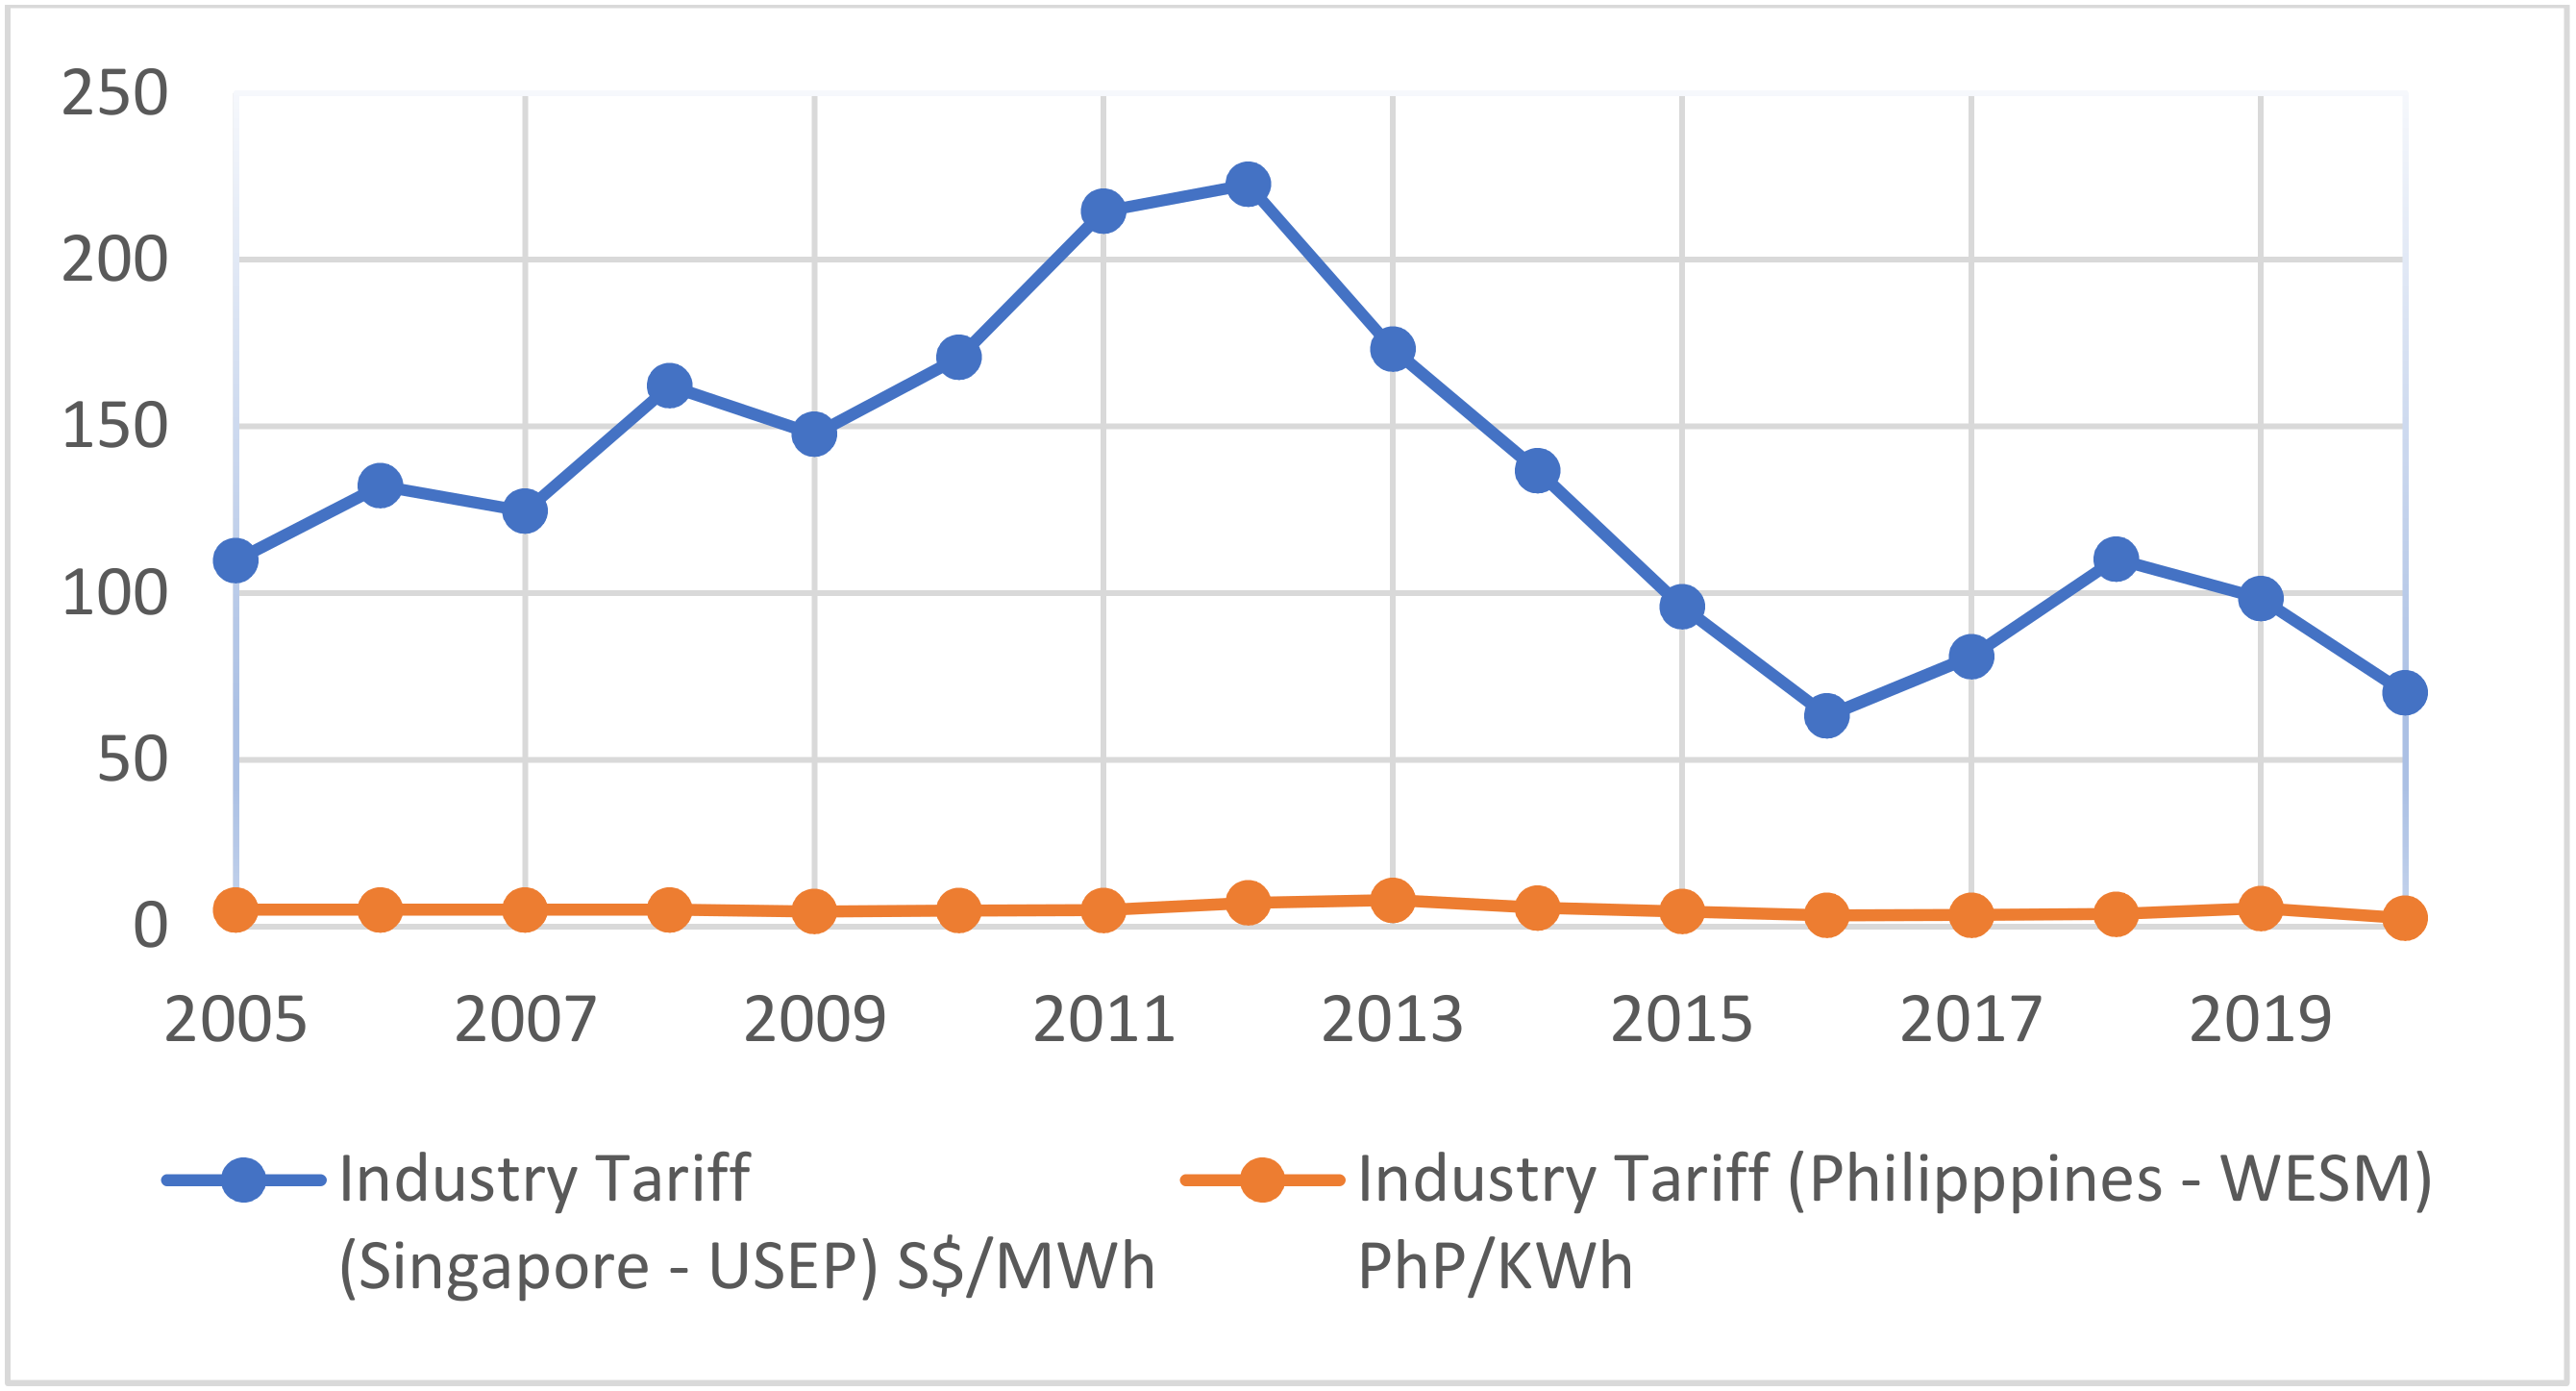
$/MWh from EMA [
63], was therefore used as reflection of industry tariff to track the changes in electricity market and deduce overall trends.
MERALCO [
64] is the largest private electricity distribution utility in the Philippines, providing 55% of the country’s electricity output. The price of electricity for households in the Philippines (in PhP/kWh) was thus obtained from MERALCO rates.
Annualized wholesale tariff was used as a reflection of industry tariff to track the changes in electricity market and deduce overall trends. Average annual wholesale electricity prices in PhP/kWh were obtained from the DOE [
65] and WESM [
66].
Annual gross household income in Singapore was obtained from the department of statistics (DOS), Singapore [
67]. Annual gross household income in the Philippines was obtained from the household income and expenditure surveys (PSA) [
68].
Electricity consumption for both households and industry in MWh for the Philippines was obtained from the DOE power statistics [
69]. Furthermore, electricity consumption for households (industry) in MWh (GWh) for Singapore was obtained from EMA, DOS and national environmental agency (NEA), Singapore [
70].
Data for IPI Singapore and VoPI Philippines were obtained from EMA, PSA, and central bank of the Philippines [
71], respectively. In addition, the percentage share of fossil fuel RE generated electricity in the overall fuel mix for electricity generation was obtained from EMA, and MERALCO.
Currently, there is no carbon pricing in the Philippines, whereas, in Singapore, the carbon tax is fixed at
$5/tonne of greenhouse gas (GHG) emissions (t
) from 2019 to 2023 [
72].
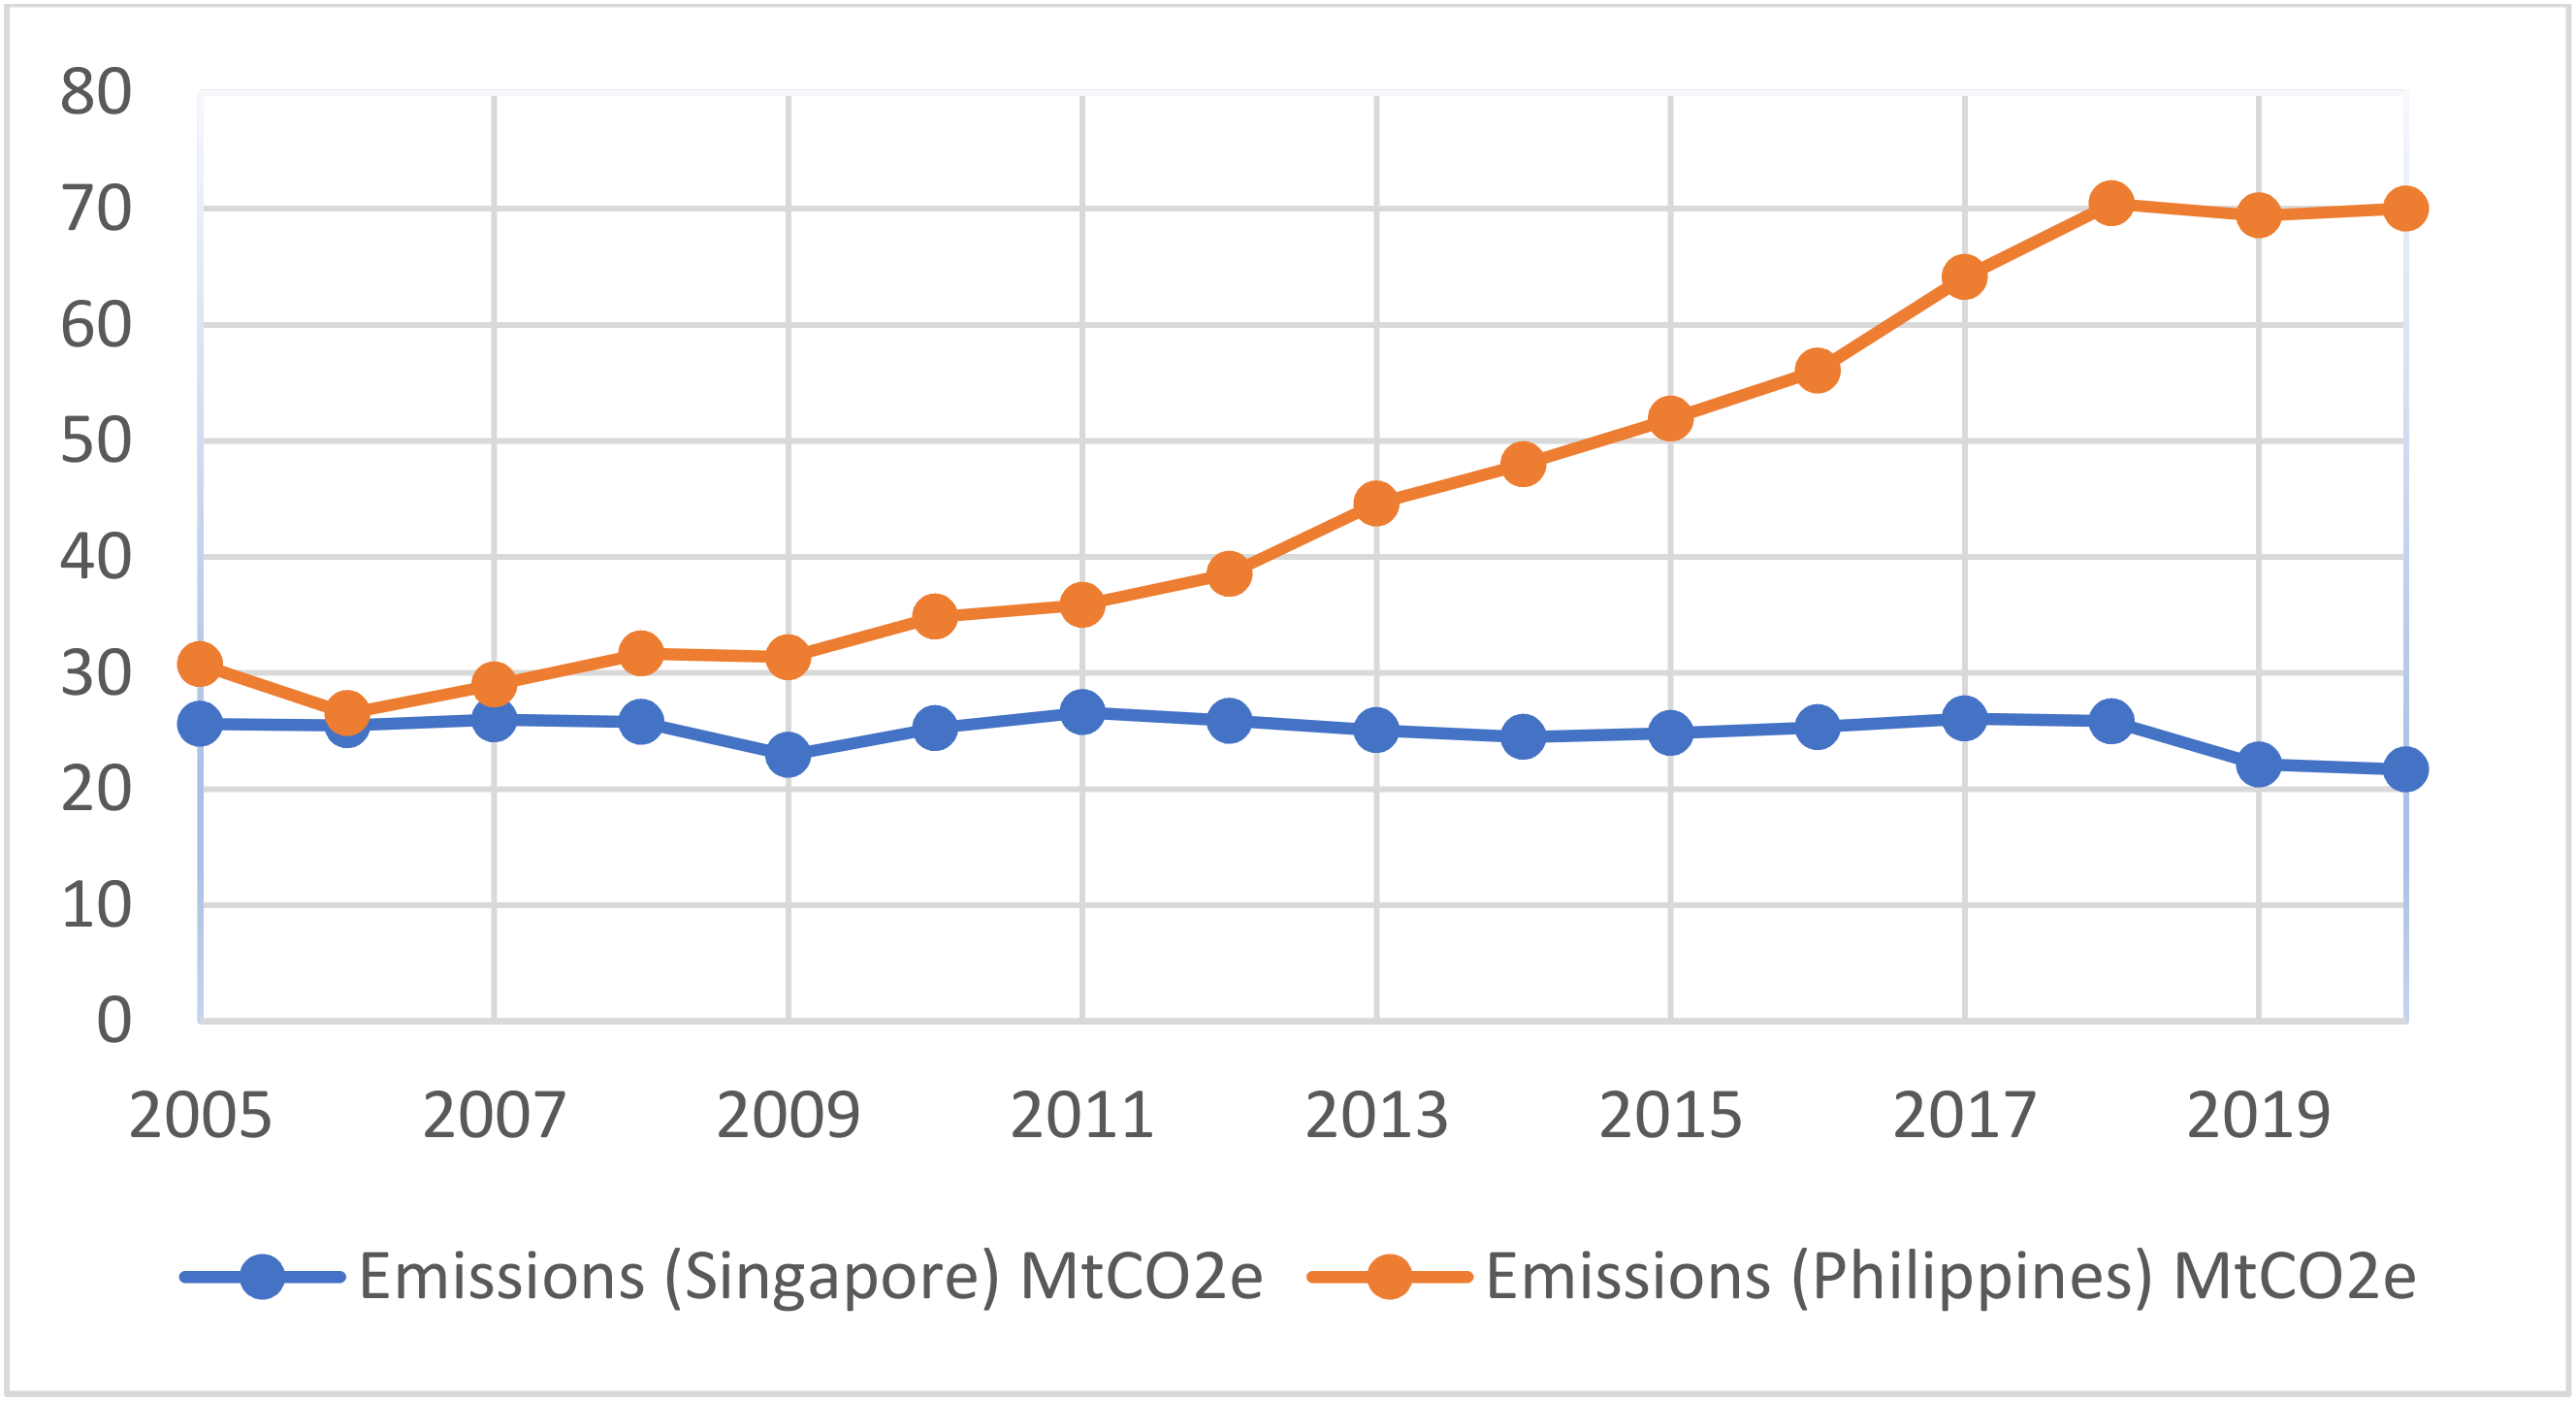
Figure 3 represents the evolution of electricity generation related
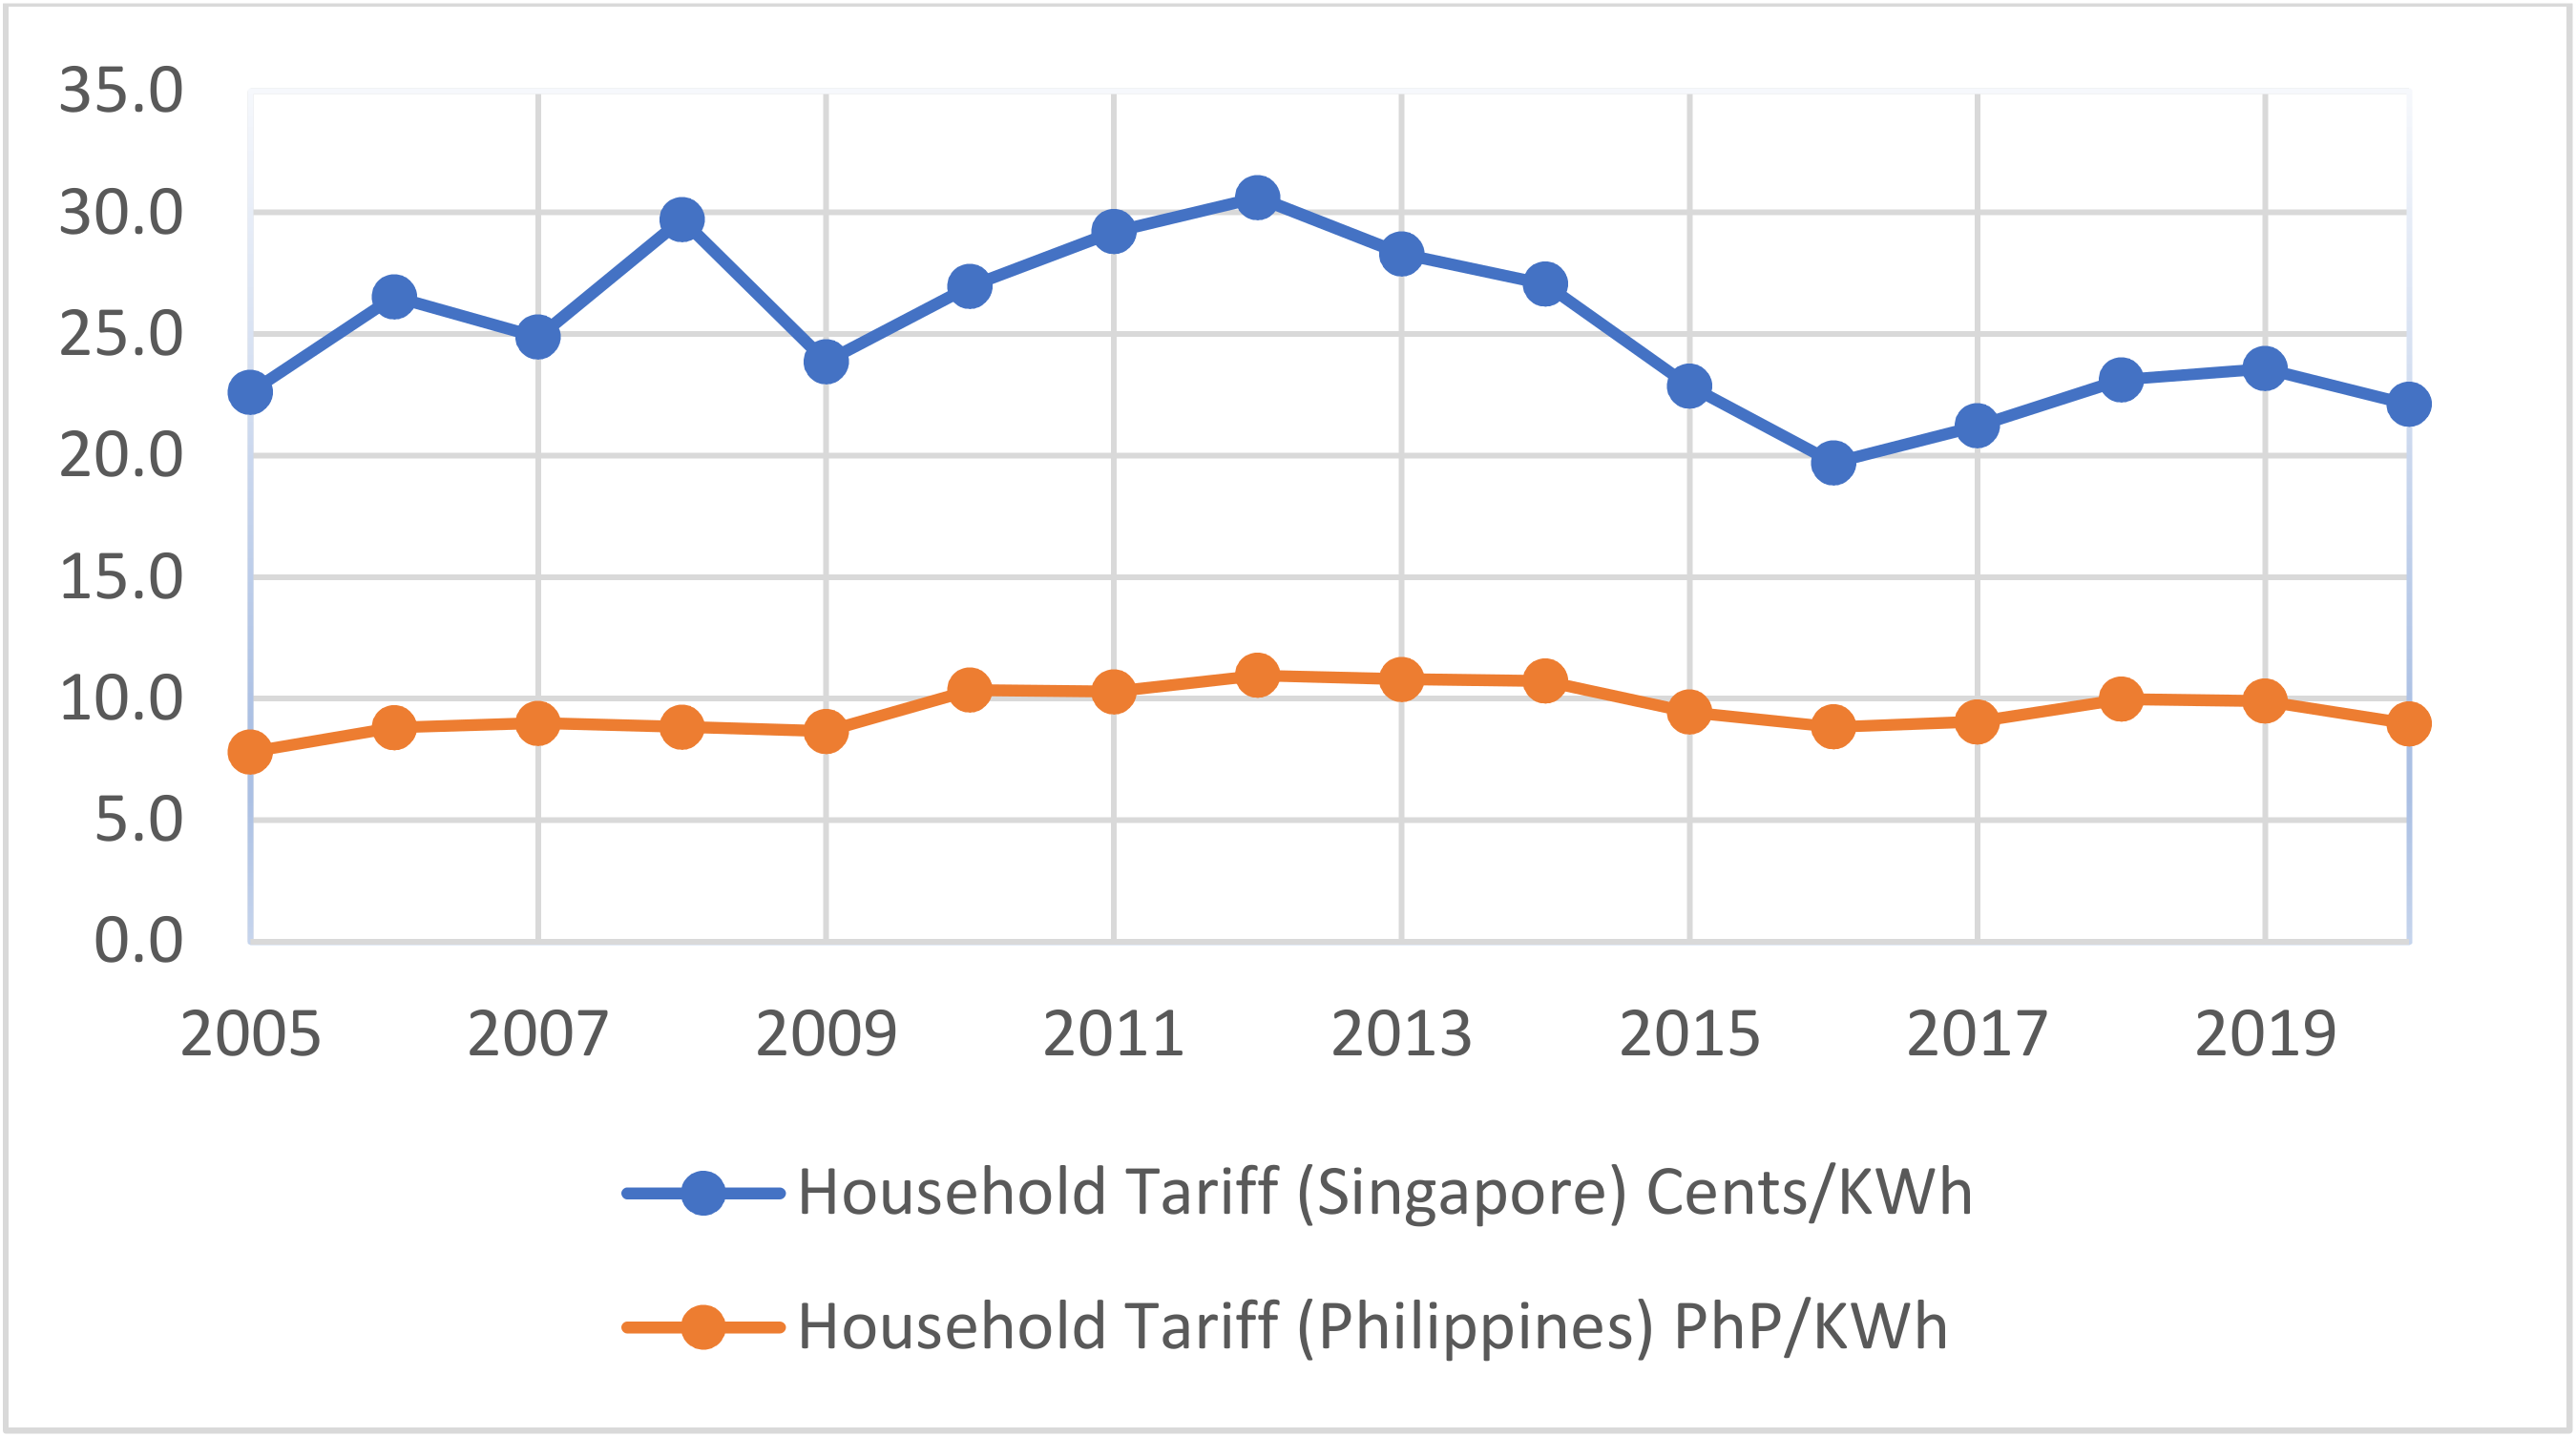
emissions as the basic dependent variable tested in the regression models for Singapore and the Philippines. The evolution of electricity prices (for households and industry) as the basic dependent variable in the models for both Singapore and the Philippines are shown in
Figure 4 and
Figure 5, respectively.
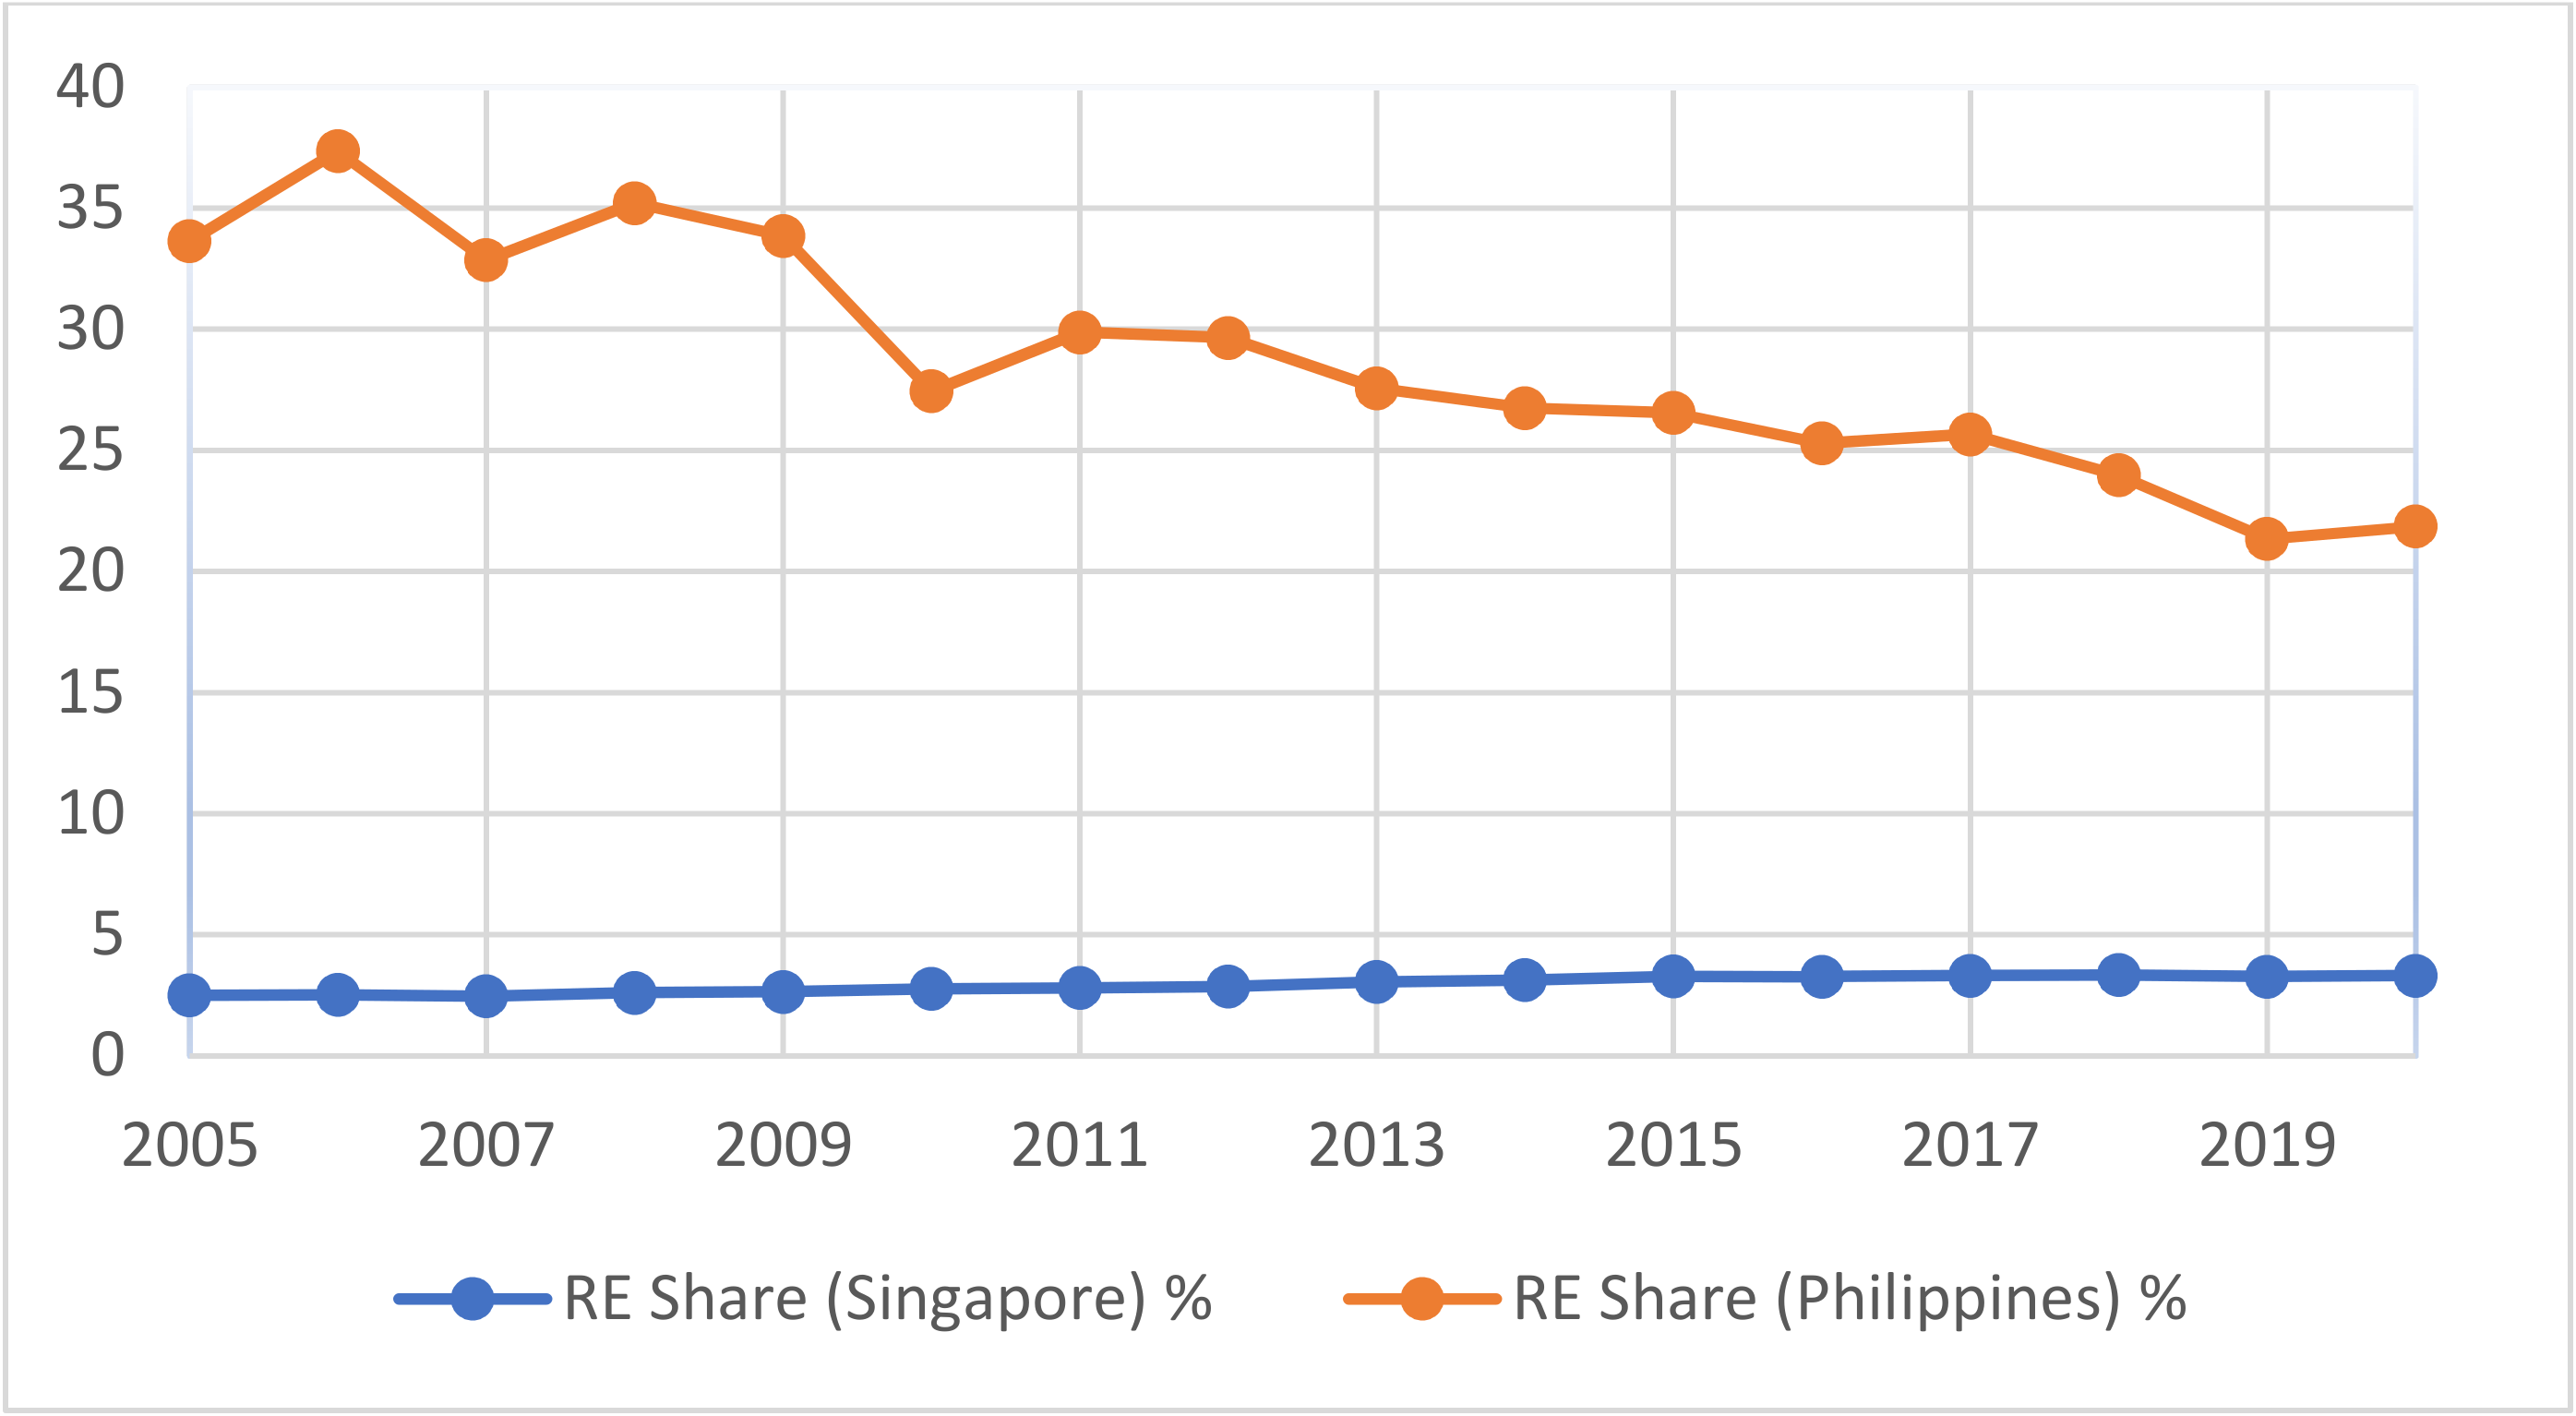
Figure 6 shows the evolution of RE share as basic dependent variable for both the countries.
Table 1 defines the variables used in the estimation of regression models and lists their relevant measuring units. In addition,
Table 2 presents the summary statistics of the control variables used in the regression analysis for Singapore and the Philippines, respectively.
5. Results
The simulation of several models was performed using MINITAB software to obtain the regression equations. Cases for simulation were generated combining input values for each variable listed on
Table 1. These variables were acquired for the years 2005–2020.
In our initial analysis, some of the variables were found to be non-significant (that do not follow the associated Hypothesis). These variables were thus removed from our models. The variables introducing multicollinearity were considered to have minor effects on the results. These variables were also not investigated further. Moreover, for the validation of models, the coefficient of determination () score was used to evaluate model performance and a significance of 0.05 was used for the evaluated coefficients.
First, we examined the set H1. In the case of Singapore, the effect of GDP, percentage of fossil fuel generated electricity, carbon pricing, and annual population growth on electricity generated emissions was tested using regression analysis. The Model 1 in
Table 3 shows the regression results. The statistical significance of the carbon price variable was high enough to explain the emission variable (
p = 0.000). The model presented 64.75% of variation in the dependent variable. This low adjusted
suggests the presence of exogenous factors involved in driving electricity generated
emissions. The negative sign of the
pricing regression coefficient shows that carbon pricing had a negative effect on electricity emissions in Singapore. This means that increasing carbon pricing was an effective measure to reduce electricity generated emissions in Singapore. The regression coefficient pertaining to carbon pricing was statistically significant, with a theoretically expected negative sign. The set H1 thus cannot be rejected.
The Model 2 in
Table 3 shows associated regression results for the Philippines. The calculated statistically significant regression coefficient for fossil fuel generated electricity shows that fossil fuel generated electricity had a positive effect on electricity emissions in the Philippines. Therefore, reducing the share of fossil fuel generated electricity was an effective measure in reducing electricity generated emissions. We thus confirm that among the set H1, fossil fuel generated electricity is significantly related to
emissions in the Philippines with a theoretically expected positive sign.
Second, the set H2a was assessed: whether electricity prices for households in Singapore and the Philippines were significantly associated with prices of primary energy sources, average family income, electricity consumption by households, GDP, and annual population growth. The Model 3 and 4 (in
Table 4) show regression results for Singapore and the Philippines, respectively. The Model 3 results show that the regression coefficients for the annual population growth and gas prices are statistically significant with a positive association with household prices. The household prices thus increase with the increase in population and/or gas prices. Due to the statistically significant associations and expected signs of the regression coefficients, the set H2a for annual population growth and gas prices in Singapore cannot be rejected.
The regression model 4 results show that the regression coefficients for GDP and oil prices are statistically significant with a positive association with household prices in the Philippines. It is thus expected that household electricity prices would increase with the increase in GDP and oil prices. Since the regression coefficients are statistically significant with theoretically expected signs, the set H2a for GDP and oil prices in the Philippines is not rejected.
Next, the set H2b was assessed: whether electricity prices for industry in Singapore (the Philippines) were significantly associated with the IPI (VoPI), electricity consumption in industry, GDP, and sources of electricity. In
Table 4, Models 5 and 6 show regression results for Singapore and the Philippines, respectively. The Model 5 results show that the regression coefficients for gas prices and electricity consumption are statistically significant. As expected, gas prices have a positive association with industry prices in Singapore. This means that the higher the gas prices, the higher the industry electricity prices. It is interesting to see here that electricity consumption had negative association with electricity prices. This means that supply of electricity was much higher than the demand and the industrial production and thus increase in bulk electricity demand led to reduced industry electricity prices. The regression coefficients associated with the gas prices and electricity consumption are statistically significant, the set H2b cannot be rejected for these variables.
The regression Model 6 results show that the regression coefficient for oil prices is statistically significant. Furthermore, as expected, the oil price has a positive association with industry prices in the Philippines. Since the regression coefficient for oil prices is statistically significant with a theoretically expected sign, the set H2b cannot be rejected for oil prices.
Third, we assessed the set H3: whether RE share in Singapore (the Philippines) associated with the prices of electricity (households and industry),
emissions, carbon pricing and prices of primary energy resources. In
Table 5, Models 7 and 8 show the associated regression results for Singapore and the Philippines, respectively. In Model 7, the regression coefficient for gas prices is statistically significant with a theoretically expected positive sign. The regression coefficient for oil prices is also statistically significant but had a negative effect on RE share. The negative association of oil prices with RE share could not be explained, however, the set H3 cannot be completely rejected as both the variables were statistically significant and oil prices had a theoretically expected sign. On the other hand, in relation to the Model 8 regression results for the Philippines, the set H3 cannot be rejected as
emissions variable was statistically significant and carbon emissions had a theoretically expected sign.
Following the identification of country specific driving variables for
emissions, electricity prices and RE share, the effect of liberalization on these output variables during the period 2015–2020 was evaluated. Firstly, the set H4 was investigated: whether there was any significant association between
emissions from electricity generation in Singapore and liberalization. Accordingly, the dummy liberalization variable was included in the Model 1. The resulting Model 9 in
Table 6 shows that the liberalization coefficient is not statistically significant. This in turn shows that liberalization did not play an important role in reducing electricity related emissions in Singapore. The set H4 is thus rejected for Singapore.
Through the regression analysis, the association between
emissions and liberalization of electricity sector in the Philippines was tested. Model 2 was revised here to include liberalization as an additional explanatory dummy variable. The resulting Model 10 in
Table 6 shows that liberalization coefficient is statistically significant. Unexpectedly, liberalization is positively linked with
emissions in the Philippines. This means that despite electricity market liberalization,
emissions did not decline, but there was an increasing trend in electricity generated
emissions. Notice that the liberalization coefficient is of the opposite sign than expected. Therefore, the set H4 is rejected for the Philippines.
Association between liberalization and the household electricity tariff in Singapore was also tested through the regression analysis. For this, Model 3 was revised. The resulting Model 11 in
Table 7 shows that all coefficients were statistically significant with theoretically expected signs. In addition, based on the negative sign of the liberalization coefficient, it is concluded that liberalization played a significant role in reducing household electricity prices in Singapore. The set H5a thus cannot be rejected for Singapore. This result shows that on the retail side, customers have benefitted through a greater choice of retailers and pricing plans. At present, there are 13 electricity retailers participating in the open electricity market of Singapore. These retailers offer a variety of pricing plans and consumers can choose a fixed price plan and pay a constant rate for electricity through the contract period.
Next, the association between liberalization and the household electricity tariff in the Philippines was tested. For this, Model 4 was revised. The resulting Model 12 in
Table 7 shows that all coefficients were statistically significant. A positive relationship exists between the liberalization coefficient and household electricity prices. Based on this result, it is thus established that liberalization contributed to increasing household electricity prices in the Philippines. The set H5a is thus rejected for the Philippines.
The analysis was then focused on the association between liberalization and the industry tariff in Singapore. For this, Model 5 was revised. Based on the resulting Model 13 (in
Table 7), it can be seen that all coefficients are statistically significant with theoretically expected signs. Since liberalization is negatively linked with the industry tariff, it is thus established that liberalization played a key role in reducing industry electricity prices in Singapore. The set H5b thus cannot be rejected for Singapore.
The association between the industry tariff in the Philippines and liberalization was assessed. Resulting regression results are presented through Model 14 in
Table 7. The Model 14 results show that the liberalization coefficient is statistically insignificant. It is thus concluded that liberalization did not play an important role in decreasing industry tariff in the Philippines.
The association between RE share and liberalization of the electricity market in Singapore was then assessed. Relevant regression results presented through Model 15 in
Table 8 show that the liberalization coefficient is statistically significant, and a positive relationship exists between liberalization and RE share in Singapore. It is thus concluded that liberalization contributed to improving RE share in Singapore. The set H6 thus cannot be rejected for Singapore.
Finally, the association between RE share,
emissions and liberalization in the Philippines was examined. The Model 16 test results in
Table 8 show that the liberalization coefficient is not statistically significant. It is thus concluded that liberalization did not improve RE share in the Philippines.
6. Summary Discussion and Policy Recommendations
6.1. Summary Discussion
The authors adopted a two-step approach. In Step 1, through regression analysis, statistically significant driving forces (controlling variables) for the formation of output variables (i.e., emissions, electricity prices and RE share) were identified separately for each country. This step established that increasing carbon pricing was an effective measure to reduce electricity generated emissions in Singapore, whereas, reducing the share of fossil fuel generated electricity was an effective measure in reducing electricity generated emissions in the Philippines. The study revealed that household electricity prices in Singapore are significantly linked with LNG gas prices, and annual population growth. In contrast, household electricity prices are linked to GDP per capita and oil prices in the Philippines. Gas prices and electricity consumption for industry act as controlling variables of industry electricity prices in Singapore. In contrast, in the Philippines, oil prices drive the industry electricity prices. It is noted that household and industry electricity prices in both countries are significantly linked with fluctuations in the prices of energy resources used for electricity generation. The study also revealed that RE share in Singapore is associated with the oil and gas prices in Singapore, whereas, in the Philippines, RE share is linked with the electricity generation related emissions.
In Step 2, the study assessed the impact of liberalization on emissions, electrical prices, and RE share in each country by including liberalization variables in the earlier models. Notice that variables identified in Step 1, were used to improve robustness of the regression analysis models and improve the Step 2 results.
The Step 2 results revealed that although in Singapore, liberalization did not contribute to reduction in electricity generated emissions, it was an effective measure in reducing both household and industry electricity prices and improving the RE share. In Singapore, competition for reduced electricity prices motivated electricity generating companies to switch from oil-fired electricity generation to more efficient gas-fired electricity generation. In 2020, natural gas formed 95.2% of Singapore’s electricity generation fuel mix. The use of gas as a cheaper fossil fuel type helped Singapore to lower wholesale electricity prices. On the retail side, consumers benefitted from a large pool of electricity retailers and different pricing plans. Indeed, as compared to the Philippines, Singapore made a late start towards electricity market liberalization but took a more a cautionary, measured, and systematic approach by implementing a necessary and effective framework and regulations for the promotion of competition and innovation, both at the wholesale and retail level.
In contrast to Singapore, electricity sector liberalization in the Philippines has moved forward slowly. The study results reveal that liberalization has contributed to raising household electricity prices. Furthermore, it has not shown any statistically significant effect to reduce the industry electricity prices. Generally, the rise in electricity prices in the Philippines is attributed to higher generation charges associated with increased WESM rates. Indeed, the electricity price paid by consumers in the Philippines does not reflect the true costs of generation and transmission of electricity, which includes substantial taxes and levies. In addition, some consumer groups often subsidize other consumer groups. The household consumers in Singapore have a wide range of options to choose their electricity supplier, however, this option is not available to household consumers in the Philippines. The Philippines electricity market is therefore not yet fully liberalized.
The results revealed that electricity market liberalization in the Philippines has contributed to electricity generated carbon emissions. In other words, liberalization failed to stop the increase in emissions but rather supported the percentage of fossil fuel generated electricity in the specified period. The rising carbon emissions can clearly be explained by over reliance on fossil fuel generated electricity and failure of policymakers in the Philippines to prioritize the sustainability goals.
To reduce electricity generated emissions, Singapore has imposed carbon pricing. However, the Philippines has not imposed any penalties on electricity generated emissions. This can be explained by the fact that carbon pricing raises wholesale electricity prices, which eventually lead to higher retail electricity prices. This conflict thus has clearly barred the Philippines from imposing carbon pricing as an effective tool to reduce electricity generated emissions.
RE based generation is the key to reducing electricity tariffs and lowering emissions. The results revealed that electricity market liberalization has not shown a statistically significant effect on RE share in the Philippines. The liberalization was thus not effective in increasing RE share in the electricity generation mix. Indeed, the development of RE based electricity generation does not come for free without government support, appropriate investment incentives, and imposition of penalties for carbon emissions arising from fossil-fuel generated electricity sources. Clearly, the above problems in the Philippines electricity market are due to electricity generation sector which is dominated with fossil fuel-based electricity generation plants. An unclear pathway about the RE future and absence of appropriate incentives was perhaps a restriction to RE share in the electricity generation mix. The Philippines should therefore develop a sustainable and optimal energy mix policy to support reductions and improve RE share. Accordingly, strong support for more accessible financing and promotion of RE from all stakeholders is very vital.
A close analysis of the Philippines electricity market reveals that the electricity sector is fully privatized. However, MERALCO holds 80% of the market share and retail competition is only available to large customers. Residential and small commercial groups of retail customers are held captive by MERALCO. These customer groups have no choice but to buy power from MERALCO. The continued dominance of the market by MERALCO and unwillingness to open the retail electricity market to small customers is one of the main barriers towards a fully liberalized electricity market that could reveal the true electricity prices at competitive rates to the electricity customers. MERALCO’s continued dominance of the electricity market and absence of a fully liberalized electricity market has eventually driven potential private investors away from the Philippines electricity market.
On the other hand, Singapore’s electricity market is fully liberalized. It has gradually expanded retail competition opportunities to customer groups that consume smaller amounts of power. In Singapore electricity customers are not offered subsidies but the arrangement is quite different from the Philippines. To protect customers from high market prices, regulated default pricing is mixed with retail competition. As a default option, residential consumers in Singapore can buy electricity at EMA regulated tariff from SP Group (government-affiliated electricity and gas distribution company). The tariff set by SP Group is reviewed on a quarterly basis and regulated by EMA to reflect the actual cost of electricity. This model provides a good example of protecting customers from high electricity market rates and is generally acceptable in Singapore. However, if SP group decides to provide regulated prices lower than the market prices then retail competition will not be successful in Singapore.
6.2. Policy Recommendations
From the results and discussions above, the authors draw the following important policy recommendations that can be useful in striking a balance between the expected outcomes in ASEAN liberalized electricity markets:
Lack of regulatory framework harmonization can be harmful to the expected outcomes. Policy makers should therefore carry out electricity market liberalization initiatives in ASEAN in conjunction with measures to implement RE, and trading of emissions.
The decrease of emissions and improvement in RE sources is related with the increase of consumer electricity prices. Conflicts can arise between these expected outcomes. Policy makers should therefore strike a tradeoff between the three expected outcomes when deciding on a model for electricity market liberalization.
Different electricity market liberalization effects in Singapore and the Philippines are due to characteristics of these countries and associated liberalization models. Policy makers should therefore pay careful attention to the selection of a liberalization model and carefully tailor the reforms relevant to the expected outcomes.
Meeting the targets of low-cost electricity, RE share and
emission can be quite challenging for some regional ASEAN countries. The interconnection of the regional electricity market through the ASEAN power grid (APG) can help solve this challenge in a secure, sustainable, and cost-effective manner. The study in [
73] suggests that free movement of electricity through the APG could help Vietnam, Thailand, Peninsular Malaysia, Singapore, and Luzon (Philippines) to import hydroelectric generated electricity from Myanmar, Lao PDR, Cambodia, Batam (Indonesia), and Sarawak (Malaysia); and geothermal generated electricity from Sumatra (Indonesia). The ASEAN countries should therefore tap on cross-border electricity RE delivery through ASEAN grid and establish competitive regional wholesale energy markets to achieve further cost reductions along with reduction in emissions and improvement in RE.
Retail competition is an effective way to reduce costs for end-use customers. The policy makers should therefore devise a framework allowing household consumers in the Philippines to choose their electricity supplier freely.
Electricity from RE sources such as solar has not yet played a major role in Singapore under the liberalized electricity market. In 2021, it consisted of 2.83% of the total generation capacity in Singapore. Furthermore, RE share in the Philippines has decreased from 33.7% in 2005. In terms of energy output in the Philippines there is also a decline of 21.2%. Policy makers in Singapore are required to set up laws binding electricity generators to generate a certain portion through PV sources. New reforms in the electricity legal framework are thus required to promote RE share in the region.
Solar energy is little costly because solar power programs need substantial initial capital [
74]. Several research findings have reported a negative relationship between cost and social acceptance of solar energy [
75,
76,
77,
78,
79,
80]. Consequently, the ASEAN governments should introduce subsidy plans and provide financial incentives to motivate domestic users to adopt solar energy.
To improve the RE share in the electricity generation mix, it is important for electricity consumers to accept and utilize RE generation technologies (RETs). Recent studies have analyzed consumer intention to use RETs in developing countries [
81,
82,
83,
84,
85,
86,
87]. These studies demonstrate that financial incentives, government subsidies, price reduction, perceived behavioral control, simplicity of use, income level, energy crisis, and relative benefits of RETs are important influencing factors for RE adoption by consumers. In [
82], Irfan et al. demonstrated that consumers’ intention to utilize RE is positively and significantly influenced by their awareness, perception of self-effectiveness, and perception about neighbor participation. The study also revealed that beliefs about RE benefits and environmental concern do not significantly influence consumers’ intention to use RE. Indeed, consumers’ unawareness of RE benefits and environmental concerns are major barriers for RE adoption in developing countries. The ASEAN governments, non-governmental organizations (NGOs) and public and private institutions should therefore emphasize on the benefits of RE (such as climate change mitigation, reducing air pollution, and improving human health conditions) through awareness sessions, workshops, and campaigns.
To minimize production costs and reliance on imported RETs, it is important for ASEAN governments to invest in RET focused R&D activities. In addition, it is equally important for ASEAN energy technology companies, R&D institutes, and universities to engage in cutting edge RET focused R&D activities.
Policy makers should devise a legal framework that should allowed for IPPs, especially in the renewables sector, to feed electricity into the grid and market it themselves or through direct marketers.
Carbon pricing consisting of carbon taxes and emissions trading systems (ETS) is an effective policy tool to reduce the emissions by old and inefficient power plants. Carbon taxes consist of direct taxation on emissions, whereas ETS are market-based tools that create incentives to reduce emissions. Policy makers in ASEAN countries should set an emissions cap in one or more sectors that would determine the maximum amount of GHGs that can be emitted in the sectors covered by the ETS, and the entities that are covered should be allowed to trade emissions permits.
Carbon pricing policies should be implemented alongside policies that promote RE sources for electricity generation and liberalization reforms. It is important to understand the interlinkage of an ETS with these policies because it can speed up or hinder clean energy transitions.
In the Philippines, the state intervenes in the final price by introducing domestic taxes and subsidies. This step abolishes the effects of the market liberalization and competition. Therefore, electricity market liberalization in the Philippines does not have the same significance as in Singapore and an ETS would not yield expected results. For an ETS to achieve emission reductions at least cost, policy makers must ensure that markets function freely in a competitive environment and transmit uniform and non-distorted electricity price signals to all decision makers in the economy.
7. Conclusions
This study has assessed the effects of the liberalization of ASEAN electricity markets on electricity prices, electricity generated emissions, and RE share in the electricity generation mix during the period 2015–2020. The study was focused on Singapore and the Philippines as they operate liberalized electricity markets in the ASEAN region.
The findings of this study suggest that liberalized electricity markets do not necessarily reduce electricity prices and electricity generated emissions and improve the RE share in the electricity generation mix. Affordable electricity prices with acceptable emission reduction and RE integration can only be achieved with an affective regulatory framework, removal of taxes, levies and subsidies, and comprehensive and carefully balanced policy interventions towards integration of effective carbon pricing and RE sources in liberalized electricity markets. The electricity market liberalization steps thus need to be followed by effective regulatory framework, regulations, and carefully balanced policy interventions. For the uptake of RETs, ASEAN governments should also support these efforts with financial incentives and subsidies for the use of RETs, R&D investments in RETs, and public and private sector drives for improving consumers’ awareness of RE benefits and environmental issues.
The suggested policy recommendations are aimed at ASEAN countries to strike a balance between the expected outcomes in ASEAN liberalized electricity markets. In view of these recommendations, it is in the best interest of ASEAN countries to prudently put in place necessary and effective framework and regulations to ensure the full benefits of liberalization.
The study is not without its limitations. The sample data size used in Step 2 regression analysis was based on large effect size. A different data sample thus could have a large impact on the outcomes of Step 2 regression analysis. This limitation could be avoided by using monthly data instead of the yearly data. However, monthly data was not available for most of the predictors. Therefore, this study was based on yearly data.
The liberalization of electricity sectors has progressed in both countries at varying speeds. The road to liberalization in Singapore was smooth but, in the Philippines, the road to liberalization has been rough and challenging, requiring various delays and compromises. These liberalization developments will thus necessitate further innovations to achieve expected outcomes. Furthermore, liberalization effects are expected with some delay due to different characteristics of countries and liberalization models. The available evidence may not be sufficient at this stage to build a comprehensive judgment. Thus, in the long run, liberalization may yield the desired results.
There is still much room for improvement within the models and future research should incorporate additional data on political, social, economic, plant capital costs, and demographic variables to assess liberalization effects on the expected outcomes.


