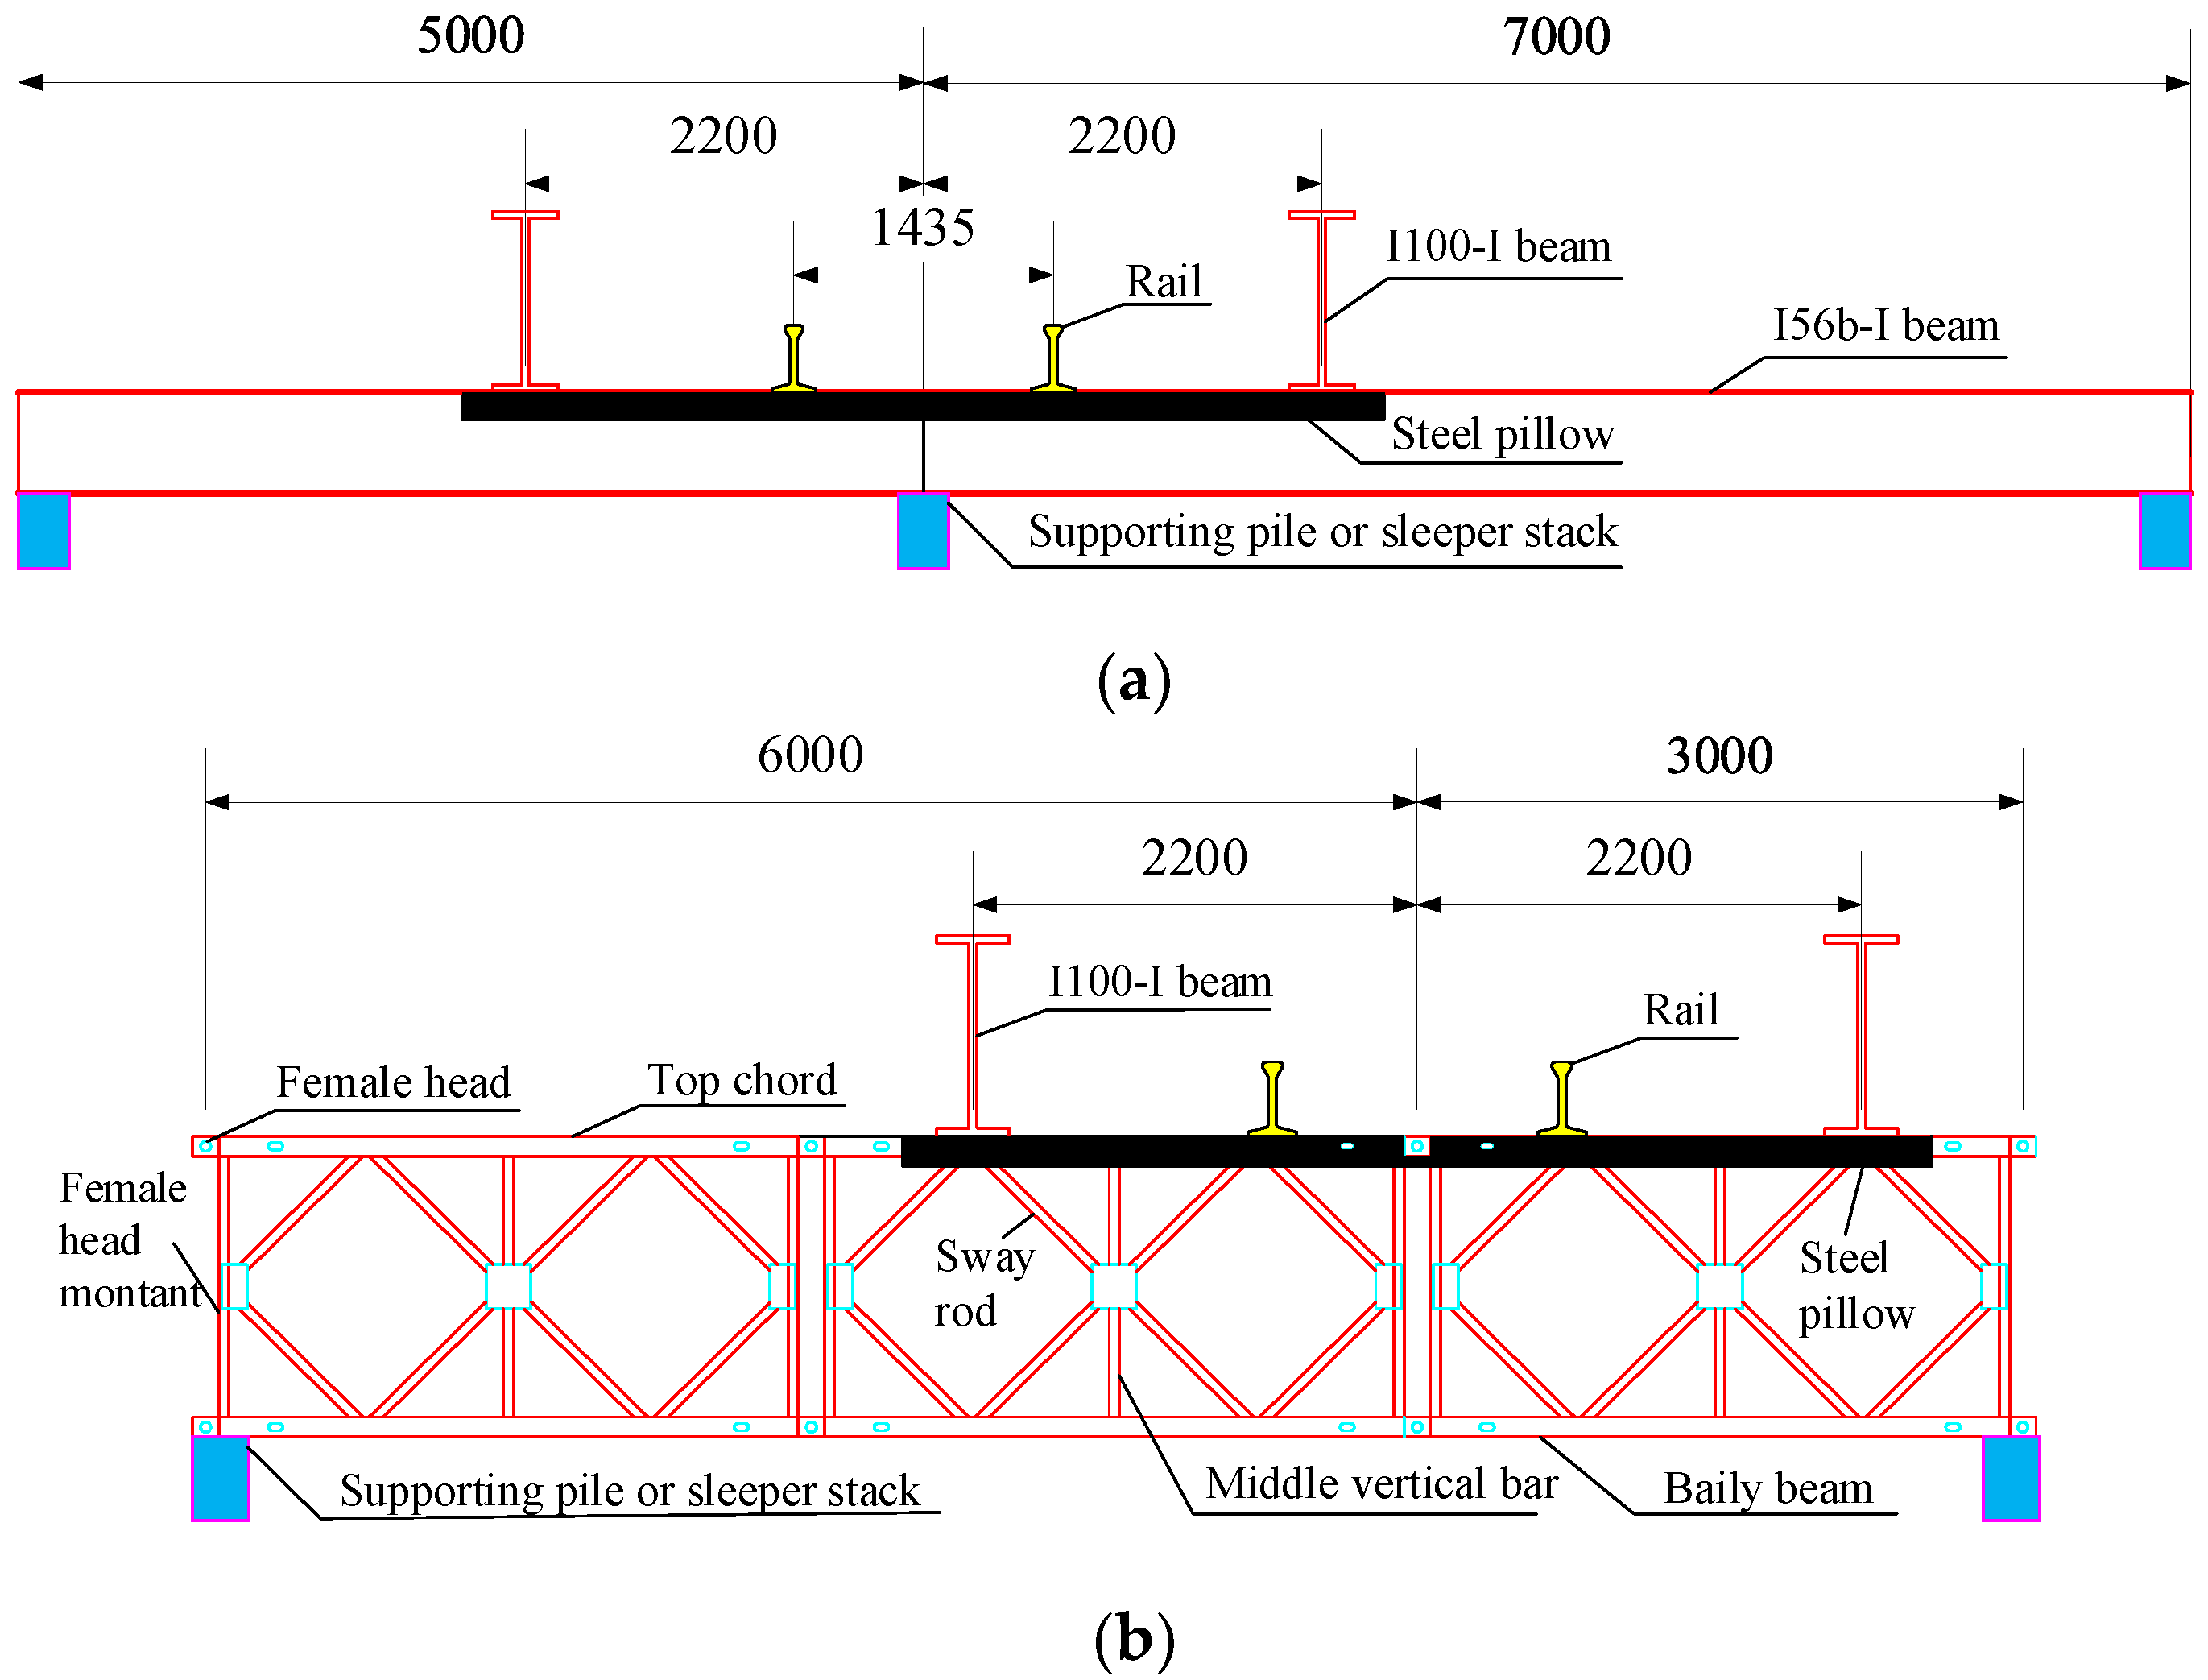
Figure 1.
Cross-section of an overhead system (unit: mm): (a) Cross-section of type I overhead system. (b) Cross-section of type II overhead system.
Figure 1.
Cross-section of an overhead system (unit: mm): (a) Cross-section of type I overhead system. (b) Cross-section of type II overhead system.
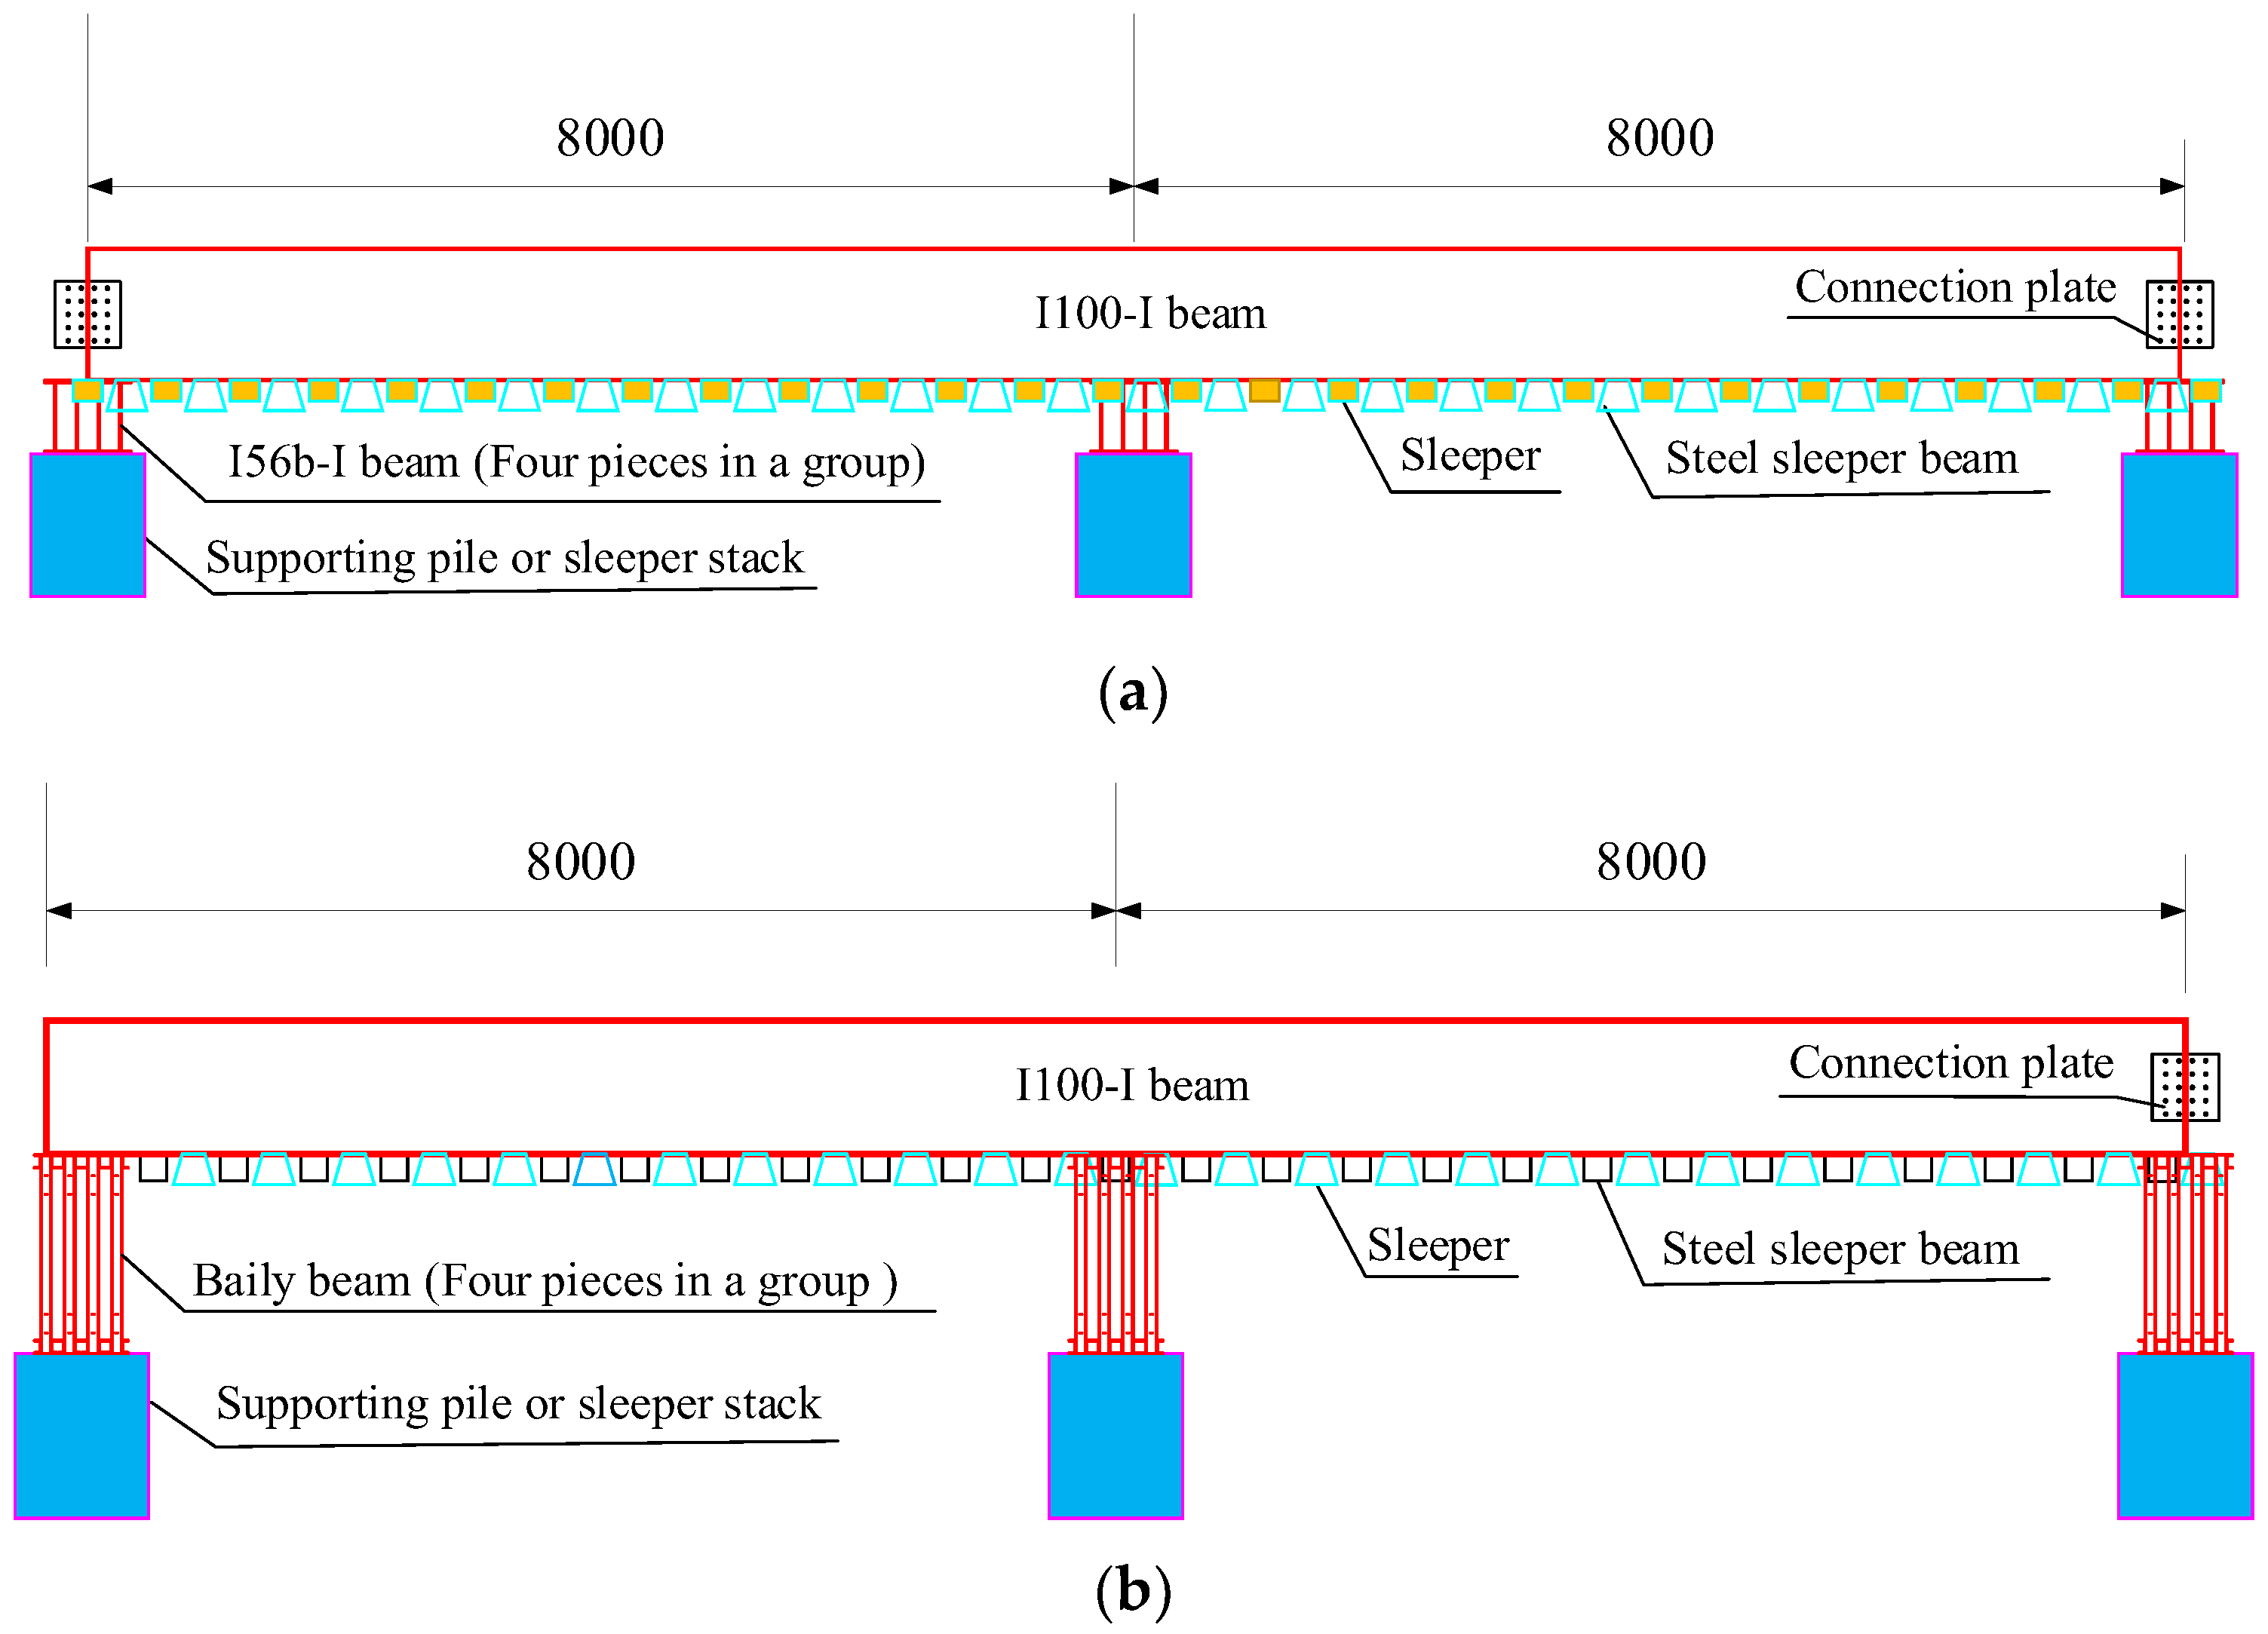
Figure 2.
Elevation of the overhead system (unit: mm): (a) Elevation of type I overhand system. (b) Elevation of type II overhand system.
Figure 2.
Elevation of the overhead system (unit: mm): (a) Elevation of type I overhand system. (b) Elevation of type II overhand system.
Figure 3.
Model of equivalent rectangular rail beam (unit: m).
Figure 3.
Model of equivalent rectangular rail beam (unit: m).
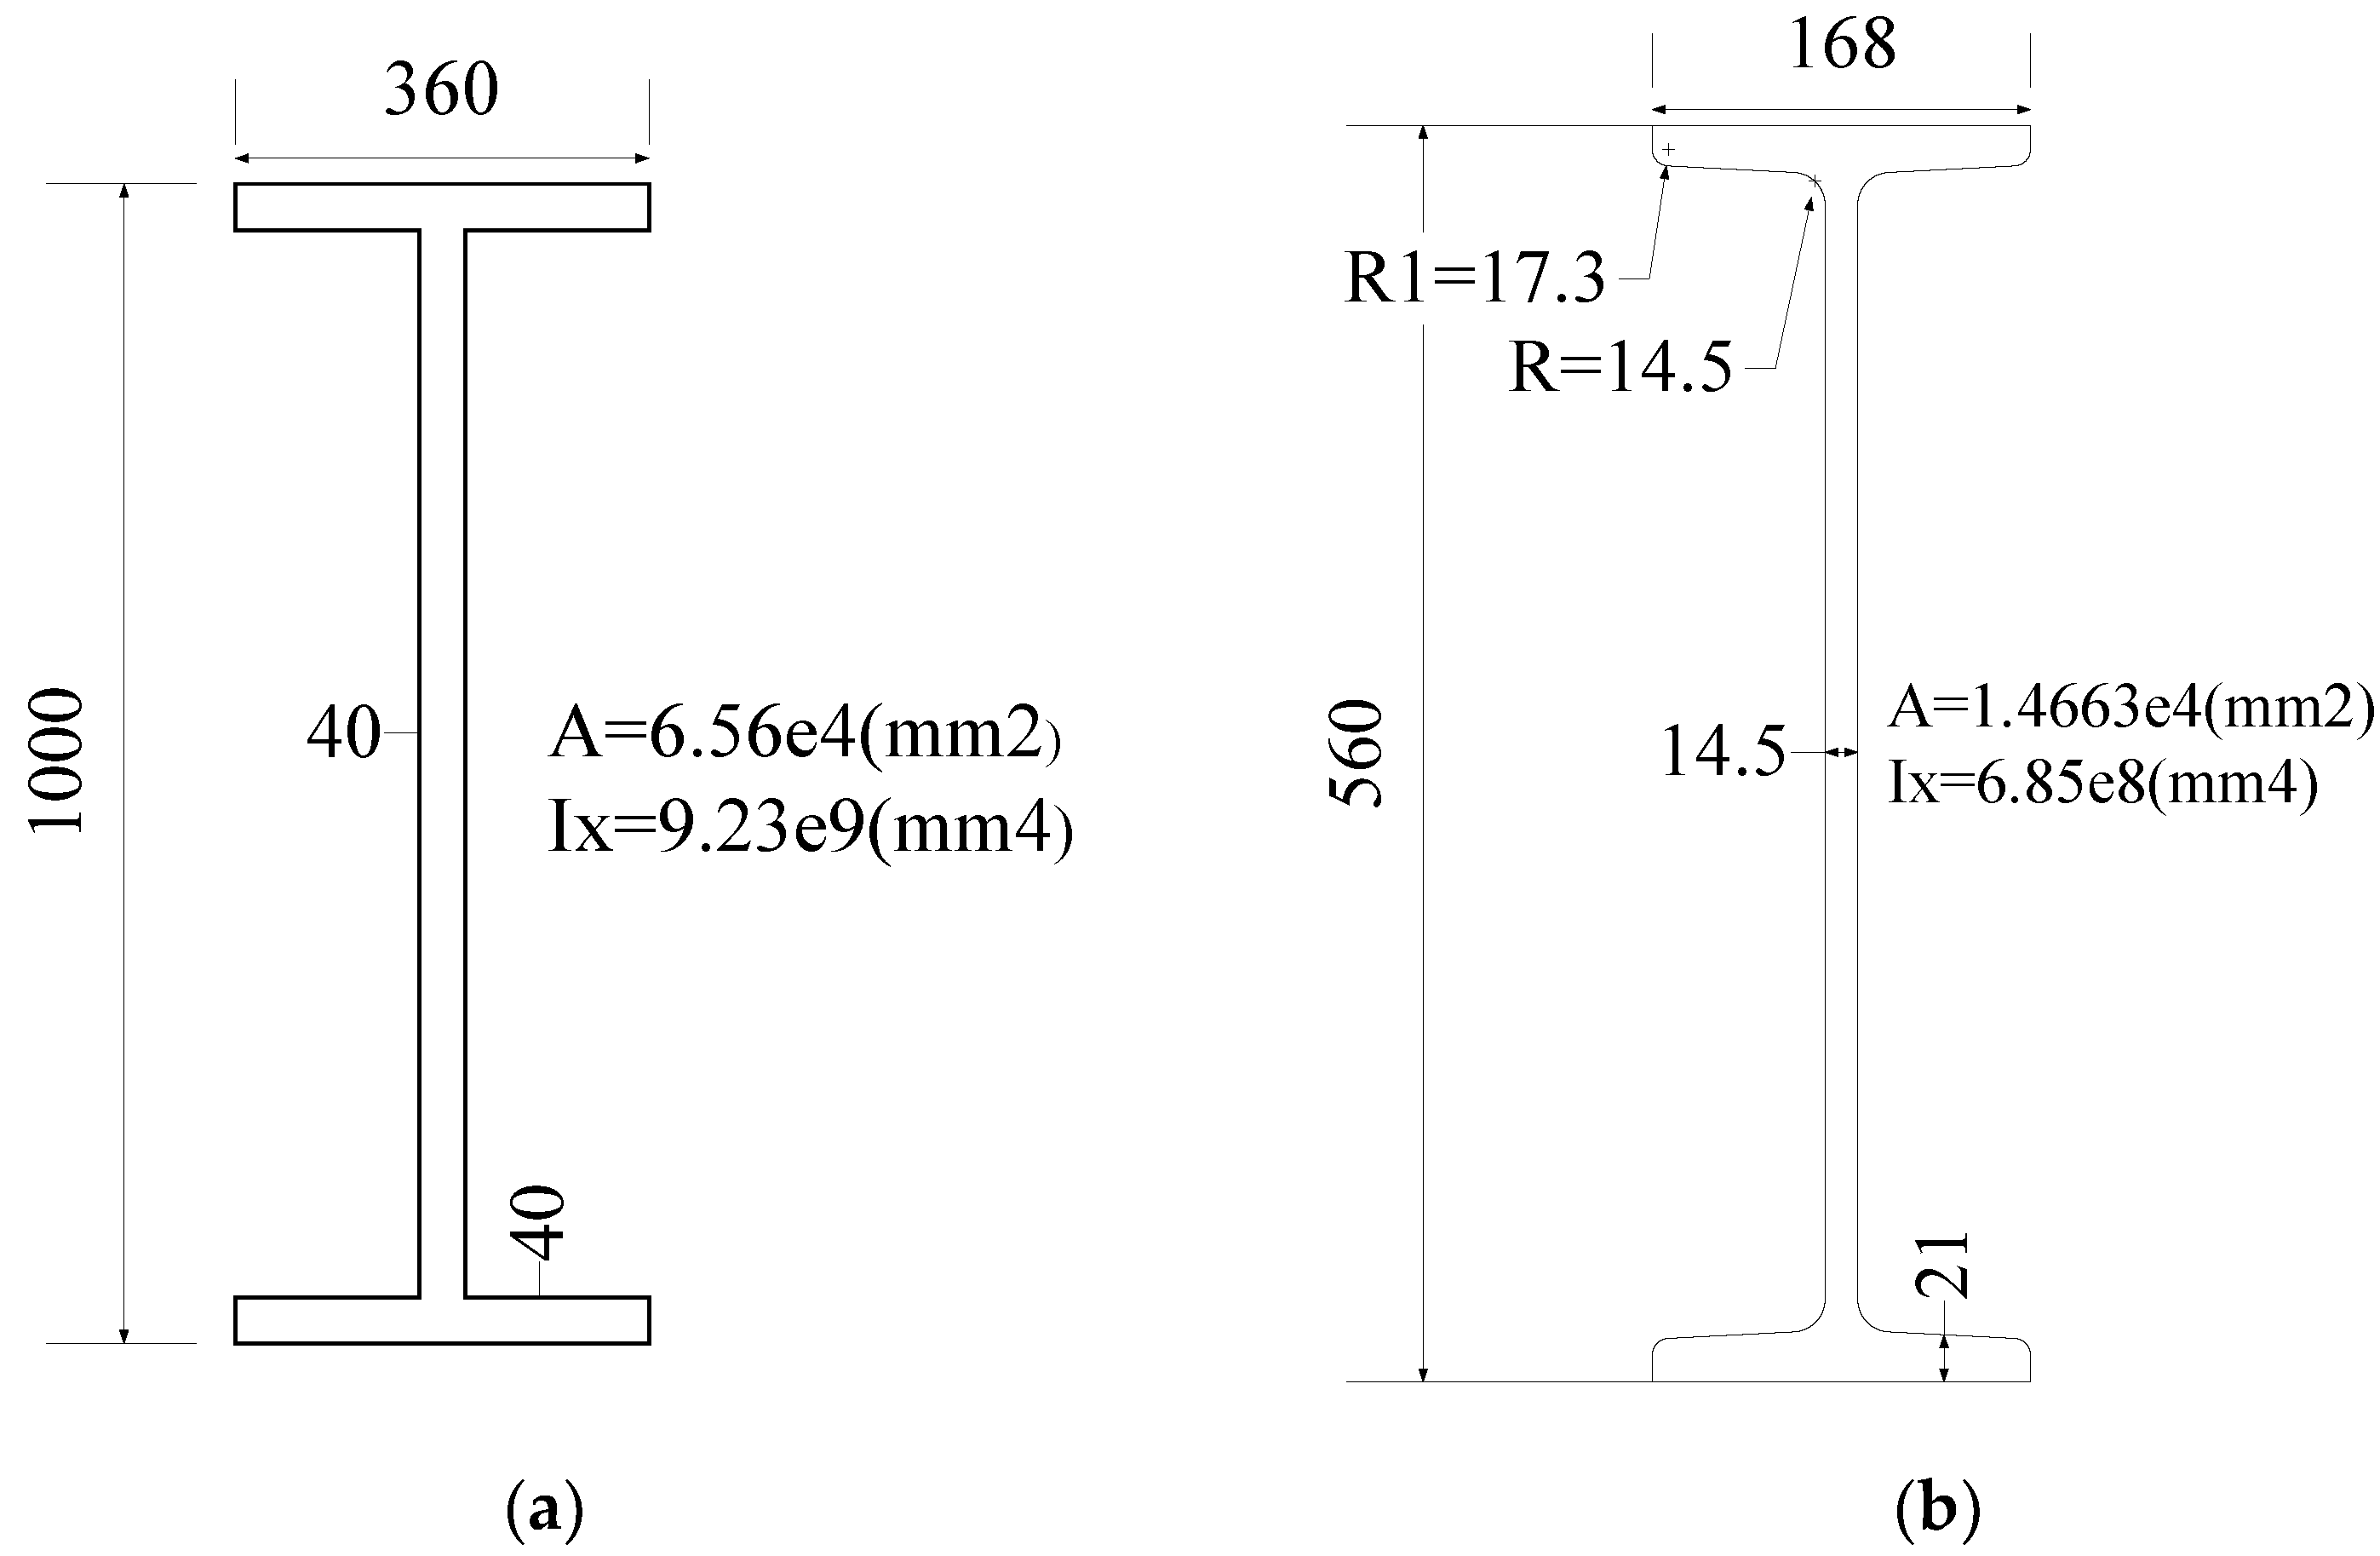
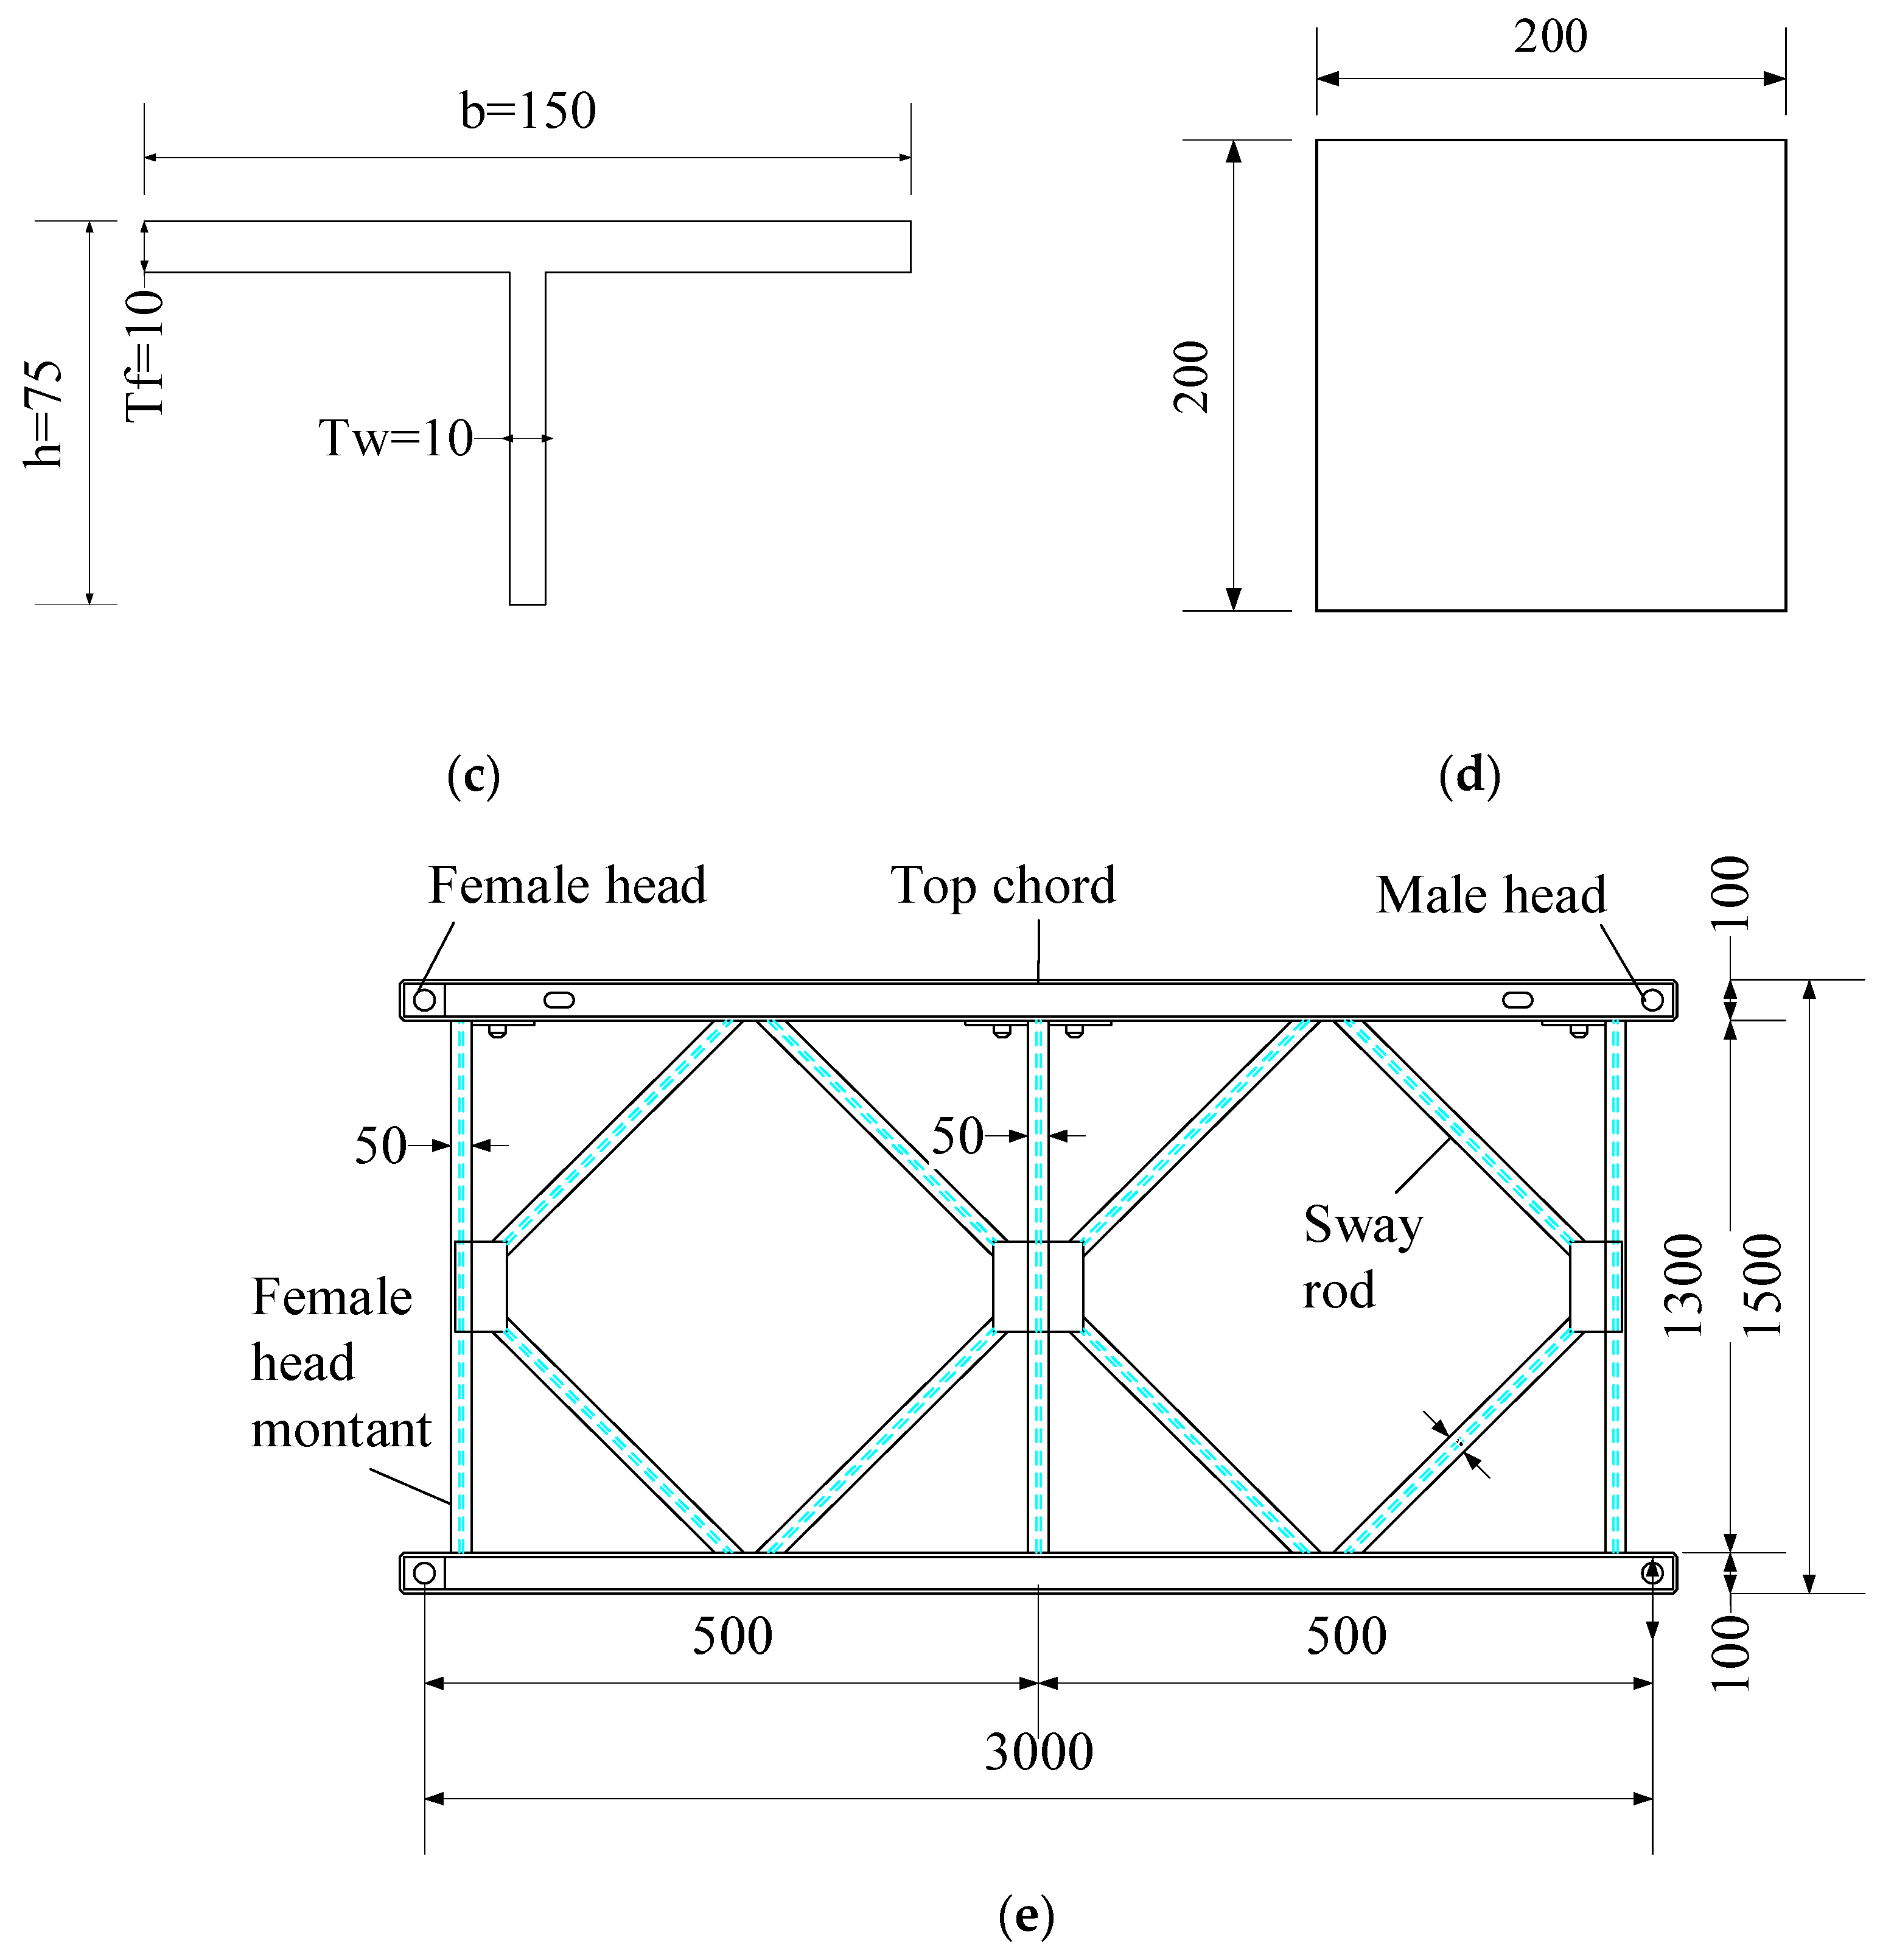
Figure 4.
Material dimension details (unit: mm): (a) I100-I beam. (b) I56b-I beam. (c) T75 steel. (d) Steel sleeper beam (B200 × 200 × 480). (e) A section of Bailey.
Figure 4.
Material dimension details (unit: mm): (a) I100-I beam. (b) I56b-I beam. (c) T75 steel. (d) Steel sleeper beam (B200 × 200 × 480). (e) A section of Bailey.
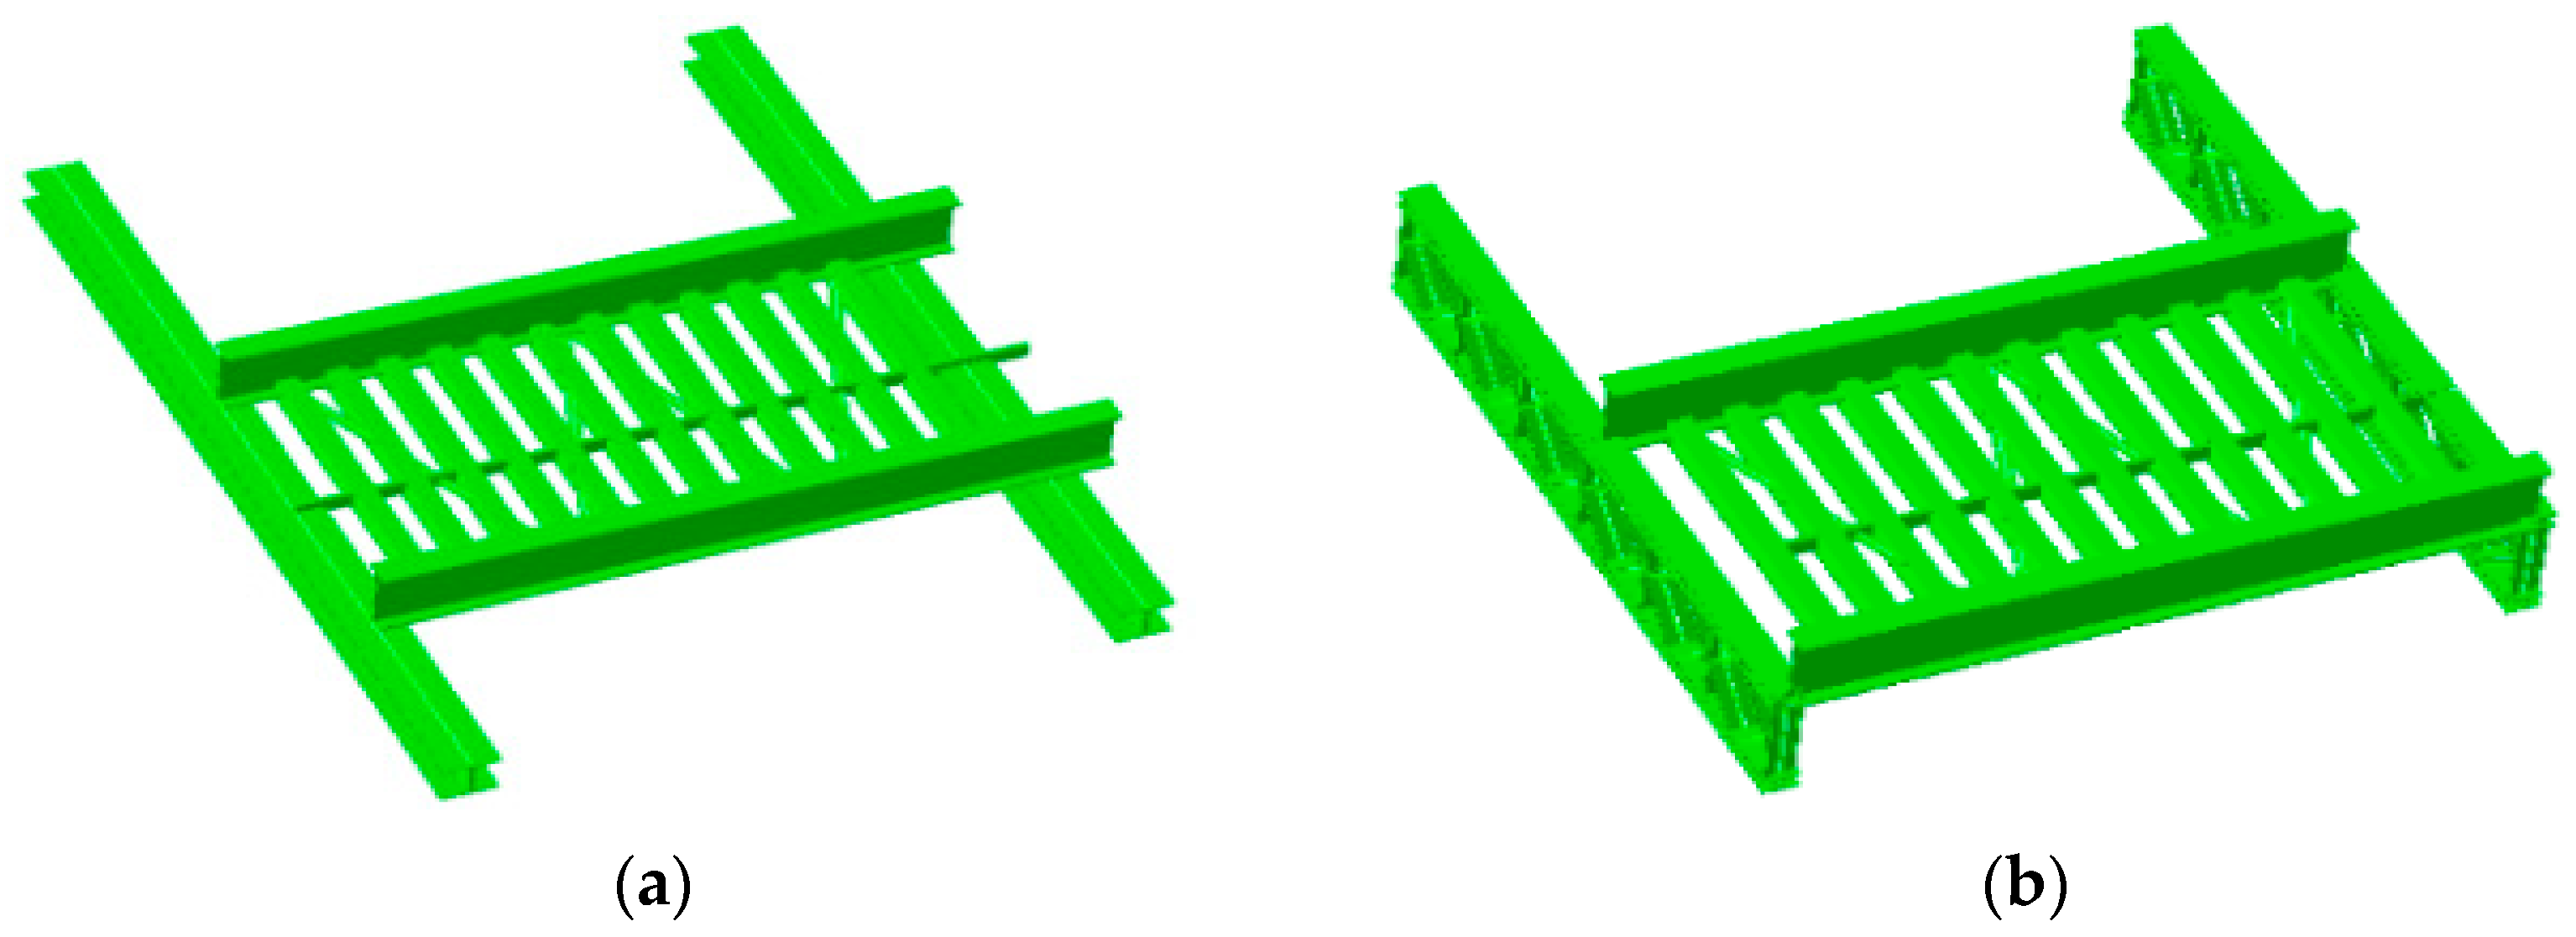
Figure 5.
One-span model diagram of track and overhead system: (a) A cross model diagram type I aerial system. (b) A cross model diagram type II aerial system.
Figure 5.
One-span model diagram of track and overhead system: (a) A cross model diagram type I aerial system. (b) A cross model diagram type II aerial system.
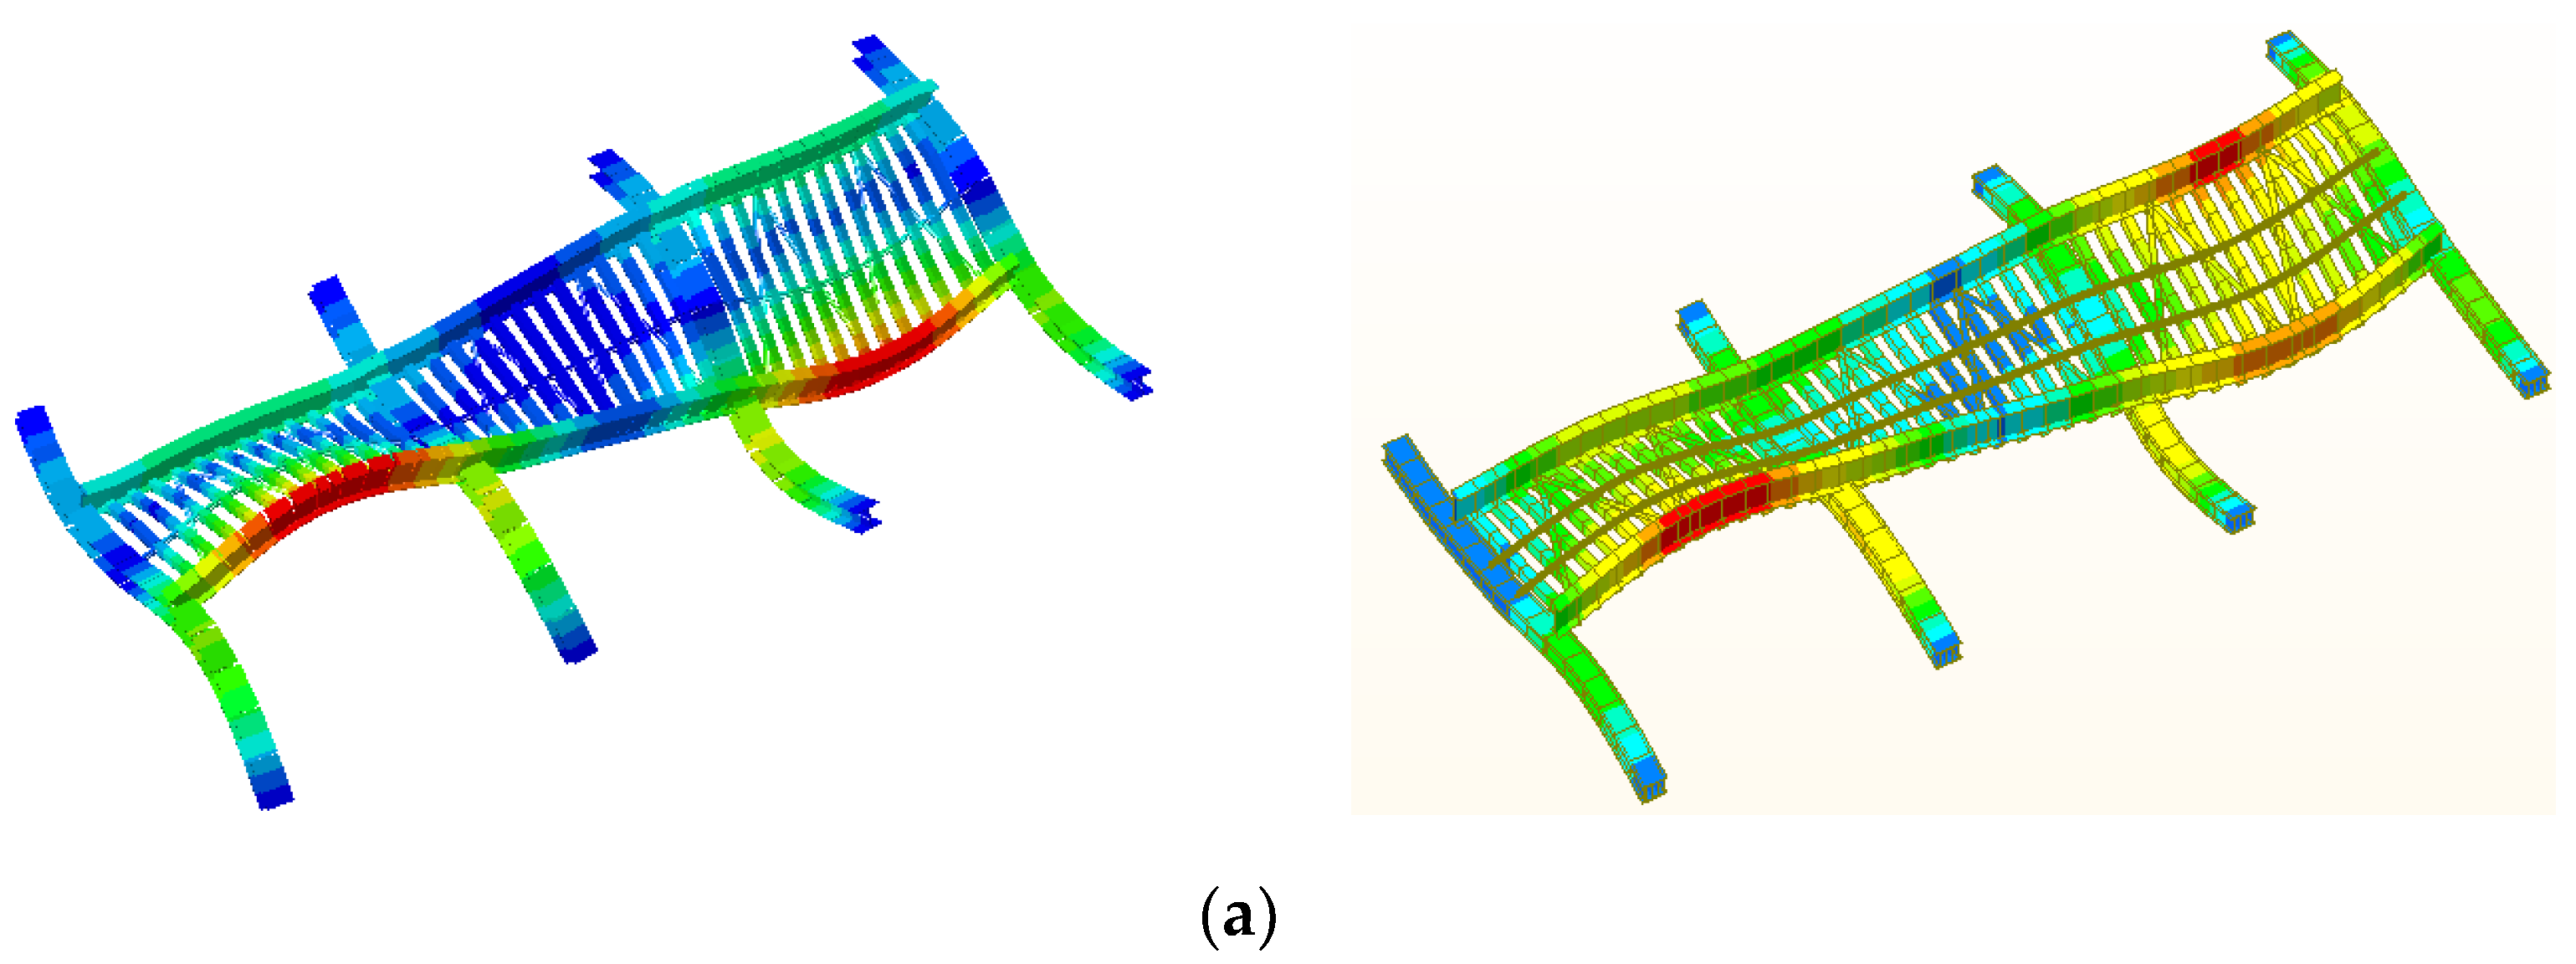
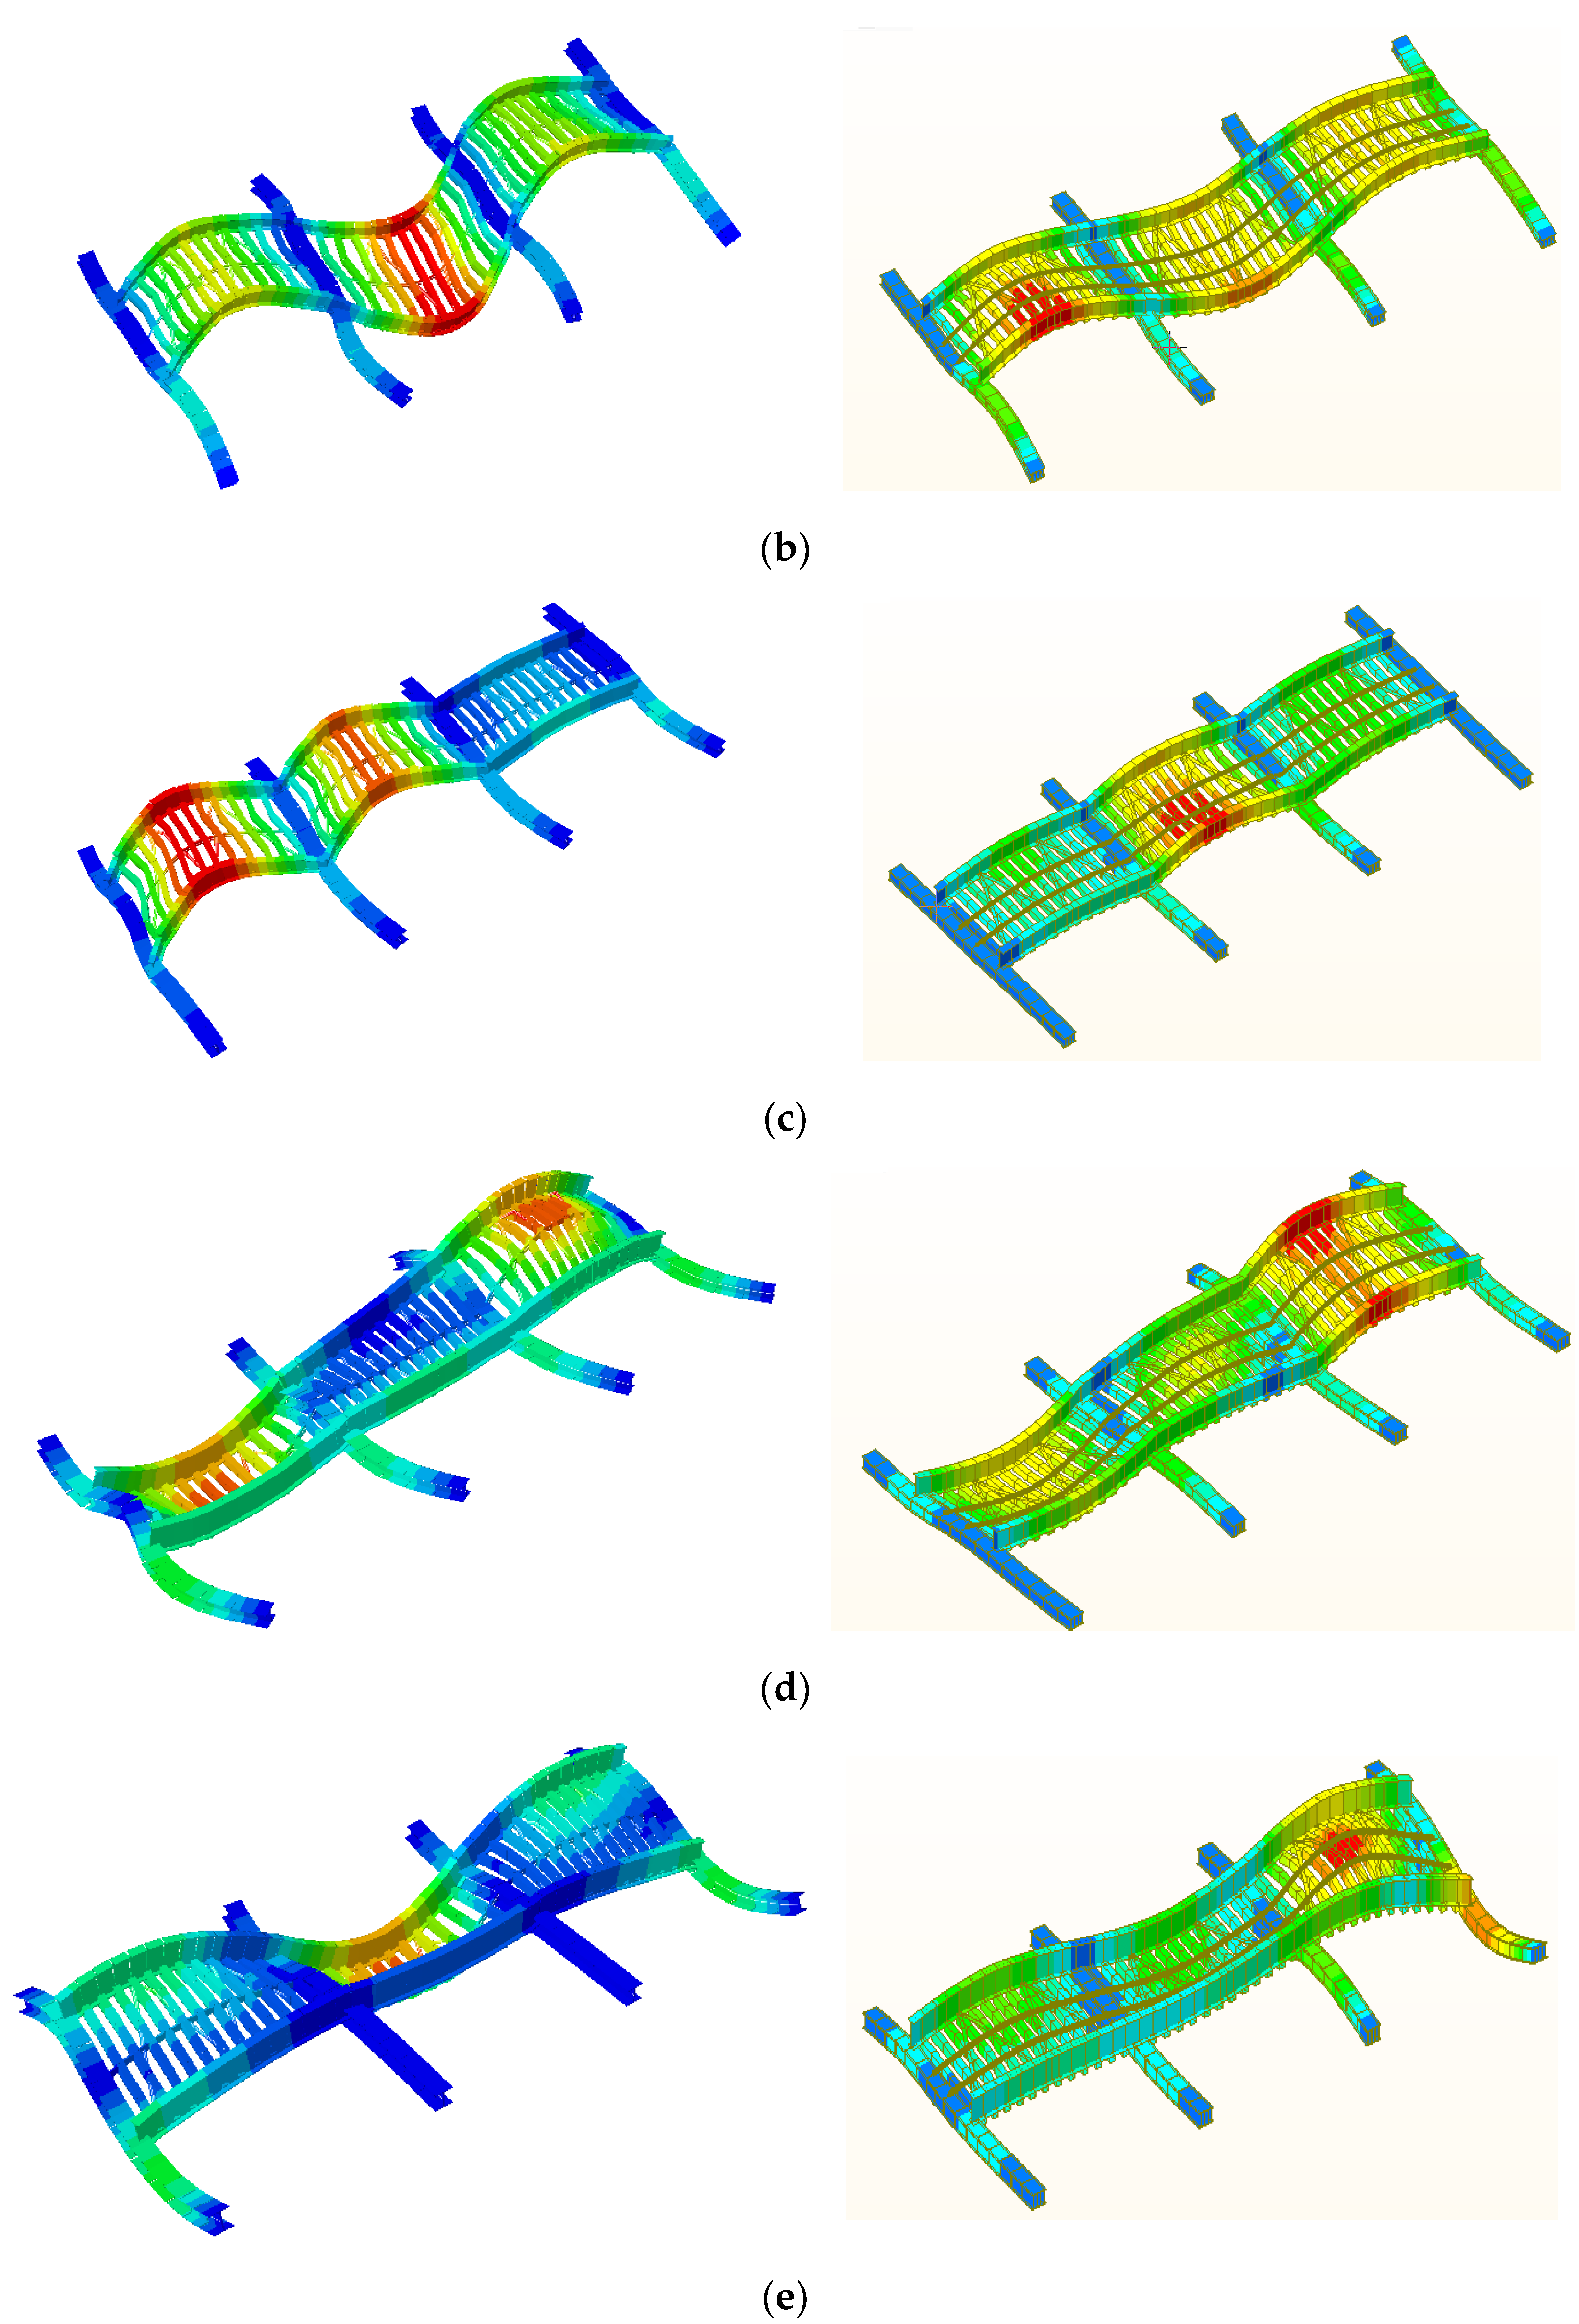
Figure 6.
Comparison of vibration modes calculated by ABAQUS and Midas: (a) First order mode. (b) Second order mode. (c) Three order mode. (d) Four order mode. (e) Five order mode.
Figure 6.
Comparison of vibration modes calculated by ABAQUS and Midas: (a) First order mode. (b) Second order mode. (c) Three order mode. (d) Four order mode. (e) Five order mode.
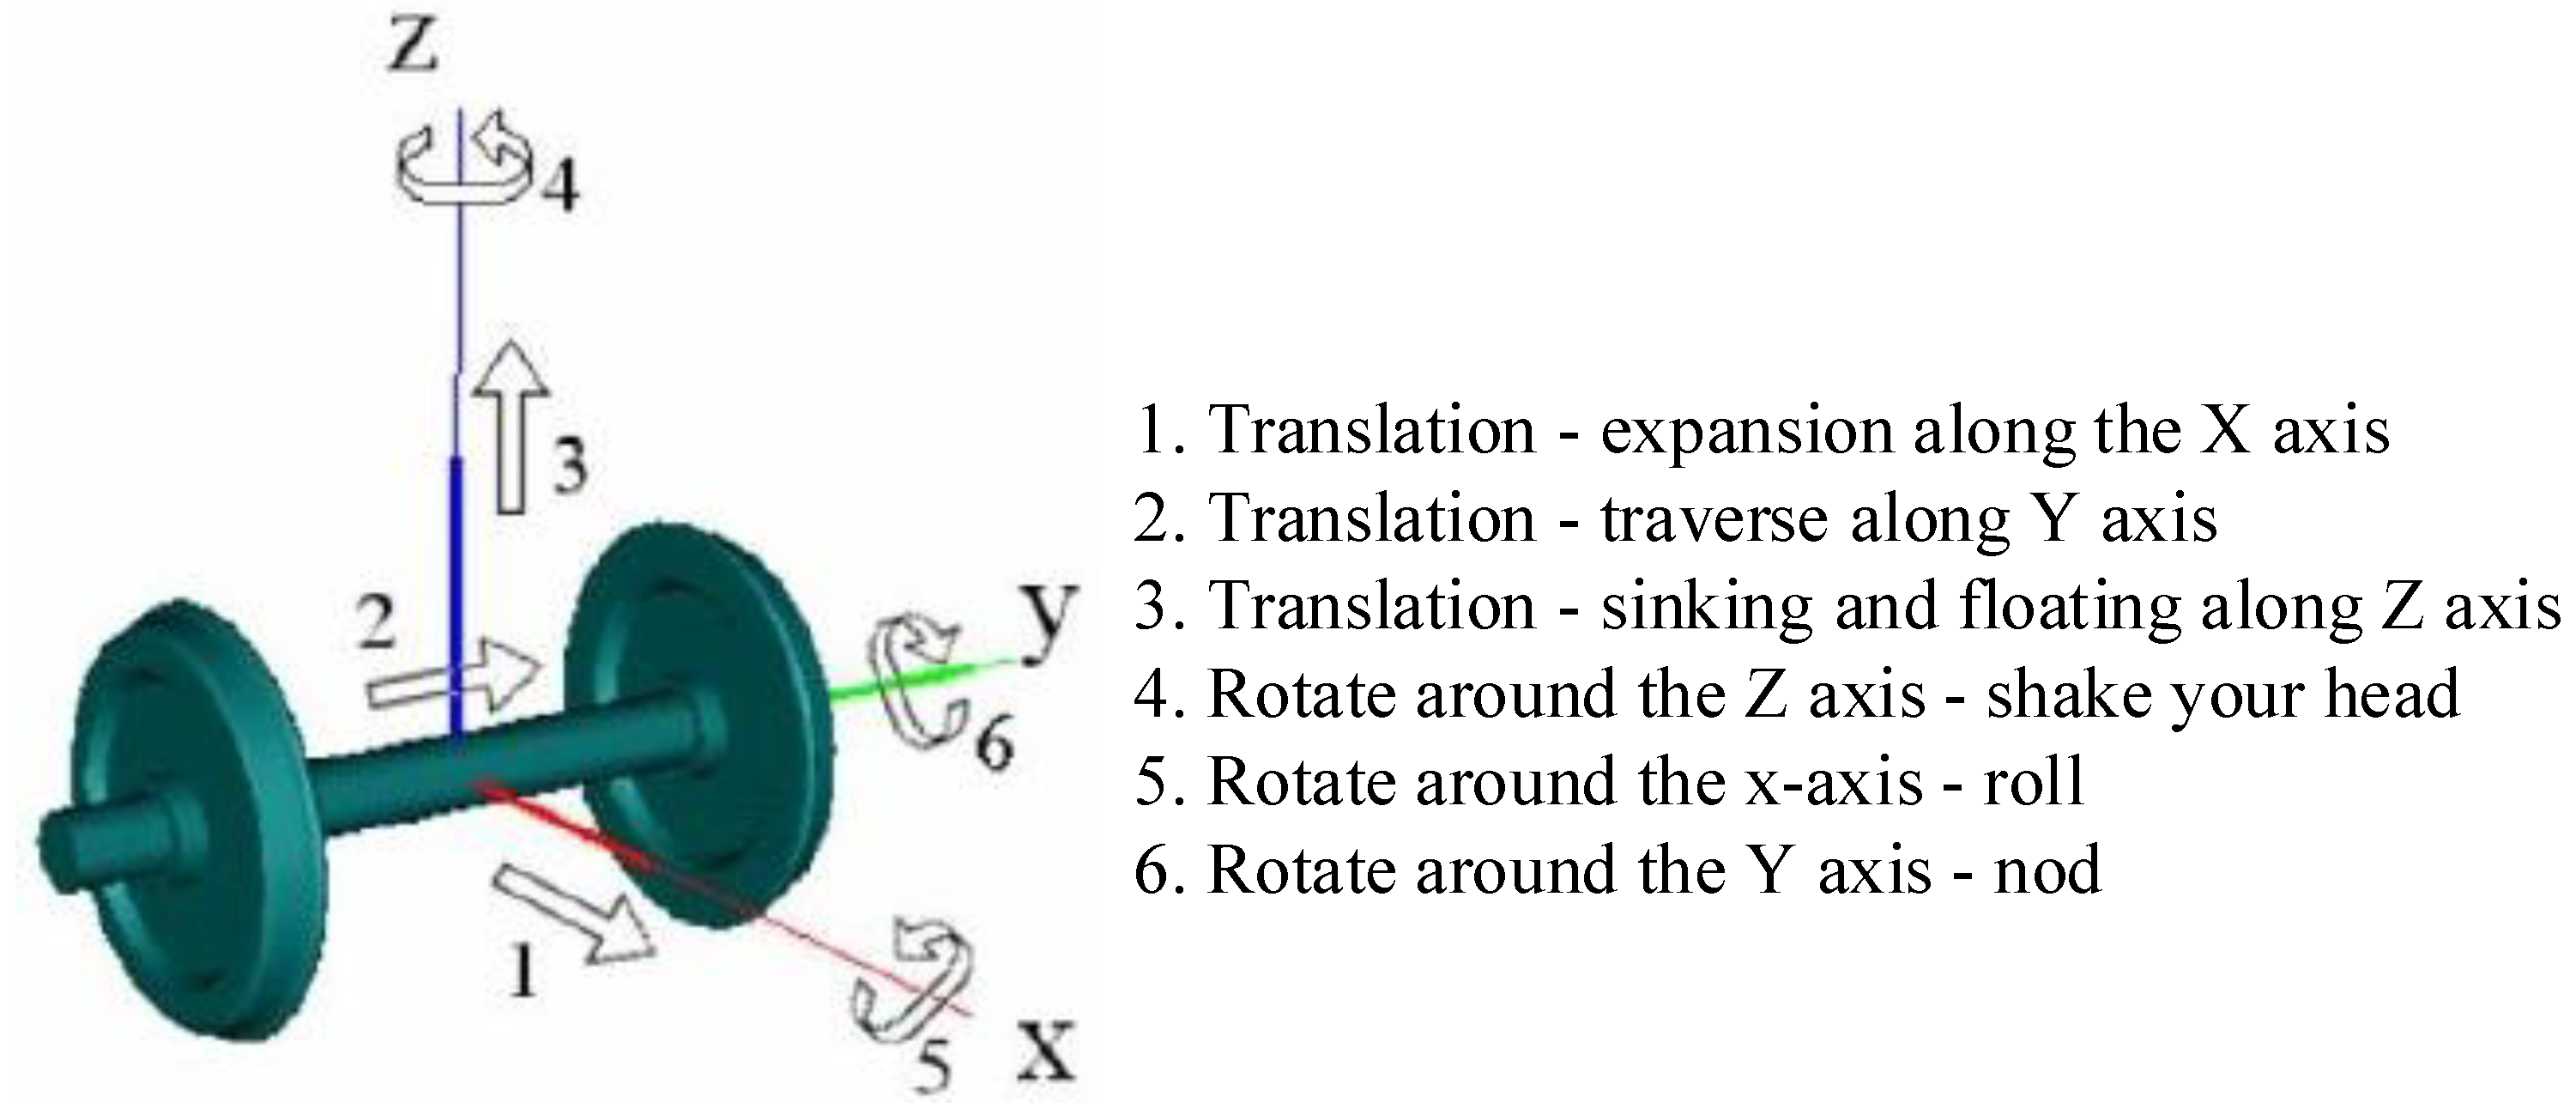
Figure 7.
Wheel set with six degrees of freedom.
Figure 7.
Wheel set with six degrees of freedom.
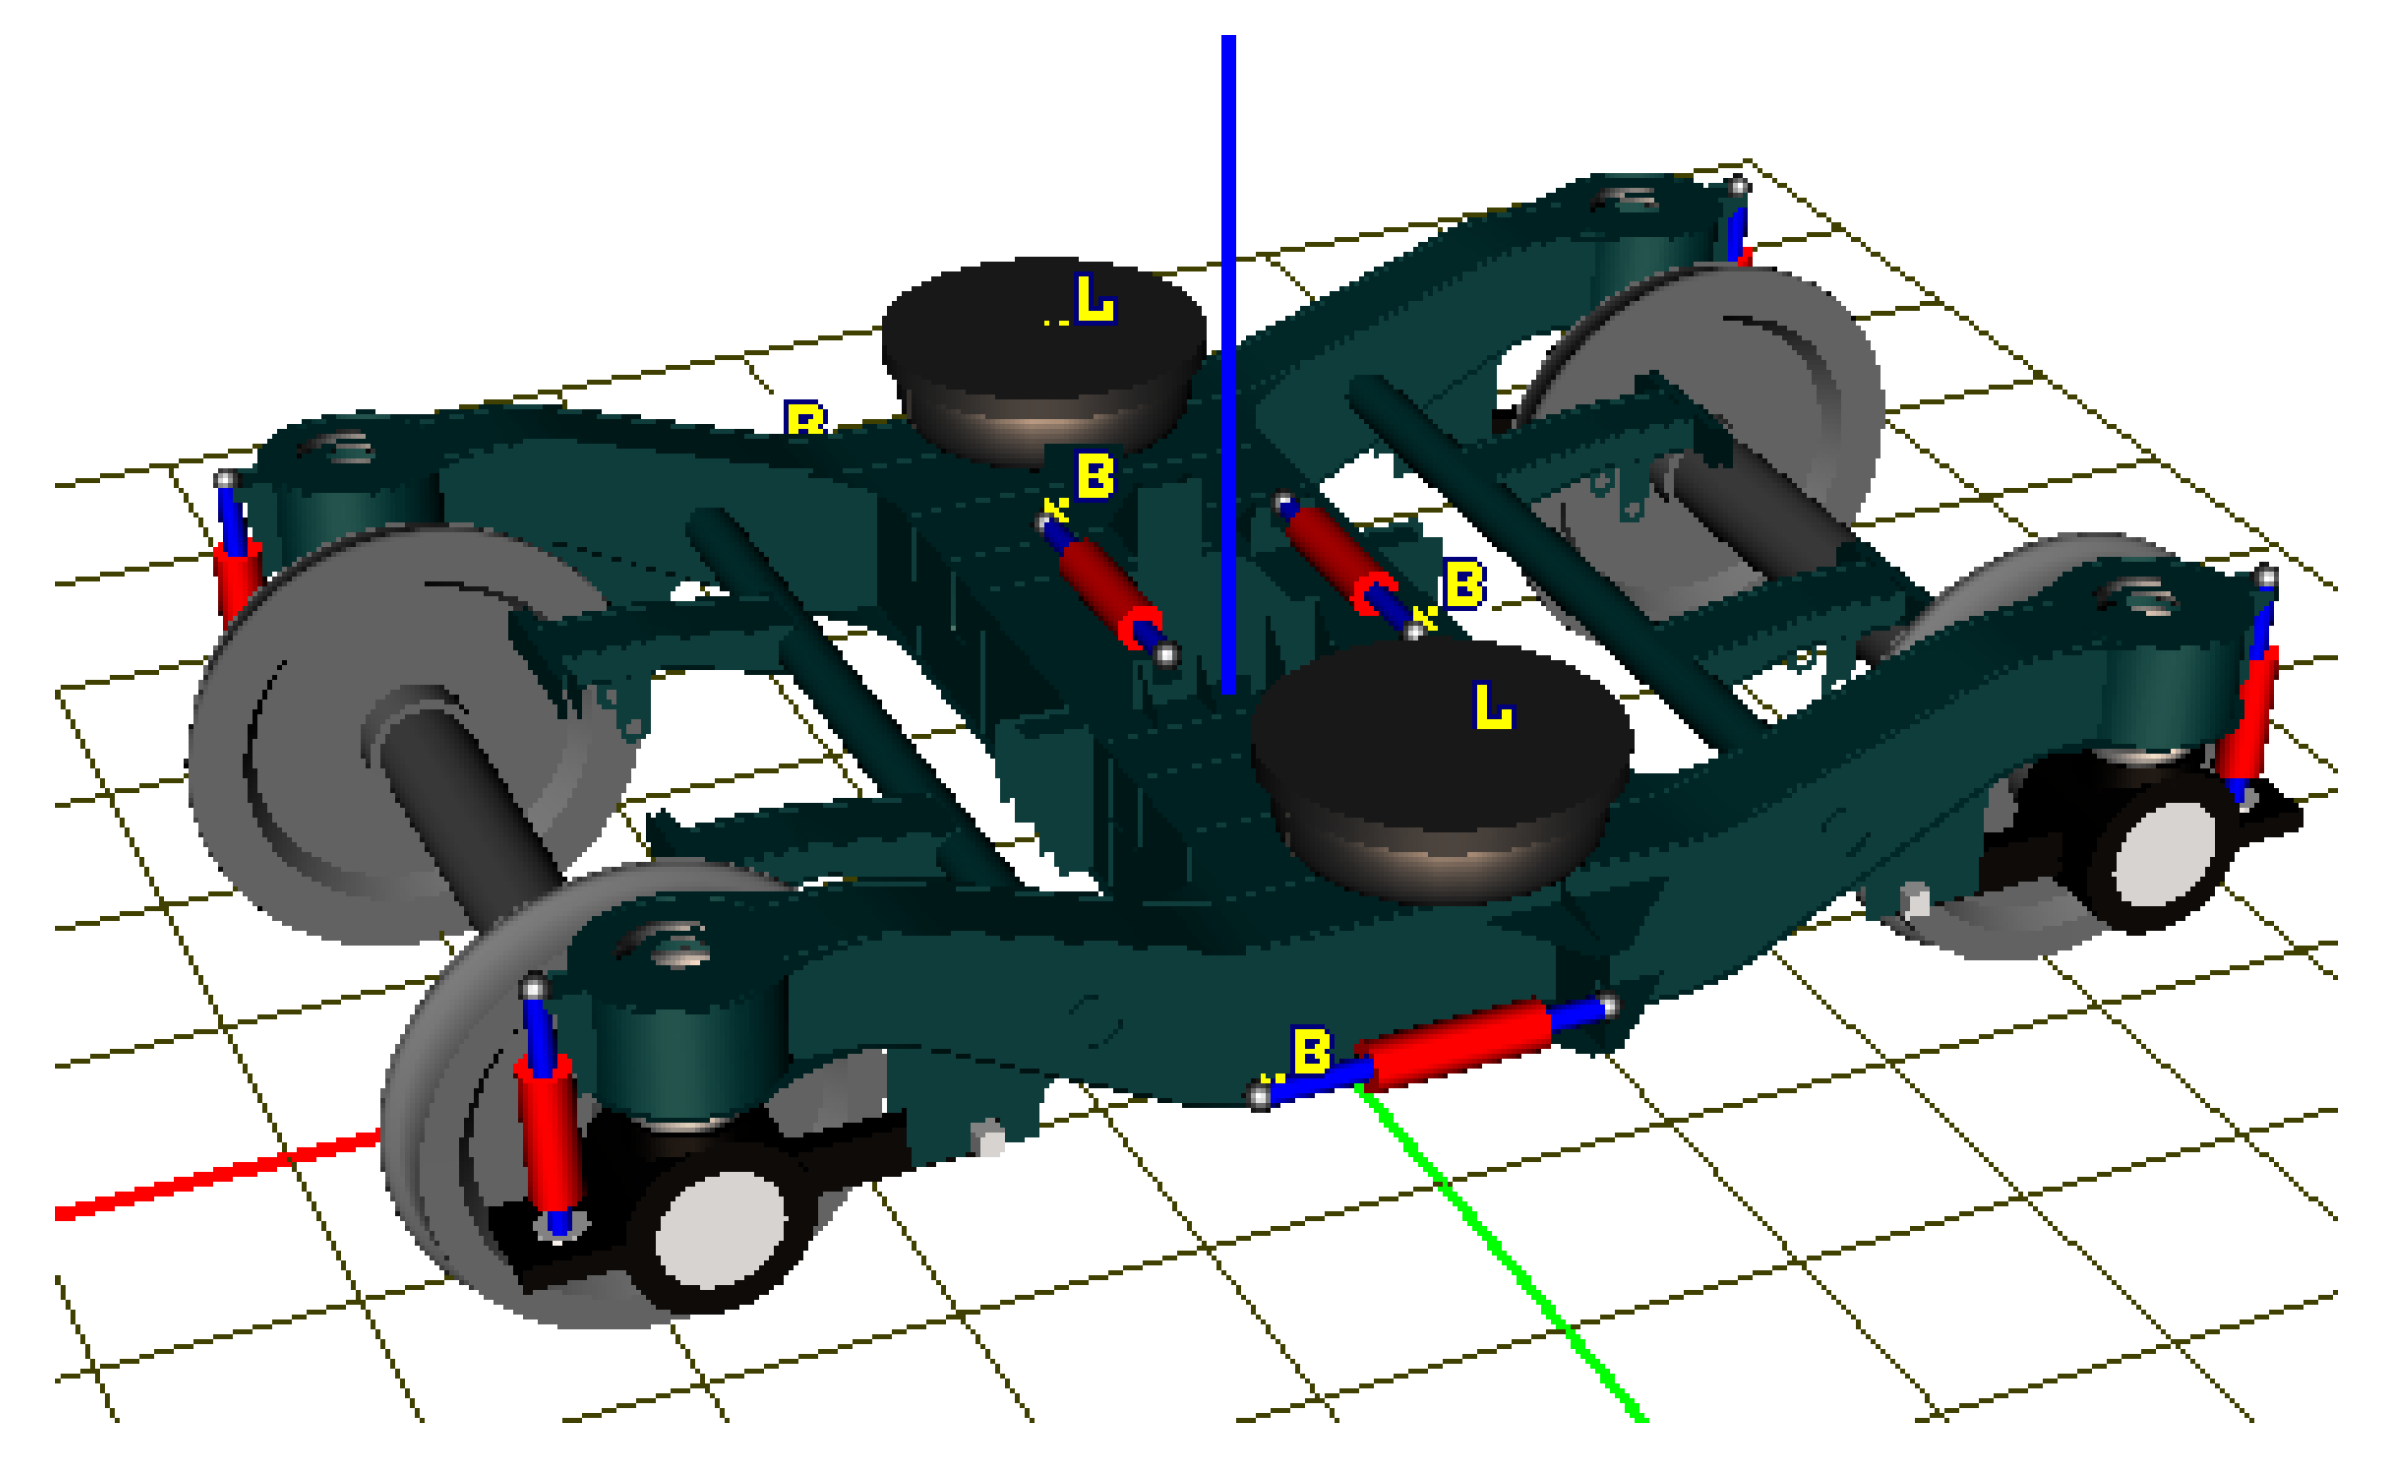
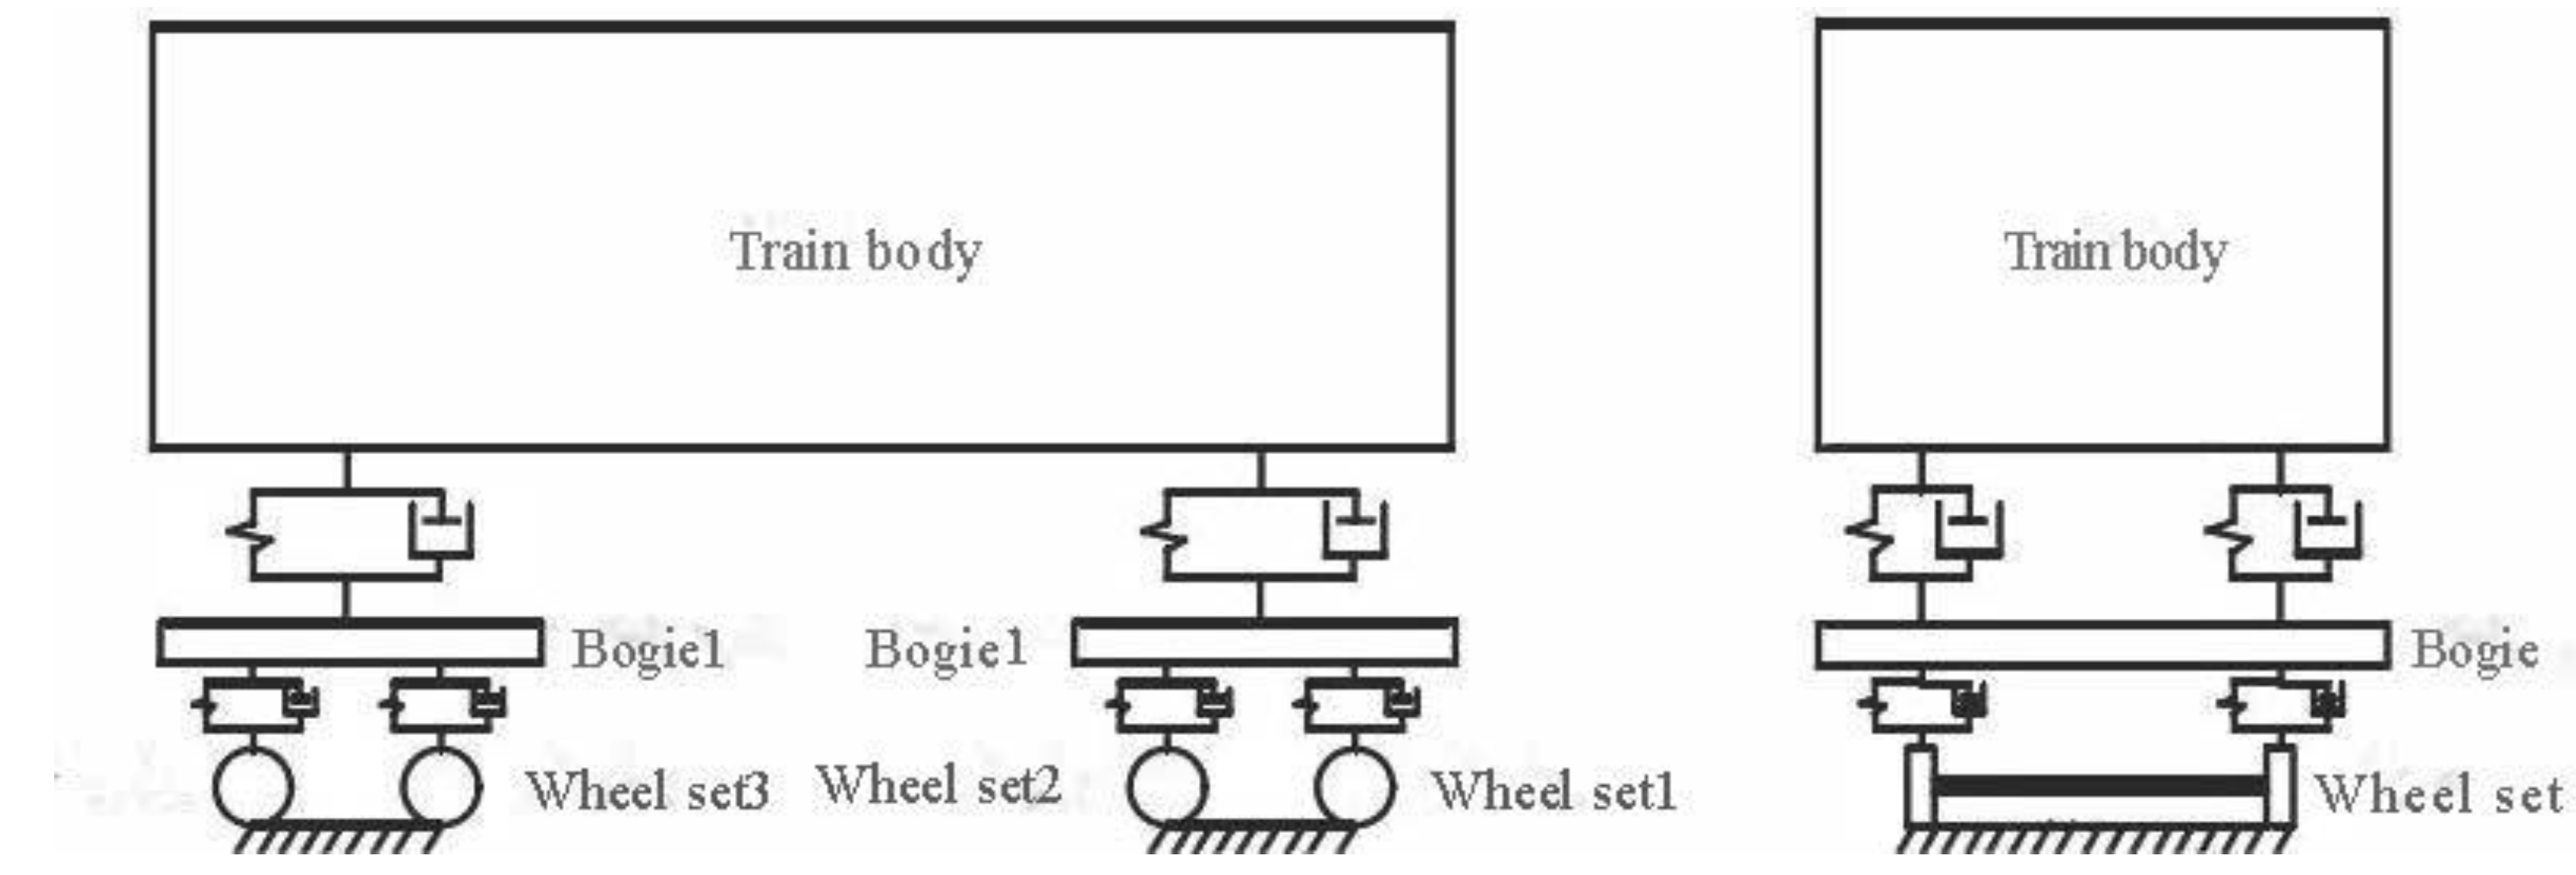
Figure 9.
Front view and side view of train dynamics model.
Figure 9.
Front view and side view of train dynamics model.
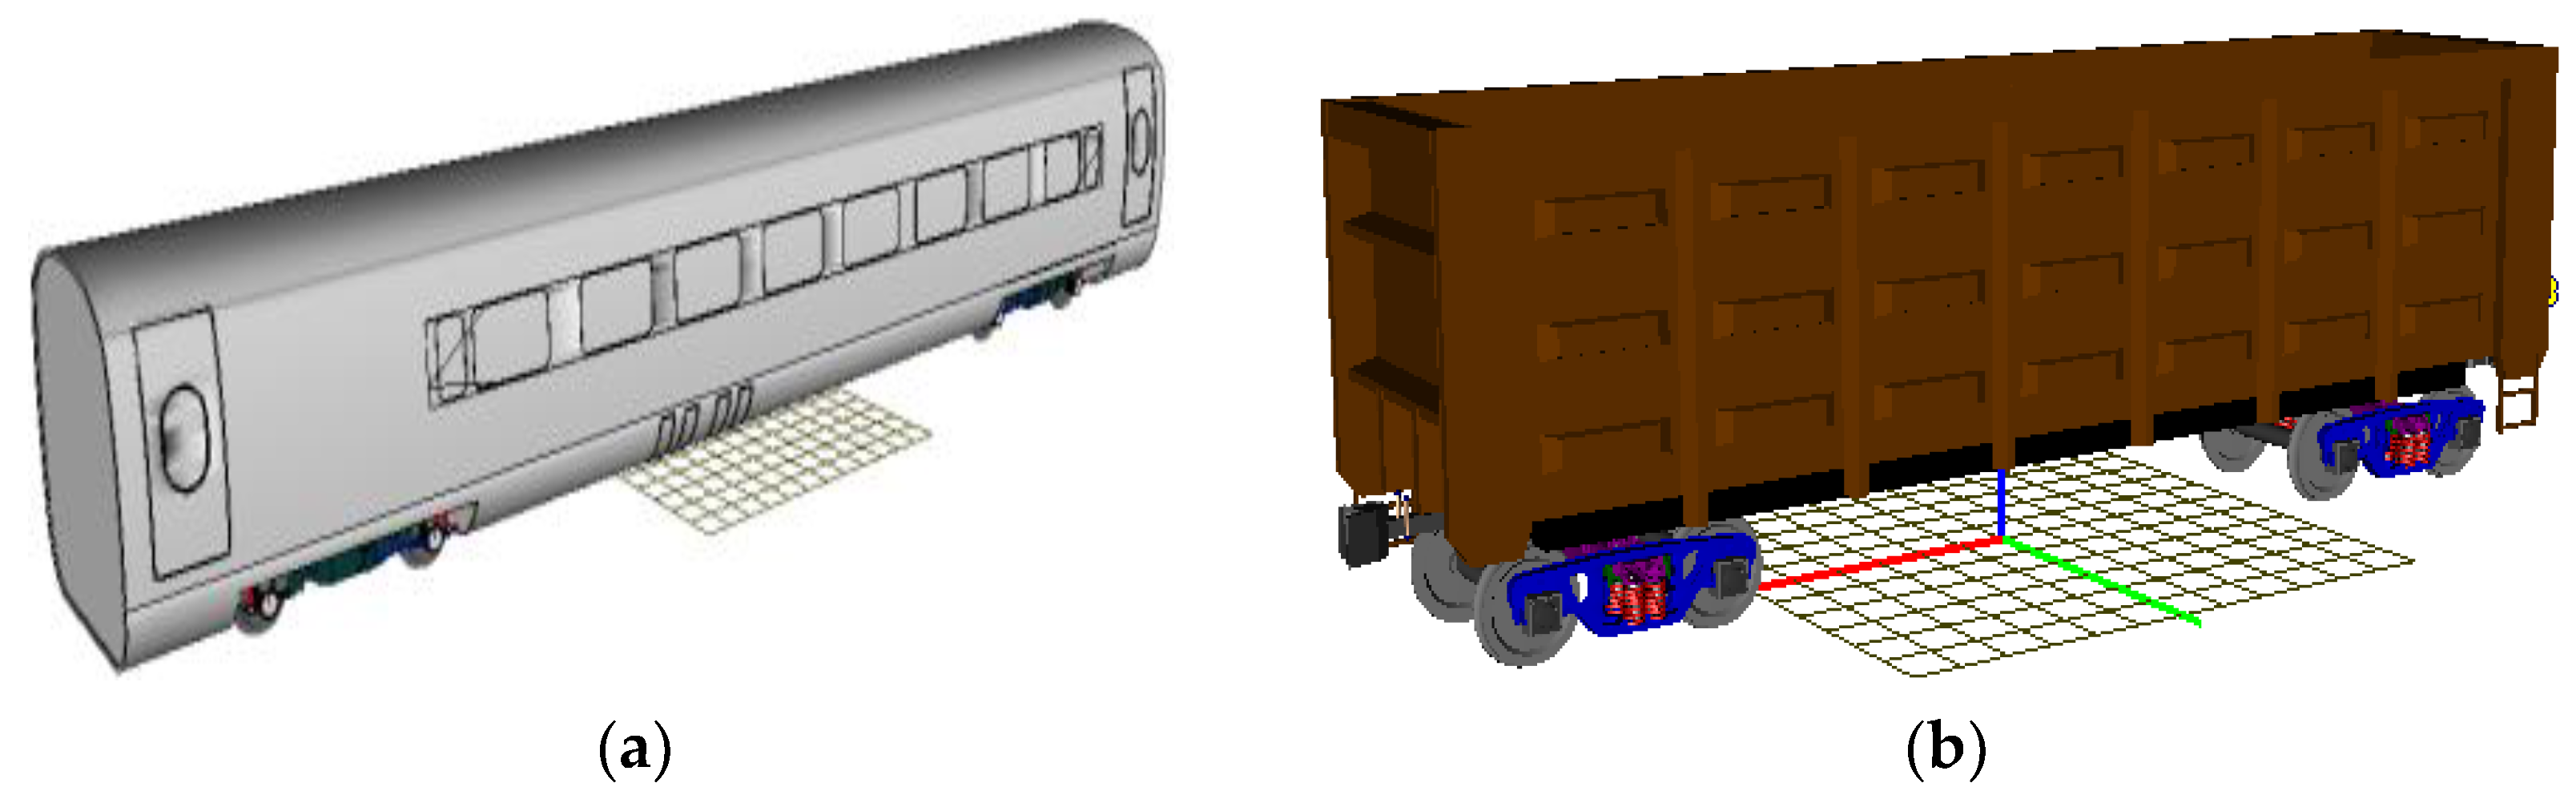
Figure 10.
Train model: (a) Passenger train model. (b) Freight train model.
Figure 10.
Train model: (a) Passenger train model. (b) Freight train model.
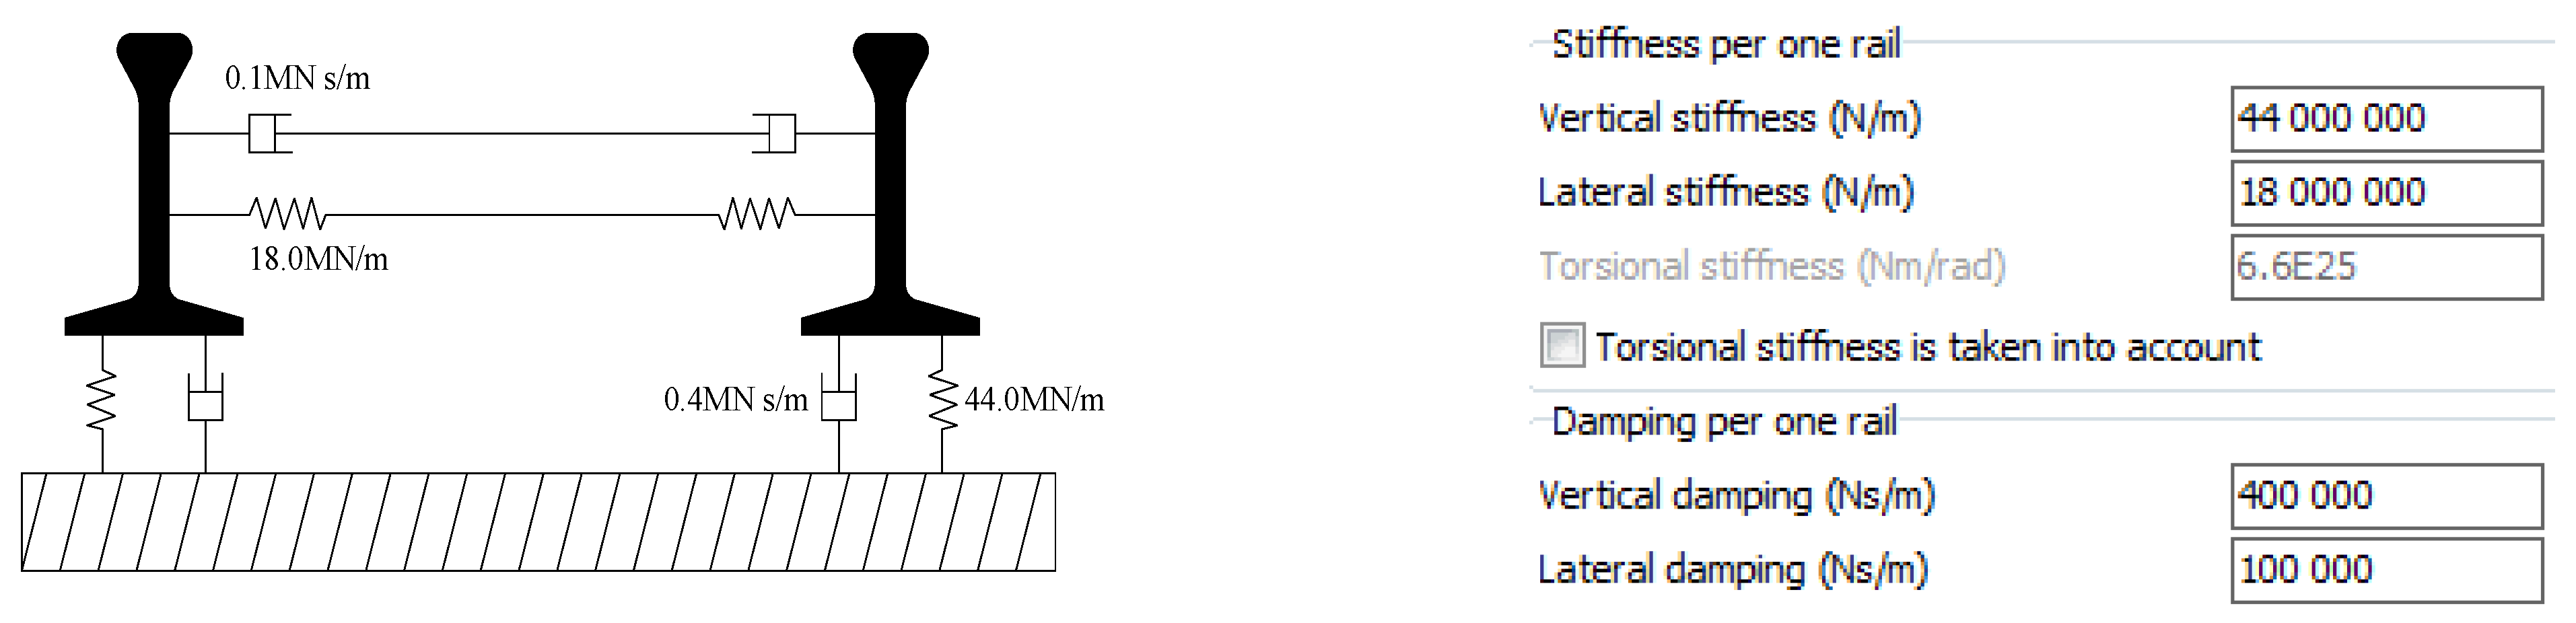
Figure 11.
Orbital dynamics model and parameter setting.
Figure 11.
Orbital dynamics model and parameter setting.
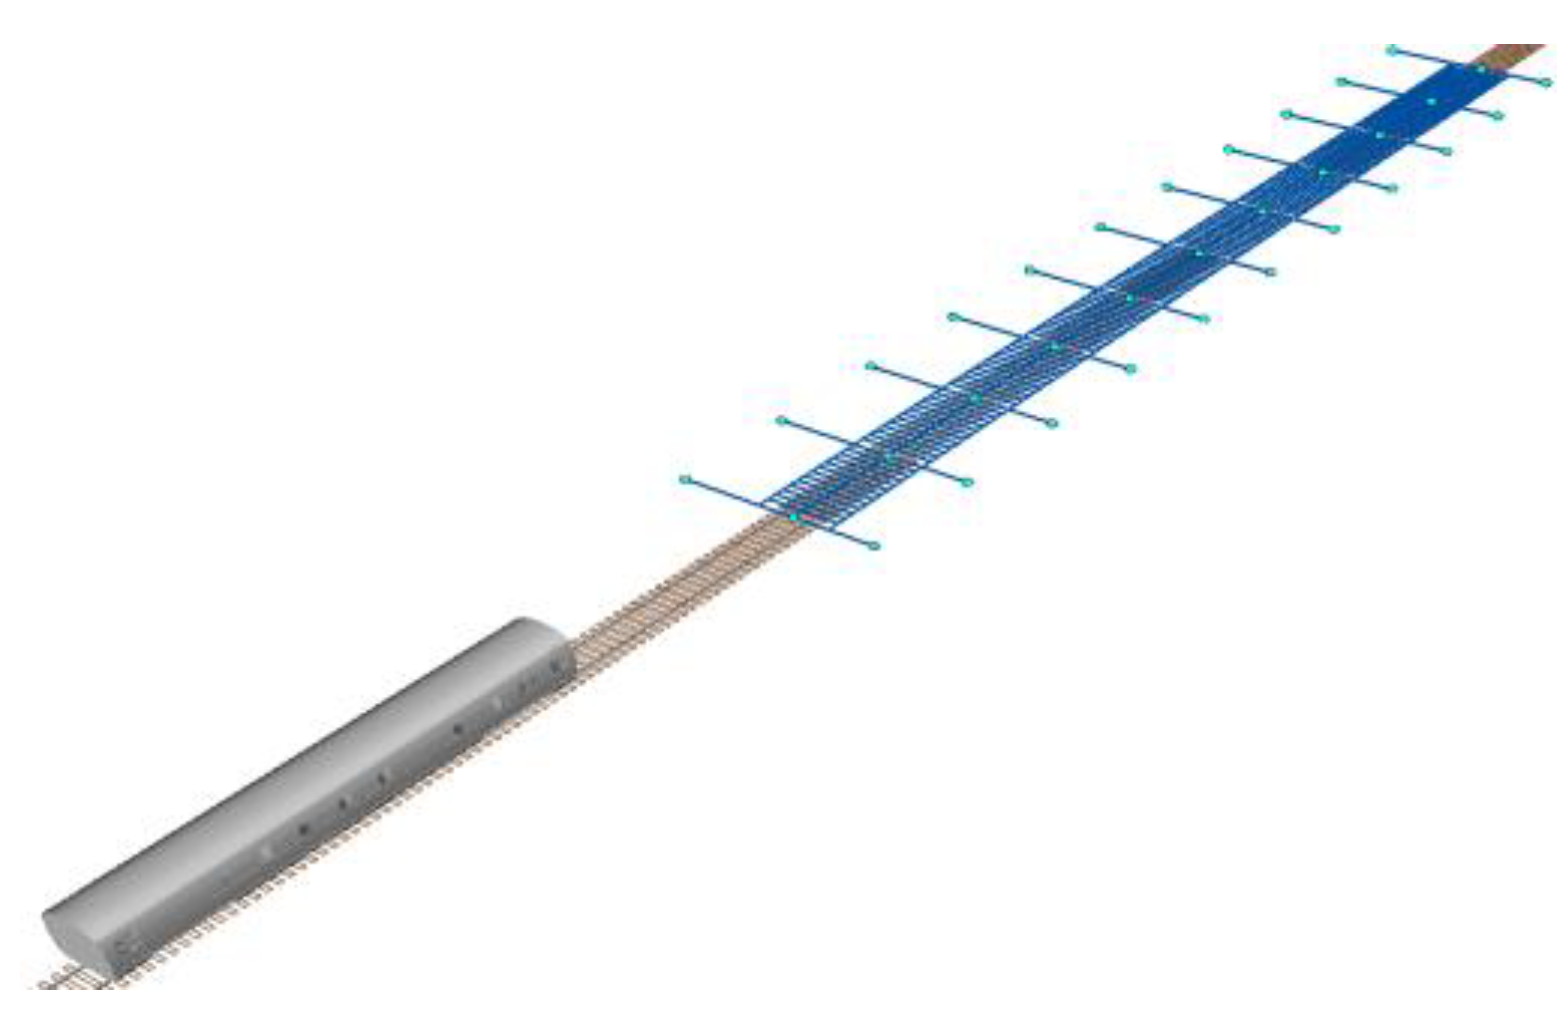
Figure 12.
Train-track-overhead system model.
Figure 12.
Train-track-overhead system model.
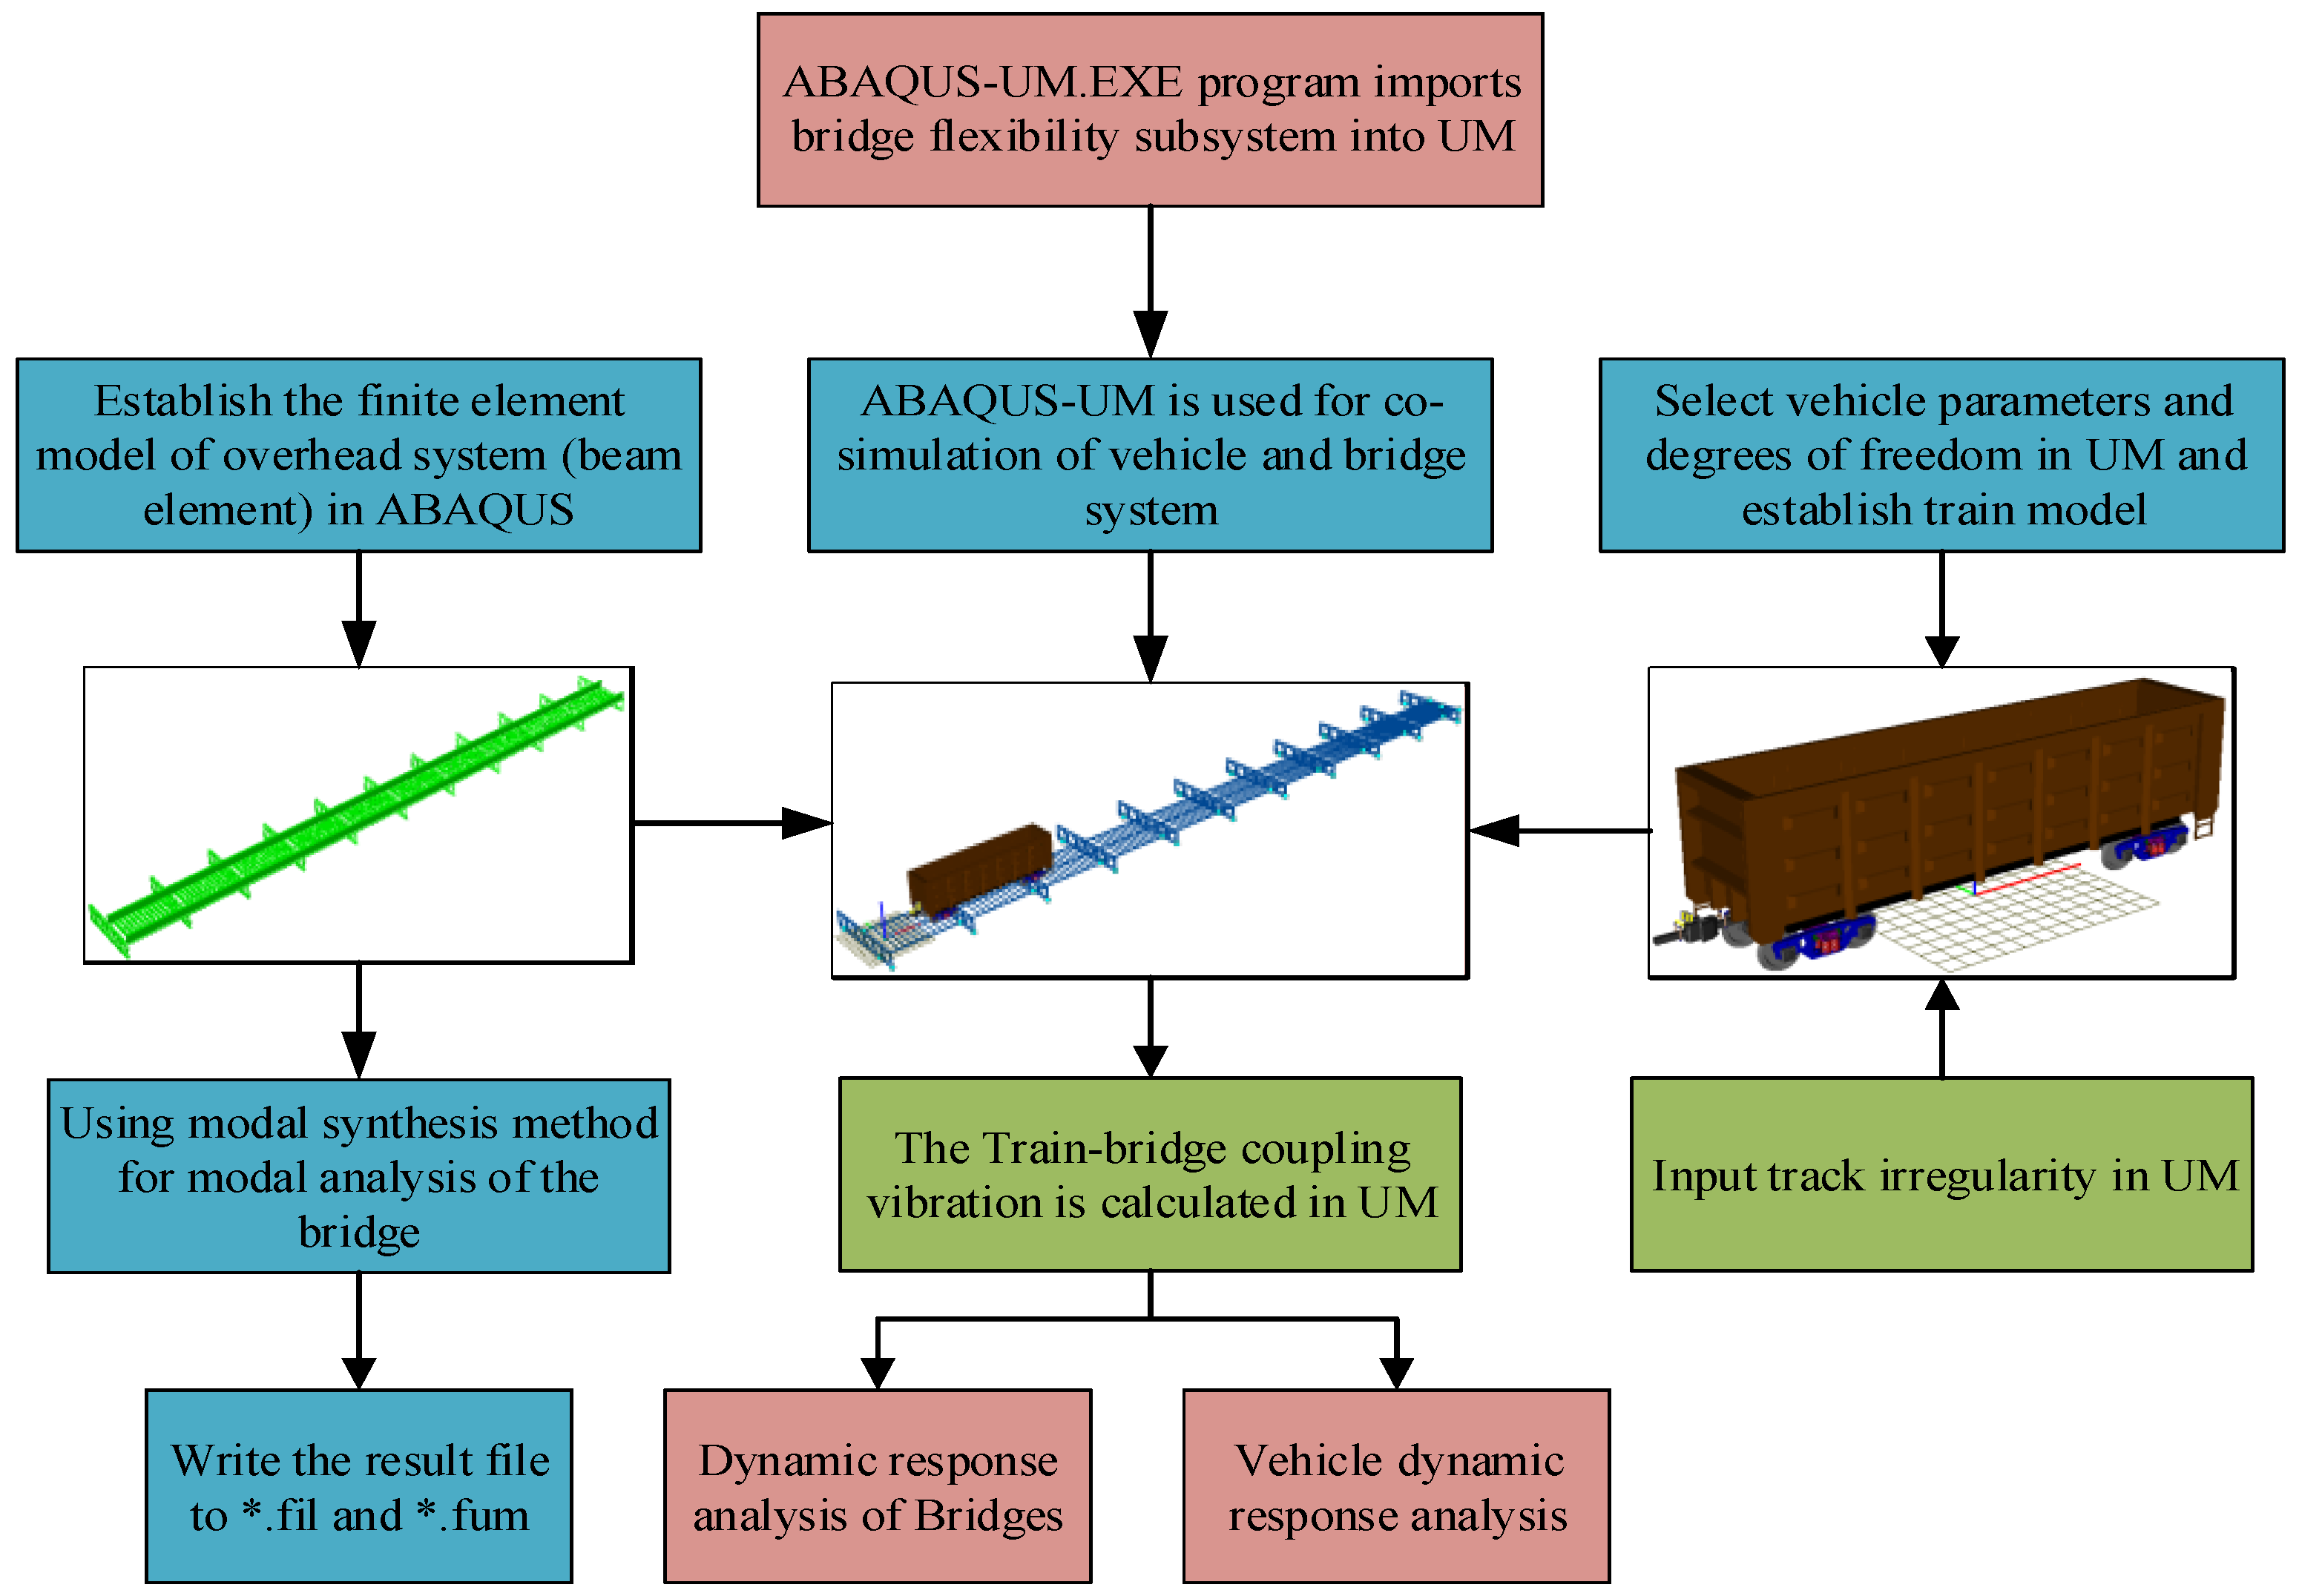
Figure 13.
The process of joint simulation.
Figure 13.
The process of joint simulation.
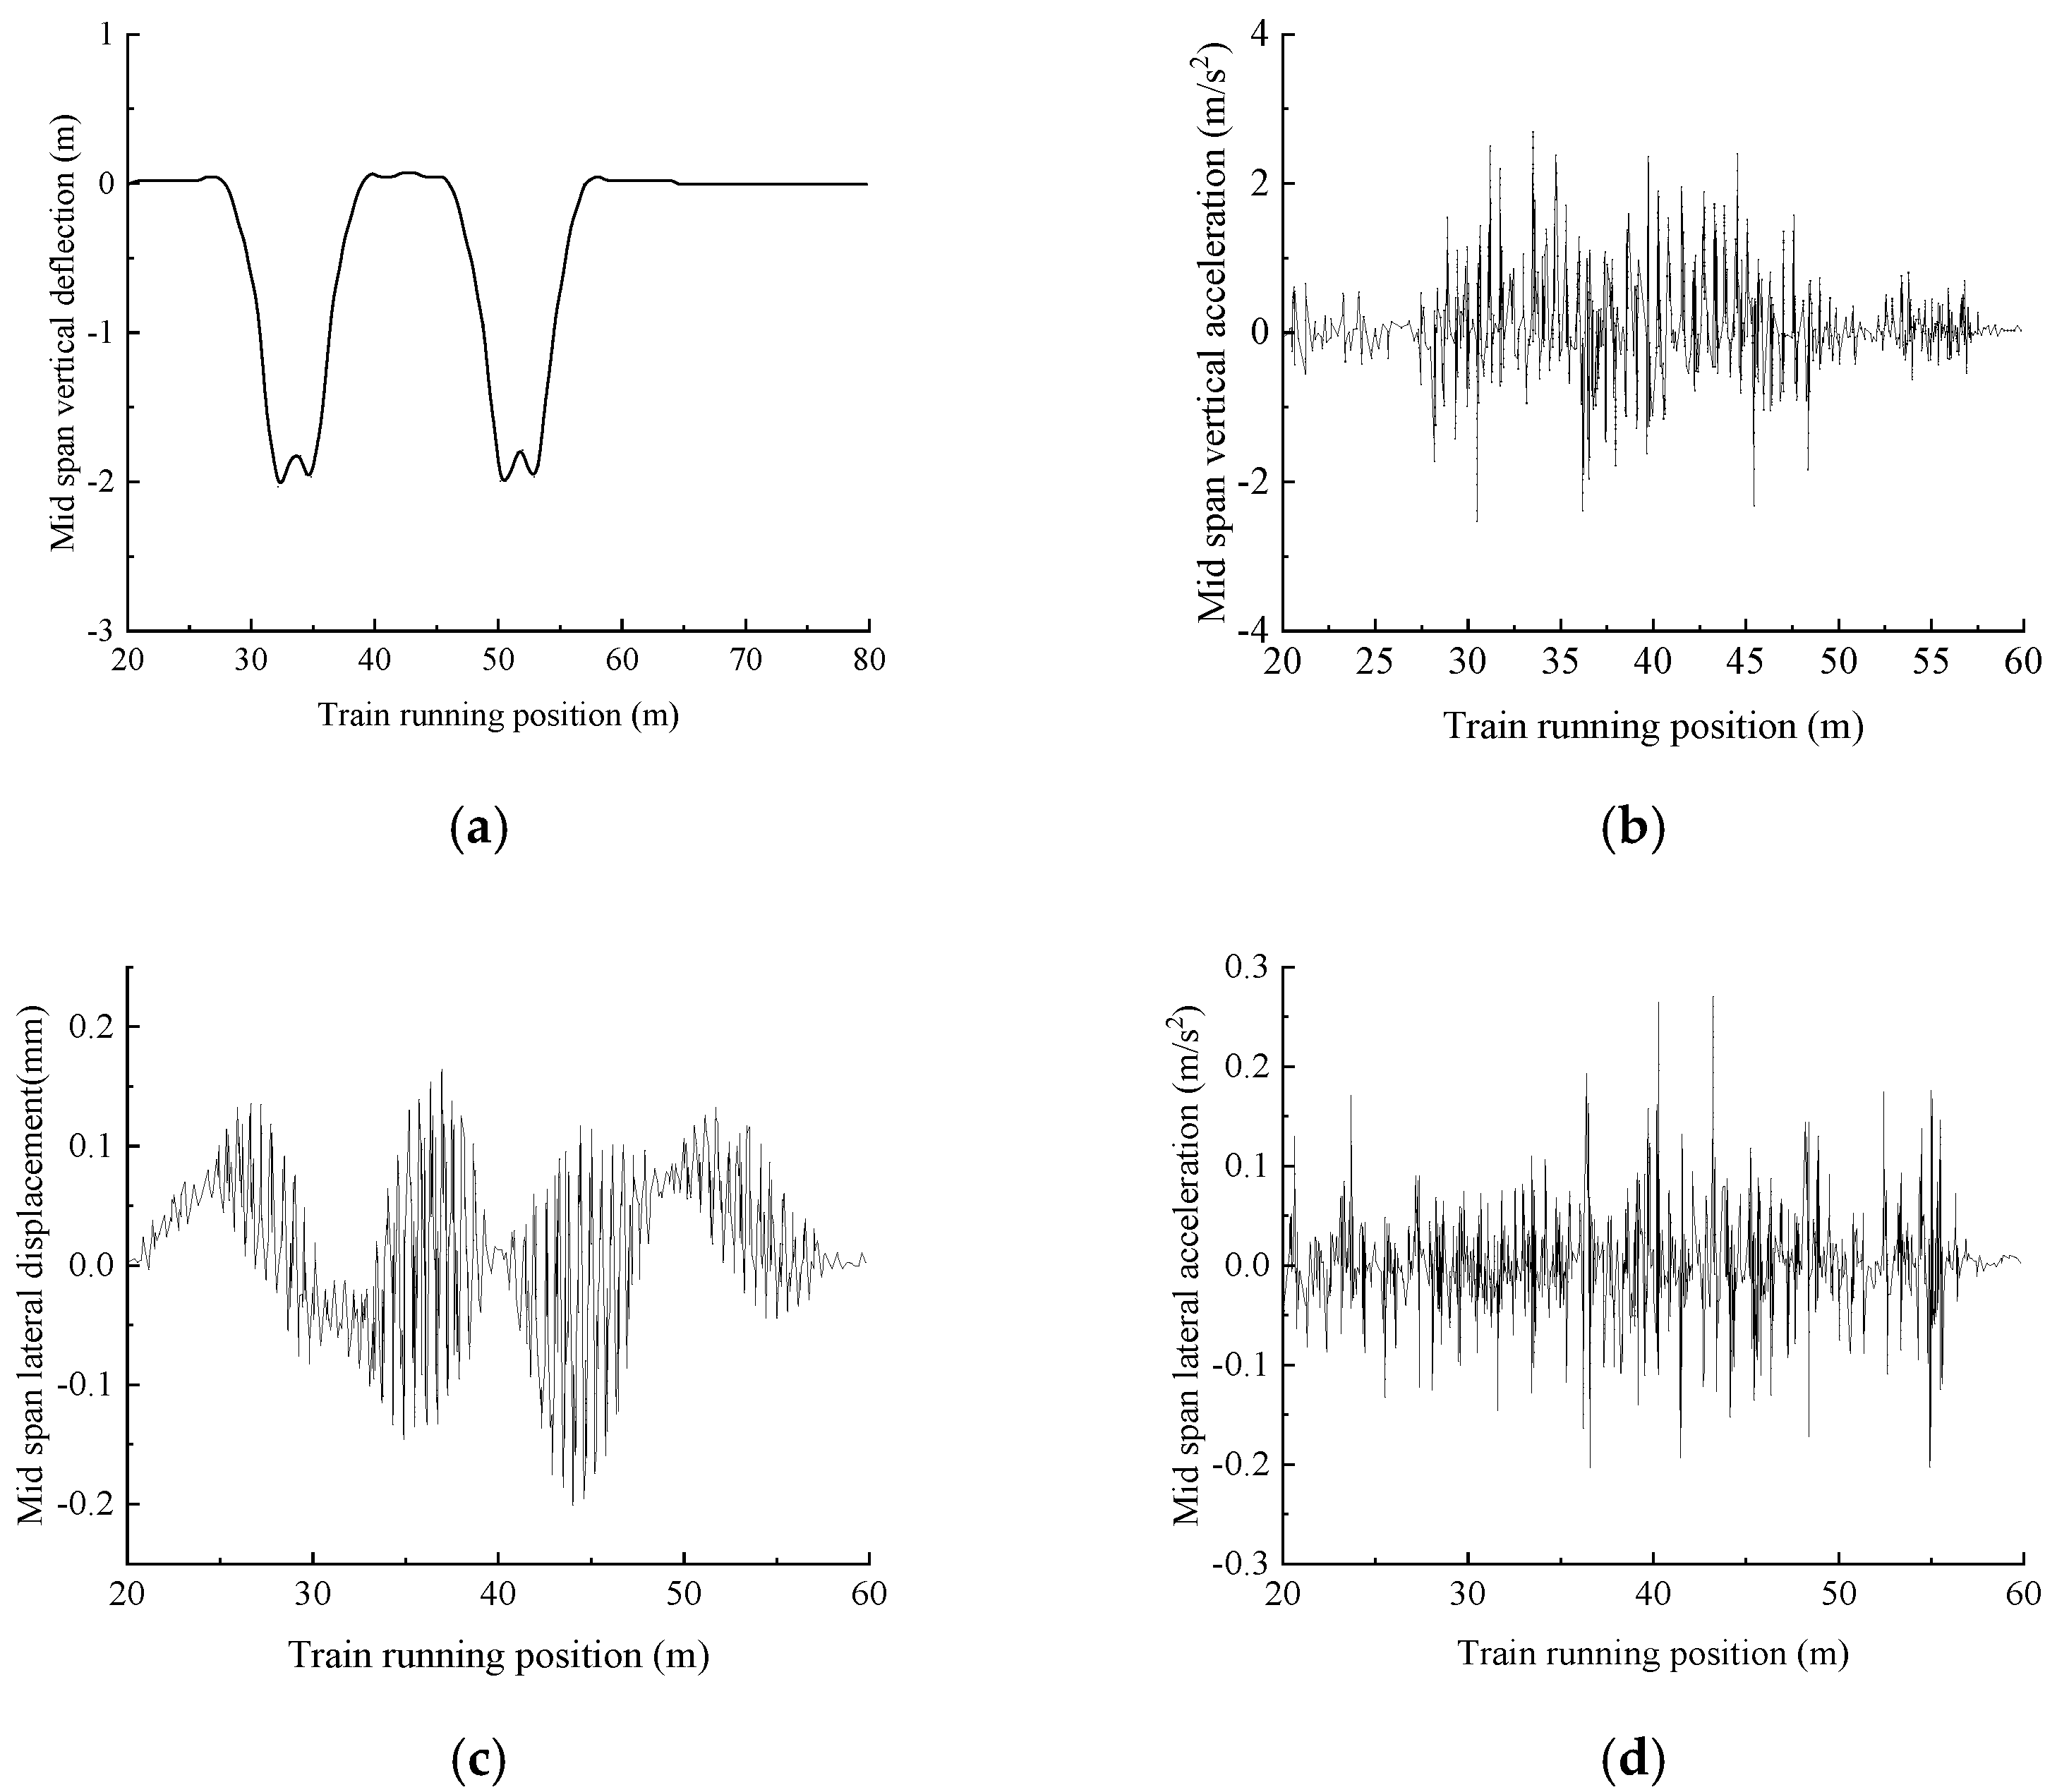
Figure 14.
I Overhead system dynamic response: (a) Mid−span vertical deflection (unit: mm). (b) Mid−span vertical acceleration (unit: m/s2). (c) Mid−span lateral displacement (unit: mm). (d) Mid−span lateral acceleration (unit: m/s2).
Figure 14.
I Overhead system dynamic response: (a) Mid−span vertical deflection (unit: mm). (b) Mid−span vertical acceleration (unit: m/s2). (c) Mid−span lateral displacement (unit: mm). (d) Mid−span lateral acceleration (unit: m/s2).
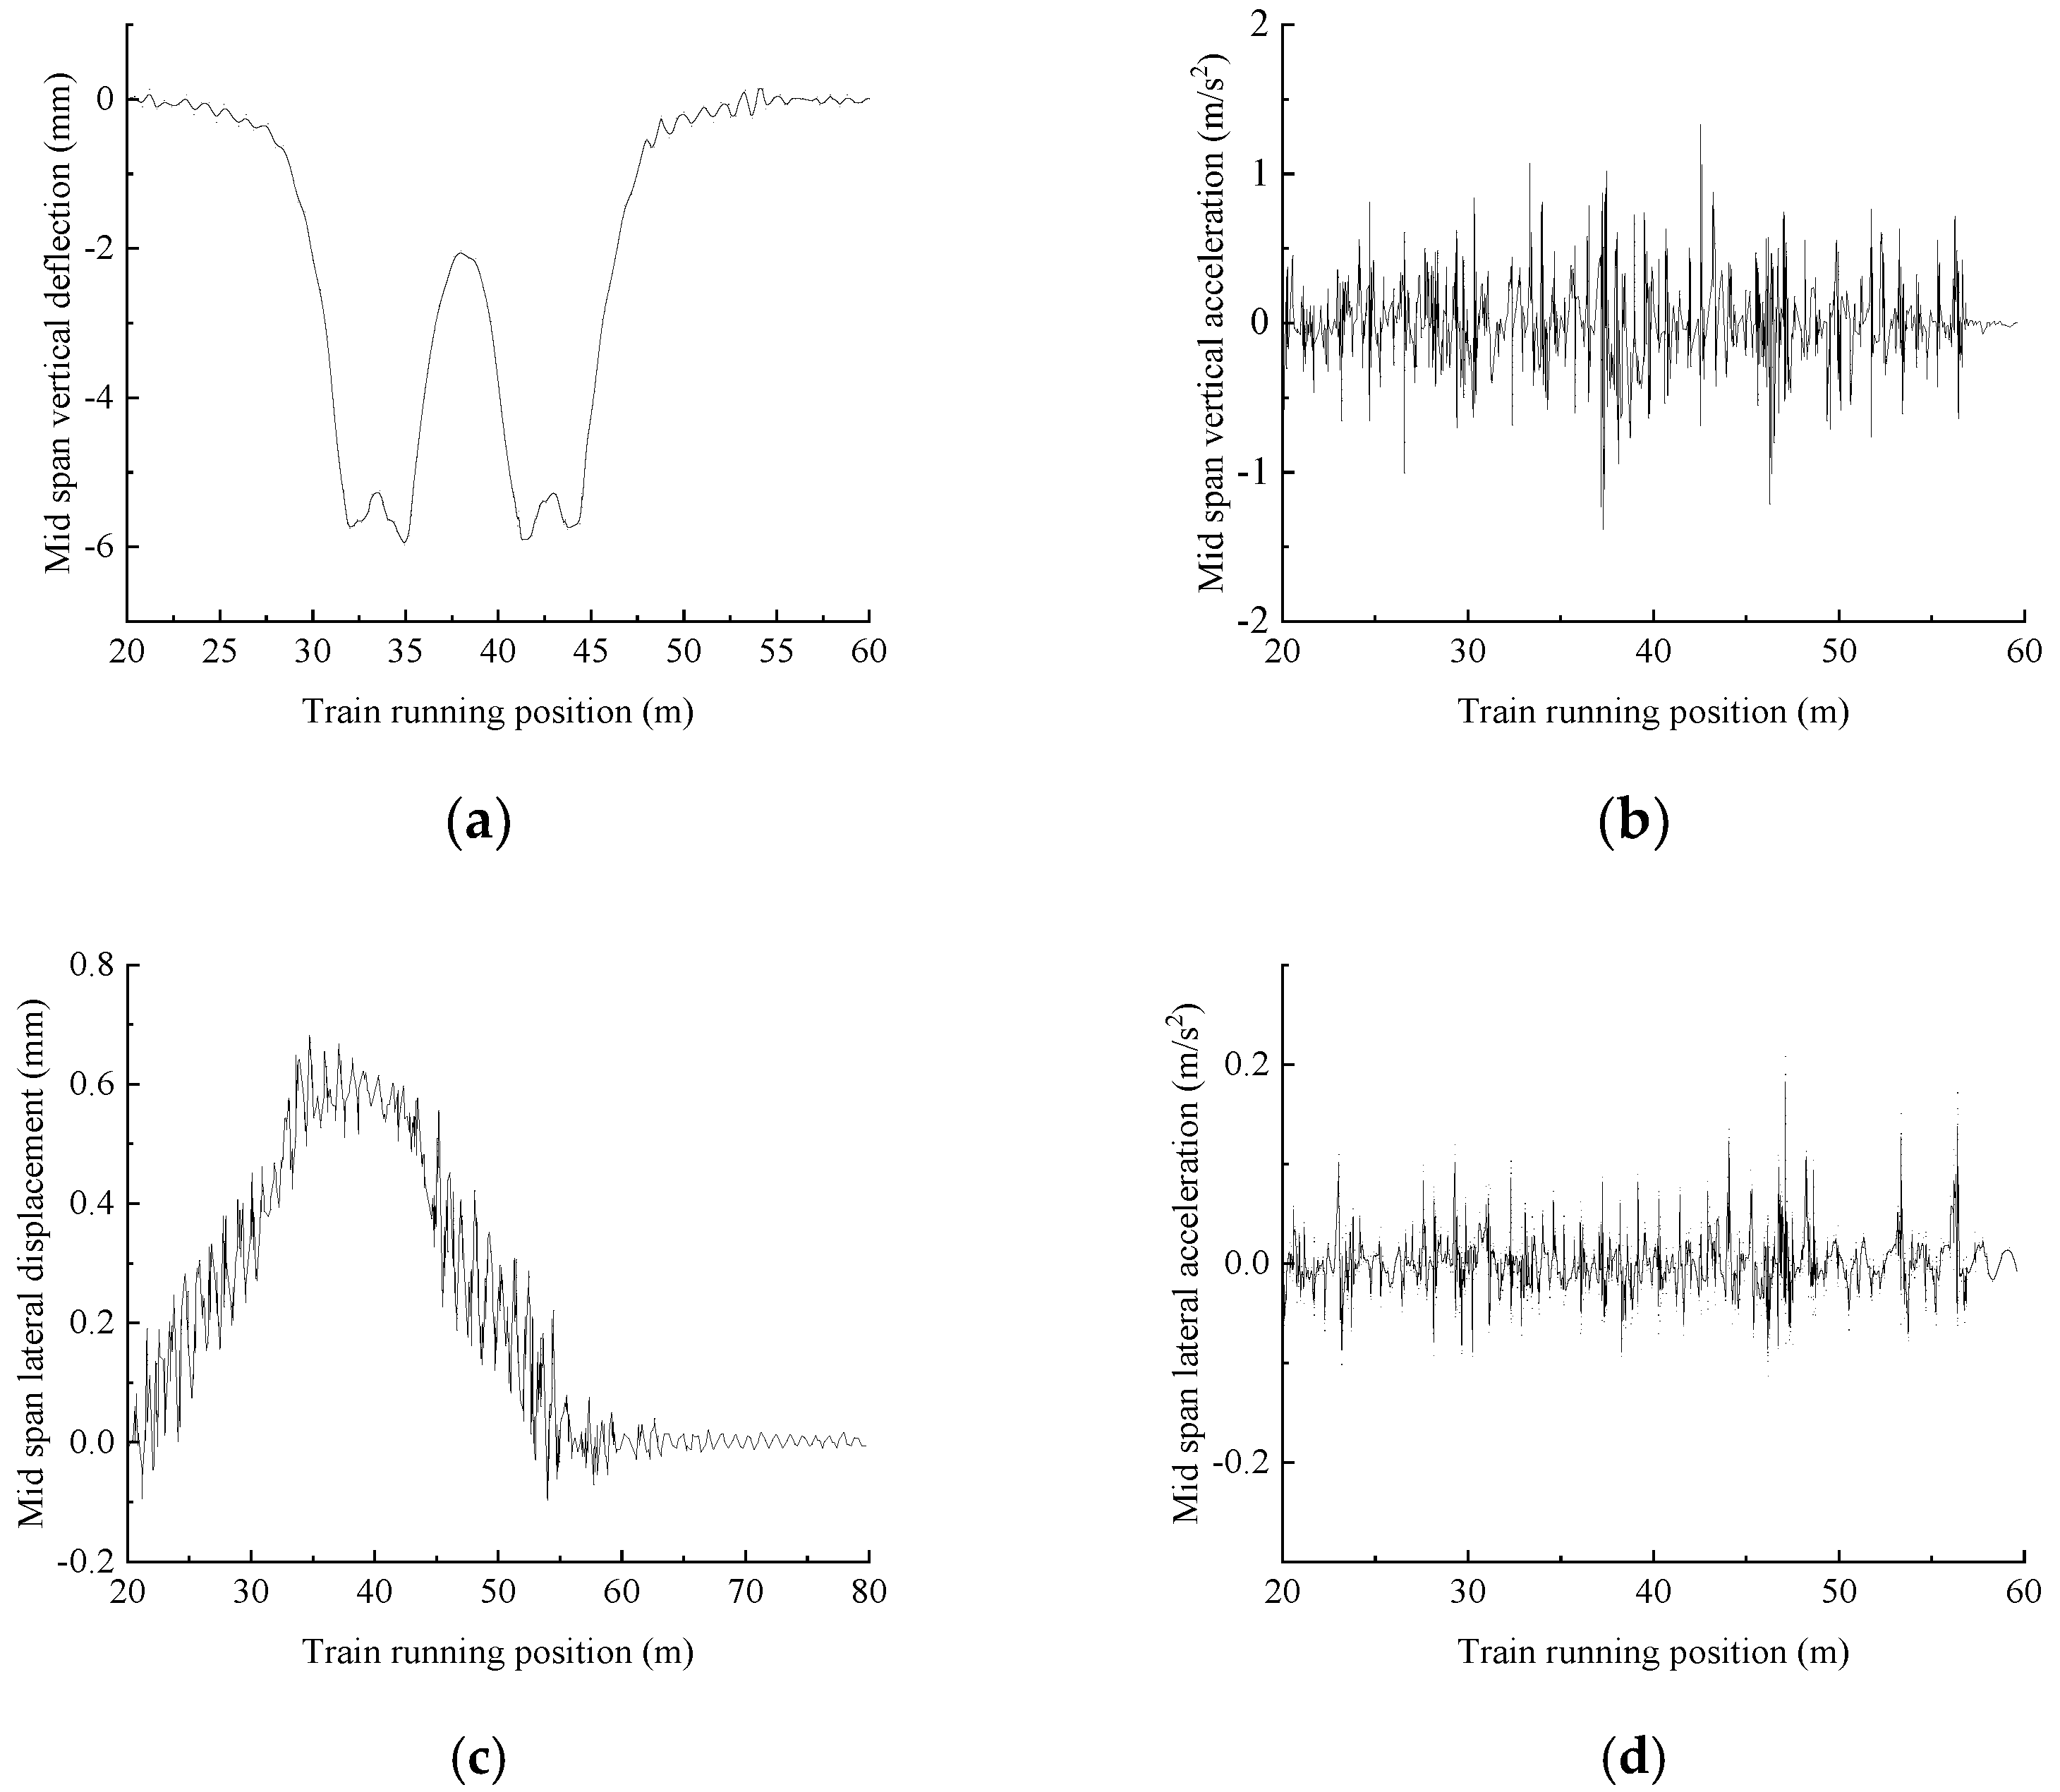
Figure 15.
II Overhead system dynamic response: (a) Mid−span vertical deflection (unit: mm) (b) Mid−span vertical acceleration (unit: m/s2). (c) Mid−span lateral displacement (unit: mm). (d) Mid−span lateral acceleration (unit: m/s2).
Figure 15.
II Overhead system dynamic response: (a) Mid−span vertical deflection (unit: mm) (b) Mid−span vertical acceleration (unit: m/s2). (c) Mid−span lateral displacement (unit: mm). (d) Mid−span lateral acceleration (unit: m/s2).
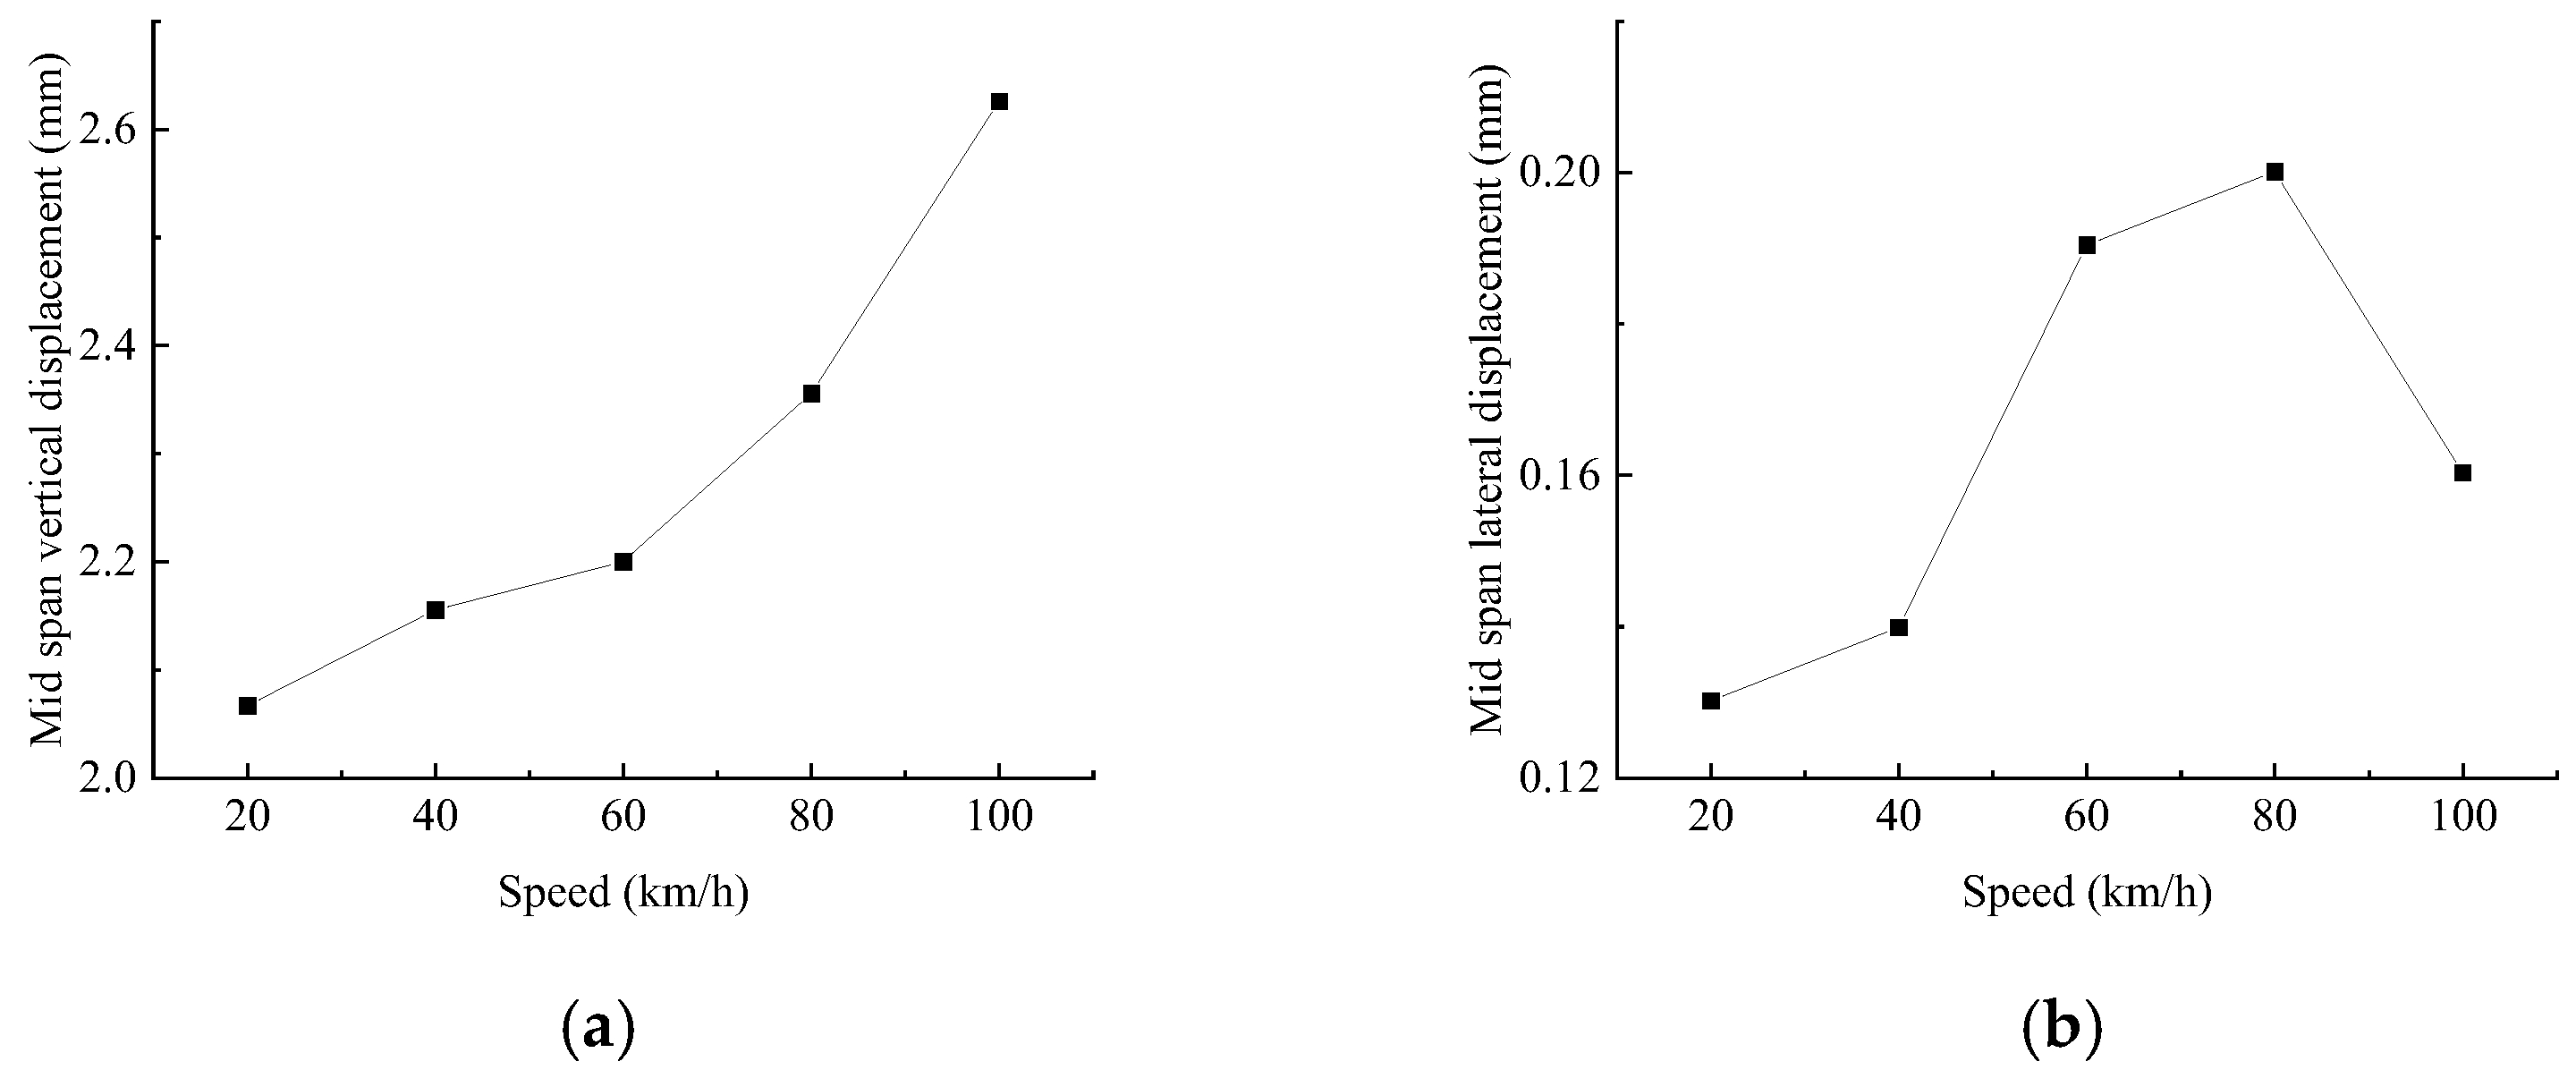
Figure 16.
Mid-span displacement response under different speed levels (unit: mm): (a) Mid-span maximum vertical deflection. (b) Mid-span lateral displacement.
Figure 16.
Mid-span displacement response under different speed levels (unit: mm): (a) Mid-span maximum vertical deflection. (b) Mid-span lateral displacement.
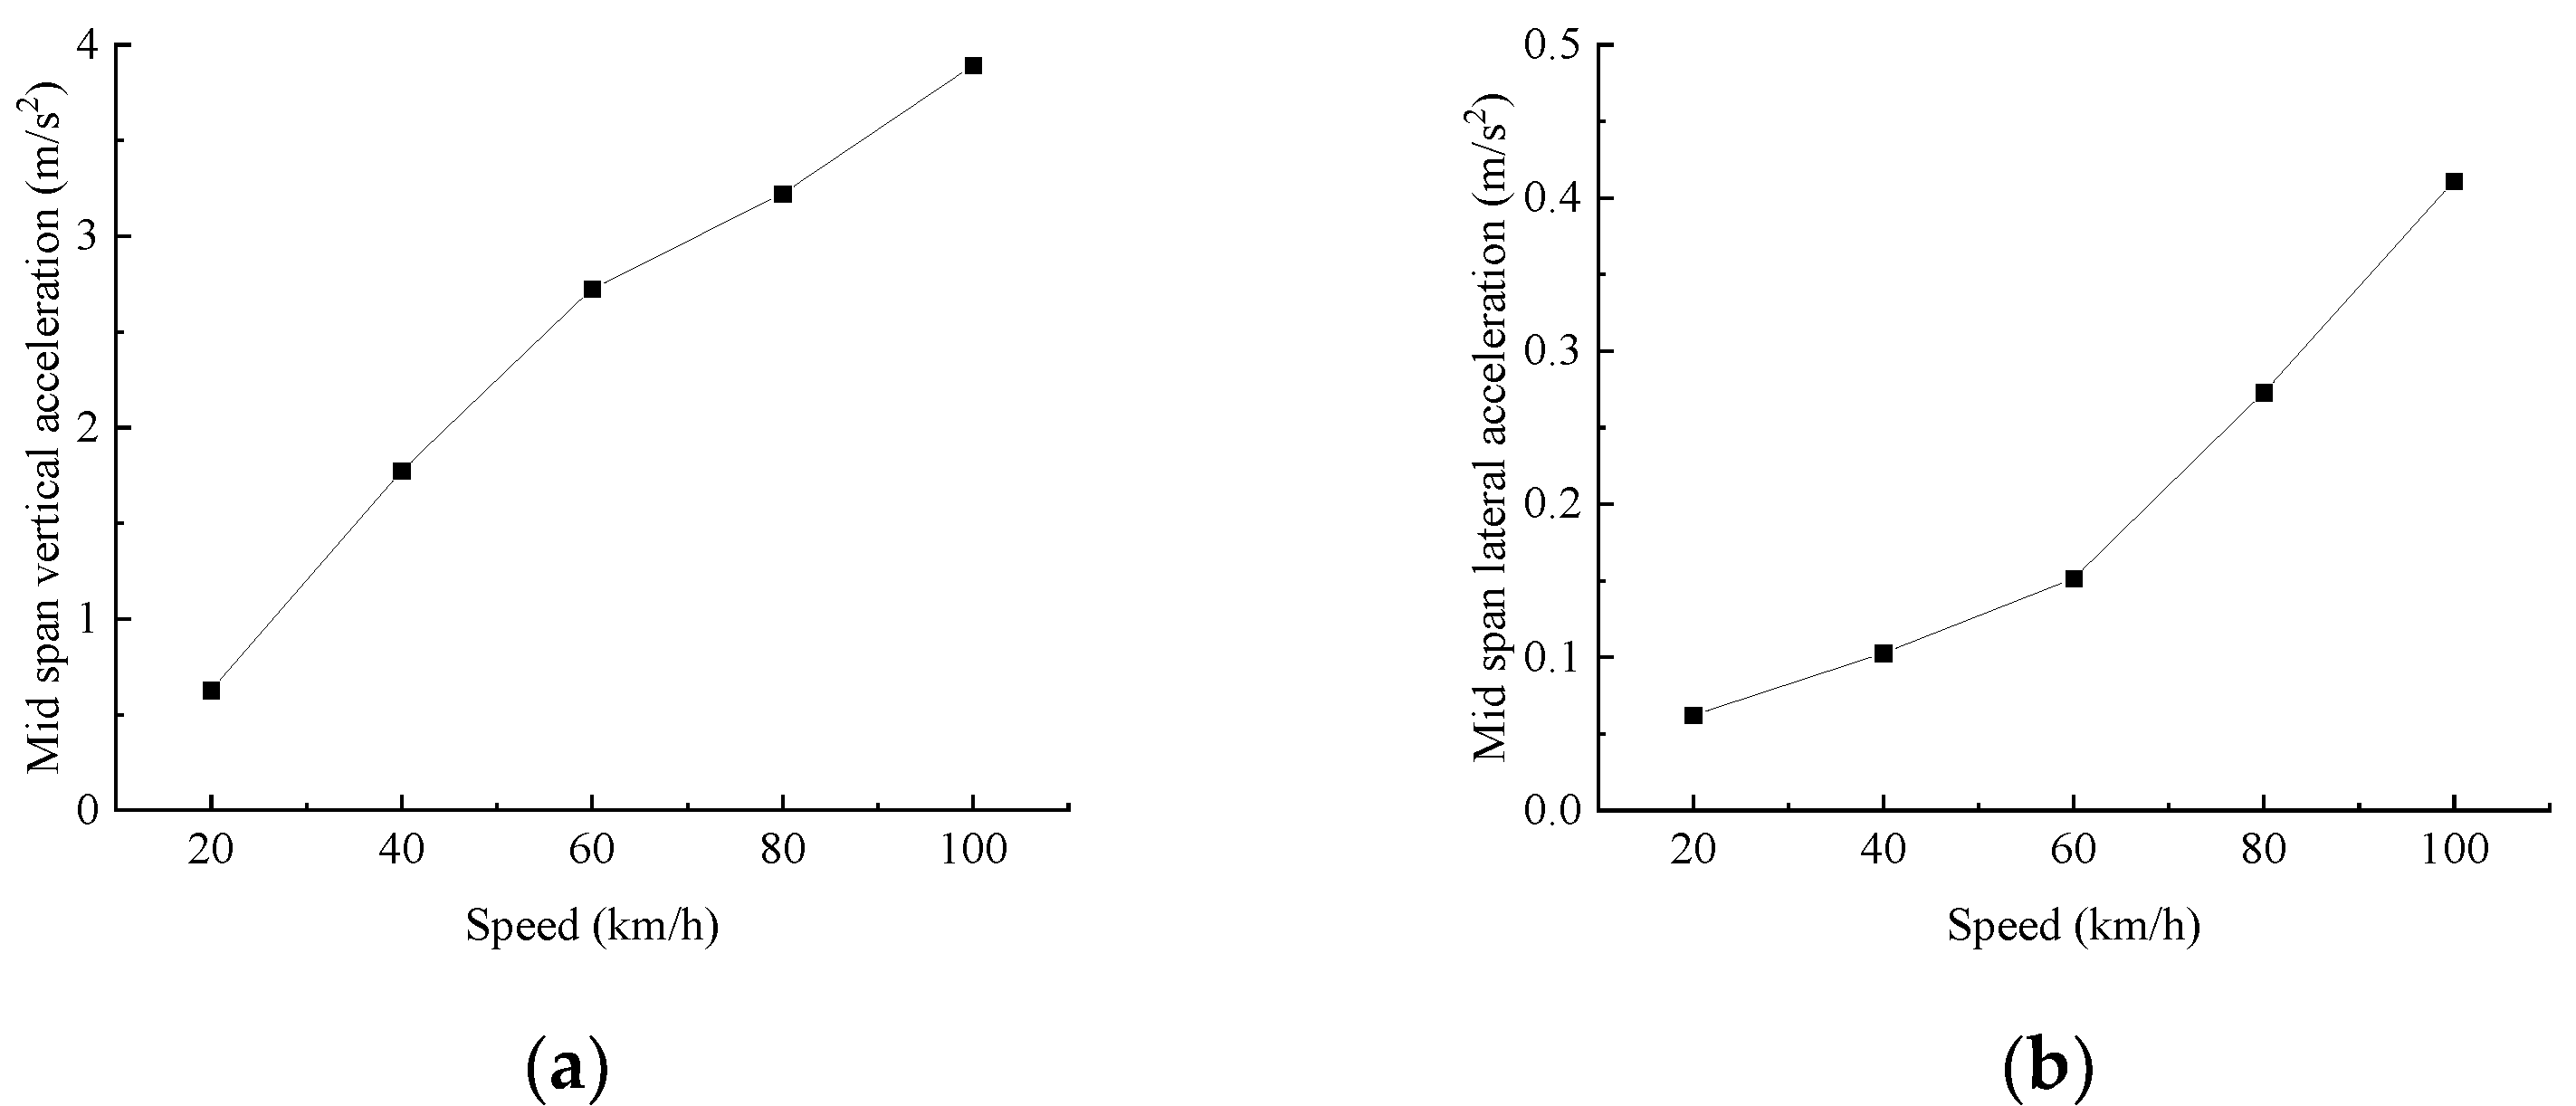
Figure 17.
Mid-span acceleration response under different speed levels (unit: m/s2): (a) Mid-span vertical acceleration. (b) Mid-span lateral acceleration.
Figure 17.
Mid-span acceleration response under different speed levels (unit: m/s2): (a) Mid-span vertical acceleration. (b) Mid-span lateral acceleration.
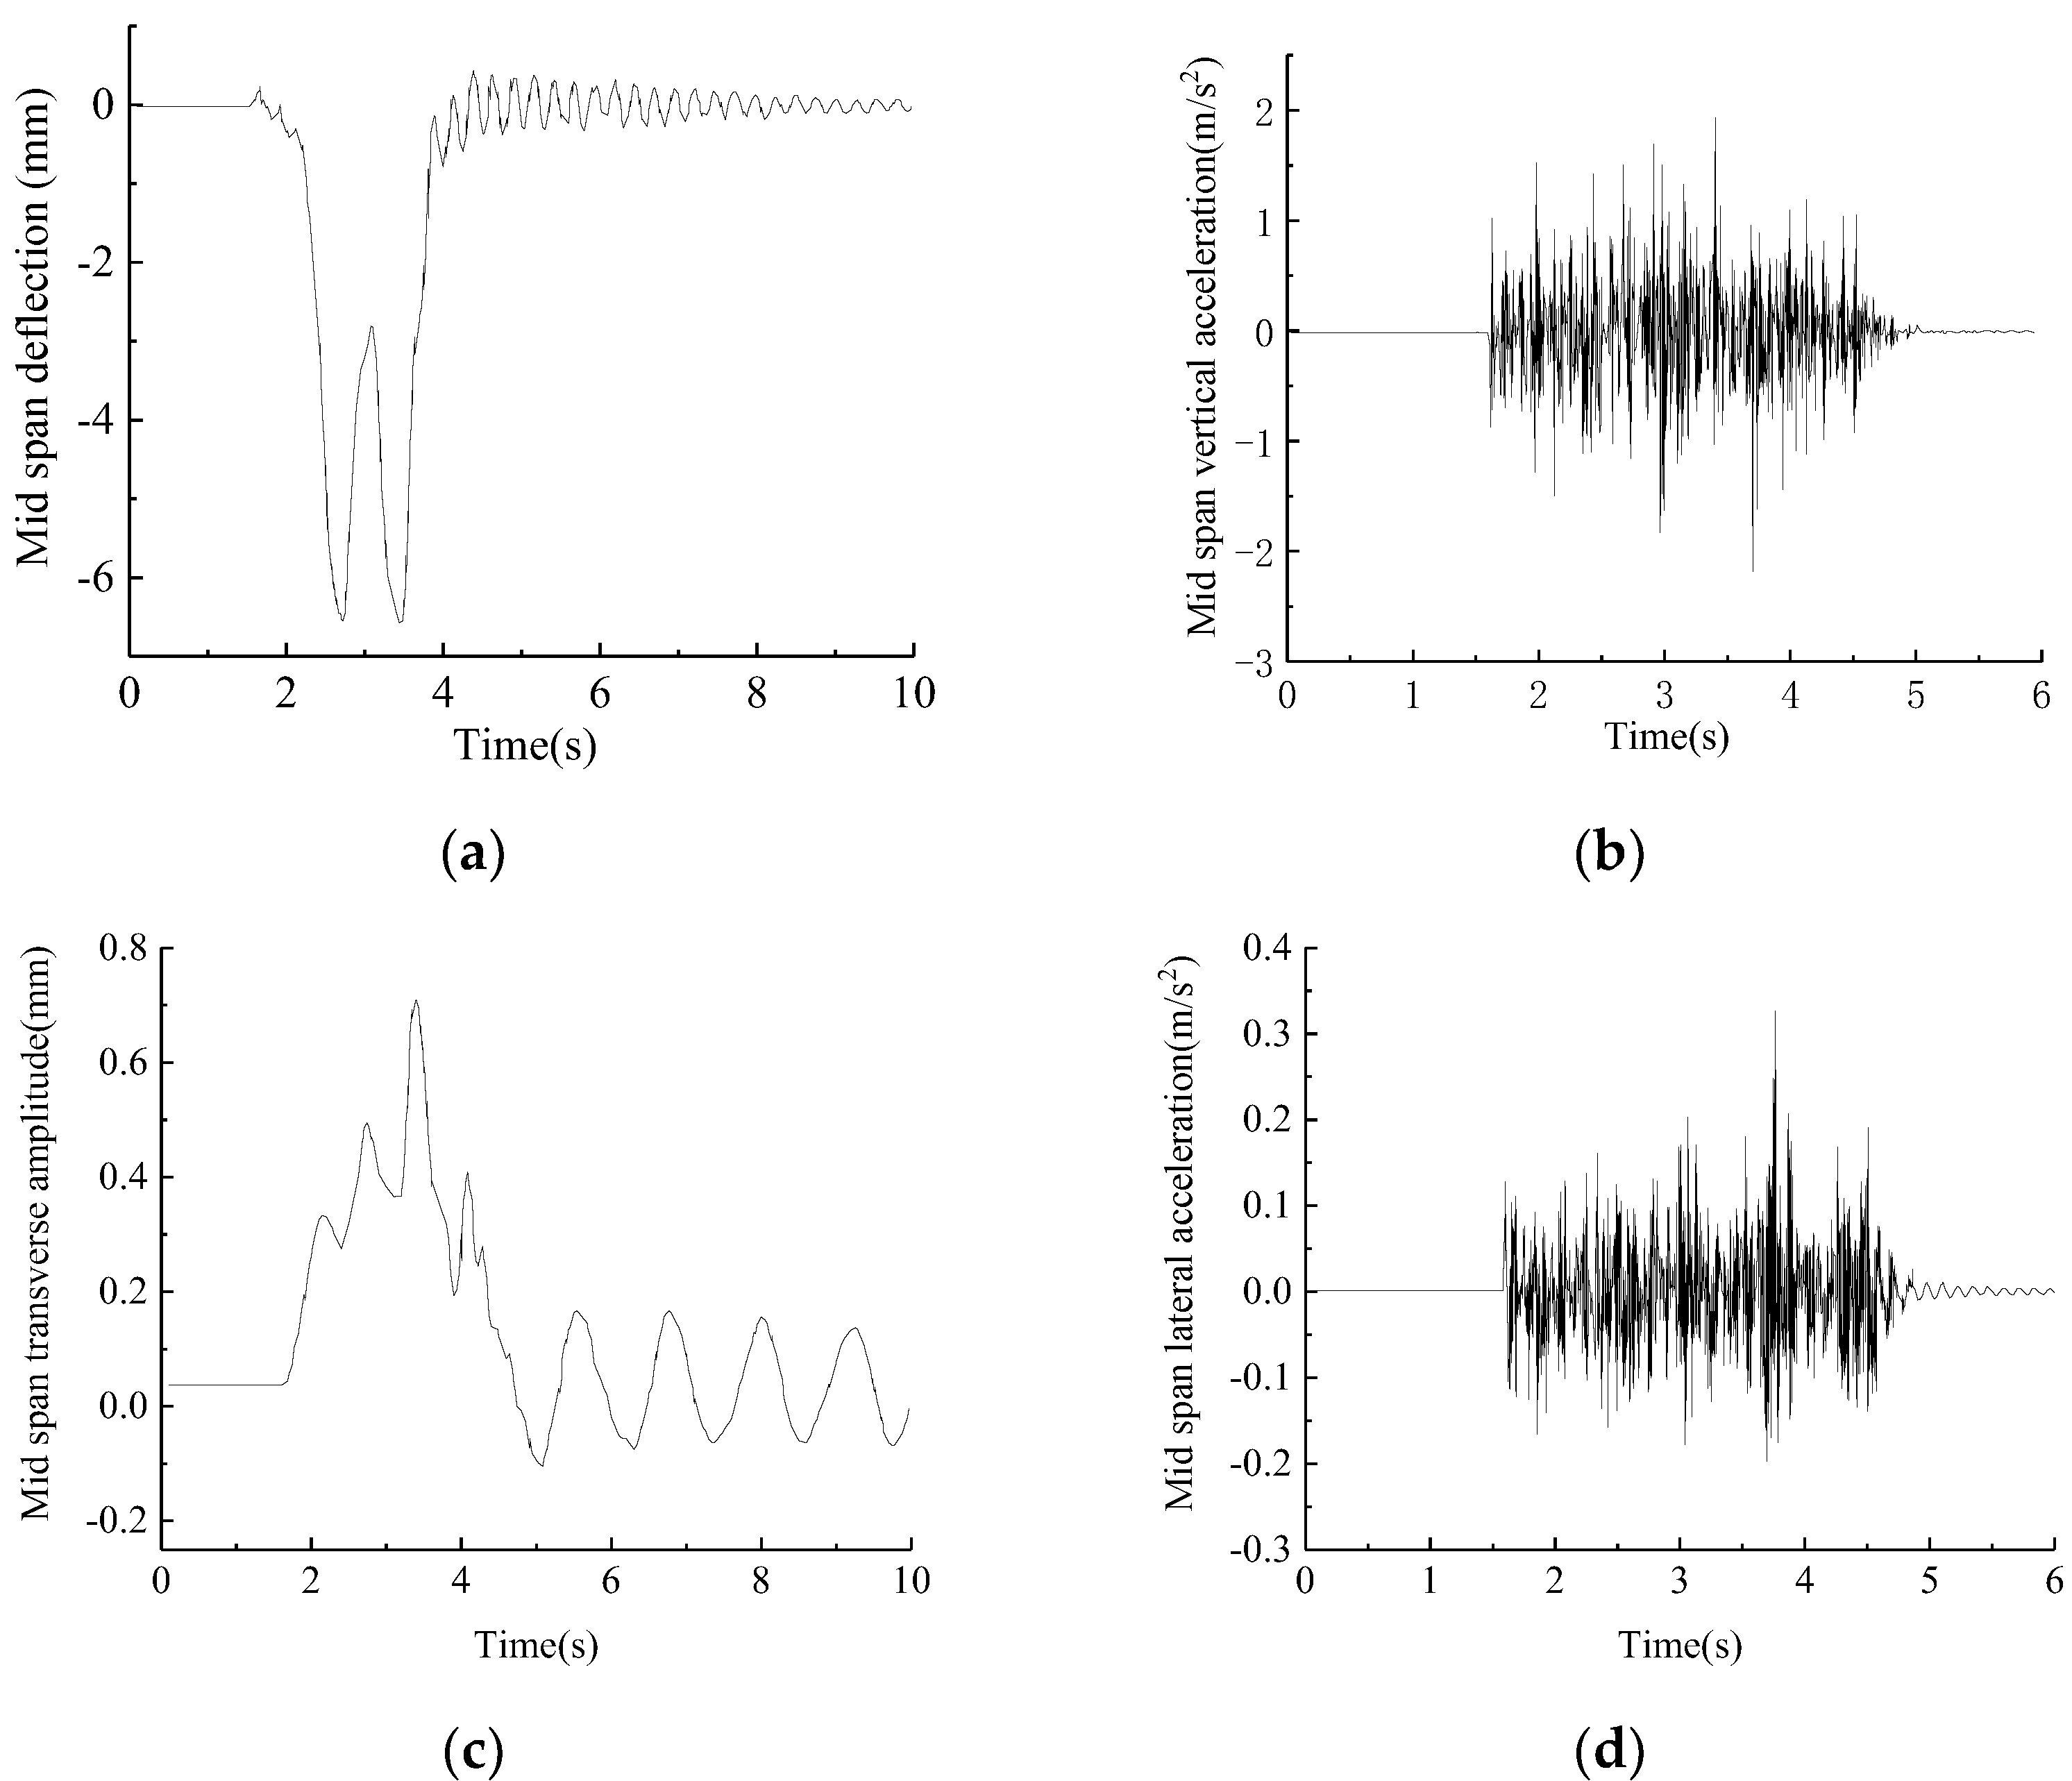
Figure 18.
Mid−span vibration response of structure with damping ratio of 0.025: (a) Mid−span deflection (mm). (b) Mid−span vertical acceleration (m/s2). (c) Mid−span transverse amplitude (mm). (d) Mid−span lateral acceleration (m/s2).
Figure 18.
Mid−span vibration response of structure with damping ratio of 0.025: (a) Mid−span deflection (mm). (b) Mid−span vertical acceleration (m/s2). (c) Mid−span transverse amplitude (mm). (d) Mid−span lateral acceleration (m/s2).
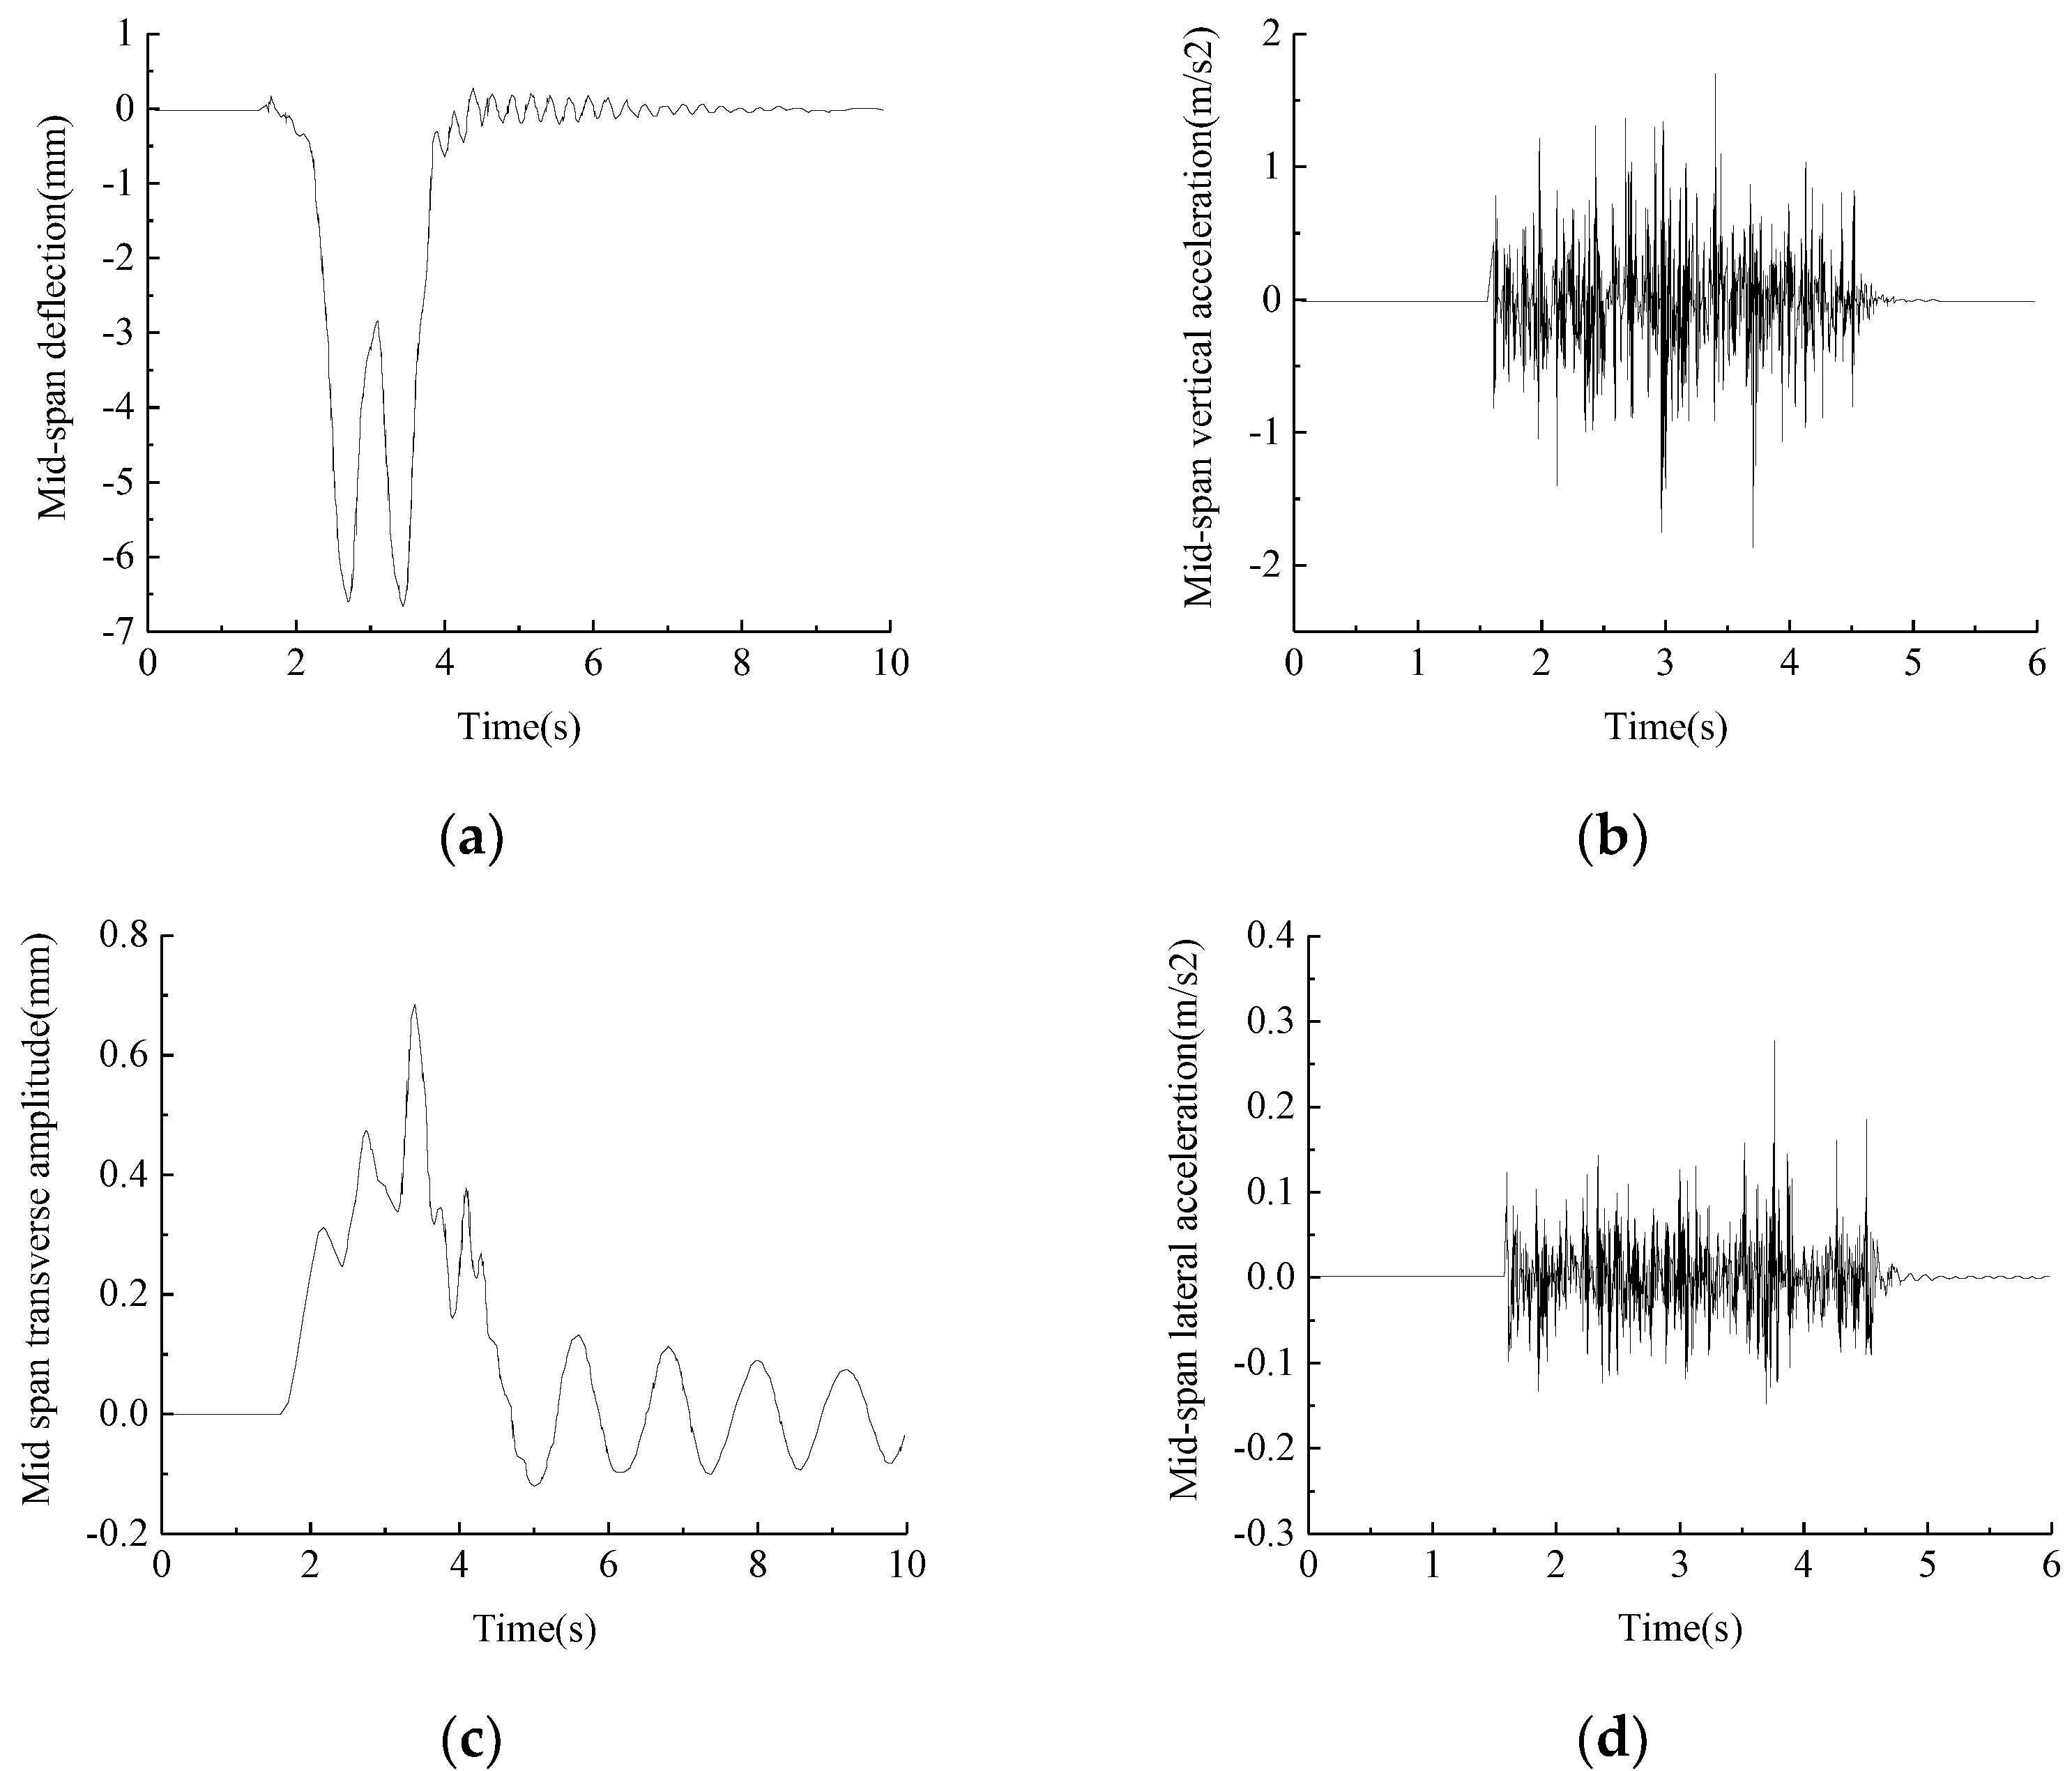
Figure 19.
Mid−span vibration response of structure with damping ratio of 0.05: (a) Mid−span deflection (mm). (b) Mid−span vertical acceleration (m/s2). (c) Mid−span transverse amplitude (mm). (d) Mid−span lateral acceleration (m/s2).
Figure 19.
Mid−span vibration response of structure with damping ratio of 0.05: (a) Mid−span deflection (mm). (b) Mid−span vertical acceleration (m/s2). (c) Mid−span transverse amplitude (mm). (d) Mid−span lateral acceleration (m/s2).
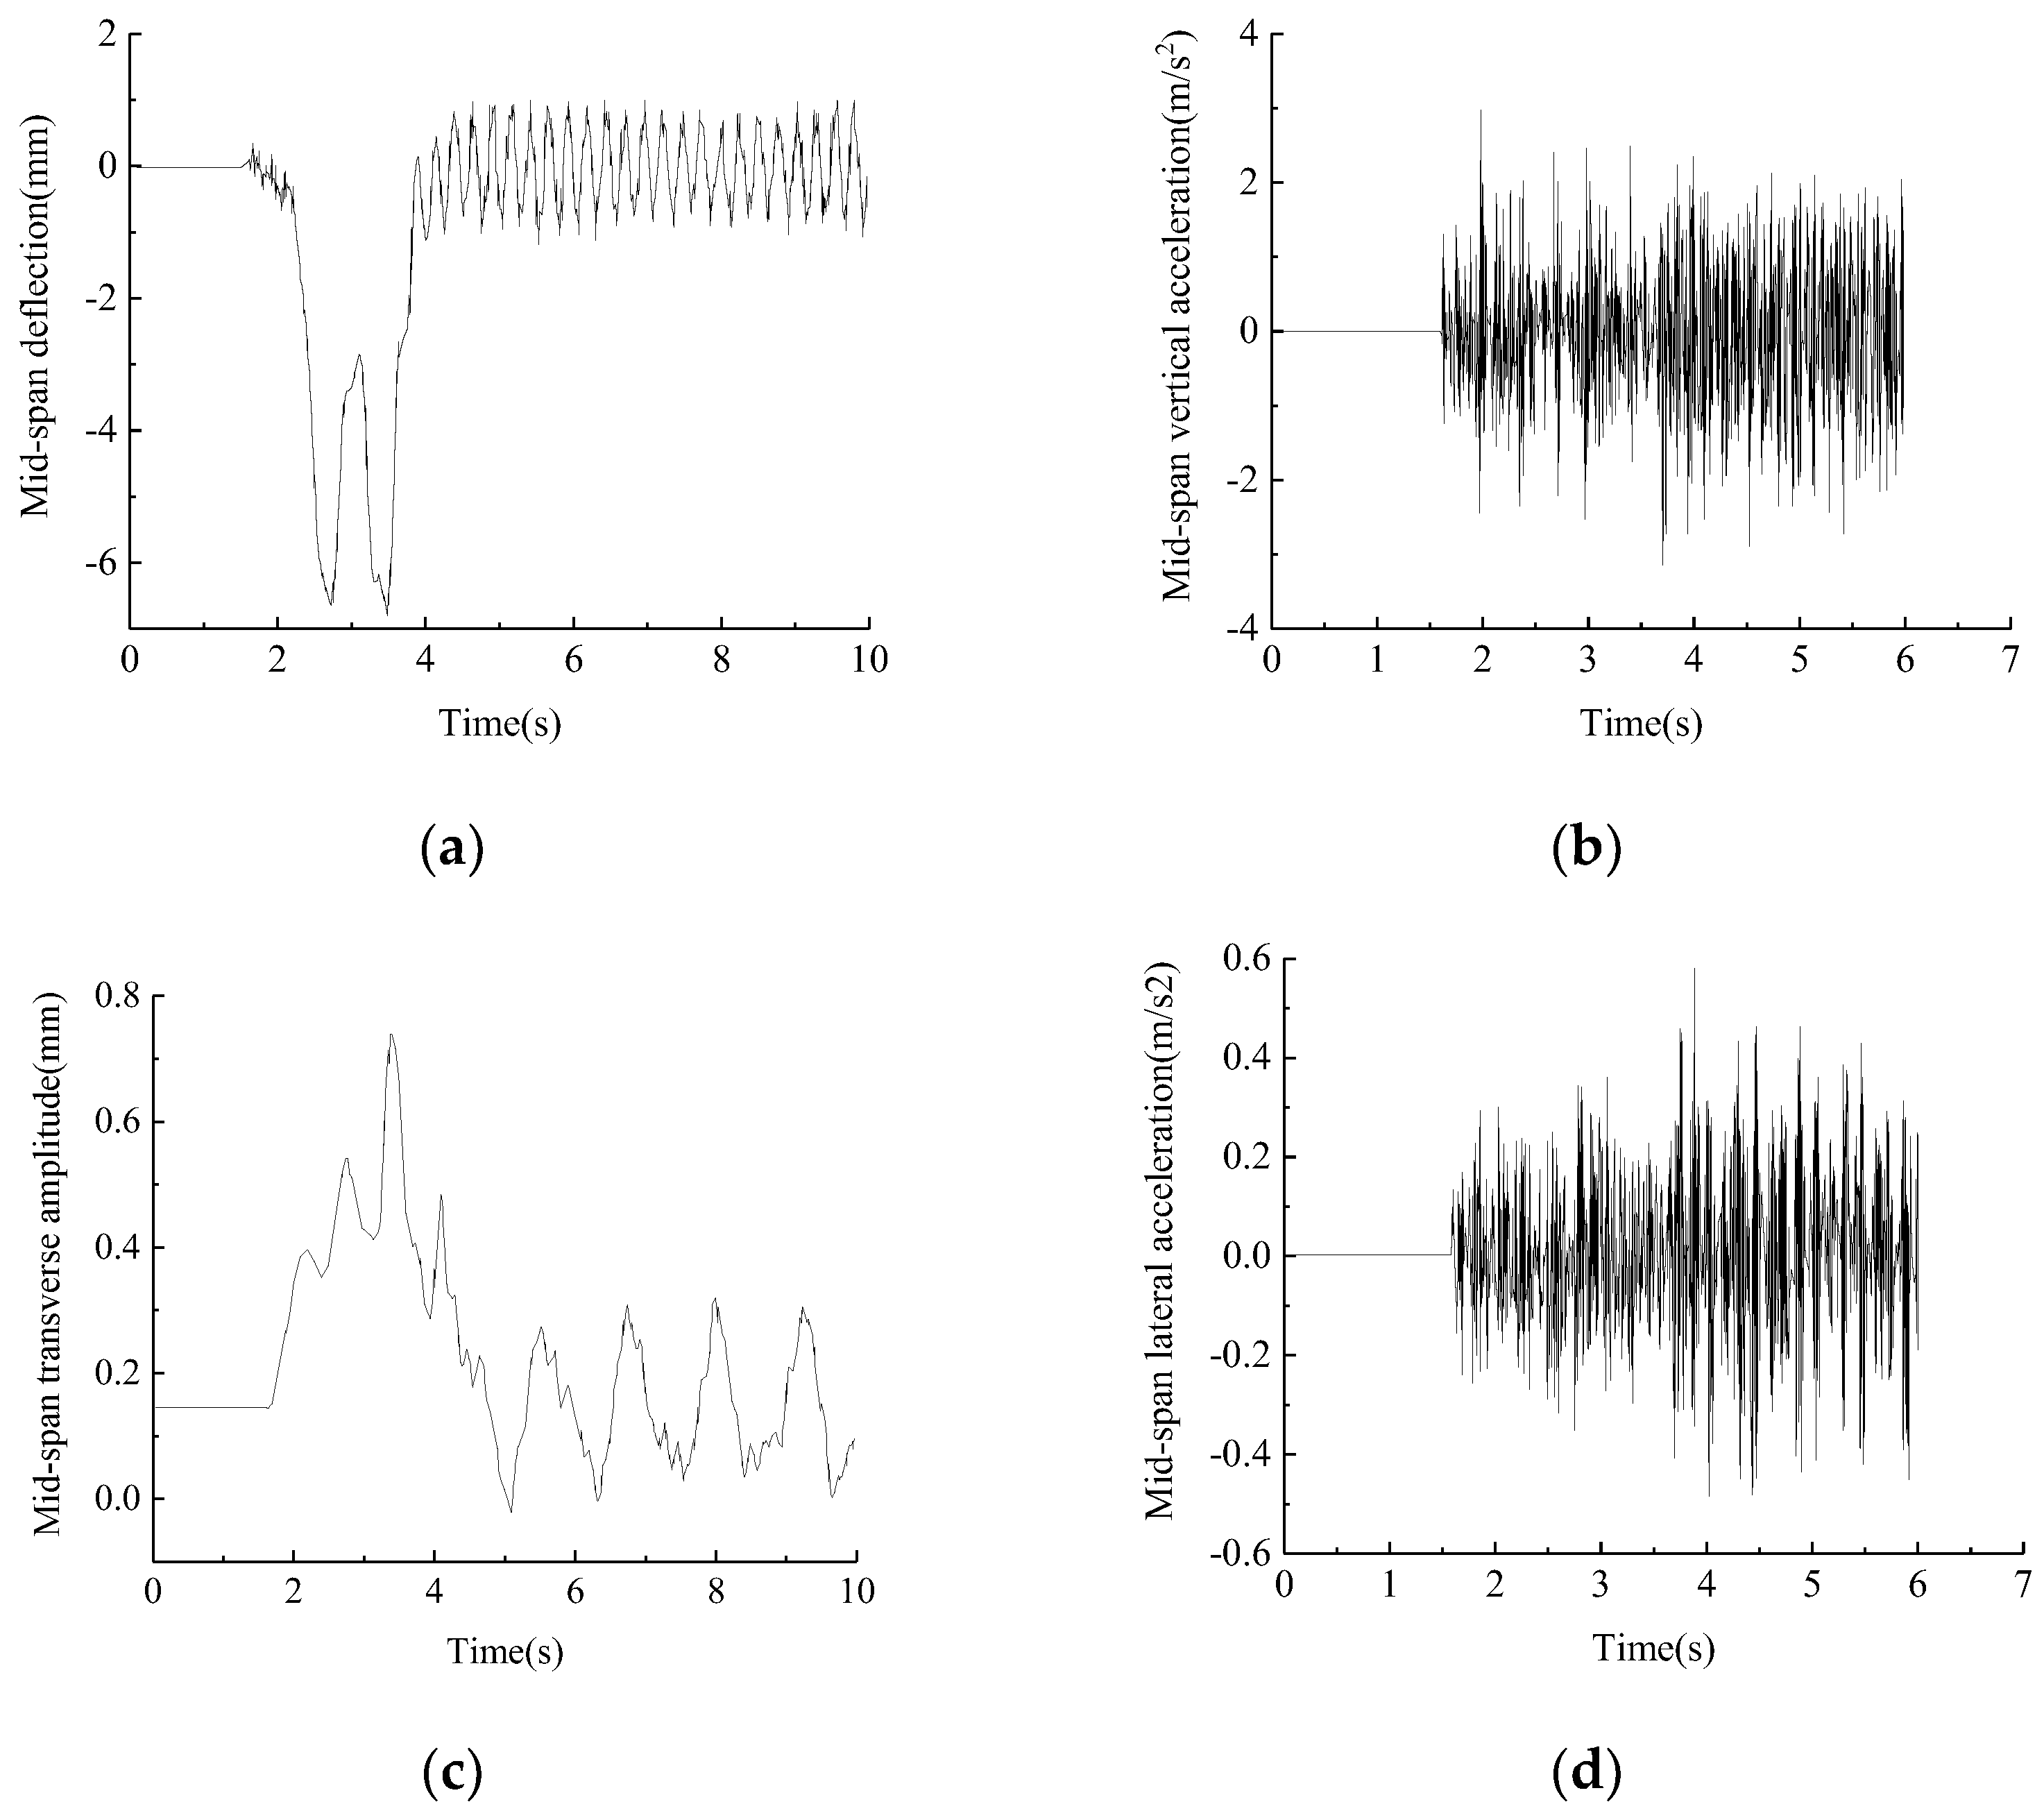
Figure 20.
Mid−span vibration response of structure with damping ratio of 0: (a) Mid−span deflection (mm). (b) Mid−span vertical acceleration (m/s2). (c) Mid−span transverse amplitude (mm). (d) Mid−span lateral acceleration (m/s2).
Figure 20.
Mid−span vibration response of structure with damping ratio of 0: (a) Mid−span deflection (mm). (b) Mid−span vertical acceleration (m/s2). (c) Mid−span transverse amplitude (mm). (d) Mid−span lateral acceleration (m/s2).
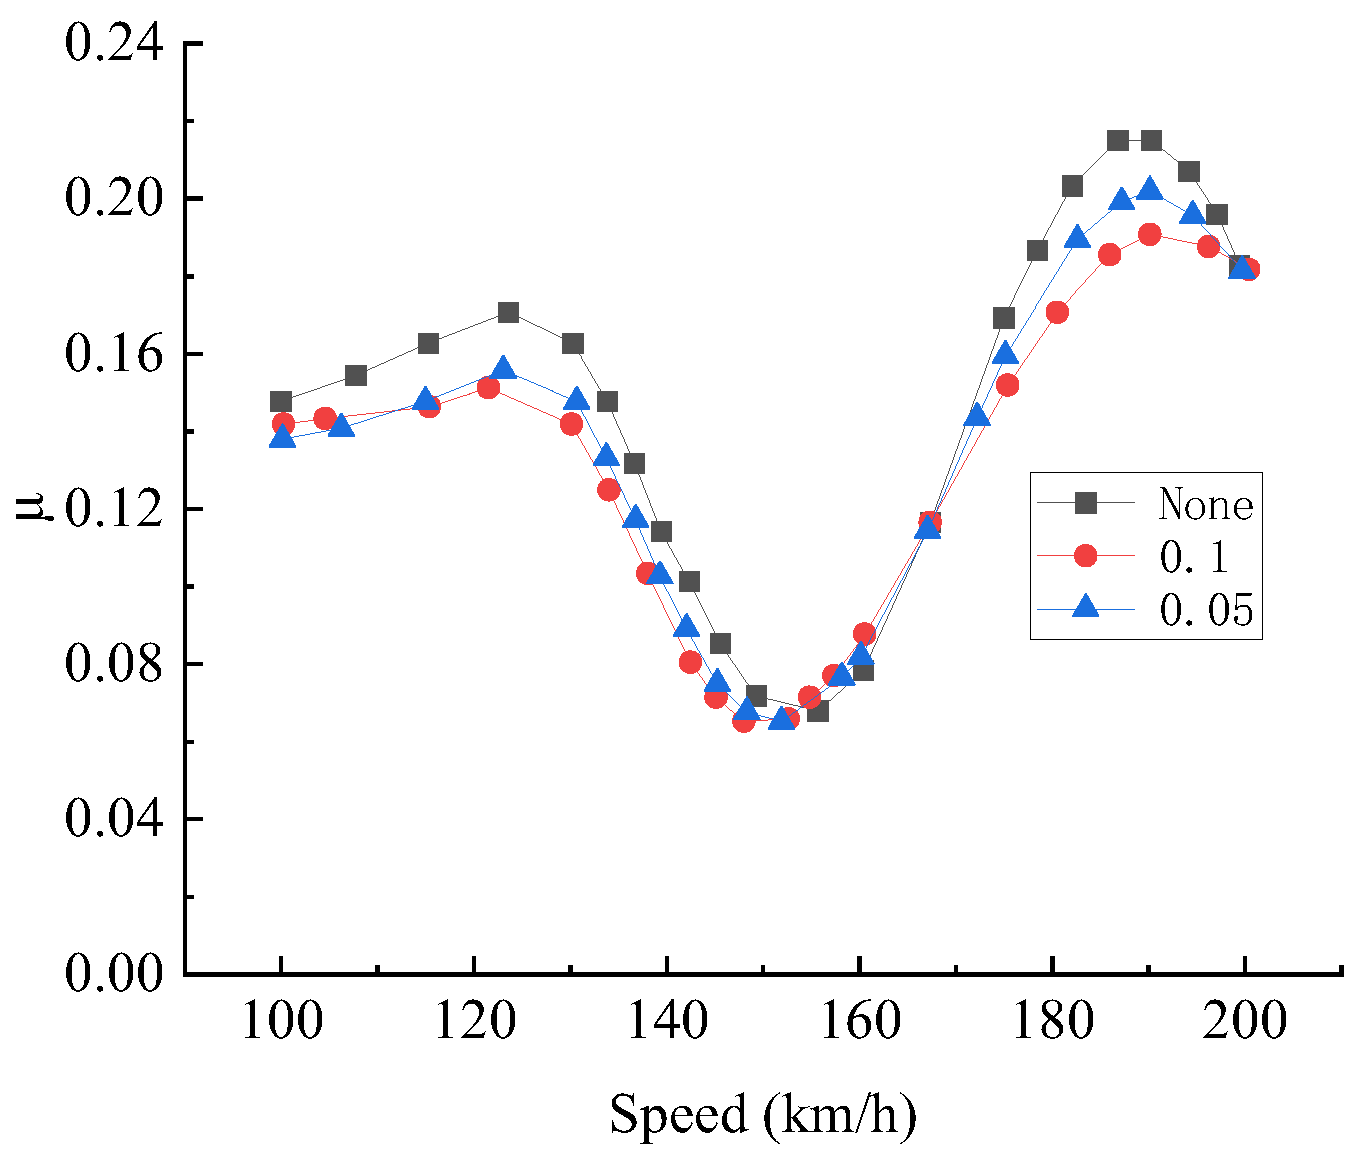
Figure 21.
The impact coefficient varies with the damping ratio of trains crossing the bridge.
Figure 21.
The impact coefficient varies with the damping ratio of trains crossing the bridge.
Table 1.
Basic parameters of sleeper.
Table 1.
Basic parameters of sleeper.
| Main Type | Sleeper Quality
| Sleeper Length
| The Average Width of the Bottom Surface
| Effective Support Length (Half Pillow)
|
|---|
| Speed-up line sleeper (type II) | 251 | 2.5 | 0.273 | 0.95 |
Table 2.
Calculation parameters of the strengthened longitudinal beam.
Table 2.
Calculation parameters of the strengthened longitudinal beam.
| Name | Type | Elasticity Modulus
(Pa) | Poisson’s Ratio | Moment of Inertia
| Acreage
(m2) | Altitude
(m) | Density
|
|---|
| I-beam | I100 | 2.1 × 10¹¹ | 0.3 | 9.23 × 10⁻³ | 6.56 × 10⁻² | 1 | 7800 |
Table 3.
Calculation parameters of reinforced beam.
Table 3.
Calculation parameters of reinforced beam.
| Type | Size (mm) | Acreage
(cm2) |
|---|
| h | b | d | t | r | r1 |
|---|
| I56b | 560.0 | 168.0 | 14.5 | 21.0 | 14.5 | 7.3 | 146.635 |
| I100 | 1000 | 360 | 40 | 40 | / | / | 656.00 |
Table 4.
Vertical forward tenth order modal characteristic frequency.
Table 4.
Vertical forward tenth order modal characteristic frequency.
| Modality | Midas/Civil (Hz) | ABAQUS (Hz) | Deviation |
|---|
| 1 | 23.206 | 24.239 | 4.44% |
| 24 | 25.892 | 27.705 | 3.17% |
| 3 | 26.841 | 28.981 | 4.25% |
| 4 | 29.367 | 30.568 | 4.09% |
| 5 | 30.818 | 32.625 | 5.87% |
| 6 | 33.298 | 37.538 | 3.72% |
| 7 | 36.877 | 41.804 | 2.55% |
| 8 | 46.620 | 45.762 | 1.84% |
| 9 | 48.576 | 48.211 | 0.74% |
| 10 | 50.310 | 53.507 | 6.34% |
Table 5.
Standard limits for dynamic performance evaluation of train-bridge systems.
Table 5.
Standard limits for dynamic performance evaluation of train-bridge systems.
| Classification | Index | Passenger Train | Freight Train |
|---|
| Security Index | derailment coefficient | 0.8 | 0.8 |
| Wheel load reduction rate | 0.9 | 0.9 |
| Axle lateral force (kN) | 48 | 84 |
| Riding index | Body acceleration (g) | transverse | 0.10 | 0.5 |
| vertical | 0.13 | 0.7 |
| Sperling index | transverse | 3.0 | 4.25 |
| vertical | 3.0 | 4.25 |
| Bridge dynamic performance | Lateral amplitude (mm) | 2.00 |
| Vertical amplitude (mm) | 10.00 |
| Lateral acceleration (g) | 0.20 |
| vertical acceleration (g) | 0.35 |
Table 6.
US AAR orbital spectral parameters.
Table 6.
US AAR orbital spectral parameters.
| Parameters | Line Grade |
|---|
| Class One | Class Two | Class Three | Class Four | Class Five | Class Six |
|---|
| (cm2·rad/m) | 1.2107 | 1.0181 | 0.6816 | 0.5376 | 0.2095 | 0.0339 |
| (cm2·rad/m) | 3.3634 | 1.2107 | 0.4128 | 0.3027 | 0.0762 | 0.0339 |
| (rad/m) | 0.6046 | 0.9308 | 0.8520 | 1.1312 | 0.8209 | 0.4380 |
| (rad/m) | 0.8245 | 0.8245 | 0.8245 | 0.8245 | 0.8245 | 0.8245 |
| Maximum allowable speed (km/h) | Truck | 16 | 40 | 64 | 96 | 128 | 176 |
| Passenger | 24 | 48 | 96 | 128 | 144 | 176 |
Table 7.
The dynamic response of the train under various track irregularity grades. (“*” is displayed for any data that do not meet the specifications).
Table 7.
The dynamic response of the train under various track irregularity grades. (“*” is displayed for any data that do not meet the specifications).
| Overhead System | Grade of Irregularity | Derailment Coefficient | Horizontal Force (kN) | Vertical Acceleration (m/s2) | Lateral Acceleration (m/s2) | Wheel Weight Load Shedding Rate | Sperling Index |
|---|
| Vertical | Lateral |
|---|
| I | Level 1 | *1.98* | *154.91* | 0.87 | *2.41* | *2.48* | 2.38 | 2.69 |
| Level 2 | *1.37* | *126.78* | 0.22 | *2.53* | *1.92* | 1.56 | 2.54 |
| Level 3 | *1.63* | *71.93* | 0.30 | *1.44* | *1.27* | 1.34 | 2.47 |
| Level 4 | *1.21* | 42.82 | 0.47 | *1.43* | *0.78* | 1.58 | 2.41 |
| Level 5 | 0.65 | 32.82 | 0.35 | 0.56 | 0.59 | 1.26 | 2.16 |
| Level 6 | 0.56 | 31.34 | 0.09 | 0.70 | 0.46 | 1.12 | 1.62 |
| II | Level 1 | *1.56* | *152.41* | 0.53 | *2.74* | *2.42* | 1.85 | 2.80 |
| Level 2 | *1.82* | *115.31* | 0.43 | *2.66* | *2.08* | 1.24 | 2.71 |
| Level 3 | *1.65* | *87.42* | 0.38 | 0.85 | *1.63* | 1.14 | 2.63 |
| Level 4 | 0.82 | *58.79* | 0.41 | *1.41* | *1.54* | 1.60 | 2.42 |
| Level 5 | 0.51 | 26.68 | 0.37 | 0.84 | 0.60 | 1.43 | 1.91 |
| Level 6 | 0.32 | 20.00 | 0.11 | 0.51 | 0.27 | 1.09 | 1.64 |
Table 8.
The dynamic response of the aerial system under various track irregularity grades.
Table 8.
The dynamic response of the aerial system under various track irregularity grades.
| Overhead System | Grade of Irregularity | Vertical Displacement (mm) | Lateral Displacement (mm) | Vertical Acceleration (m/s2) | Lateral Acceleration (m/s2) |
|---|
| I | Level 1 | 2.39 | 0.65 | 1.63 | 0.47 |
| Level 2 | 2.28 | 0.63 | 1.75 | 0.82 |
| Level 3 | 2.29 | 0.53 | 1.64 | 0.54 |
| Level 4 | 2.17 | 0.48 | 1.72 | 0.18 |
| Level 5 | 2.16 | 0.14 | 1.83 | 0.18 |
| Level 6 | 2.07 | 0.11 | 1.71 | 0.18 |
| II | Level 1 | 3.13 | 0.54 | 1.48 | 0.68 |
| Level 2 | 3.04 | 0.69 | 2.48 | 0.56 |
| Level 3 | 3.04 | 0.40 | 1.42 | 0.72 |
| Level 4 | 2.95 | 0.39 | 1.59 | 0.45 |
| Level 5 | 2.83 | 0.21 | 1.47 | 0.22 |
| Level 6 | 2.82 | 0.12 | 1.29 | 0.21 |
Table 9.
Dynamic response of freight train under AAR5 track irregularity.
Table 9.
Dynamic response of freight train under AAR5 track irregularity.
| Overhead System | Derailment Coefficient | Lateral Force (KN) | Vertical Acceleration
(m/s2) | Lateral Acceleration (m/s2) | Wheel Weight Reduction Rate | Sperling Index |
|---|
| Vertical | Lateral |
|---|
| I | 0.77 | 73.60 | 2.08 | 2.60 | 0.78 | 3.07 | 3.56 |
| II | 0.58 | 50.60 | 1.02 | 1.82 | 0.54 | 2.05 | 2.38 |
Table 10.
Response of trains crossing the bridge at different speeds. (“*” is displayed for any data that do not meet the specifications).
Table 10.
Response of trains crossing the bridge at different speeds. (“*” is displayed for any data that do not meet the specifications).
| Overhead System | Speed (km/h) | Derailment Coefficient | Lateral Force (kN) | Vertical Acceleration (m/s2) | Lateral Acceleration (m/s2) | Wheel Weight Reduction Rate | Sperling Index |
|---|
| Vertical | Lateral |
|---|
| I | 20 | 0.71 | 21.45 | 0.17 | 0.27 | 0.53 | 0.97 | 0.57 |
| 40 | 0.64 | 33.08 | 0.30 | 0.88 | 0.54 | 0.98 | 1.93 |
| 60 | 0.69 | 41.69 | 0.29 | *1.04* | 0.60 | 1.65 | 2.82 |
| 80 | 0.73 | *48.55* | 0.29 | *1.38* | 0.73 | 1.31 | 2.42 |
| 100 | 0.81 | *56.06* | 0.31 | *1.98* | *1.07* | 1.73 | 2.89 |
| II | 20 | 0.49 | 18.90 | 0.09 | 0.19 | 0.38 | 0.78 | 1.32 |
| 40 | 0.50 | 23.20 | 0.39 | 0.74 | 0.43 | 1.18 | 1.77 |
| 60 | 0.51 | 30.96 | 0.25 | *1.17* | 0.67 | 0.92 | 1.62 |
| 80 | 0.61 | 38.02 | 0.31 | *1.26* | 0.75 | 1.54 | 2.31 |
| 100 | 0.83 | 45.10 | 0.34 | *1.40* | 0.95 | 1.71 | 2.72 |
Table 11.
The response of the overhead system at different speeds.
Table 11.
The response of the overhead system at different speeds.
| Overhead System | Speed (km/h) | Vertical Deflection (mm) | Lateral Displacement (mm) | Vertical Acceleration (m/s2) | Lateral Acceleration (m/s2) |
|---|
| I | 20 | 2.06 | 0.13 | 0.62 | 0.06 |
| 40 | 2.15 | 0.14 | 1.75 | 0.10 |
| 60 | 2.20 | 0.19 | 2.71 | 0.15 |
| 80 | 2.35 | 0.20 | 3.20 | 0.27 |
| 100 | 2.62 | 0.16 | *3.88* | 0.41 |
| II | 20 | 2.83 | 0.19 | 0.27 | 0.13 |
| 40 | 2.84 | 0.21 | 0.79 | 0.08 |
| 60 | 2.79 | 0.21 | 1.04 | 0.12 |
| 80 | 2.87 | 0.24 | 1.41 | 0.17 |
| 100 | 2.93 | 0.26 | 1.82 | 0.21 |
Table 12.
Maximum response in lower span with a different damping ratio.
Table 12.
Maximum response in lower span with a different damping ratio.
| Damping Ratio | Across the Deflection (mm) | Lateral Displacement (mm) | Vertical Acceleration (m/s2) | Lateral Acceleration (m/s2) |
|---|
| none | 6.682 | 0.735 | 3.138 | 0.586 |
| 0.025 | 6.605 | 0.709 | 2.235 | 0.336 |
| 0.050 | 6.620 | 0.690 | 1.862 | 0.278 |
| 0.075 | 6.621 | 0.673 | 1.633 | 0.232 |
| 0.100 | 6.618 | 0.658 | 1.484 | 0.200 |


