Article

Multistationary Geomagnetic Vertical Intensity Polarization Anomalies for Predicting M ≥ 6 Earthquakes in Qinghai, China

1
State Key Laboratory of Tibetan Plateau Earth System, Resources and Environment (TPESRE), Institute of Tibetan Plateau Research, Chinese Academy of Sciences, Beijing 100101, China
2
Qinghai Earthquake Agency, Xining 810001, China
3
University of Chinese Academy of Sciences, Beijing 100049, China
4
Jiangsu Earthquake Agency, Nanjing 400071, China
5
Yunnan Earthquake Agency, Kunming 650224, China
6
Shandong Earthquake Agency, Jinan 250014, China
7
Geophysics Department, School of Earth Sciences, Yunnan University, Kunming 650500, China
*
Authors to whom correspondence should be addressed.
Appl. Sci. 2022, 12(17), 8888; https://doi.org/10.3390/app12178888
Submission received: 11 August 2022 / Revised: 1 September 2022 / Accepted: 3 September 2022 / Published: 5 September 2022
(This article belongs to the Section Earth Sciences)

Abstract

:
Single-stationed geomagnetic vertical intensity polarization (GVIP) anomalies have demonstrated good predictions of the occurrence of large earthquakes in Japan. Nonetheless, due to the lack of a previously densified geomagnetic network, how the multistationary GVIP anomaly (MGVIPA) corresponds to impending earthquakes remains poorly understood. Based on the newly constructed geomagnetic network from 2014 in Qinghai, China, which is composed of 23 electromagnetic stations, we suggested an MGVIPA method to analyze the correlation with large earthquakes since 2015. The results show that (1) the occurrence of MGVIPA is characterized by clusters in time that continue in a short period; (2) the spatial distribution of MGVIPA usually occurs with high values synchronously at several places over the same period; and (3) the Mw ≥ 6 earthquakes occurred in the regions indicated by MGVIPA within a period ranging from 3 months to 1 year from 2015 to 2021 in Qinghai, China.

1. Introduction

Previous studies on geomagnetic numerical simulations have shown that in magnetic field signals with frequency bands of 10−2~102 Hz, the amplitude of the vertical component of the primary source from the magnetic signal inside the crust observed at the surface is greater than or close to the amplitude of the horizontal component (e.g., [1]). The ratio of the amplitude of the vertical component to the horizontal component of the magnetic field from the Earth’s crust is greater than or close to one. However, based on electromagnetic induction theory, the ratio of the amplitude of the vertical component to the horizontal component of the magnetic signal from the outer space of the ionosphere is less than one. Hayakawa et al. [2] developed the method of geomagnetic vertical intensity polarization (GVIP) to extract the high amplitude ratio of the geomagnetic vertical component to the horizontal component and obtain the magnetic field signal from the subsurface. By analyzing the changes in polarization values before and after the Mw 8.0 earthquake in Guam on 8 August 1993, and using magnetic fluxgate magnetometer observations at the Guam Geomagnetic Station, which is located 65 km away from Guam, studies found that the polarization value in the 0.01–0.05 Hz (100–20 s) band gradually increased in the two months before the earthquake, reaching a maximum at the time of the earthquake, and gradually recovered after the earthquake (e.g., [2]). Numerous seismic events have since been identified anomalously through high polarization values in the days to three months prior to the earthquake (e.g., [3,4,5,6,7]). Hobara et al. [8] subjected the polarization results to a more refined frequency segmentation, and more significant anomalous signals of polarization values were extracted in the frequency bands of 0.02–0.022 Hz (50–45 s) and 0.05–0.1 Hz (20–10 s) before the 1997 Guam Mw 8.0 earthquake and the 2000 Izu swarm earthquakes. Based on fluctuation theory, a three-dimensional anomalous body model was constructed, and the seismic geomagnetic disturbance signal coinciding with the anomalous polarization value was obtained by numerical simulation (e.g., [8]). Feng et al. [9] found that geomagnetic vertical intensity polarization has an annual variation characteristic and eliminated it before extracting the high value of the polarization anomaly. The high value of the polarization anomaly at the Kashi station after eliminating the annual variation corresponds well to the earthquakes around the station that occur 2 months after it, with most of the earthquakes occurring within 1 month [9].
Although some earthquake predictions have been obtained by the GVIP anomaly method, the reliability of this method for extracting information on seismic geomagnetic anomalies is still unknown. First, selecting data at midnight does not fully prevent the influence of the magnetospheric current system on the elevated polarization values, even though many studies have demonstrated that high polarization values are negatively correlated with the geomagnetic activity index (e.g., [9,10,11,12,13]). Second, due to the limitations of station observation data quality and station spacing, pre-seismic anomalies usually exist only at the single station with the closest epicenter, and the reliability of pre-seismic anomalies is often questioned when data interference cannot be excluded. However, based on the small-aperture array observation data established in northwest Yunnan, Li et al. [12] extracted the pre-seismic polarization anomalies at several stations using the polarization method. Their results showed that the polarization values of each station had abnormally high fluctuations half a month before the earthquakes occurred and returned to normal one week before the earthquake, and the amplitude of the anomalies gradually decreased with increasing distance from the epicenter, which was consistent with the attenuation characteristics of seismic electromagnetic disturbance signals (e.g., [14]). Feng et al. [9] obtained magnetic flux gate second sampling data from nearly 100 geomagnetic stations nationwide to study the relationship between Mw > 6 events and polarization value anomalies in western mainland China (west of 110° E) from 2015 to 2018 and found that multiple stations in a certain range near the epicenter before the earthquake would have anomalies at the same time, and the anomaly area was proportional to the magnitude. The larger the area is, the higher the magnitude. The seismic correspondence rate (seismic anomaly/all anomalies) reaches 65% in six months and reaches 80% within one year [15]; these works illustrated that pre-earthquake anomalies do not only exist at the single station closest to the epicenter. In addition, Fan et al. [16] also found groups of GVIP high anomalies at multiple stations in western China during the period of 2019–2020.
Based on the above work, we aim to investigate the multistation geomagnetic vertical intensity polarization high-value anomalies before the occurrences of several strong earthquakes, such as the Yangbi Mw 6.4 earthquake in Yunnan, the Mado Mw 7.4 earthquake in Qinghai, and the Luxian Mw 6.0 earthquake in Sichuan during 2020–2021. The correlations between the simultaneous GVIP anomaly and the occurrence of subsequent earthquakes in western China from 2015–2021 are discussed.

2. Data and Methods

The definition of geomagnetic vertical intensity polarization [2,9] is shown mathematically as:
Y z h = | Z ( ω ) H ( ω ) |
H ( ω ) = H x 2 ( ω ) + H y 2 ( ω )
where Z(ω) is the spectral amplitude value of the geomagnetic vertical component, H(ω) is the spectral amplitude value of the full vector of the geomagnetic horizontal component, Hx(ω) is the north-south spectral value of the geomagnetic horizontal component, Hy(ω) is the east–west spectral value of the geomagnetic horizontal component, and ω is the circular frequency.
If the instrument frequency response needs to be considered, then
Z ( ω ) = G Z ( ω ) Z ( ω )
H x ( ω ) = G H x ( ω ) H x ( ω )
H y ( ω ) = G H y ( ω ) H y ( ω )
where Z ( ω ) is the spectral amplitude value of the vertical component of the geomagnetic field observed by the instrument, H x ( ω ) is the north-south spectrum of the horizontal component of the geomagnetic field observed by the instrument, H y ( ω ) is the east–west spectrum of the horizontal component of the geomagnetic field observed by the instrument, and G ( ω ) is the instrument frequency response curve.
The fluxgate magnetometer G value is generally approximated as 1, but induction magnetometers need to be calibrated using the instrument. Induction magnetometers consist of a magnetic sensor and a recorder, so the product of the two is used in practice. In addition, attention should be given to the long-term stability of the G value.
The calculation process extracts the high ratio of polarization values to obtain the magnetic field signal from the crust of the primary source. The specific calculation process includes the following steps: first, obtaining the daily polarization value series of stations, fitting the daily polarization value series, and establishing the threshold curve that reflects the annual variation of polarization value; second, removing the daily polarization value below the threshold to obtain the daily polarization value series of high ratio, and using the fitting method to further eliminate the residual annual variation in the daily polarization value series of high ratio; third, the polarization values with higher than 2 times the mean-variance are considered anomalies. To reduce the influence of factors such as the geoelectrical structure, instruments, and the environment on the polarization value, we normalize the polarization value by 2 times the mean squared difference of the one-year window length of each station before drawing the contour of the spatial distribution of the polarization value and then subtract 1 after normalization. The high-value anomalies above 0 are called normalized zero-polarized values. Take the day with the most anomalous stations as the anomaly day and plot the normalized zero polarization values of all stations on the anomaly day. If the conditions of the grouping anomalies are met, the anomaly spatial contour map is drawn after superimposing the multiple anomalies in a group.
The distribution of fluxgate second sampling observation stations in western China in 2019 is given in Figure 1. Before 2014, the distribution of geomagnetic stations in western China was relatively sparse, and there were large blind monitoring areas in Xinjiang, Tibet, and Qinghai. Since 2015, geomagnetic stations have been rapidly constructed, and the current scale was formed. Therefore, the second sampling observation from the fluxgate magnetometer output of the geomagnetic observation stations west of 110° E in mainland China from 2015 to 2021 is adopted in this study.

3. Results

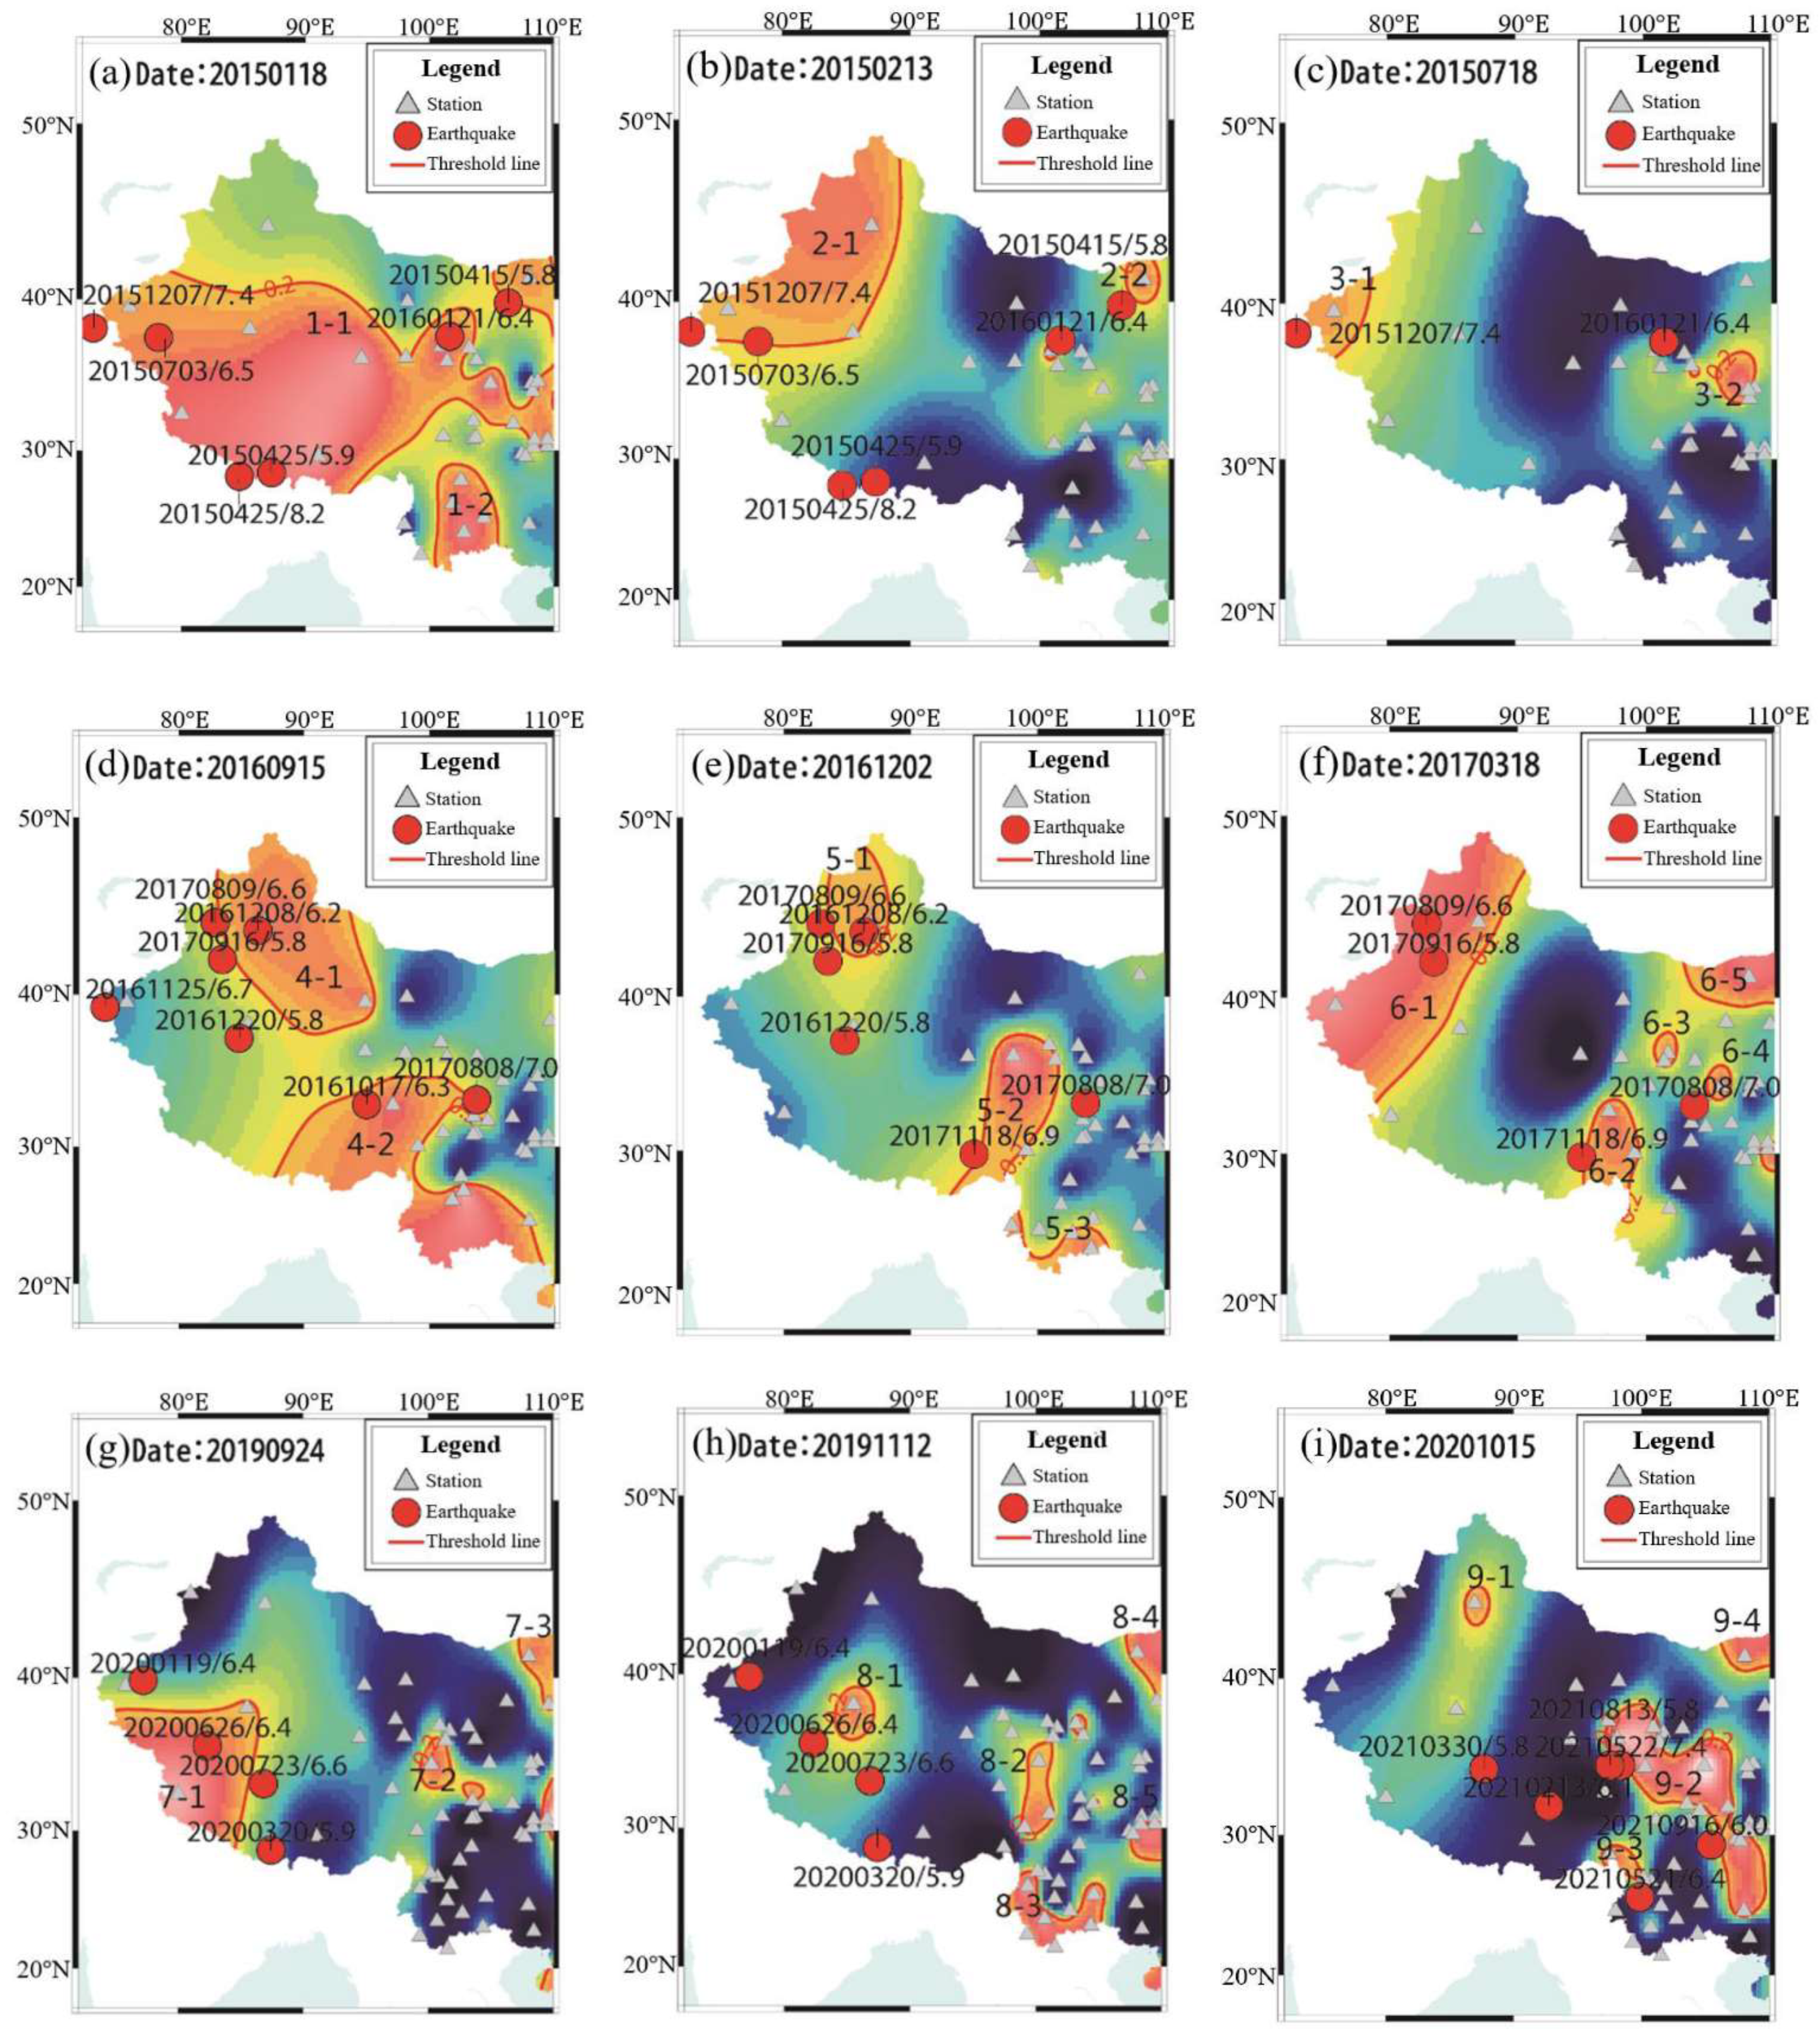
3.1. Multistationary Geomagnetic Vertical Intensity Polarization Anomalies

From January 2015 to December 2021, there were 18 geomagnetic vertical intensity polarization high-value anomalies in western mainland China [13], including nine anomalies over two or more anomalous regions. The spatial distribution of the nine anomalies is given in Figure 2 in the order of their occurrence.
The yellow and red areas are the anomalous regions, and their mathematical significance is that the polarization value exceeds two times the mean squared difference. Moreover, the area above the contour 0.2 is the predicted seismogenic region according to the statistical results of the example. The first four times all had two anomalous regions, then 20161202 and 20190924 had three anomalous regions, 20201015 had four anomalous regions, while 20170318 and 20191112 each formed five anomalous regions. Among them, the most significant anomaly is the anomaly of 18 January 2015, in Tibet, Qinghai, Xinjiang, and Gansu (Figure 2a), where a total of 16 high-value anomaly stations appeared, forming a very large anomaly area named “1-1” with an area of 288 × 104 km2. The anomaly of 15 September 2016 formed two larger anomaly areas with a total area of more than 288 × 104 km2. The anomaly of 15 October 2020 has the largest number of anomalous stations in the dense area of stations in the north-south seismic zone among the nine grouped anomalies, with 11 high-value anomalous stations and an anomalous area of 58 × 104 km2.

3.2. Characteristics of Anomaly Spatial Groupings

Geomagnetic vertical intensity polarization anomalies have the characteristic of occurring in groups in space [17], i.e., geomagnetic vertical intensity polarization usually appears high in multiple locations synchronously in time, and a single anomaly can be spatially divided into several anomaly areas, each with an area larger than 3 × 10⁴ km2 (e.g., [15]). In this study, such anomalies with several anomaly areas occurring spatially and synchronously in time are referred to as anomaly grouping or anomaly groups. After analyzing the spatial distribution map of the nine groups of anomalies in Table 1, all of these anomalies have the characteristic of anomaly grouping. Figure 2 shows that the earthquakes basically occurred in or near an area higher than 0.2. Each of the nine anomalies in Figure 2 occurred on the same day, and each anomaly produced more than two high-value anomaly areas. For example, two large and one small high-value anomaly zones were formed on 18 January 2015, 13 February 2015, 18 July 2015, 15 September 2016, and 2 December 2016, and multiple anomaly zones were formed on 18 March 2017, 24 September 2019, and 12 November 2019.
The MGVIPA formation events with multiple strong earthquakes occurring in and around the high-value anomaly area within 1 year are listed in Table 1, with a total of 10 events; in addition, the high-value anomaly on 15 October 2020, subsequently corresponds to the 22 May 2021, Mado 7.4 magnitude earthquake, and the corresponding period of this anomaly has not yet ended. According to the study of previous earthquake cases, there is still a possibility of strong earthquakes in this high-value area. In fact, on 16 September 2021, the Luzhou and Sichuan Mw 6.0 earthquakes occurred at the edge of this high-value region.

3.3. Earthquake Grouping Characteristics

To facilitate the discussion of the grouping characteristics of earthquakes occurring after anomalies, strong earthquakes with a magnitude Mw ≥ 5.8 that occurred within the high-value anomaly area and near its edges within 1 year after a group of anomalies are called a group of earthquakes. Earthquakes of magnitude 5.8 or more that occurred within 1 year after the anomaly appeared are marked on the anomaly distribution map (Figure 2).
From our analysis, 100% of the grouped earthquakes occurred within 1 year after the appearance of the grouped anomaly, and the epicenter location is still located inside or near the boundary of the high-value zone. However, there are two cases of earthquake groupings: first, all the earthquakes occurred within the same anomaly area, and no earthquakes occurred in other anomaly areas (e.g., [18]), such as Anomalies 7 and 8 in Table 1; second, earthquakes occurred in multiple anomaly areas of grouping anomalies, except for Anomalies 7 and 8, and the remaining seven groups of anomalies belong to this case, accounting for 70% of grouping anomalies.
In addition, as for the subsequent year of anomaly occurrences, multiple earthquakes of magnitude 5.8 or greater occurred in the subsequent year of five anomalies of 18 January 2015, 15 September 2016, 2 December 2016, 24 September 2019, and 12 November 2019. Specifically, on 15 September 2016 (Anomaly 4) and 24 September 2019 (Anomaly 7) had four earthquakes of magnitude 5.8 or greater in the anomaly area (e.g., [19,20]).
Among the 28 anomalous zones discussed in this section, 10 had more than two strong earthquakes in the follow-up, six had only one strong earthquake in the follow-up, and 12 had no strong earthquake in the follow-up.

3.4. Temporal Distribution of Earthquake Occurrences

The time difference between anomalies and subsequent corresponding earthquakes, as well as the seismic interval between sets of earthquakes corresponding to the same set of anomalies, are also presented in Table 1.
The subsequent first strong earthquakes after the appearance of the geomagnetic vertical intensity polarization anomaly ranged from 7–227 days. Of these, 1/9 occurred within 30 days, 4/9 occurred within 90 days, and 7/9 occurred within 180 days, with the longest being the Yutian 6.4 magnitude earthquake that occurred 227 days after the anomaly on 12 November 2019. In addition, the double earthquakes or series earthquakes have the longest corresponding time of 368 days.
The time difference between the two earthquakes in the group was 1–242 days, with twenty-two of the next earthquakes occurring within 100 days and five occurring more than 100 days after (e.g., [21]), including two events that occurred on 7 December 2015 (Tajikistan earthquake), two events on 8 August 2017 (Jiuzhaigou earthquake), and one on 16 September 2021 (Luzhou earthquake).

4. Discussion

Geomagnetic polarization anomalies are generally considered to be caused by electromagnetic radiation due to fault creep or rock rupture in the pre-earthquake source areas [22], which implies that multiple areas may experience fault creep or rock rupture simultaneously prior to an earthquake. According to the results of Ma et al. [23], the pre-earthquake regional stresses will appear to be concentrated at multiple points, and there is likely to be a similar connection between multiple strong earthquakes across the region or a strong earthquake sequence (e.g., [23]). The strong earthquakes in western mainland China discussed above are mainly distributed in the Qinghai-Tibet Plateau (i.e., Tibetan Plateau) and surrounding areas, and the occurrence of multiple earthquakes within a short period of time in the aforementioned areas may have the same tectonic genesis. The collision between the Indian and Eurasian plates led to the rapid uplift of the Tibetan Plateau, and the strong tectonic shifts have continued until the present time, resulting in strong seismic activity within and around the Tibetan Plateau [24]. The subsequent seismogenesis of multiple polarized high-value zones occurring simultaneously depends on the development of each gestation terrestrial body. Based on the solid-body earthquake gestation model [25], the areas can gradually accumulate a large amount of elastic potential energy during the slow relative plate motion. The high-speed block zones with solid-body properties and the ring-shaped distribution of a certain range of seismic activity enhancement zones on their periphery are caused by the higher rupture intensity of the source zone than the surrounding medium (e.g., [26,27]), and this difference also leads to the difference in electromagnetic radiation intensities.
From 1 January 2018 to 21 May 2021, only one Mw 4.9 earthquake occurred on 2 October 2019, in Tongren, Guizhou within the region of high geomagnetic vertical intensity polarization on 15 October 2020, and no Mw > 4 magnitude earthquake occurred in the rest of the region; from 3 October 2019 to 21 May 2021, no > Mw 4.0 earthquake occurred in the region, while the periphery of the high-value region, especially the periphery of the southwest boundary, had a higher concentration of seismic activity. In fact, 10 earthquakes of Mw > 4.0 occurred in the region during the 3 years from 1 January 2015 to 31 December 2017, including the Jiuzhaigou Mw 7.0 earthquake and two Mw > 5.0 earthquakes, which indicates that a more significant seismic calm occurred in the region from 3.5 to 1.5 years before the earthquake, which is in line with the characteristics of the solid-body that the peripheral areas rupture earlier than the solid-body interior (e.g., [28,29,30]). Xue et al. [31] summarized the characteristics of seismic activity before strong earthquakes occurred and concluded that the long axis of the gestation void area appeared from 370 to 780 km and 1–7 years before the earthquake, which agrees with the anomalous area counted in this study of 3~288 × 104 km2 and the circle diameter of 196~1970 km.
The results of geomagnetic sounding indicated that the main source and aftershock body of the Mado earthquake is in the junction area between the high conductivity of the middle and lower crust and the high-resistance body in the upper part [32]; similar results were obtained from studies in the eastern section of the East Kunlun and Longmenshan Fault Zones. These studies imply that strong earthquakes mostly occur near the significant electrical boundary zone at the block boundary, and this region is also the area where remarkable differences in electromagnetic radiation characteristics occur. The difference in the medium physical properties between and outside the seismogenic zones can last for a certain period. The reason why electromagnetic anomalies can be extracted only at specific times may be due to the limitation of the data processing level. The electromagnetic data using the geomagnetic vertical intensity polarization method still contain annual variations, monthly variations, and semimonthly variations, making the true high values of electromagnetic radiation submerged by noise or appear only under specific conditions or excited by external factors.
In addition to the electromagnetic signals [33,34], various forms of energy can be used as precursors to regular earthquakes for short-term forecasting, such as the acoustic (e.g., [35,36,37,38]) and neutron emission (e.g., [39,40,41,42]). The geological structure and acoustic emission (AE) can imply earthquake forecasting, for example, a large abrupt increase in the AE signals was observed at the Assisi earthquake [43]. The neutron flux variations can correspond to seismic activity in the Pamir region [44], and the relationship between neutron flux variations and the processes of the Earth’s crust can be used for the short-term prediction and monitoring of earthquakes (e.g., [41]). Furthermore, the geothermal variation near the surface was suggested to greatly affect the geomagnetic anomalies and indicates a potential for achieving specific understanding in earthquake prediction (e.g., [45,46]). Considering the spatial gradient of thermal sources beneath the active tectonic settings, geothermal variation including Joule heat is a candidate to explain the spatiotemporal distribution of geomagnetic changes and the time delay of the earthquake precursors (e.g., [47]). These approaches, from acoustic and neutron emission to the shallow geothermal investigation, are also important for understanding the observed earthquake precursors in Qinghai China, and these concerns and the potential mechanism (e.g., [48,49]) are left open for future multidisciplinary studies.

5. Conclusions

Through the above study, we draw the following conclusions:
(1)
The spatial distribution of seismic electromagnetic radiation anomalies is characterized by grouping, and the geomagnetic vertical intensity polarization usually has high values synchronized in time at multiple locations. Multiple regions of high-value anomalies in different anomalous regions are also synchronized in time.
(2)
Earthquakes occur in groups after the occurrence of anomalies within a period ranging from 3 months to 1 year. Multiple earthquakes occur in one or multiple anomalous zones within a group of anomalies.
(3)
The time interval of grouped earthquakes after anomalies is concentrated within 100~200 days.

Author Contributions

L.F. and Z.F. designed the study, performed the calculation, and interpreted the results. R.Q., Y.J., W.Z. and Z.F. wrote the manuscript. Y.Z., W.F., Y.G. and C.X. provided comments to improve the manuscript. All authors discussed the results and interpretations and participated in writing the paper. All authors have read and agreed to the published version of the manuscript.

Funding

This study benefited from financial support from the Second Tibetan Plateau Scientific Expedition and Research Program (2019QZKK0708) and the CAS Pioneer Hundred Talents Program.

Institutional Review Board Statement

Not applicable.

Informed Consent Statement

Not applicable.

Data Availability Statement

Data are available in the figures and tables or from the authors upon reasonable request.

Acknowledgments

We are thankful to the China Earthquake Administration for sharing the data used in this study.

Conflicts of Interest

All the authors listed certify that they have no involvement in any organization or entity with any financial interest (including honoraria; educational grants; participation in speakers’ membership, bureaus, consultancies, stock ownership, employment, or other equity interest; and patent-licensing arrangements or expert testimony) or nonfinancial interest (including professional or personal relationships, knowledge or beliefs, affiliations) in the subject materials or matter discussed.

References

  1. Molchanov, O.; Hayakawa, M. Generation of ULF electromagnetic emissions by microfracturing. Geophys. Res. Lett. 1995, 22, 3091–3094. [Google Scholar] [CrossRef]
  2. Hayakawa, M.; Kawate, R.; Molchanov, O.A.; Yumoto, K. Results of ultra-low-frequency magnetic field measurements during the Guam earthquake of 8 August 1993. Geophys. Res. Lett. 1996, 23, 241–244. [Google Scholar] [CrossRef]
  3. Hayakawa, M.; Itoh, T.; Hattori, K.; Yumoto, K. ULF electromagnetic precursors for an earthquake at Biak, Indonesia on February 17, 1996. Geophys. Res. Lett. 2000, 27, 1531–1534. [Google Scholar] [CrossRef]
  4. Ismaguilov, V.; Kopytenko, Y.A.; Hattori, K.; Voronov, P.; Molchanov, O.; Hayakawa, M. ULF magnetic emissions connected with under sea bottom earthquakes. Nat. Hazards Earth Syst. Sci. 2001, 1, 23–31. [Google Scholar] [CrossRef]
  5. Molchanov, O.; Schekotov, A.; Fedorov, E.; Belyaev, G.; Gordeev, E. Preseismic ULF electromagnetic effect from observation at Kamchatka. Nat. Hazards Earth Syst. Sci. 2003, 3, 203–209. [Google Scholar] [CrossRef]
  6. Hattori, K. ULF geomagnetic changes associated with large earthquakes. Terr. Atmos. Ocean. Sci. 2004, 15, 329–360. [Google Scholar] [CrossRef]
  7. Prattes, G.; Schwingenschuh, K.; Eichelberger, H.; Magnes, W.; Boudjada, M.; Stachel, M.; Vellante, M.; Wesztergom, V.; Nenovski, P. Multi-point ground-based ULF magnetic field observations in Europe during seismic active periods in 2004 and 2005. Nat. Hazards Earth Syst. Sci. 2008, 8, 501–507. [Google Scholar] [CrossRef]
  8. Hobara, Y.; Koons, H.; Roeder, J.; Yumoto, K.; Hayakawa, M. Characteristics of ULF magnetic anomaly before earthquakes. Phys. Chem. Earth Parts A/B/C 2004, 29, 437–444. [Google Scholar] [CrossRef]
  9. Feng, Z.; Li, Q.; Lu, J.; Li, H.; Ju, H.; Sun, H.; Yang, F.; Zhang, Y. The seismic ULF geomagnetic reliable information exaction based on fluxgate magnetometer data of second value. South China J. Seismol. 2010, 30, 1–7. [Google Scholar]
  10. Masci, F. Brief communication” On the recent reaffirmation of ULF magnetic earthquakes precursors”. Nat. Hazards Earth Syst. Sci. 2011, 11, 2193–2198. [Google Scholar] [CrossRef]
  11. Currie, J.; Waters, C. On the use of geomagnetic indices and ULF waves for earthquake precursor signatures. J. Geophys. Res. Space Phys. 2014, 119, 992–1003. [Google Scholar] [CrossRef]
  12. Li, Q.; Yang, X.; Cai, S. Case study of applying polarization method to geomagnetic array data. Technol. Earthq. Disaster Prev. 2015, 10, 412–417. [Google Scholar]
  13. Feng, L.; Feng, Z.; Fan, W.; Guan, Y.; He, M.; Li, X.; He, C.; Liao, X.; Aisa, Y.; Yuan, W.; et al. Spatio-temporal variation characteristic of the ultra-low frequency magnetic field prior to strong earthquakes of western Chinese mainland. Acta Seismol. Sin. 2021, 43, 359–375. [Google Scholar]
  14. Huang, Q.; Ikeya, M. Seismic electromagnetic signals (SEMS) explained by a simulation experiment using electromagnetic waves. Phys. Earth Planet. Inter. 1998, 109, 107–114. [Google Scholar] [CrossRef]
  15. Monitoring and Forecasting Department of China Earthquake Administration. Work Manual of Seismic Electromagnetic Analysis and Prediction Techniques; Seismological Press: Beijing, China, 2020. (In Chinese) [Google Scholar]
  16. Fan, W.; Feng, L.; Li, X.; Guan, Y.; He, C.; Liao, X.; He, M.; Liu, S.; Yuan, W.; Aisa, Y. Characteristics of Geomagnetic Vertical Intensity Polarization Anomalies before Moderate Strong Earthquakes and Their Relationship With Subsequent Earthquakes. Earthquake 2021, 41, 170–179. [Google Scholar]
  17. Yusof, K.A.; Abdullah, M.; Hamid, N.S.A.; Ahadi, S.; Yoshikawa, A. Correlations between earthquake properties and characteristics of possible ULF geomagnetic precursor over multiple earthquakes. Universe 2021, 7, 20. [Google Scholar] [CrossRef]
  18. Yao, X.; Wang, W.; Teng, Y. Detection of Geomagnetic Signals as Precursors to Some Earthquakes in China. Appl. Sci. 2022, 12, 1680. [Google Scholar] [CrossRef]
  19. Li, Q.; Schekotov, A.; Asano, T.; Hayakawa, M. On the anomalies in ULF magnetic field variations prior to the 2008 Sichuan earthquake. Open J. Earthq. Res. 2015, 4, 55. [Google Scholar] [CrossRef]
  20. Li, X.; Feng, L.; Zhao, Y.; Liu, L.; Guo, Z.; Fan, W.; He, M.; Liao, X.; Yisimayili, A. Anomalous characteristics of geomagnetic vertical strength polarization before the 2017 Milin Ms 6.9 earthquake in Tibet. Acta Seismol. Sin. 2021, 43, 584–594. [Google Scholar]
  21. Mao, Z.; Chen, C.; Zhang, S.; Yisimayili, A.; Yu, H.; Yu, C.; Liu, J. Locating Seismo-Conductivity Anomaly before the 2017 MW 6.5 Jiuzhaigou Earthquake in China Using Far Magnetic Stations. Remote Sens. 2020, 12, 1777. [Google Scholar] [CrossRef]
  22. Wang, H.; Zhang, Y.; Liu, J.; Shen, X.; Yu, H.; Jiang, Z.; Zhang, G. Pre-Earthquake Observations and Their Application in Earthquake Prediction in China. A Review of Historical and Recent Progress. Pre-Earthq. Process. Multidiscip. Approach Earthq. Predict. Stud. 2018, 234, 19. [Google Scholar]
  23. Ma, Z. Multipoints (concentrated) stress field and earthquakes in North China crust. Seismol. Egol. 1980, 2, 39. [Google Scholar]
  24. Deng, Q.; Cheng, S.; Ma, J.; Du, P. Seismic activities and earthquake potential in the Tibetan Plateau. Chin. J. Geophys. 2014, 57, 678–697. [Google Scholar] [CrossRef]
  25. Mei, S. On the physical model of earthquake precursor fields and the mechanism of precursors’ time-space distribution—Origin and evidences of the strong body earthquake-generating model. Acta Seismol. Sin. 1995, 8, 337–349. [Google Scholar] [CrossRef]
  26. Bürgmann, R.; Pollard, D.D.; Martel, S.J. Slip distributions on faults: Effects of stress gradients, inelastic deformation, heterogeneous host-rock stiffness, and fault interaction. J. Struct. Geol. 1994, 16, 1675–1690. [Google Scholar] [CrossRef]
  27. Luo, G.; Yang, M.; Ma, H.; Xu, X. Intermediate and shorttrem anomalies of seismic activity energy field before the Wenchuan M8. 0 earthquake. Earthquake 2011, 31, 135–142. (In Chinese) [Google Scholar]
  28. Liao, X.; Fan, W.; Qiu, G.; Li, X.; Yang, P. Analysis on Short-Term Characteristics of Geomagnetic Vertical Intensity Polarization Anomaly Before Jiuzhaigou 7.0 earthquake on August 8, 2017. Earthquake 2021, 41, 170–179. (In Chinese) [Google Scholar]
  29. Aisa, Y.; Feng, Z.; Chen, J.; Feng, L.; Li, X.; Guan, Y.; Mao, Z. Analysis on geomagnetic polarization anomalies before Yutian Ms6.4 earthquake in 2020. Inland Earthq. 2020, 34, 295–302. [Google Scholar]
  30. Feng, L.; Guan, Y.; Fan, W.; He, M.; Li, X.; He, C.; Liao, X.; Aisa, Y.; Yuan, W.; Liu, S.; et al. Geomagnetic vertical component polarization anomaly in october 15th 2020 before Maduo M7. 4 earthquake. Plateau Earthq. Res. 2021, 33, 1–6. [Google Scholar]
  31. Xue, Y.; Liu, J.; Song, Z.; Li, M. On the universality and mechanism interpretation of the seismicity characteristics before the 2008 Wenchuan MS 8.0 earthquake. Chin. J. Geophys. 2018, 61, 1891–1906. [Google Scholar]
  32. Zhan, Y.; Liang, M.; Sun, X.; Huang, F.; Zhao, L.; Gong, Y.; Han, J.; LI, C.; Zhang, P.; Zhang, H. Deep structure and seismogenic pattern of the 2021.5. 22 Madoi (Qinghai) MS 7.4 earthquake. Chin. J. Geophys. 2021, 64, 2232–2252. [Google Scholar]
  33. Petraki, E.; Nikolopoulos, D.; Nomicos, C.; Stonham, J.; Cantzos, D.; Yannakopoulos, P.; Kottou, S. Electromagnetic pre-earthquake precursors: Mechanisms, data and models—A review. J. Earth Sci. Clim. Chang. 2015, 6, 1. [Google Scholar]
  34. Kamiyama, M.; Sugito, M.; Kuse, M.; Schekotov, A.; Hayakawa, M. On the precursors to the 2011 Tohoku earthquake: Crustal movements and electromagnetic signatures. Geomat. Nat. Hazards Risk 2016, 7, 471–492. [Google Scholar] [CrossRef]
  35. Carpinteri, A.; Borla, O. Acoustic, electromagnetic, and neutron emissions as seismic precursors: The lunar periodicity of low-magnitude seismic swarms. Eng. Fract. Mech. 2019, 210, 29–41. [Google Scholar] [CrossRef]
  36. Bolton, D.C.; Shreedharan, S.; Rivière, J.; Marone, C. Acoustic energy release during the laboratory seismic cycle: Insights on laboratory earthquake precursors and prediction. J. Geophys. Res. Solid Earth 2020, 125, e2019JB018975. [Google Scholar] [CrossRef]
  37. Dolgikh, G.I.; Kuptsov, A.V.; Larionov, I.A.; Marapulets, Y.V.; Shvets, V.A.; Shevtsov, B.M.; Shirokov, O.P.; Chupin, V.A.; Yakovenko, S.V. Deformation and acoustic precursors of earthquakes. Dokl. Earth Sci. 2007, 413, 281. [Google Scholar] [CrossRef]
  38. Gregori, G.P.; Paparo, G. Acoustic Emission (AE). (A diagnostic tool for environmental sciences and for non-destructive tests). Meteorol. Geophys. Fluid Dyn. 2004, 166–204. [Google Scholar]
  39. Carpinteri, A.; Lacidogna, G.; Manuello, A.; Borla, O. Energy emissions from brittle fracture: Neutron measurements and geological evidences of piezonuclear reactions. Strength Fract. Complex. 2011, 7, 13–31. [Google Scholar] [CrossRef]
  40. Carpinteri, A.; Borla, O. Fracto-emissions as seismic precursors. Eng. Fract. Mech. 2017, 177, 239–250. [Google Scholar] [CrossRef]
  41. Kuzhevskij, B.M.; Nechaev, O.Y.; Sigaeva, E.A.; Zakharov, V.A. Neutron flux variations near the Earth’s crust. A possible tectonic activity detection. Nat. Hazards Earth Syst. Sci. 2003, 3, 637–645. [Google Scholar] [CrossRef]
  42. Kuzhevskij, B.M.; Nechaev, O.Y.; Sigaeva, E.A. Distribution of neutrons near the Earth’s surface. Nat. Hazards Earth Syst. Sci. 2003, 3, 255–262. [Google Scholar] [CrossRef]
  43. Gregori, G.P.; Paparo, G.; Poscolieri, M.; Zanini, A. Acoustic emission and released seismic energy. Nat. Hazards Earth Syst. Sci. 2005, 5, 777–782. [Google Scholar] [CrossRef]
  44. Volodichev, N.N.; Kuzhevskij, B.M.; Nechaev, O.Y.; Panasyuk, M.I.; Podorolsky, A.N.; Shavrin, P.I. Sun-Moon-Earth connections: The neutron intensity splashes and seismic activity. Astron. Vestn. 2000, 34, 188. [Google Scholar]
  45. Tang, M.; Gao, X. Some statistic characteristics of “underground Hot vortex” in China during 1980–1993 (II). Sci. China Ser. D Earth Sci. 1997, 40, 569–576. [Google Scholar] [CrossRef]
  46. Gregori, G.P.; Dong, W.J.; Gao, X.Q.; Gizzi, F.T. The Origin of Magnetic Fields Stellar, Earth’s and Planetary Dynamos. The Bridge Between the Big Bang and Biology: Stars, Planetary Systems, Atmospheres, Volcanoes: Their Link to Life; Giovanelli, F., Ed.; International Workshop: Stromboli, Italy, 2001; p. 201. [Google Scholar]
  47. Tang, M.C.; Gao, X. Analysis of the geothermal vortexes triggering the Xingtai earthquake in 1966. Acta Seismol. Sin. 1997, 10, 379–385. [Google Scholar] [CrossRef]
  48. Rydelek, P.A.; Davis, P.; Koyanagi, R.Y. Tidal triggering of earthquake swarms at Kilauea volcano, Hawaii. J. Geophys. Res. 1988, 93, 4401–4411. [Google Scholar] [CrossRef]
  49. Han, Y.; Guo, Z.; Wu, J.; Ma, L. Possible triggering of solar activity to big earthquakes (Ms ≥ 8) in faults with near west–east strike in China. Sci. China Ser. B Phys. Mech. Astron. 2004, 47, 81. [Google Scholar] [CrossRef]
Figure 1. The distribution of 1-s sampling fluxgate magnetometer observation stations in western China in 2019. The red triangles indicate the geomagnetic observation stations.
Applsci 12 08888 g001
Figure 2. Geomagnetic vertical intensity polarization anomalies and spatial distributions of earthquakes in the following years: (a) 20150118; (b) 20150213; (c) 20150718; (d) 20160915; (e) 20161202; (f) 20170318; (g) 20190924; (h) 20191112; (i) 20201015.
Applsci 12 08888 g002
Table 1. Geomagnetic vertical intensity polarization anomalies and spatial distributions of earthquakes in the following year.
NumberDateOrigin TimeMagnitudeEpicenterAbnormal Lead Time (Day)Abnormal Area NumberAbnormal Area (104·km2)Earthquake Time Difference
120150118201504155.8Alxa Zuoqi, Inner Mongolia871-1288-
201504258.2Nepal971-128810
201504255.9Tingri, Tibet971-128810
201507036.5Pishan, Xinjiang1661-128879
201512077.4Tajikistan3231-1288157
201601216.4Menyuan, Qinghai3681-128845
220150213201504155.8Alxa Zuoqi, Inner Mongolia612-25-
201507036.5Pishan, Xinjiang1402-18879
201512077.4Tajikistan1662-188157
320150718201512077.4Tajikistan1423-112-
201601216.4Menyuan, Qinghai1783-2736
420160915201610176.3Zadoi, Qinghai324-2123-
201612086.2Hutubi, Xinjiang844-18052
201612205.8Qiemo, Xinjiang964-18012
201708087.0Jiuzhaigou, Sichuan3274-2123231
201708096.6Jinghe, Xinjiang3284-1801
201709165.8Kuqa, Xinjiang3664-18038
520161202201612086.2Hutubi, Xinjiang75-118-
201708087.0Jiuzhaigou, Sichuan2495-243242
201708096.6Jinghe, Xinjiang2505-1181
201709165.8Kuqa, Xinjiang2885-11838
201711186.9Milin, Tibet3515-24361
620170318201708087.0Jiuzhaigou, Sichuan1436-43-
201708096.6Jinghe, Xinjiang1446-11061
201709165.8Kuqa, Xinjiang1826-110638
201711186.9Milin, Tibet2436-22061
720190924202001196.4Payzawat, Xinjiang1177-163-
202003205.9Tingri, Tibet1787-16361
202006266.4Yutian, Xinjiang2767-16398
202007236.6Nima, Tibet3037-16327
820191112202006266.4Yutian, Xinjiang2278-18-
202007236.6Nima, Tibet2548-1827
920201015202105216.4Yangbi, Yunnan21810-35-
202105227.4Maduo, Qinghai21910-2581
202108135.8Maduo, Qinghai29910-25880
202109166.0Luzhou, Sichuan33610-258117
Publisher’s Note: MDPI stays neutral with regard to jurisdictional claims in published maps and institutional affiliations.

