
Comparative Analysis of the Optimized KNN, SVM, and Ensemble DT Models Using Bayesian Optimization for Predicting Pedestrian Fatalities: An Advance towards Realizing the Sustainable Safety of Pedestrians

 ,
,  , , and
Abstract
:1. Introduction
2. Literature Review
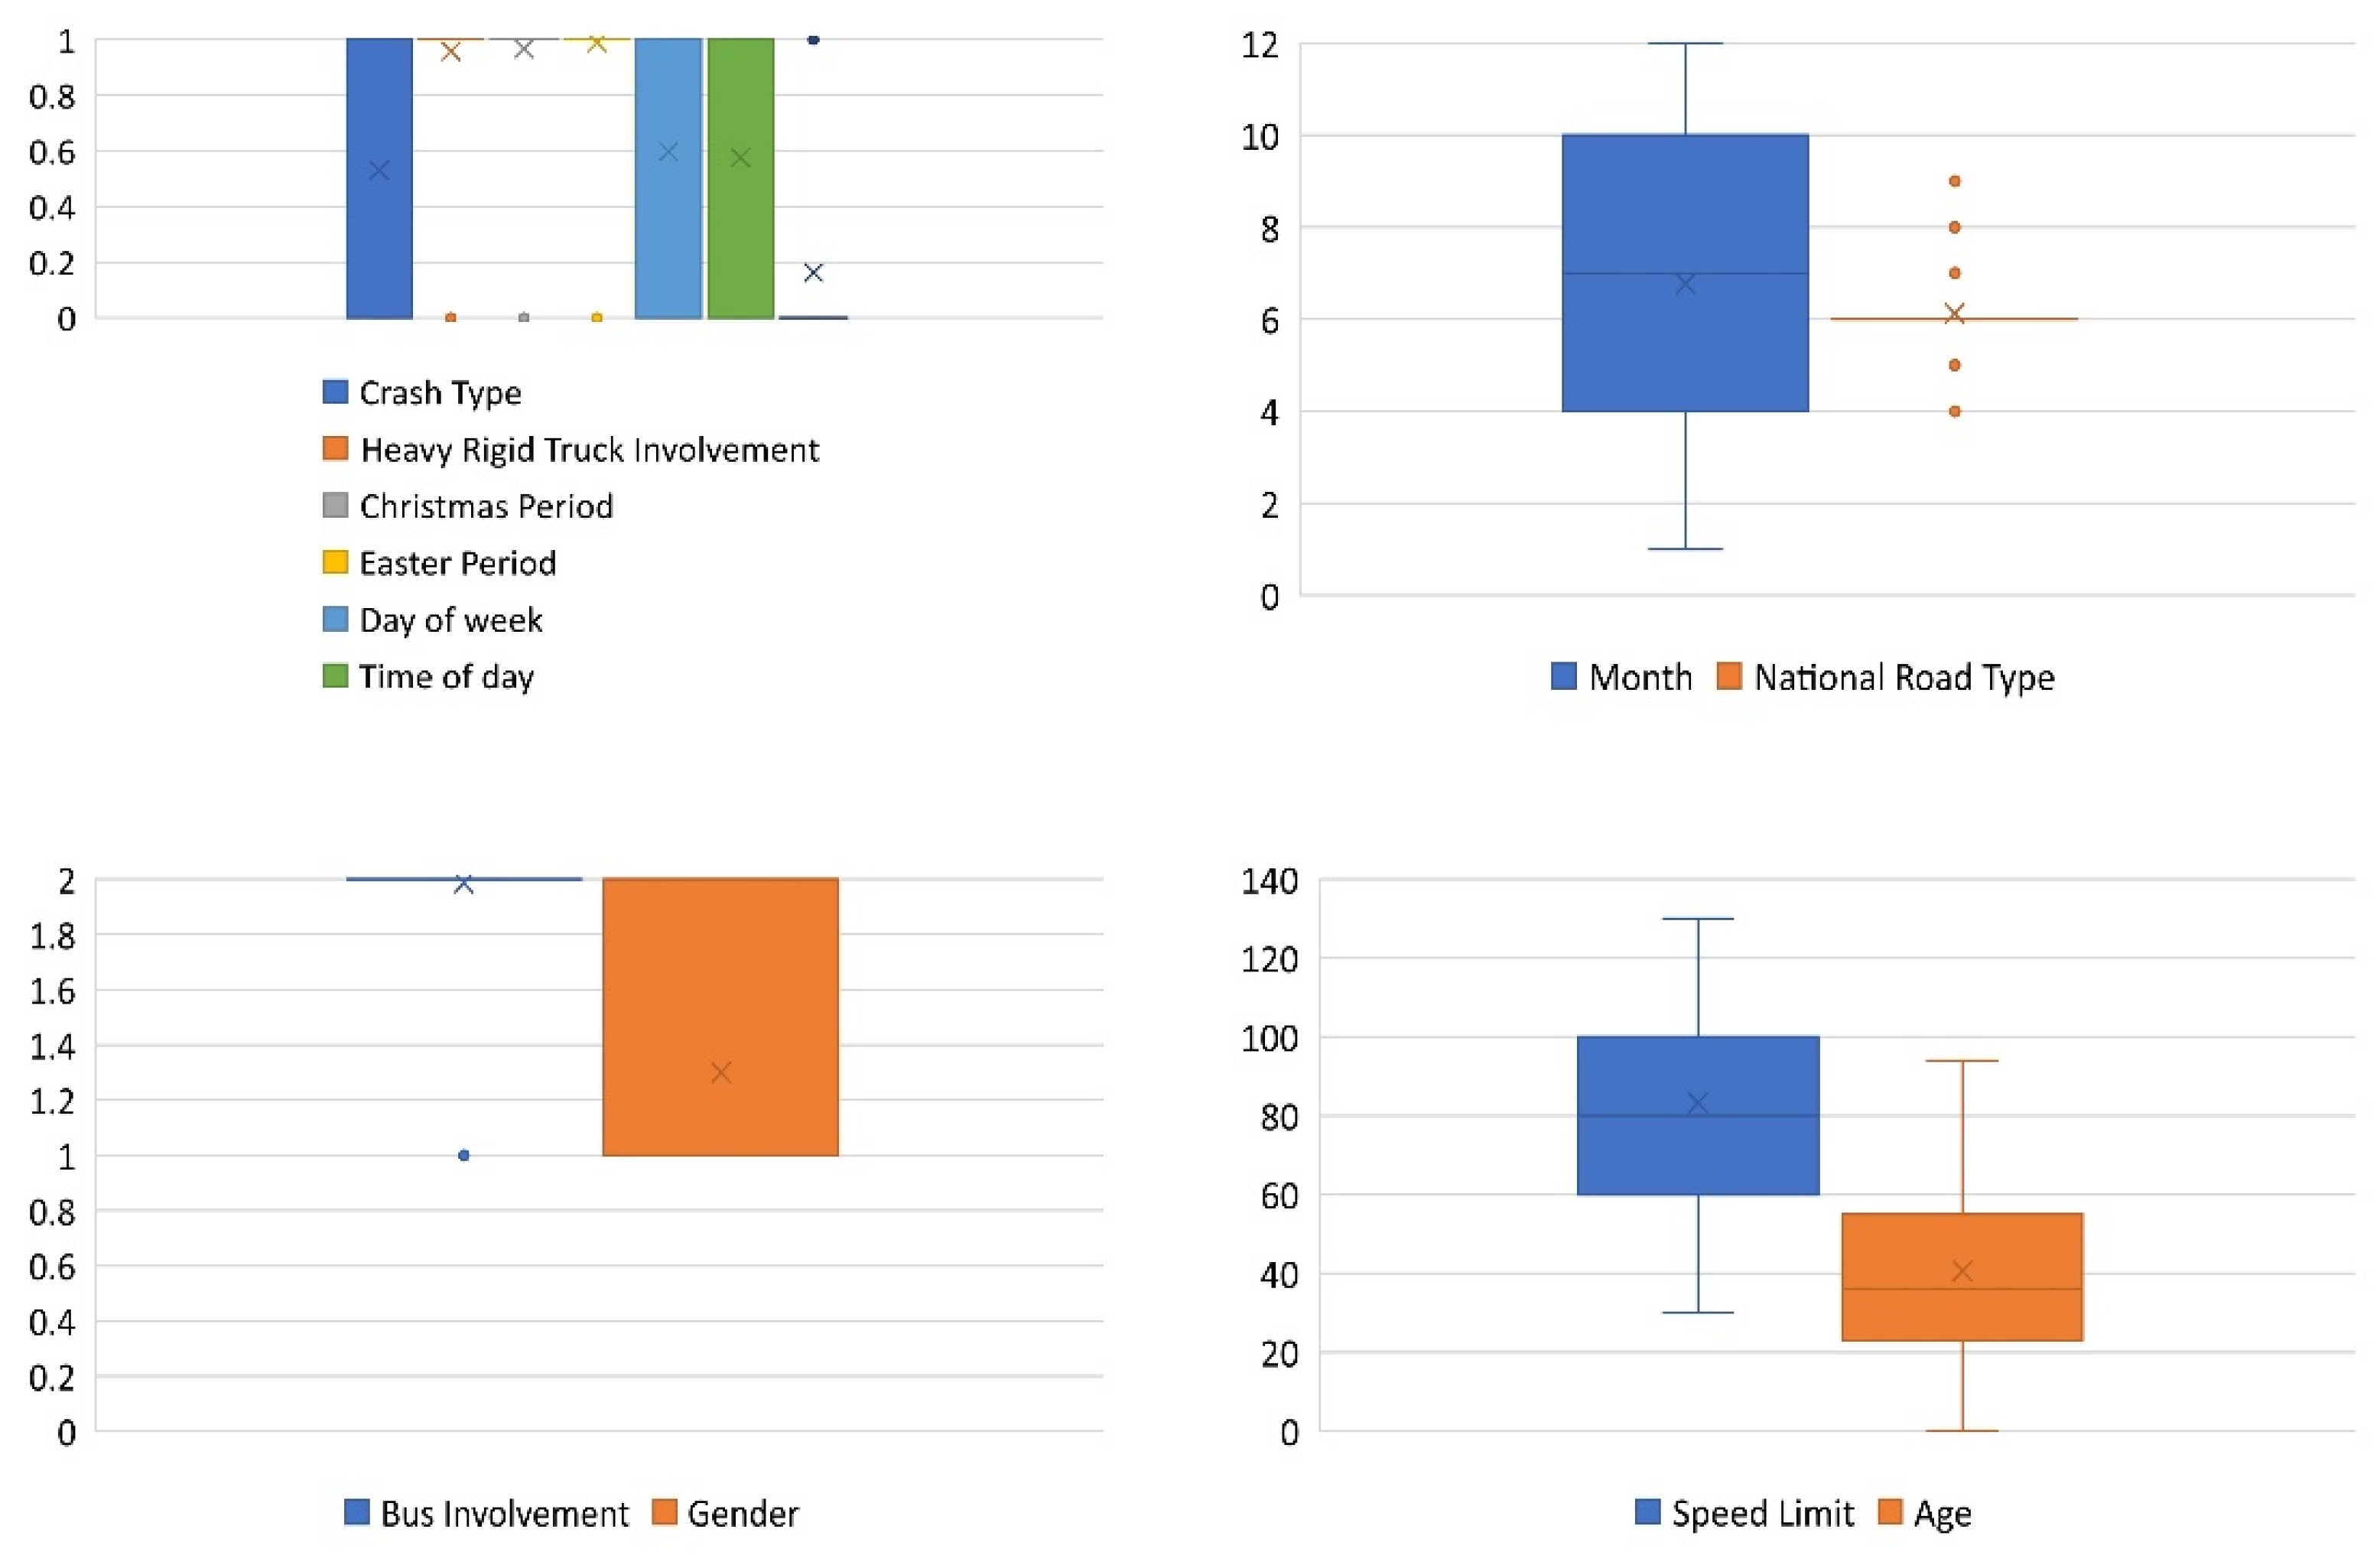
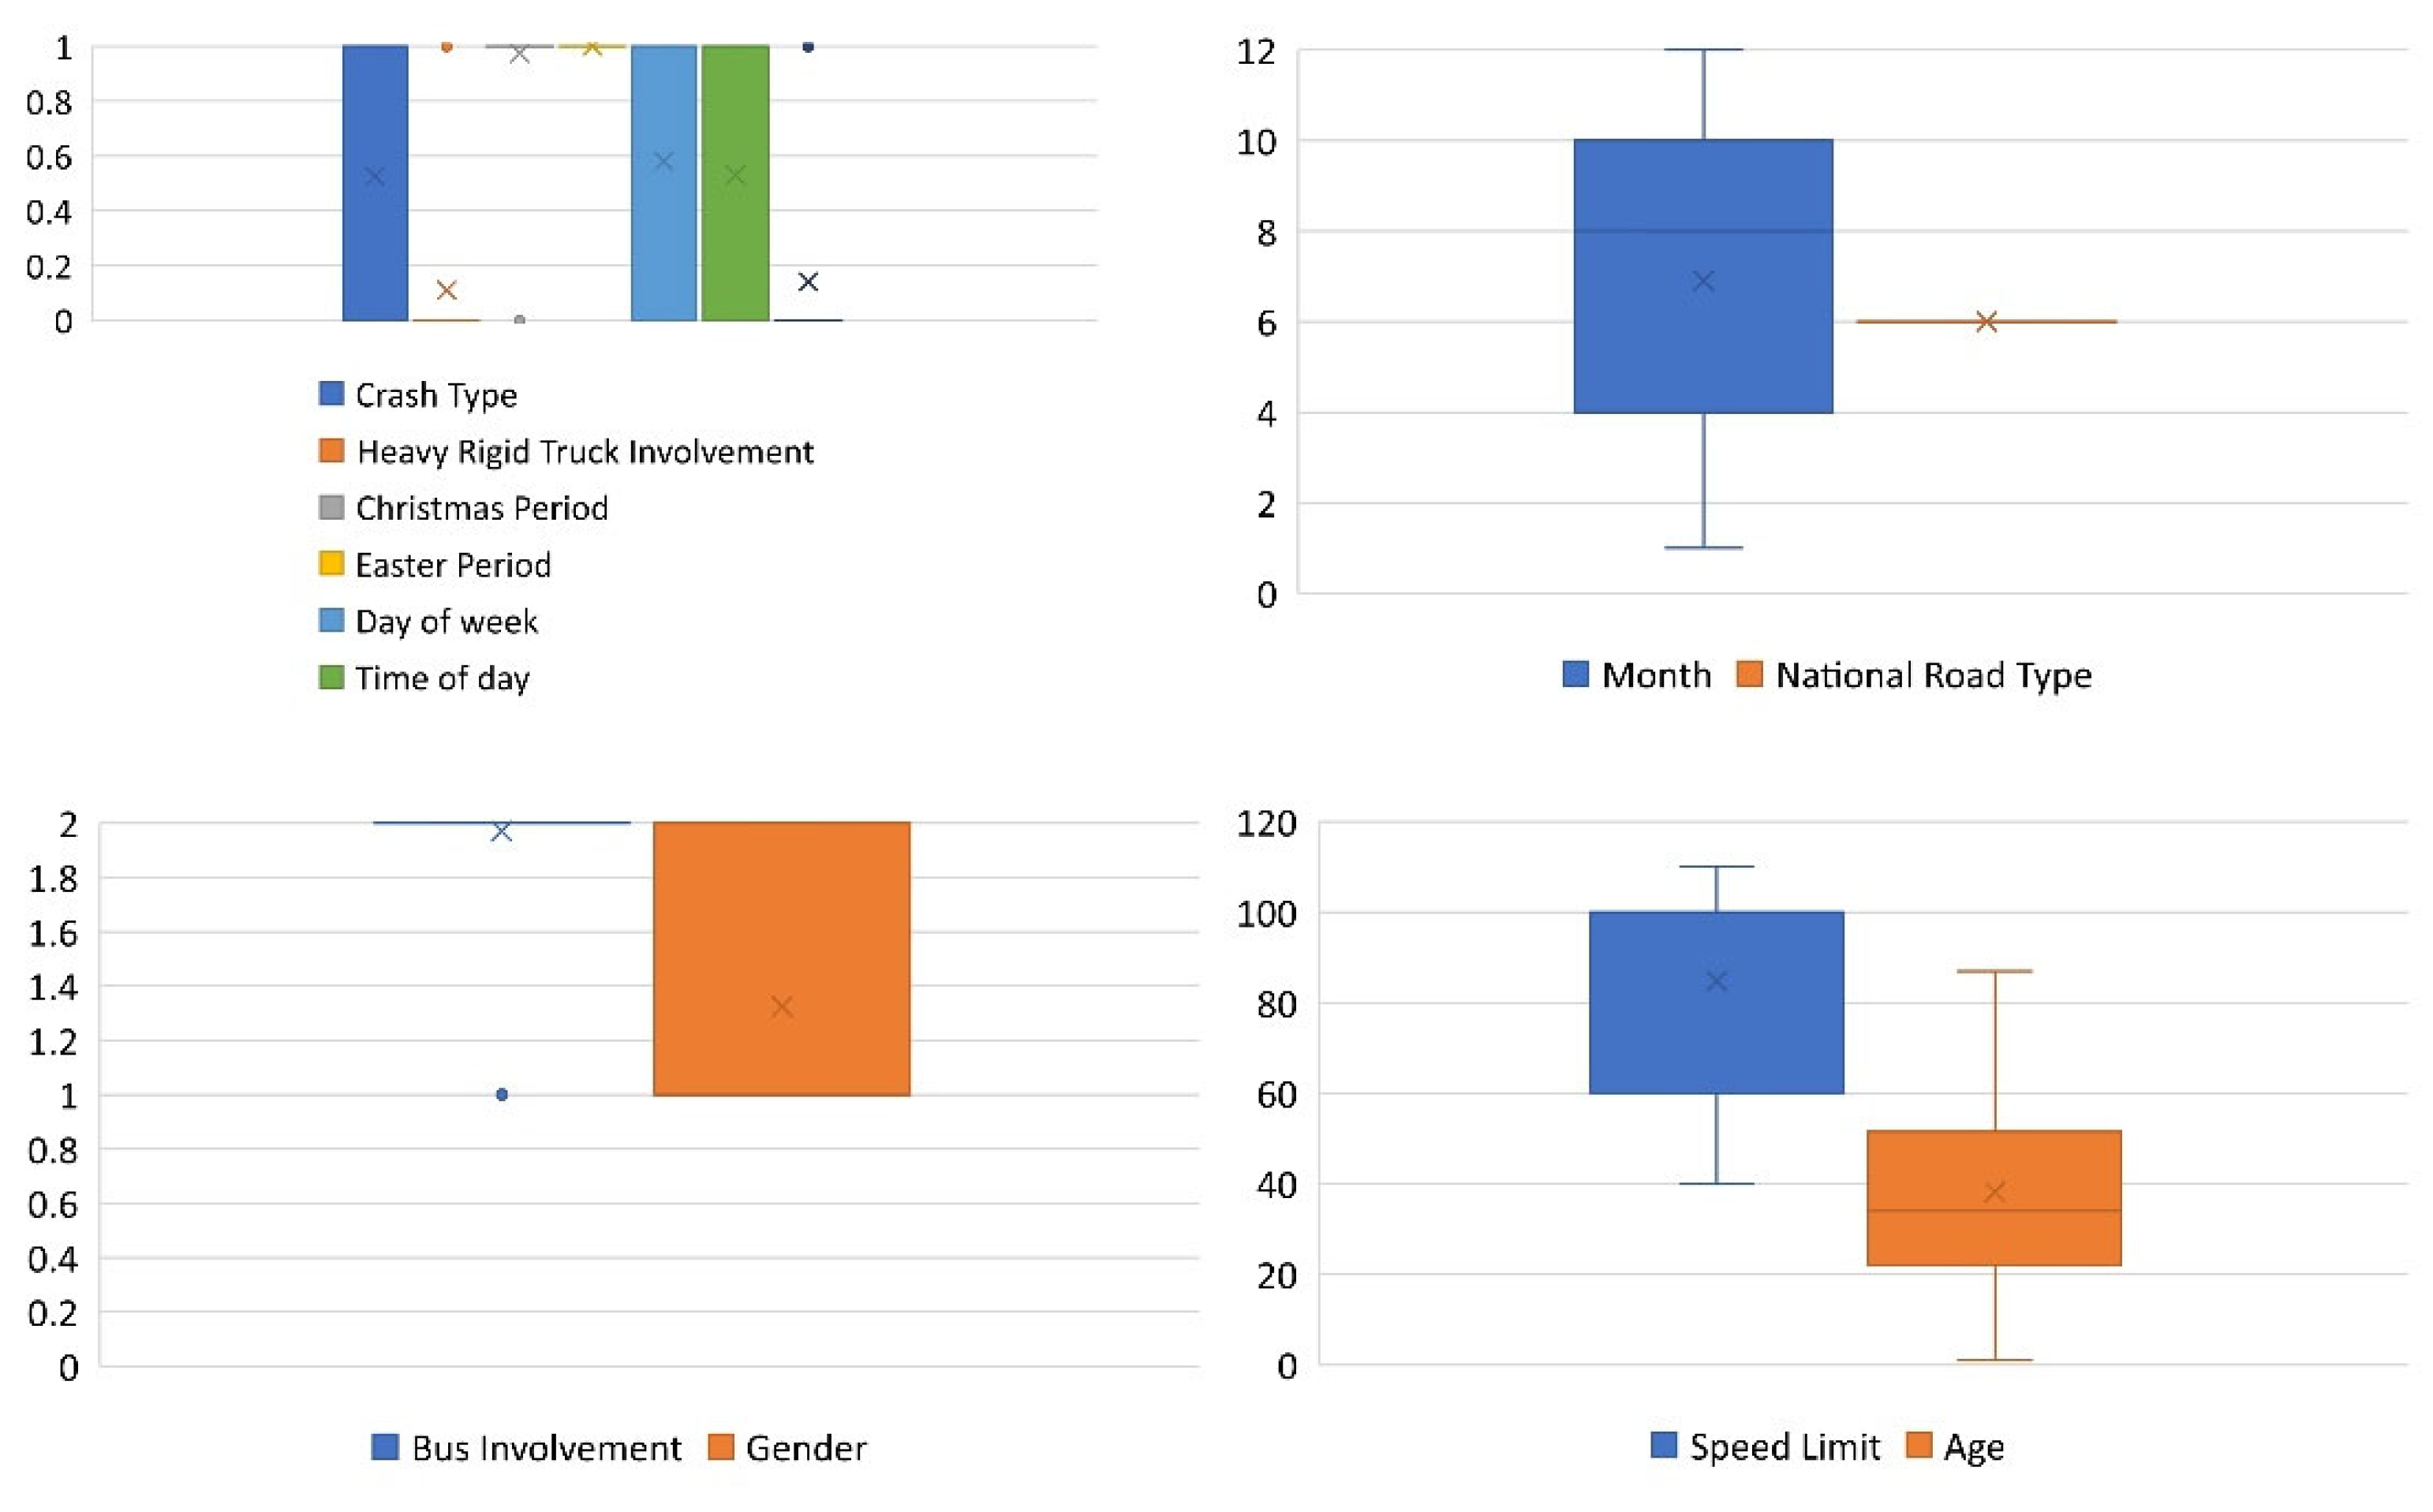
3. Data Collection and Preparation
- The arrangement of nominal variables was altered to place the smallest class first and the biggest class last.
- For null values in continuous variables, the mean was replaced.
- For null values in nominal variables, the mode was replaced.
- For null values in ordinal variables, the median was replaced.
- The independent variable was originally nominal. The categories of this variable were driver, motorcycle pillion passenger, motorcycle rider, passenger, pedal cyclist, and pedestrian. This variable was then converted into binary. The new variable includes pedestrian fatalities and non-pedestrian fatalities.
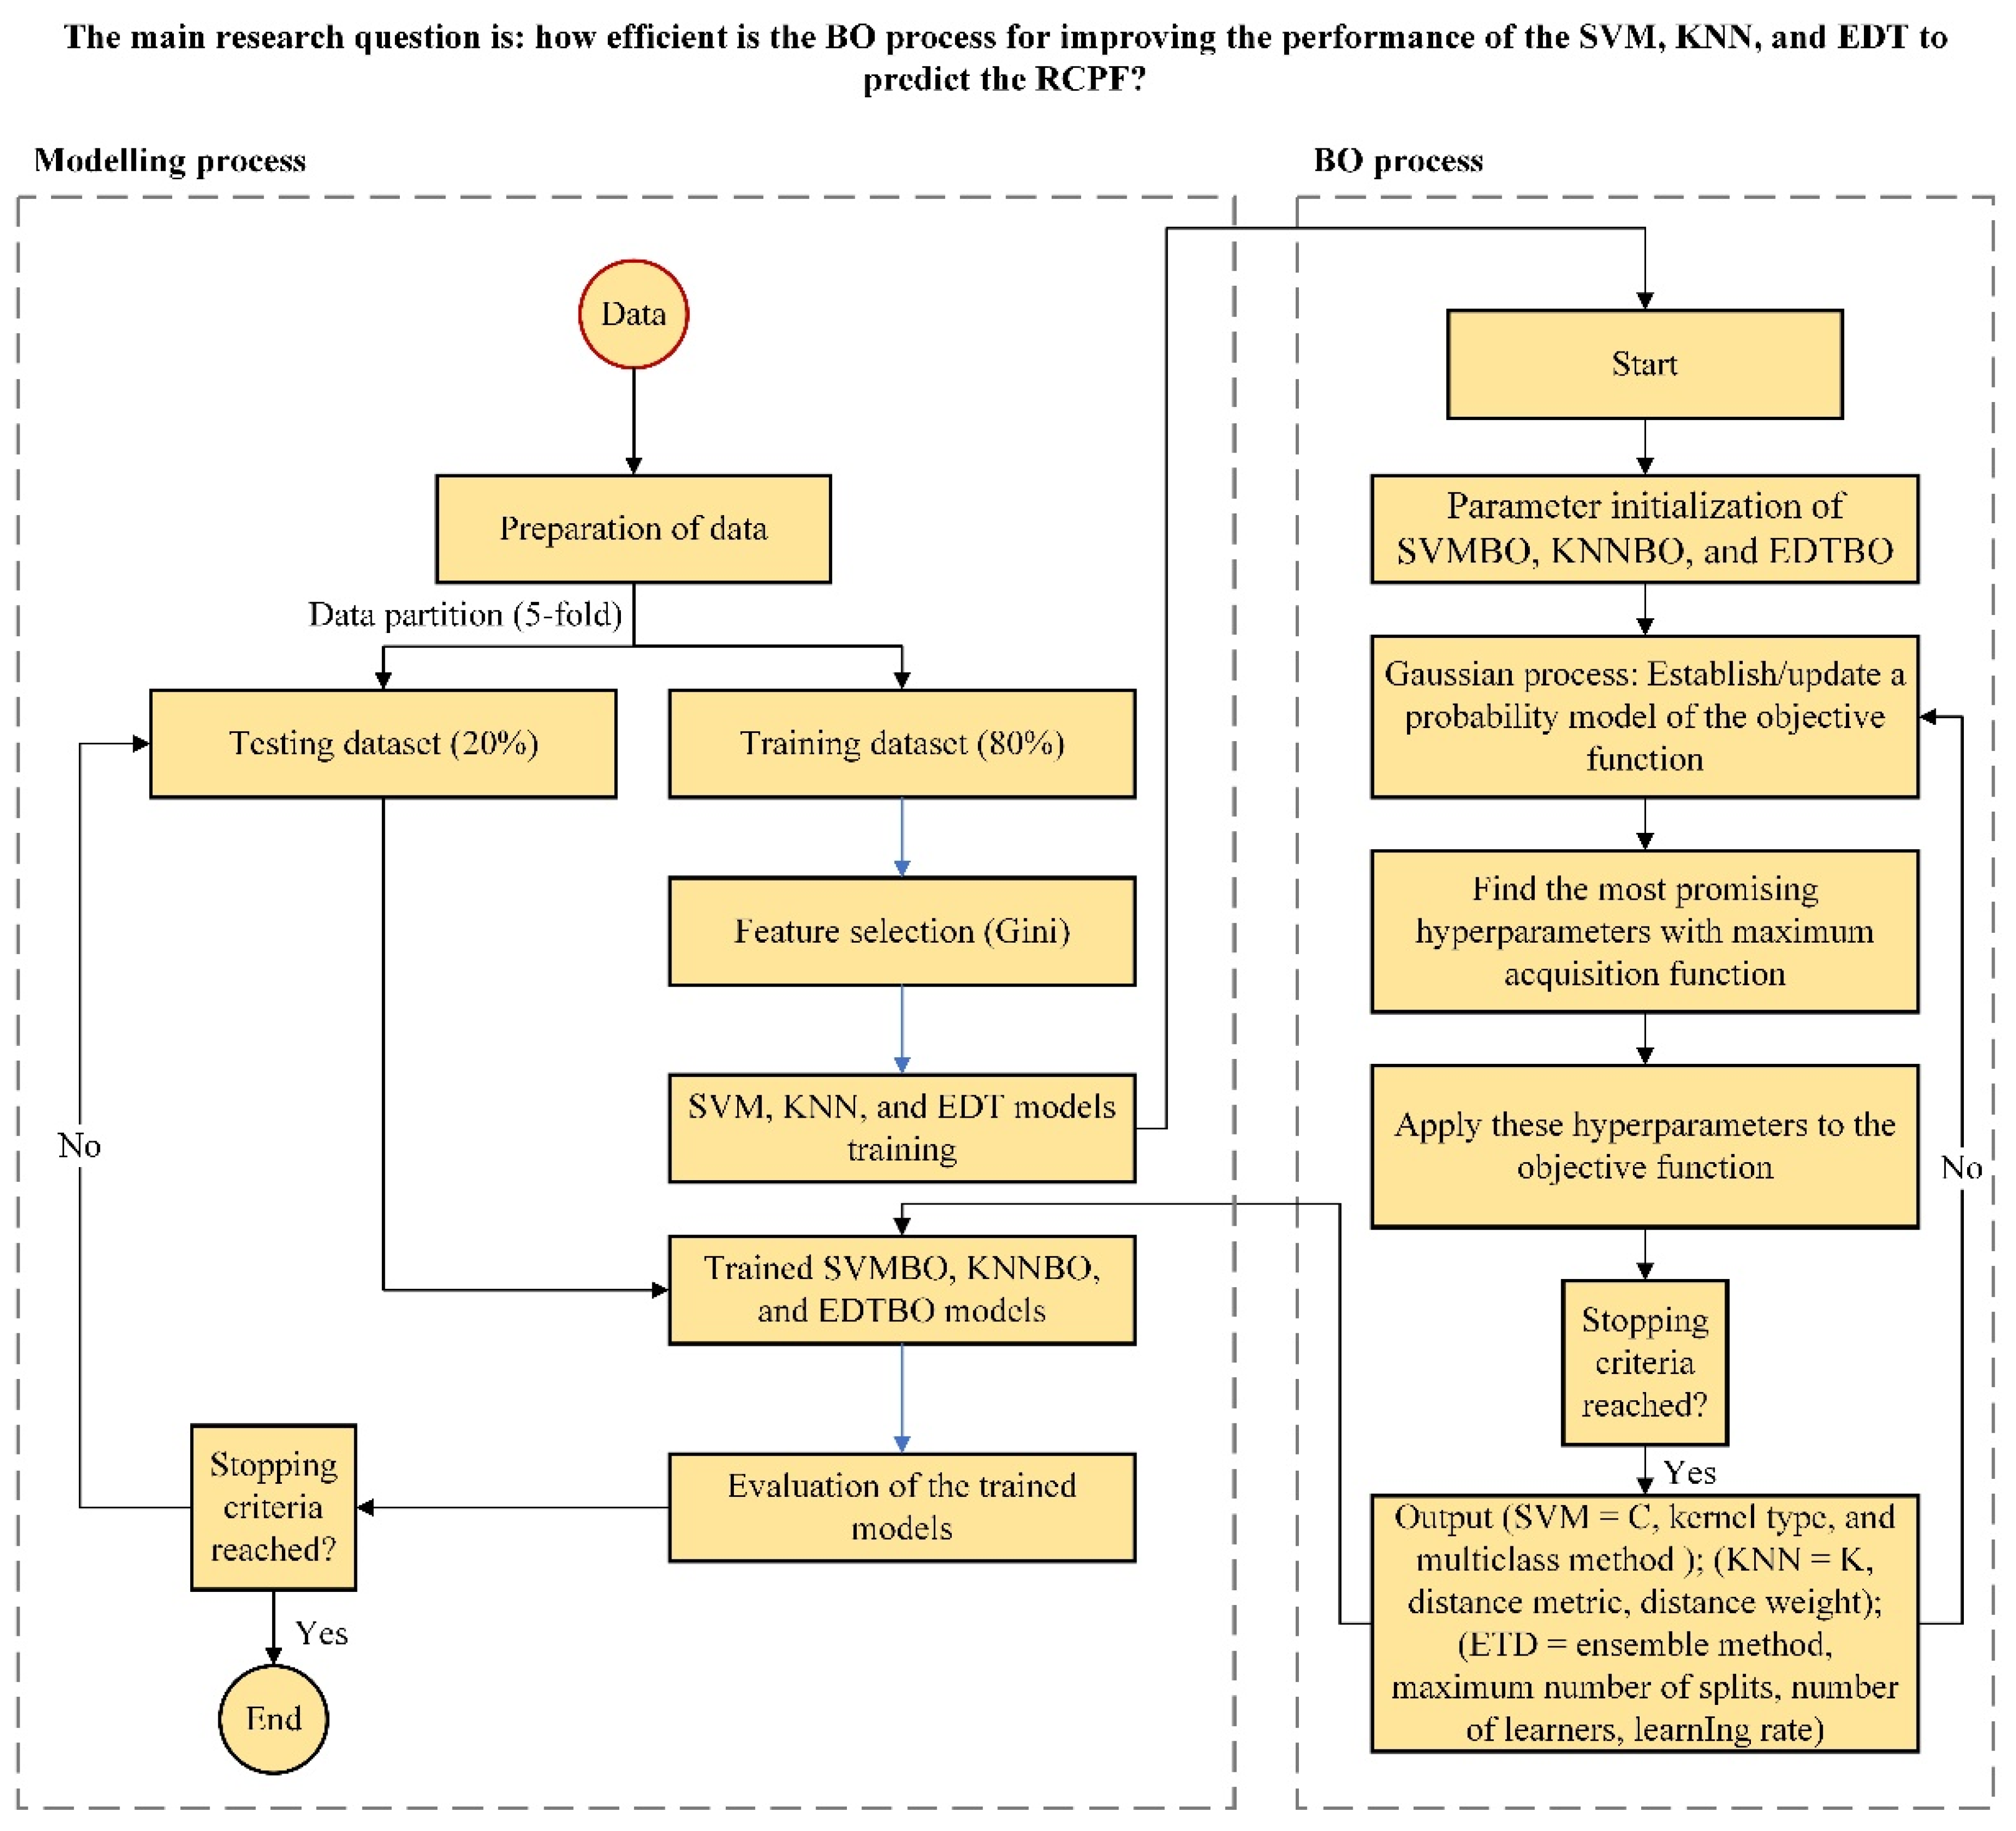
4. Study Design
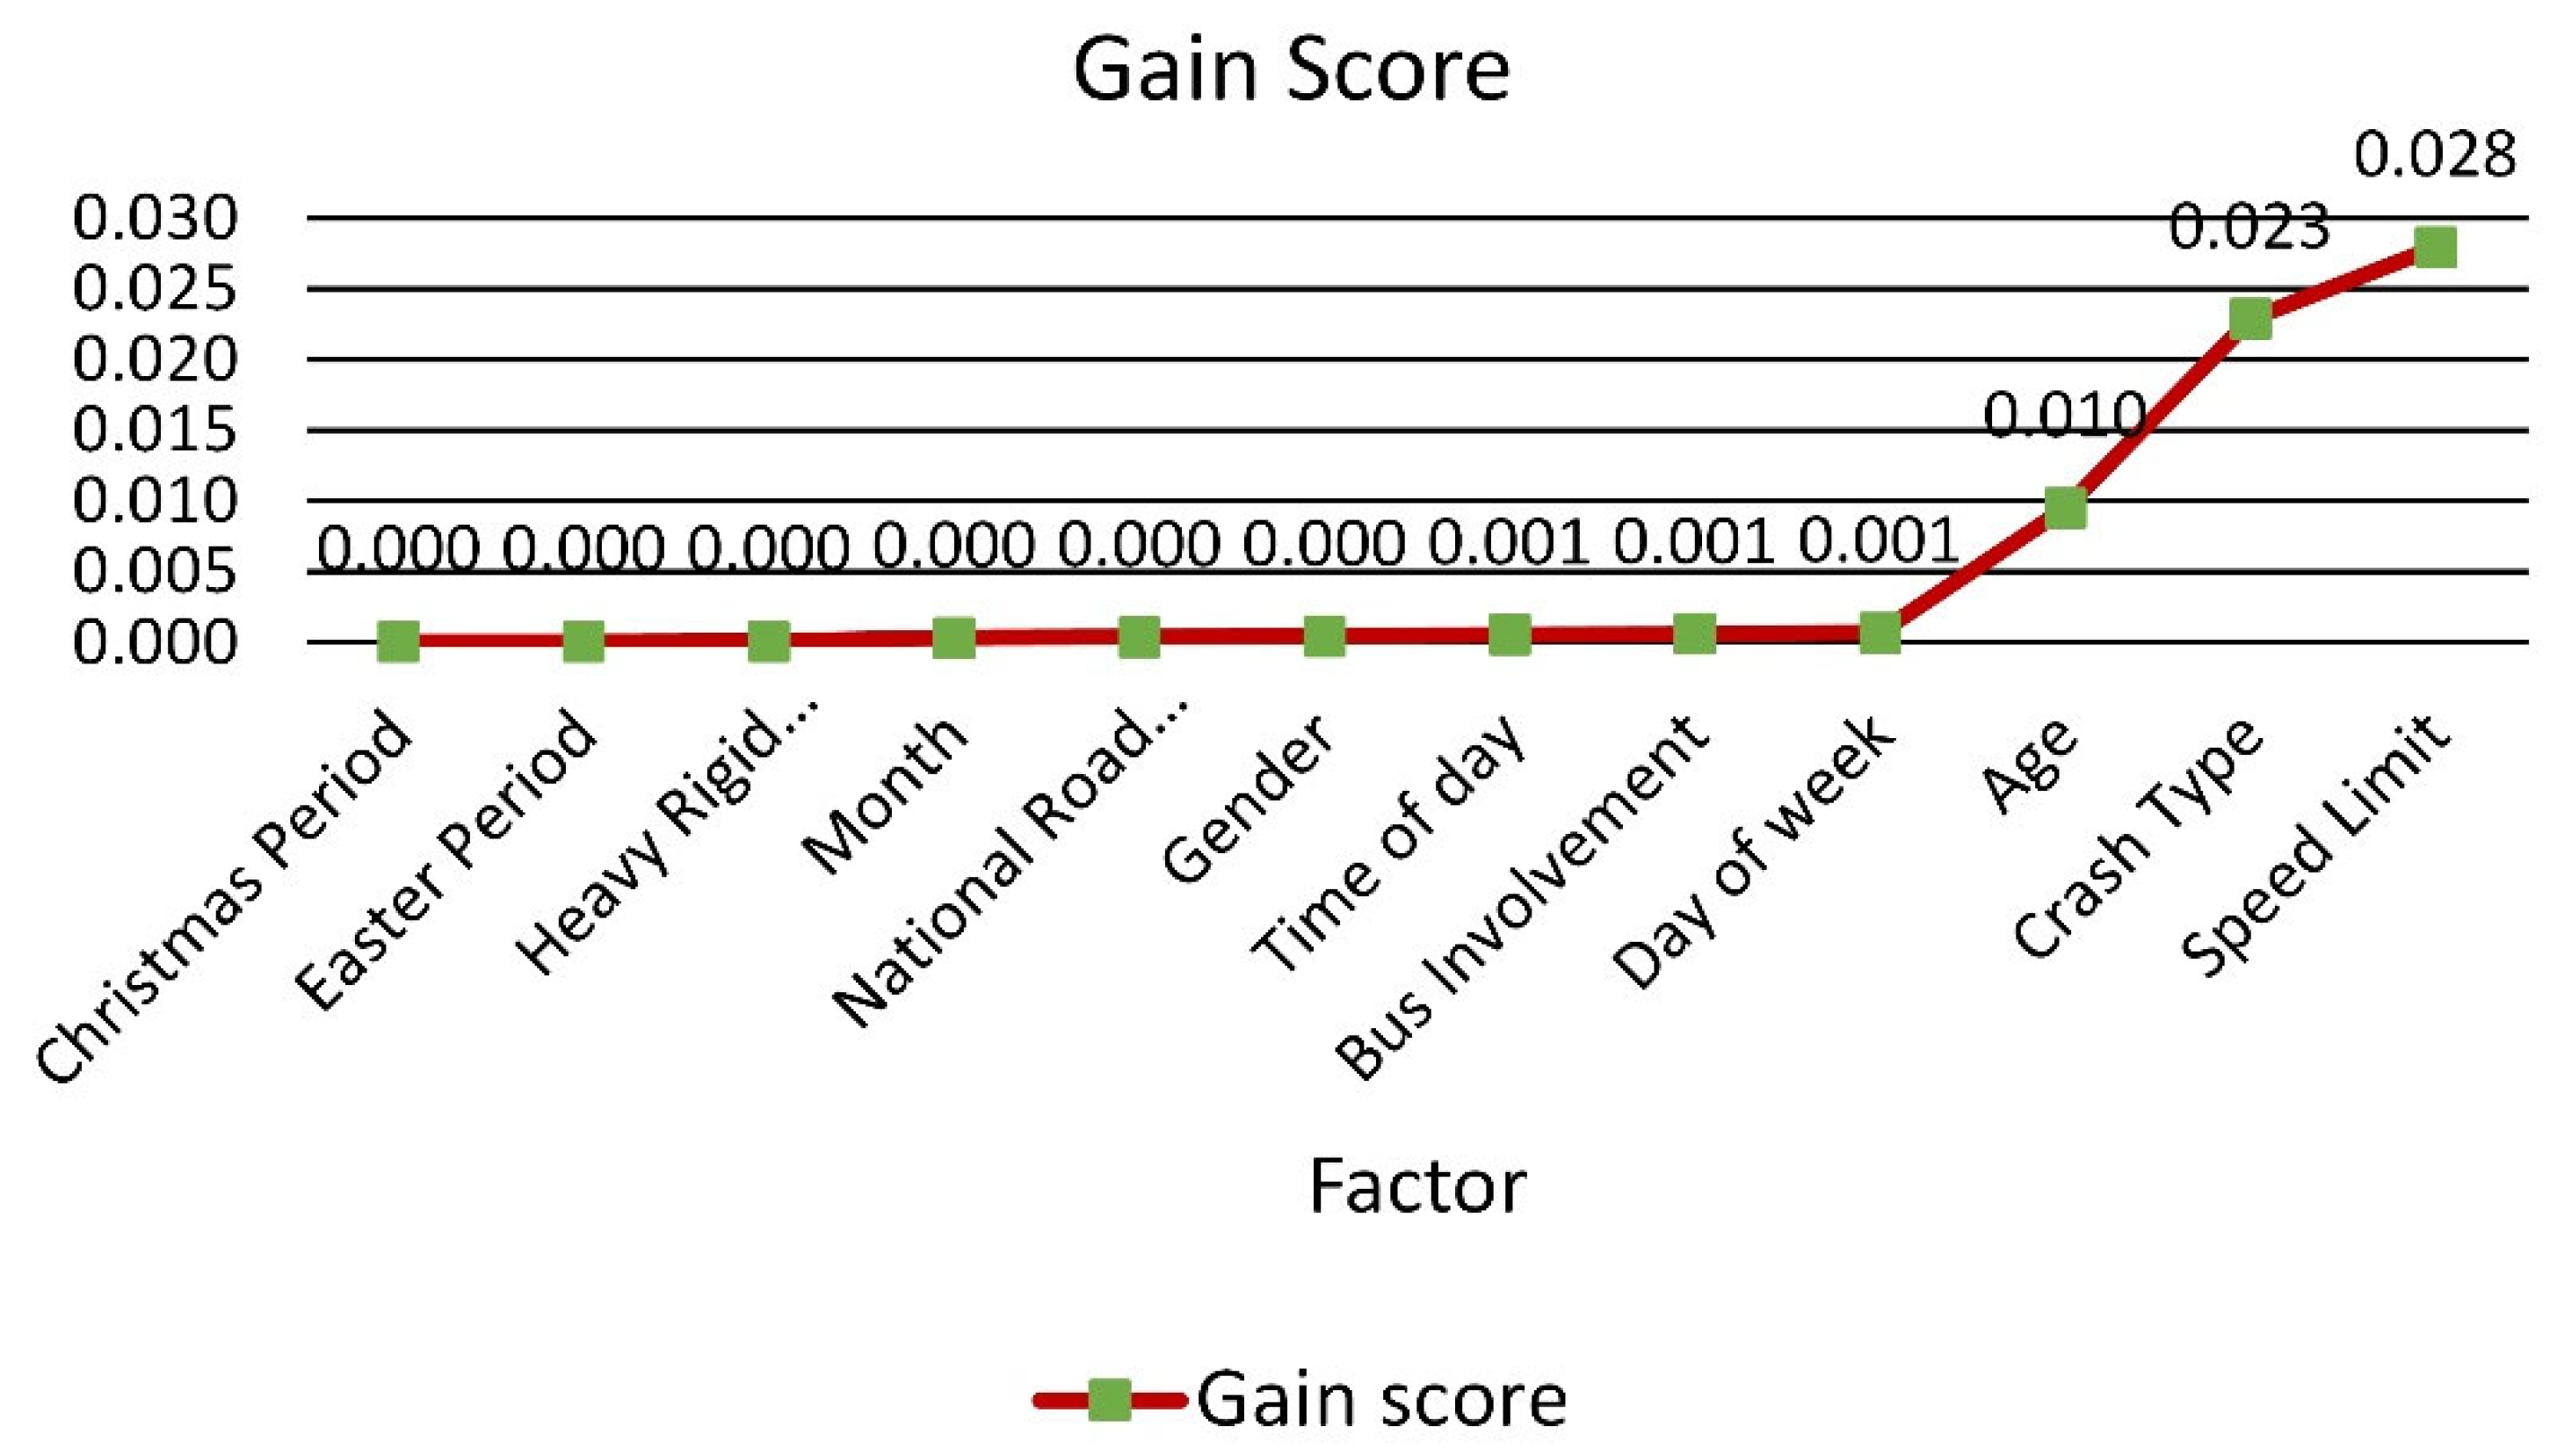
5. Input Selection
6. Models’ Development
6.1. Development of the RCPF Prediction Models
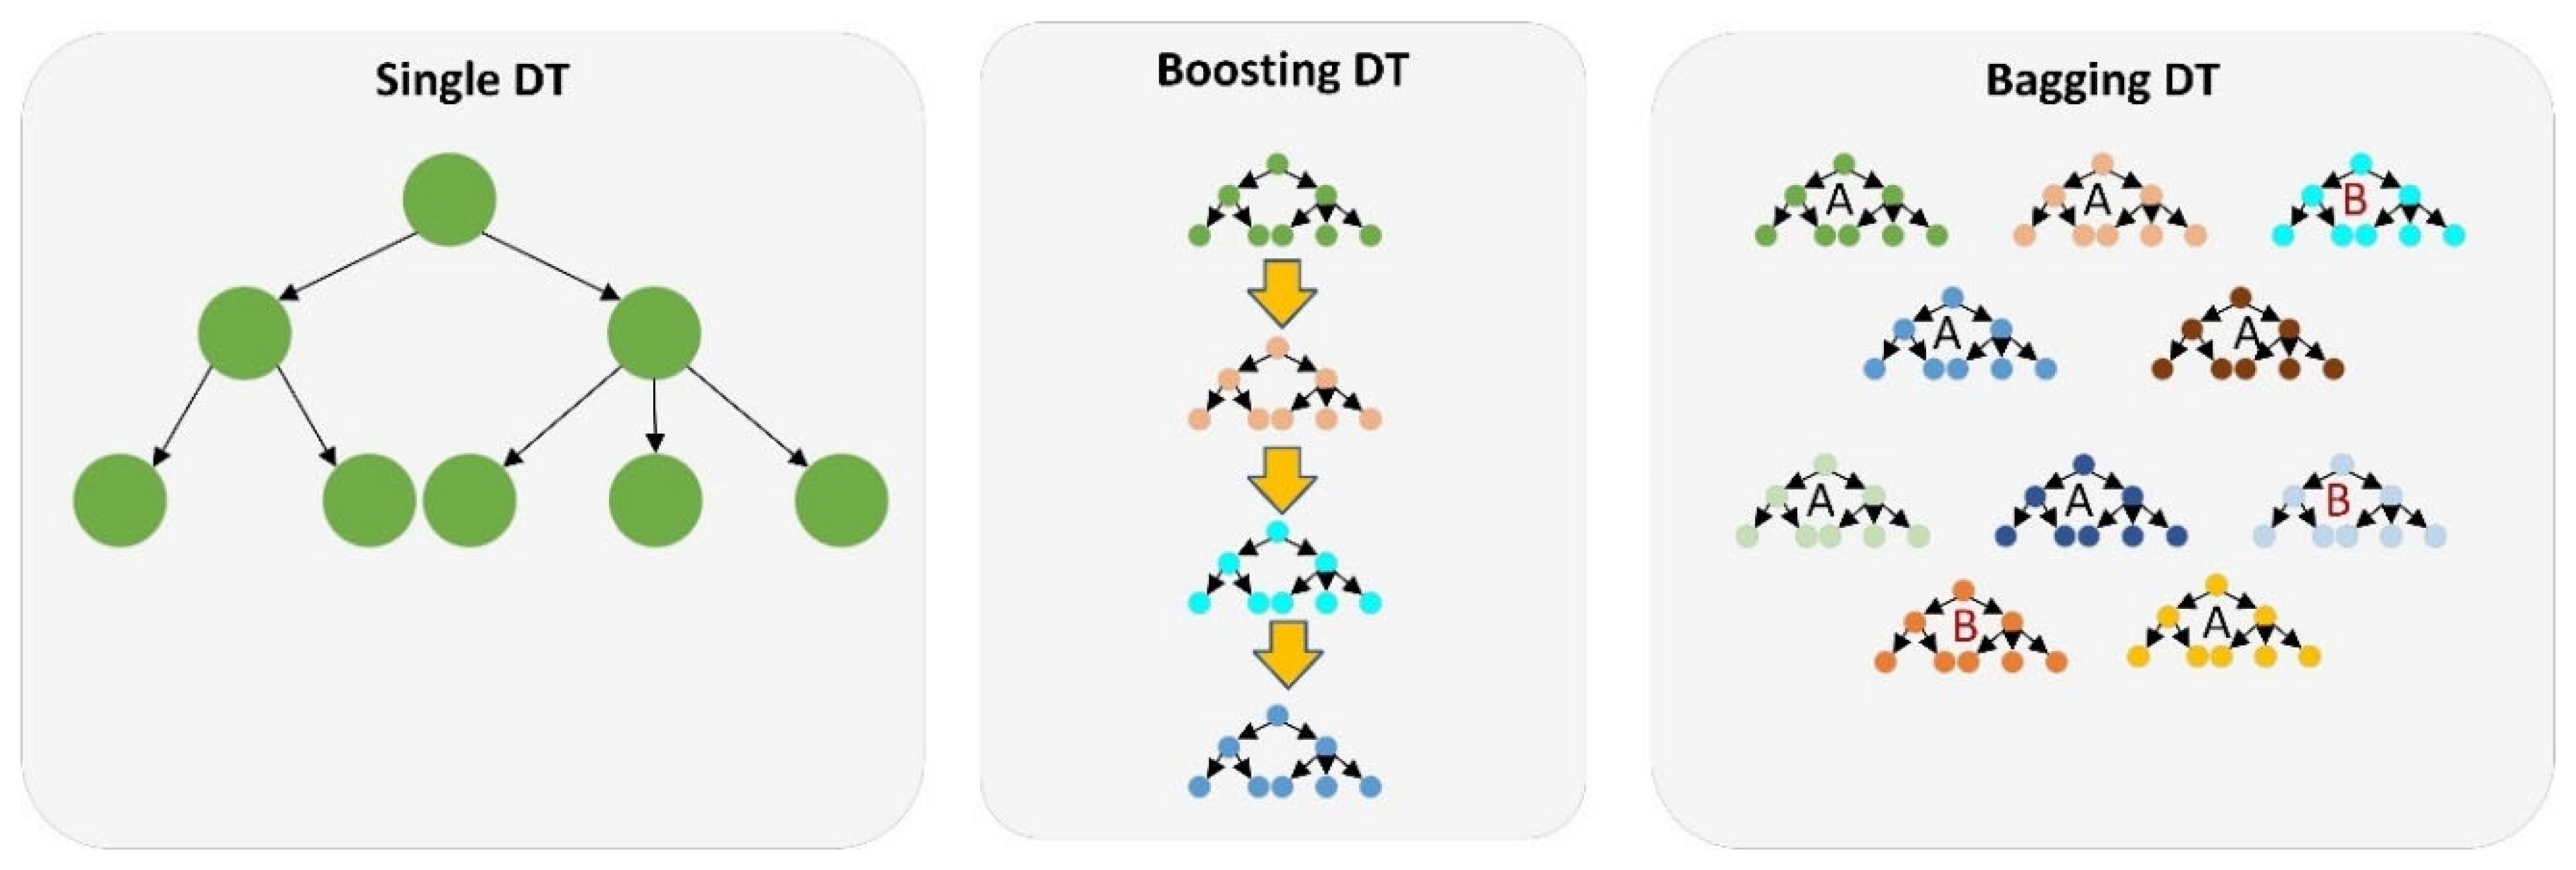
6.2. Tree-Ensemble-Based Prediction Model
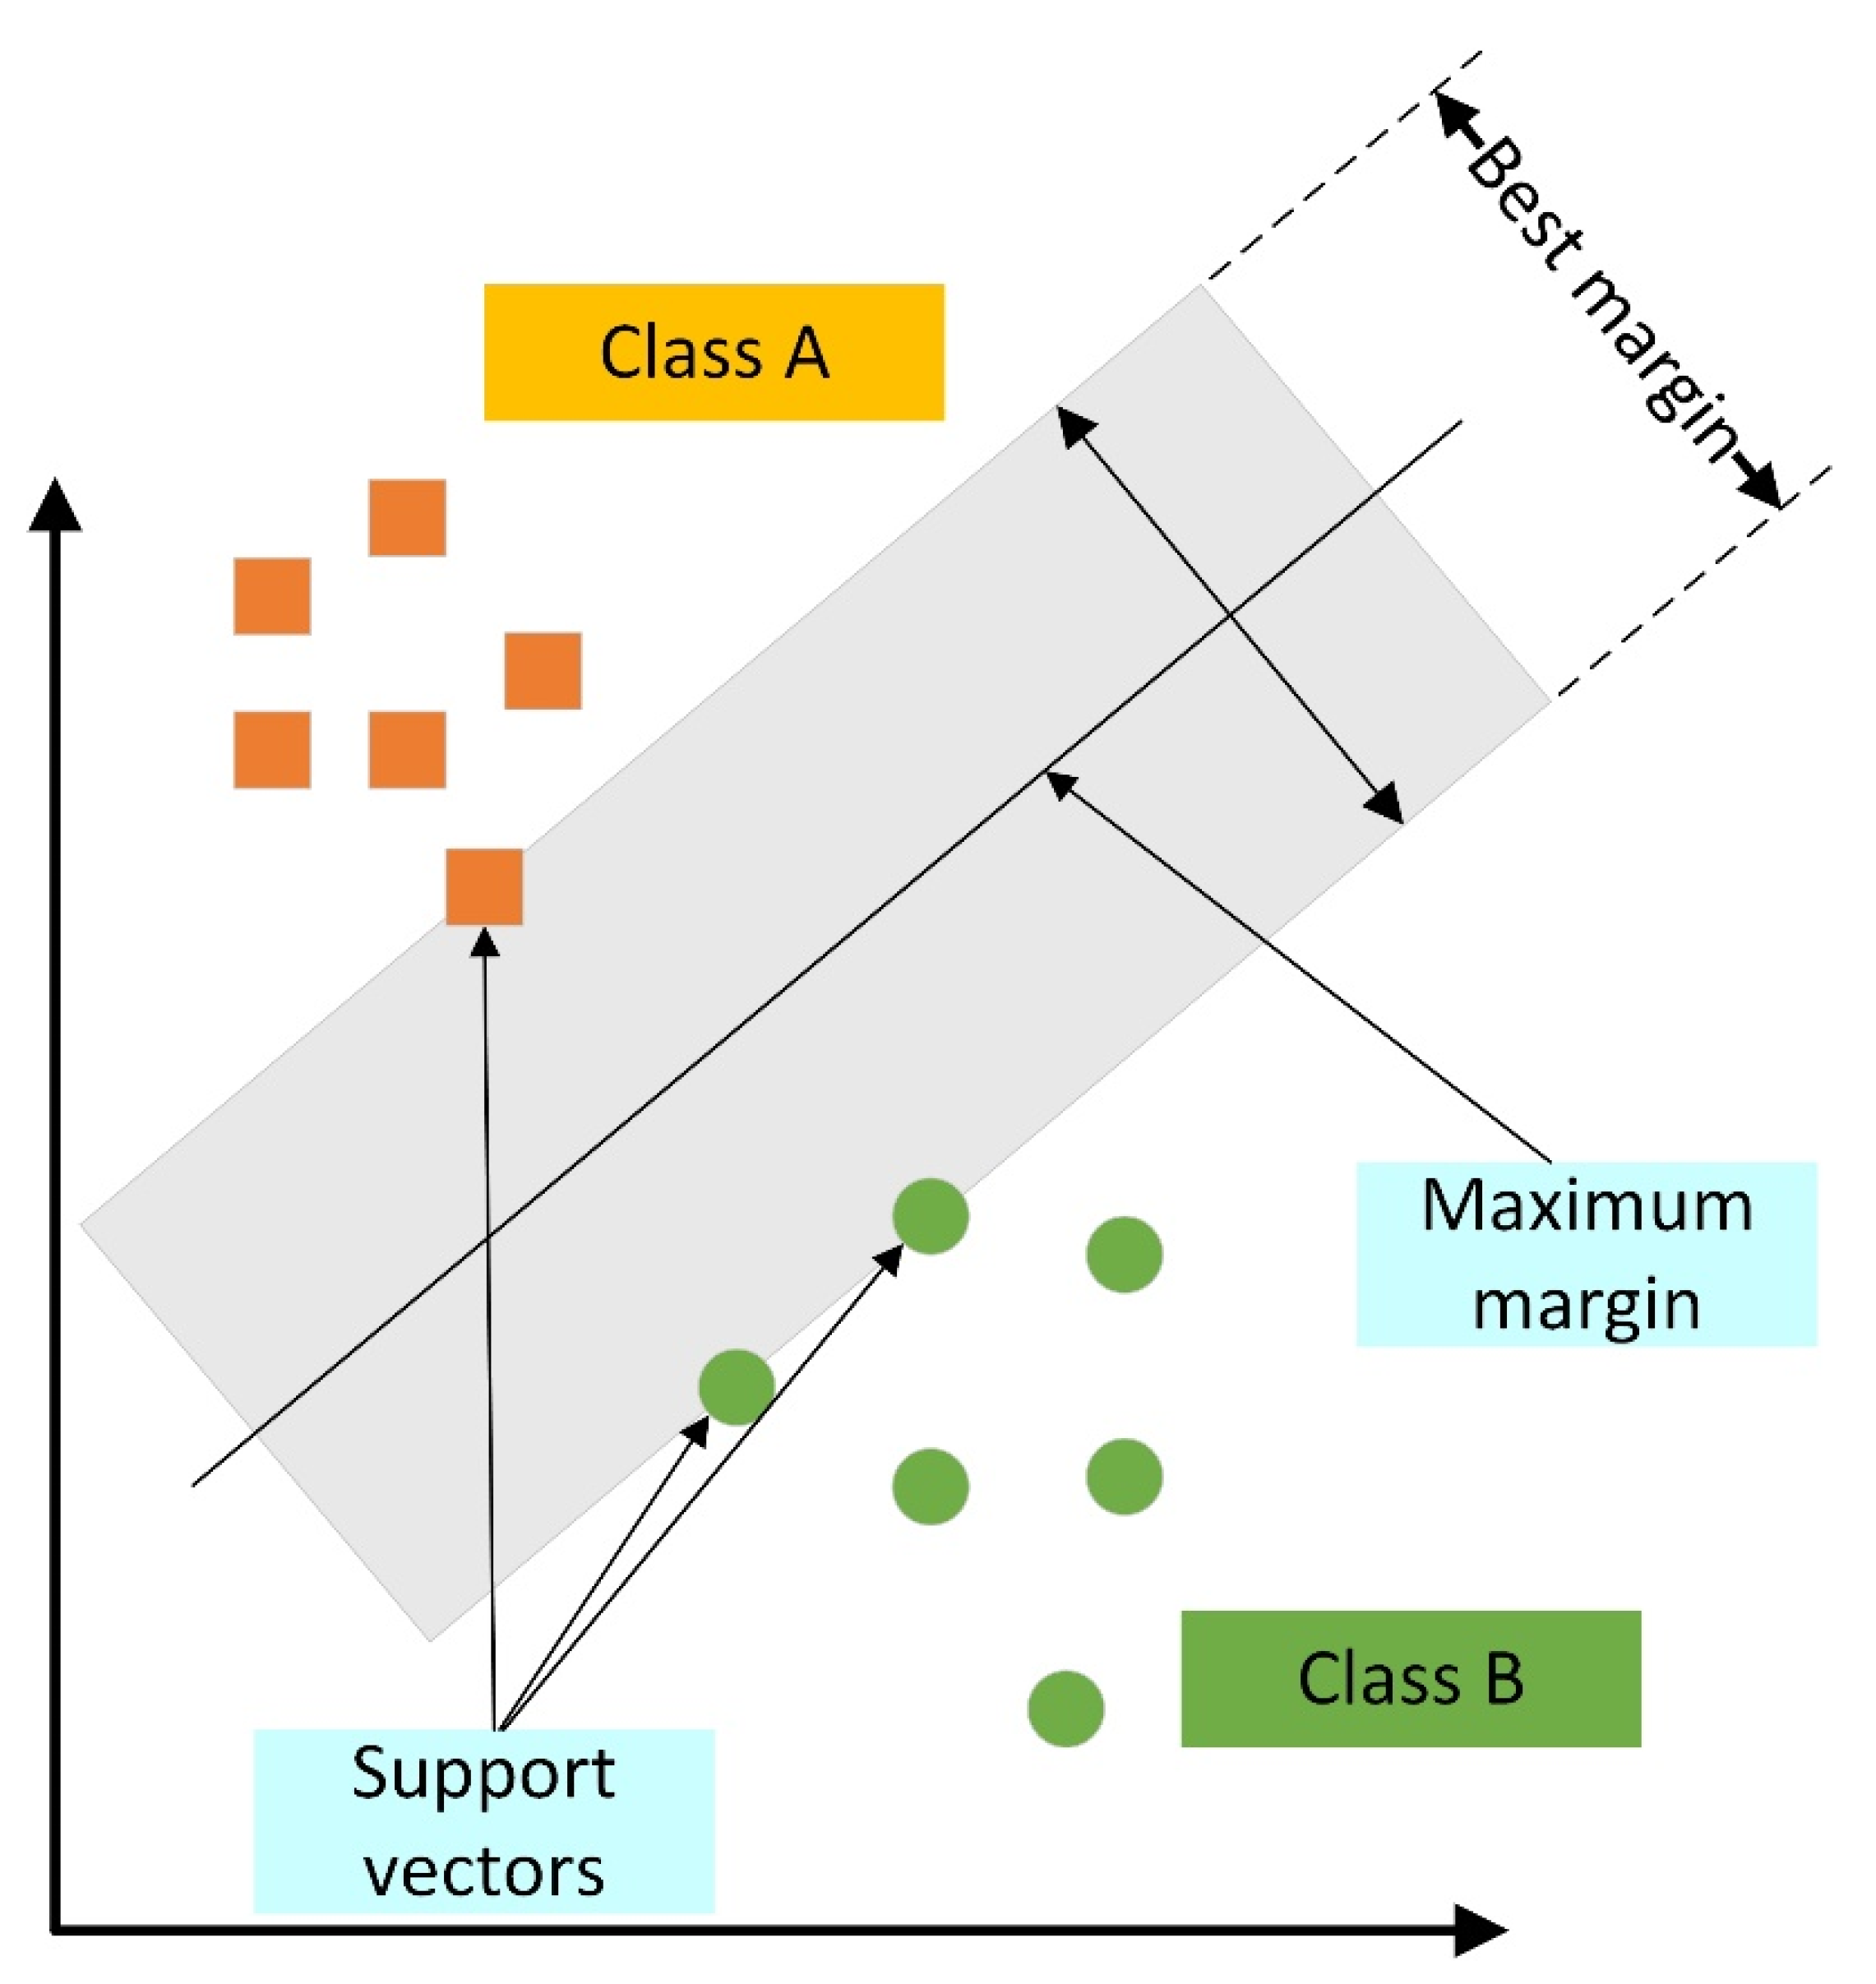
6.3. Support Vector Machines (SVM)
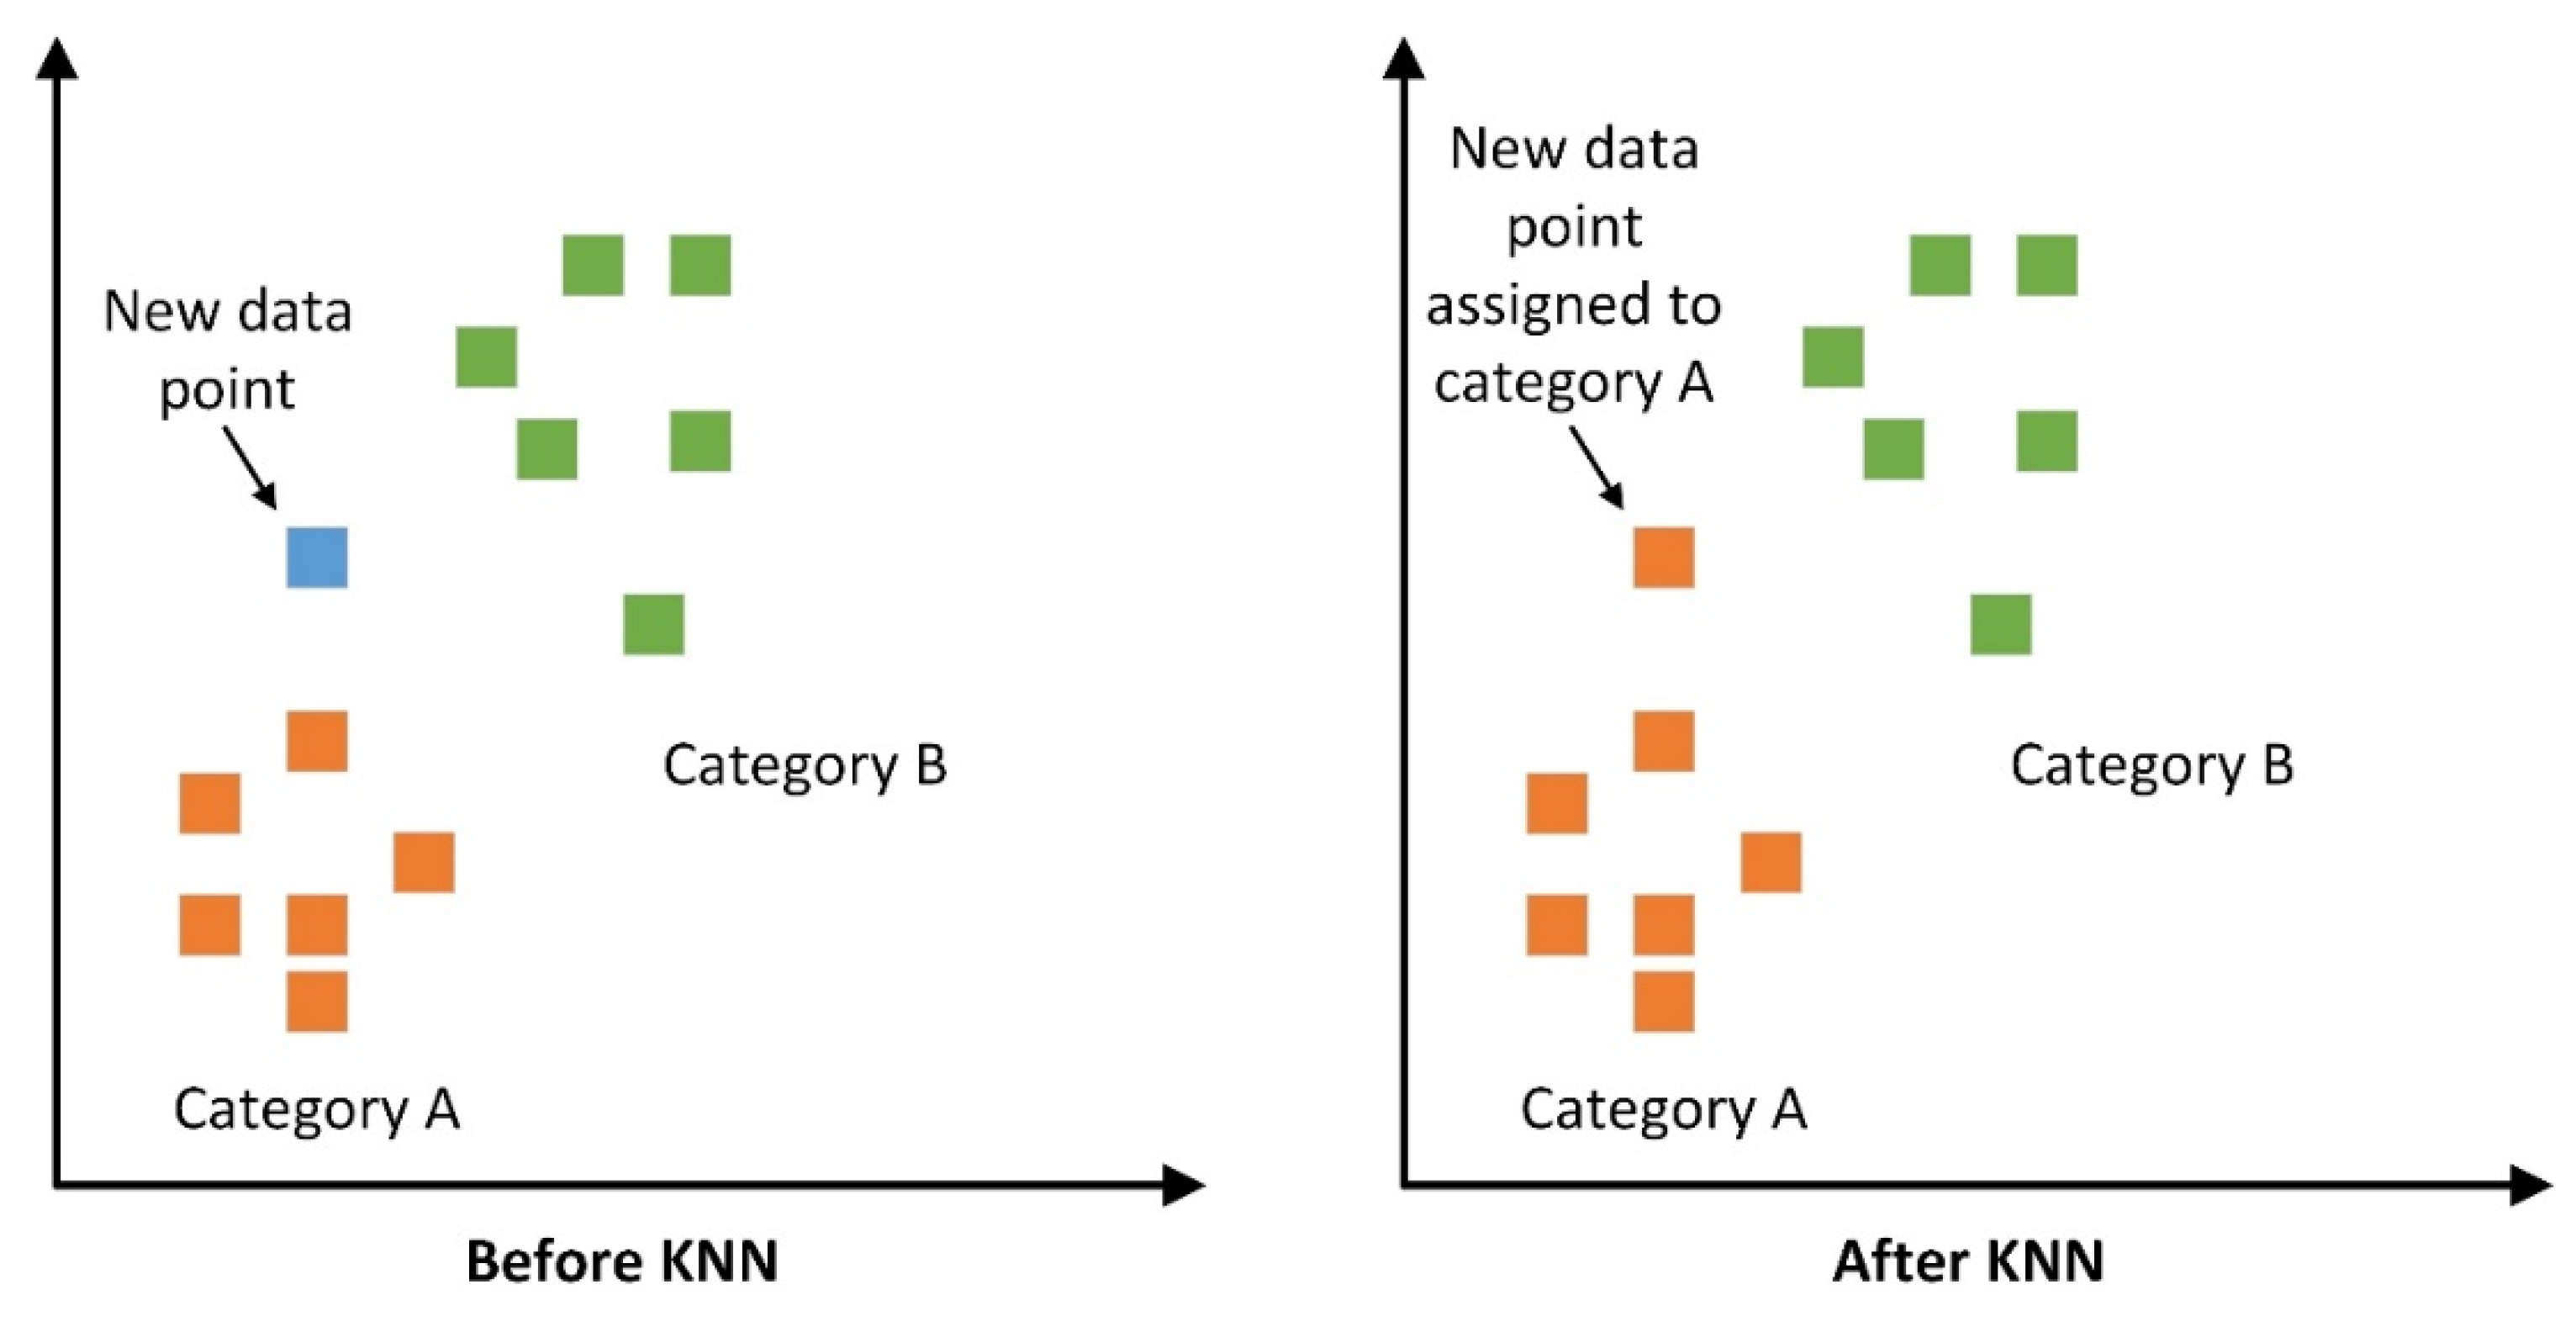
6.4. K-Nearest Neighboyrs (KNN)
7. Comparison of Models Developed
8. Conclusions
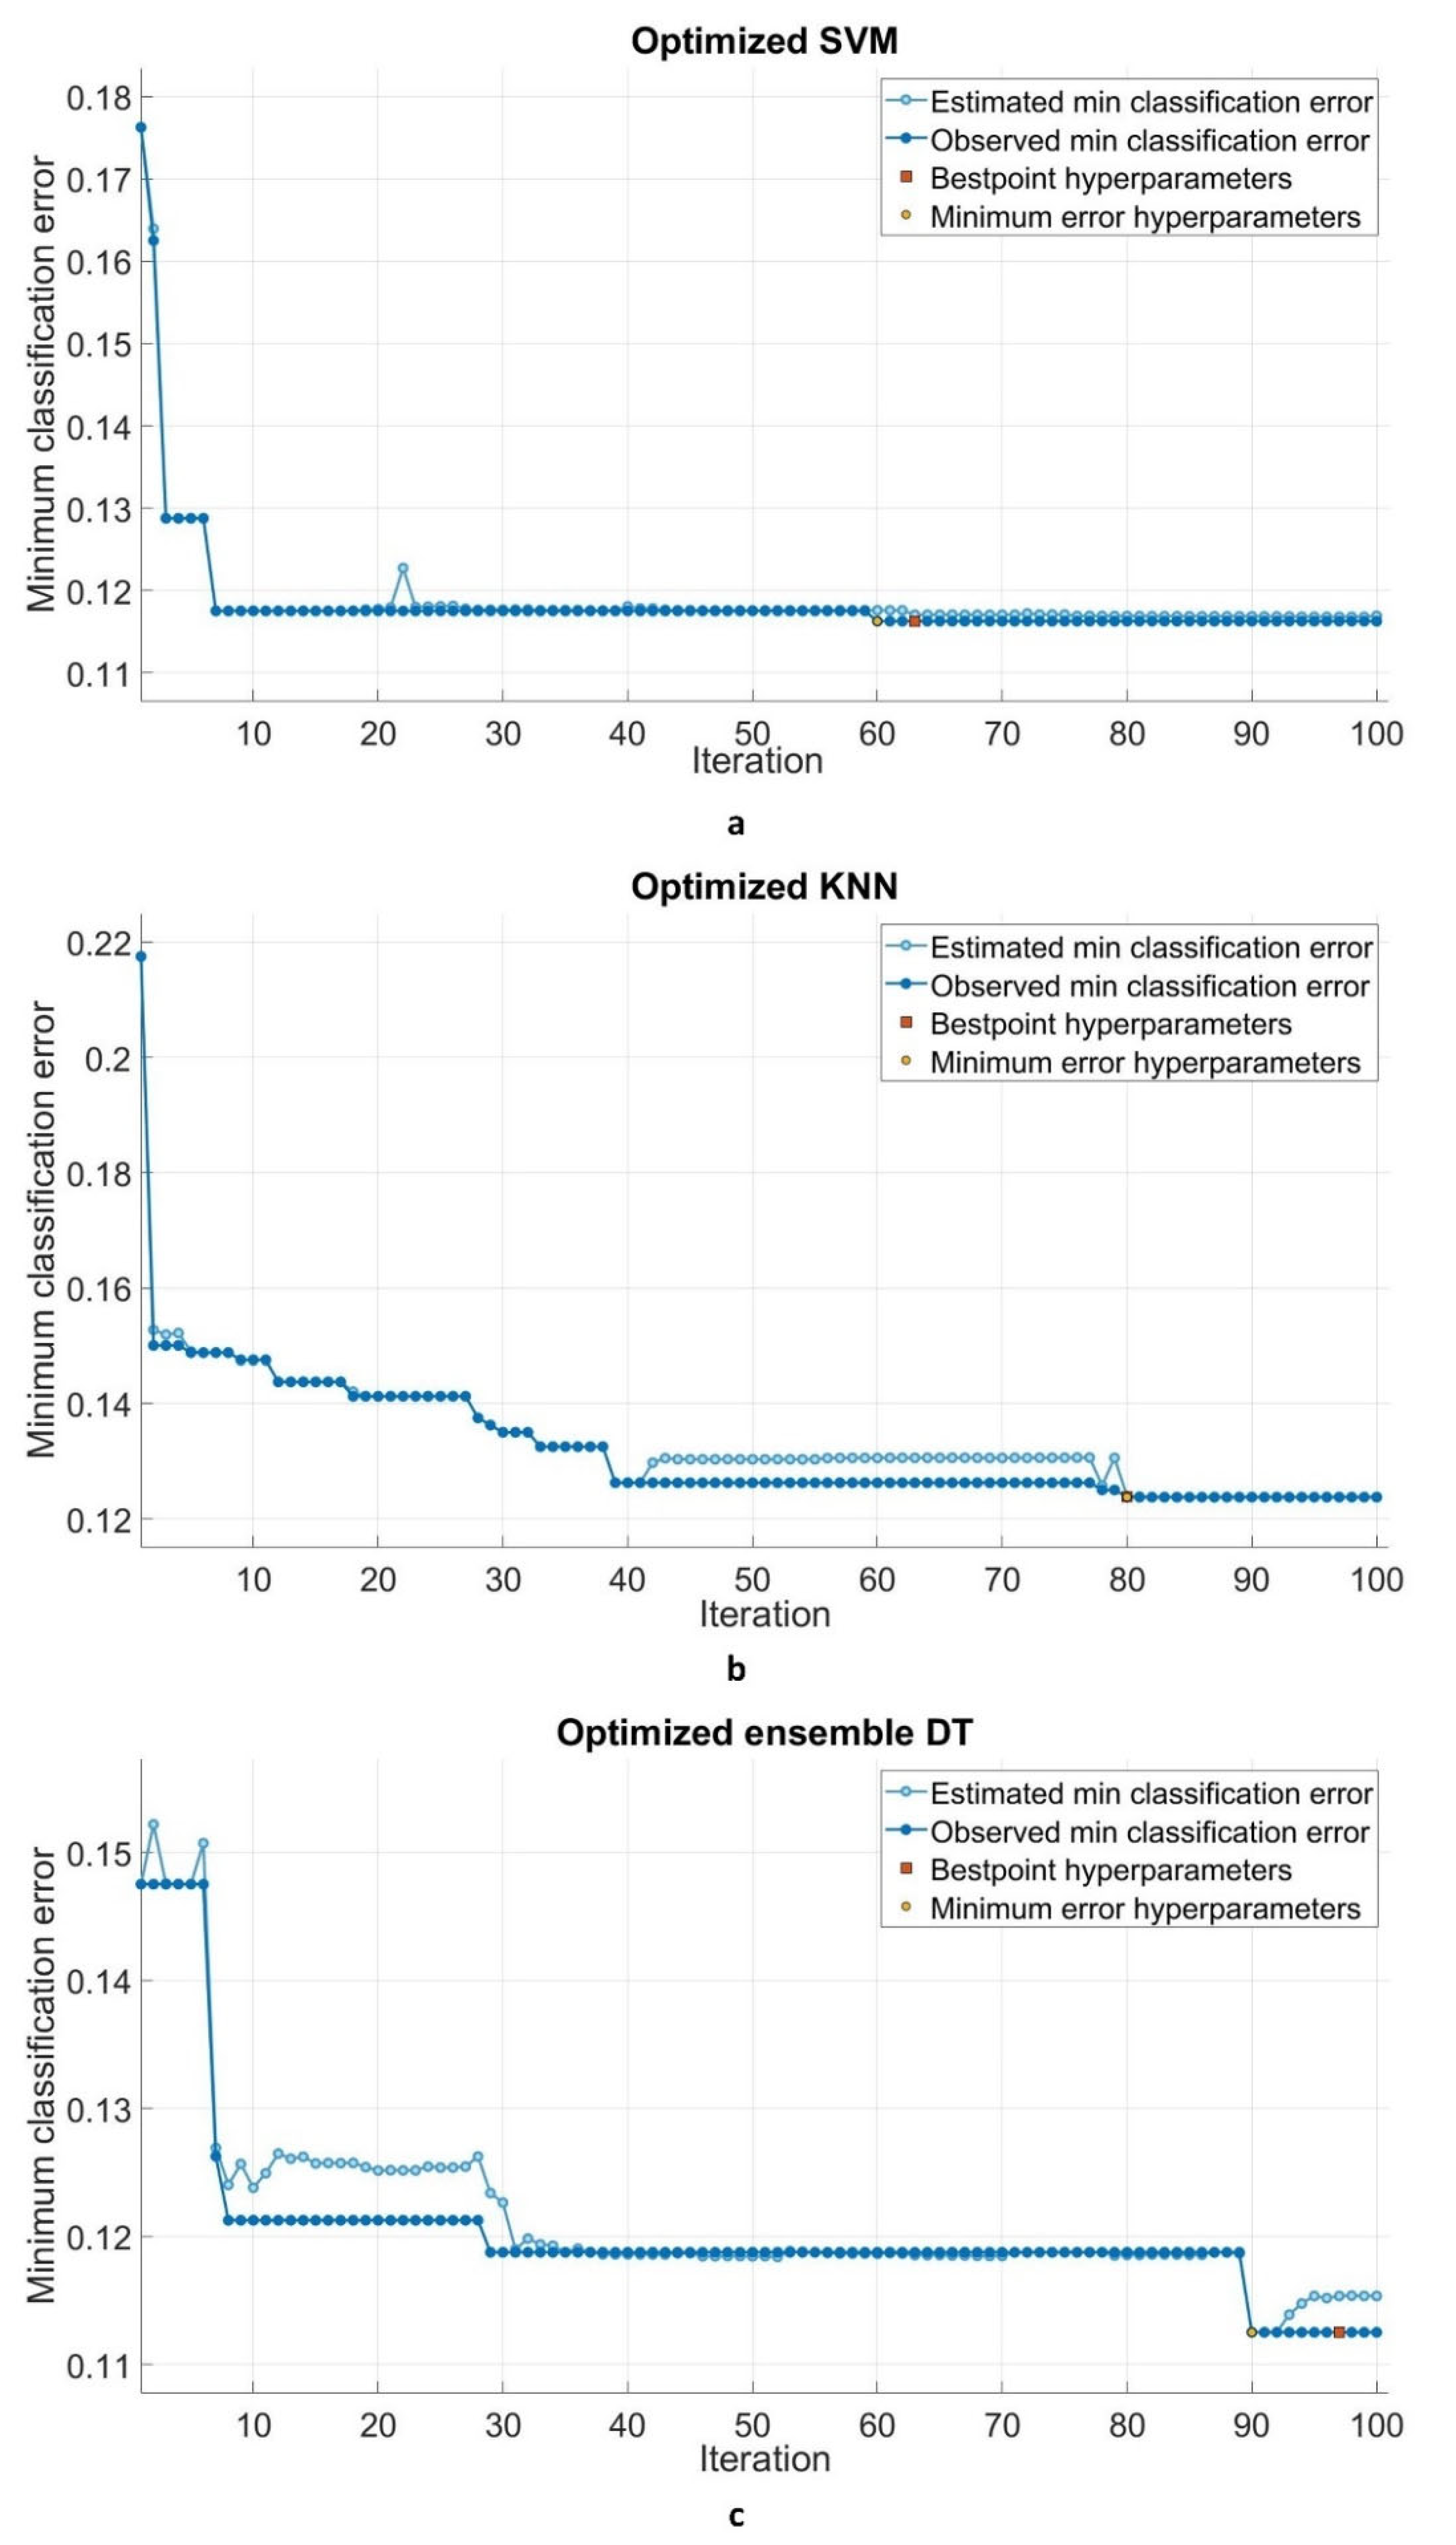
- With regards to the iteration process, the SVM model achieved the minimum classification error earlier than the other two models. The SVM was followed by the KNN and EDT, respectively.
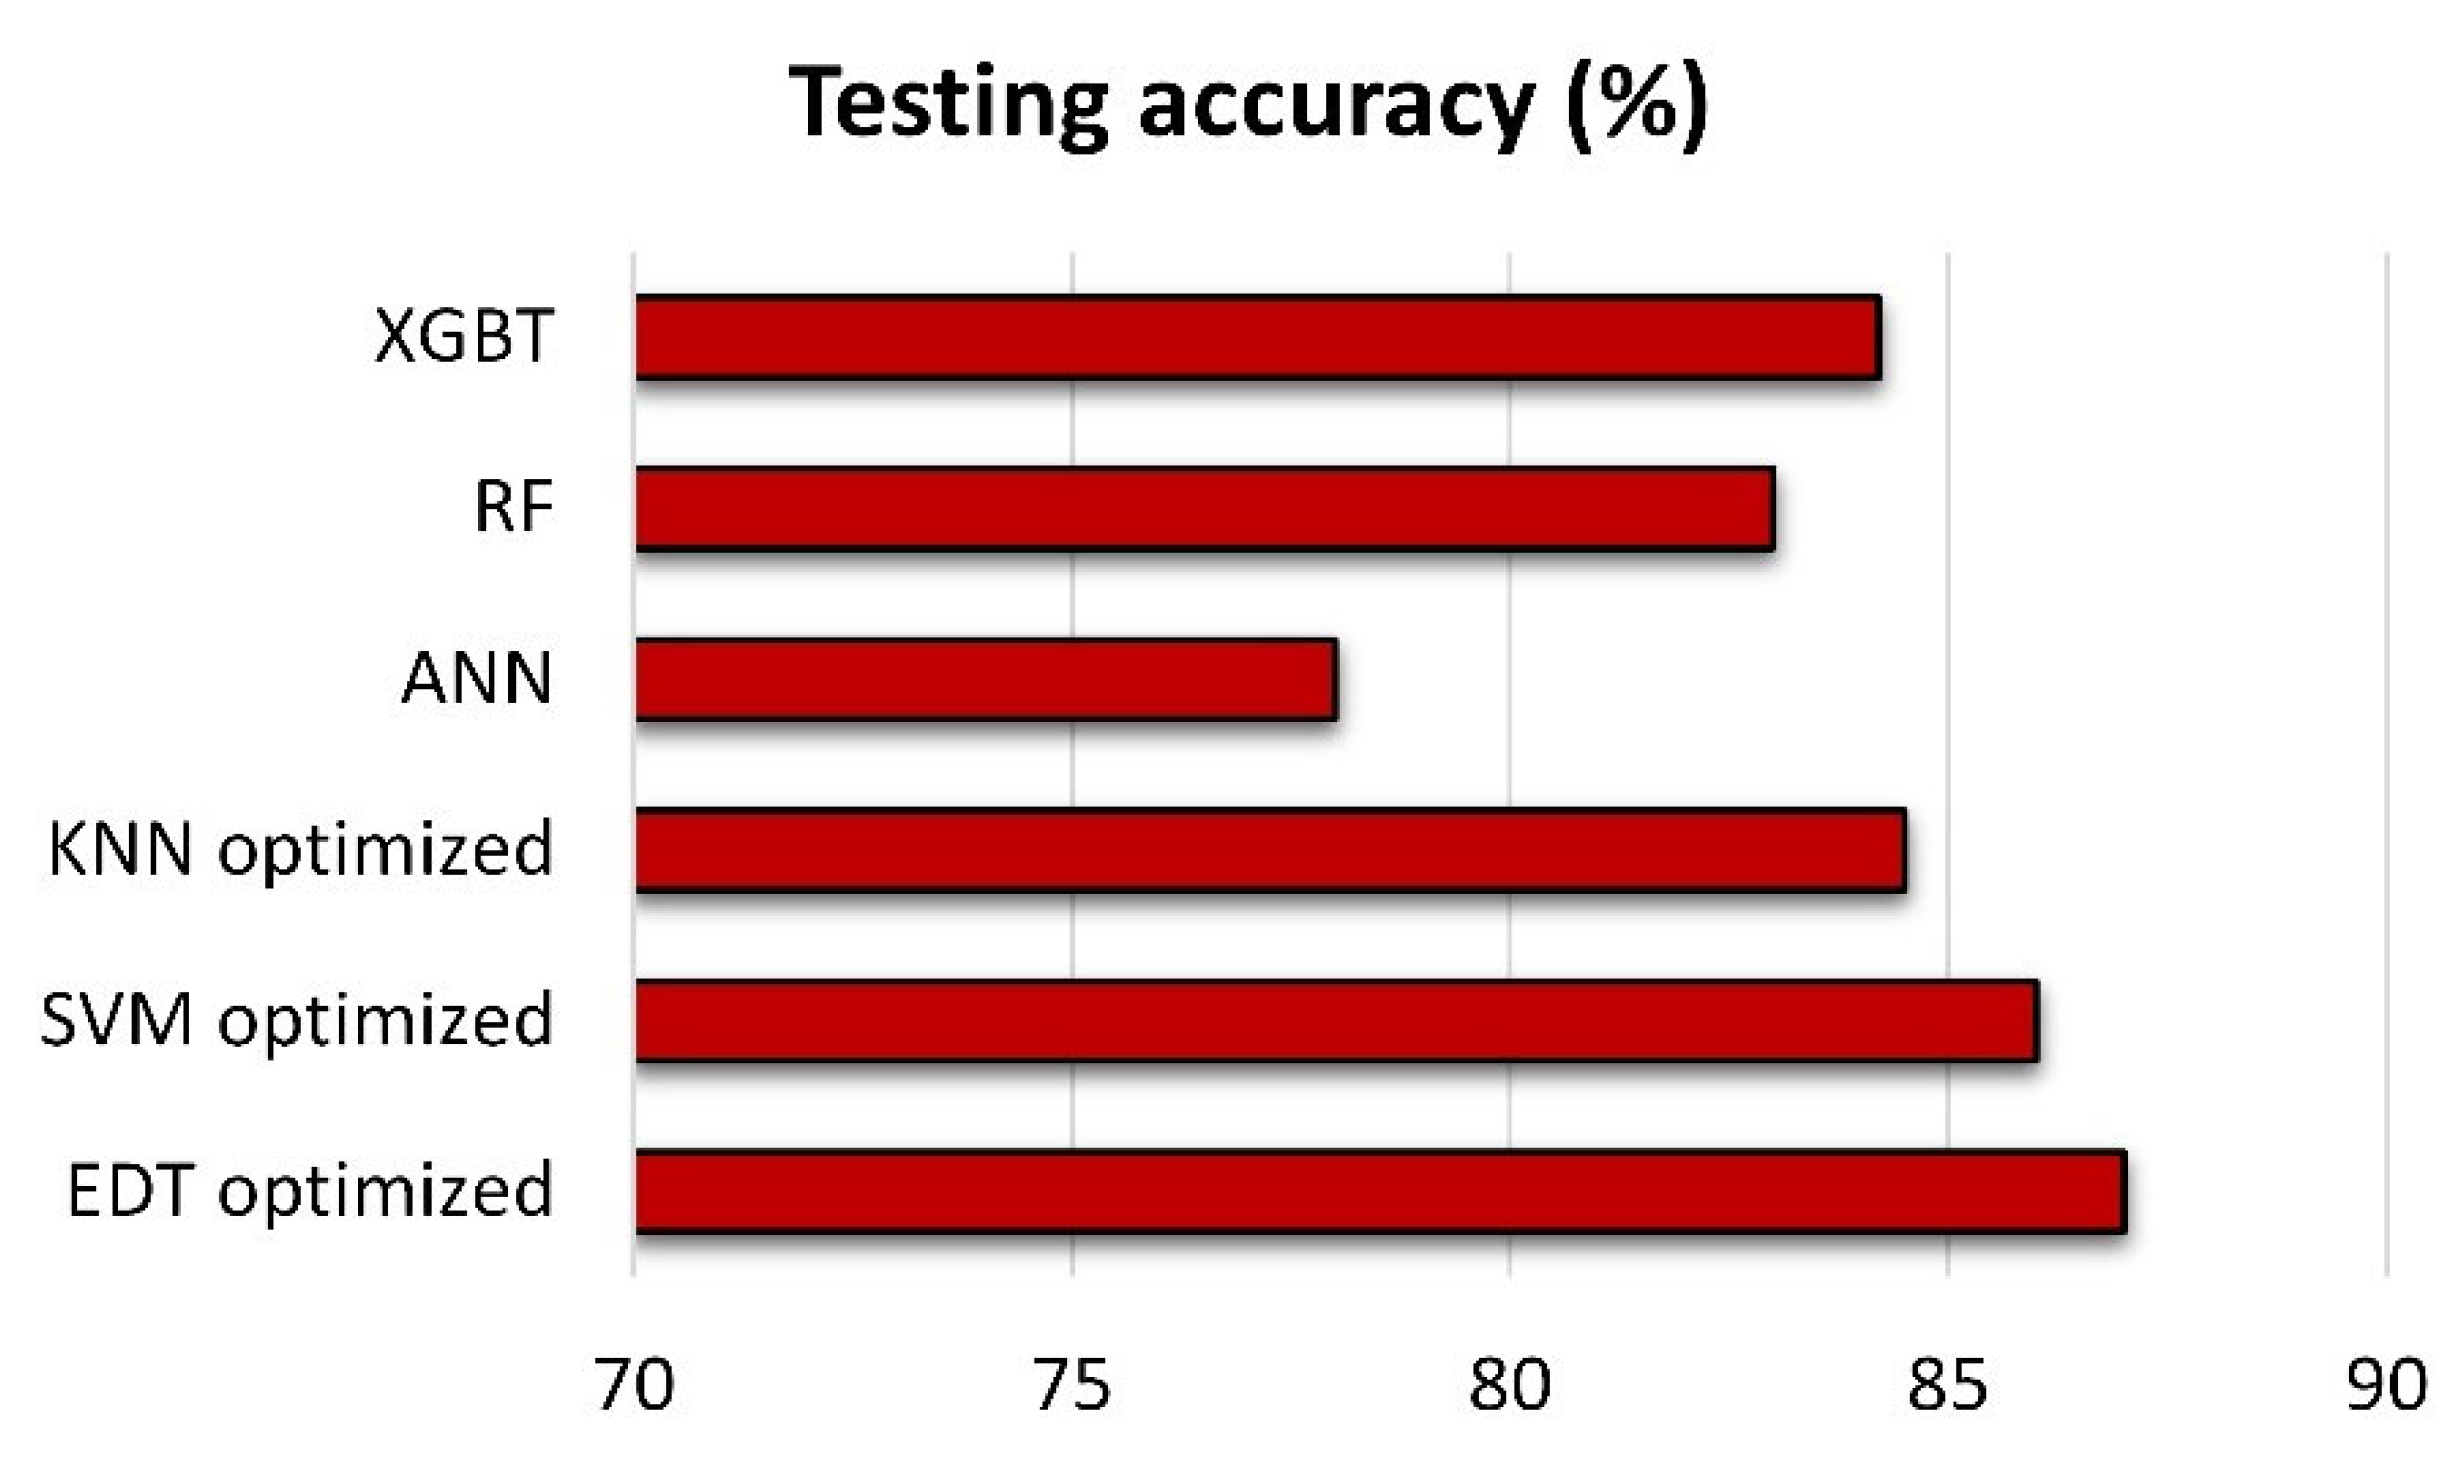
- In both training and testing phases, the classification accuracy of all standard SVM, KNN, and EDT models was improved using the BO algorithm. For training phases, the SVM model’s accuracy improved more substantially (+5.4%) than the two other models. In the testing phase, the KNN model showed the greatest improvement (+11%).
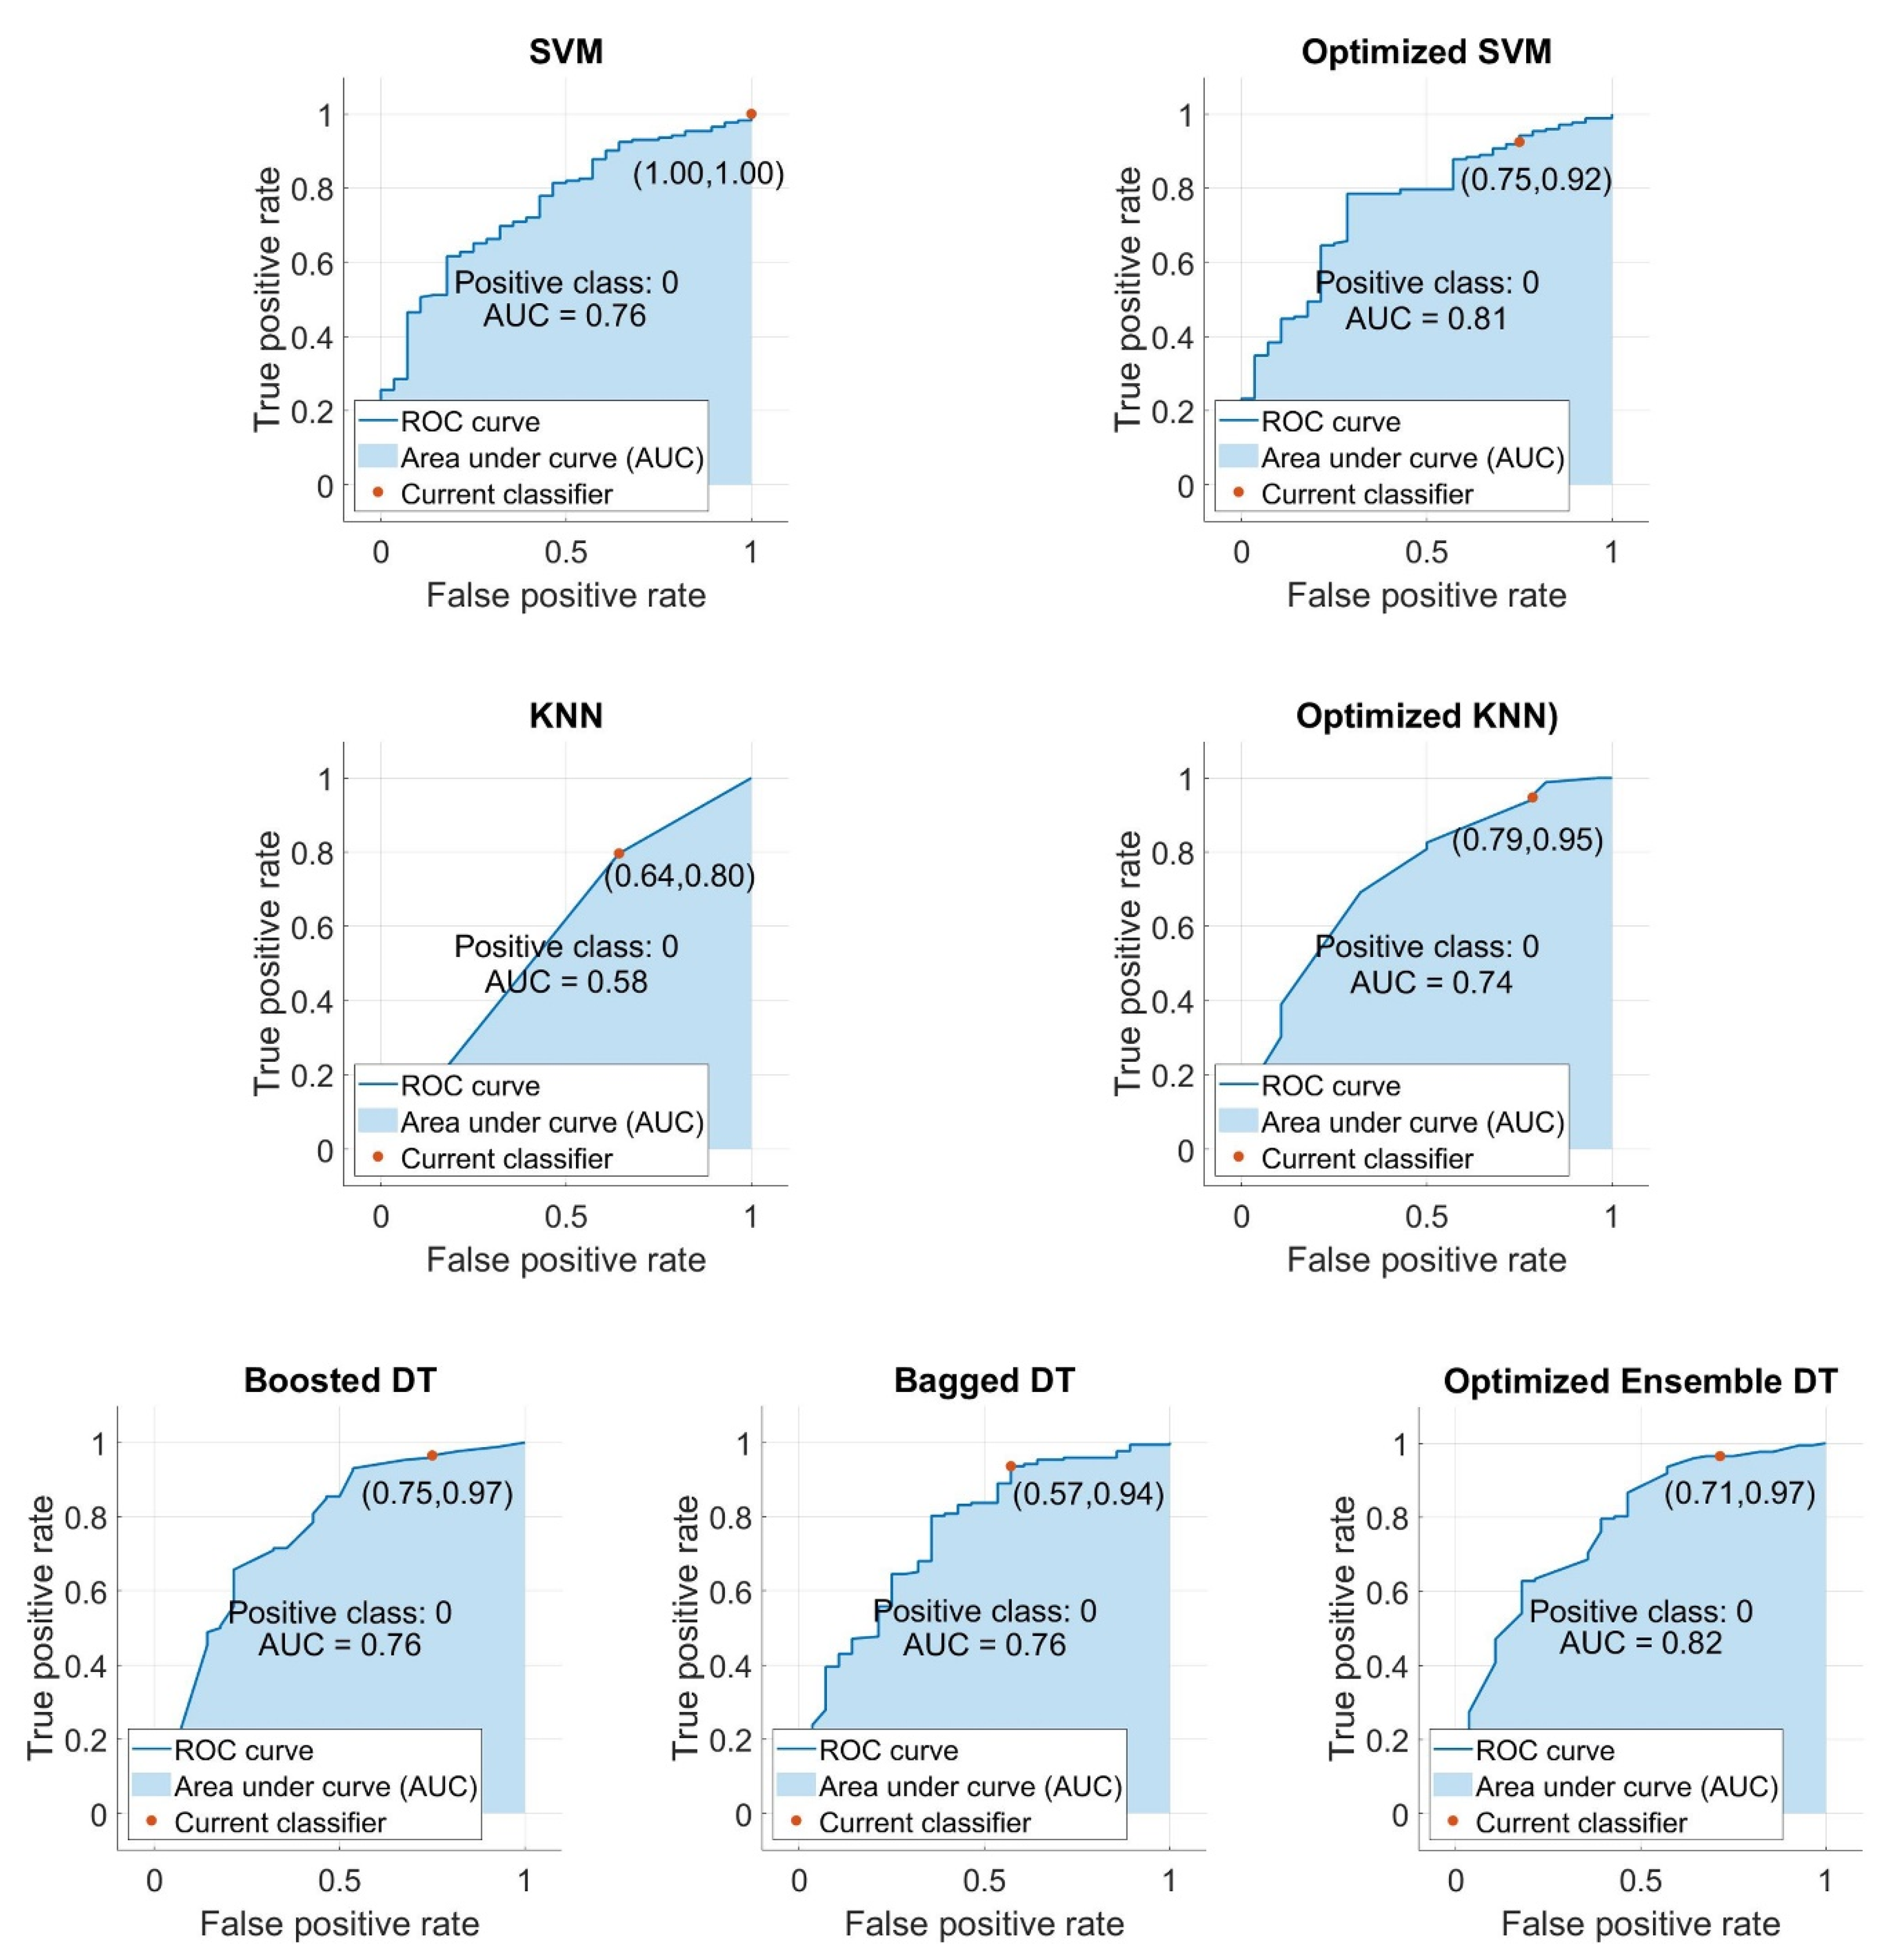
- With regards to testing the AUC after the optimization process, the optimized KNN model had the greatest improvement (+0.16) compared to the two other models. The KNN model was followed by the SVM (0.05) and EDT (0.06), respectively.
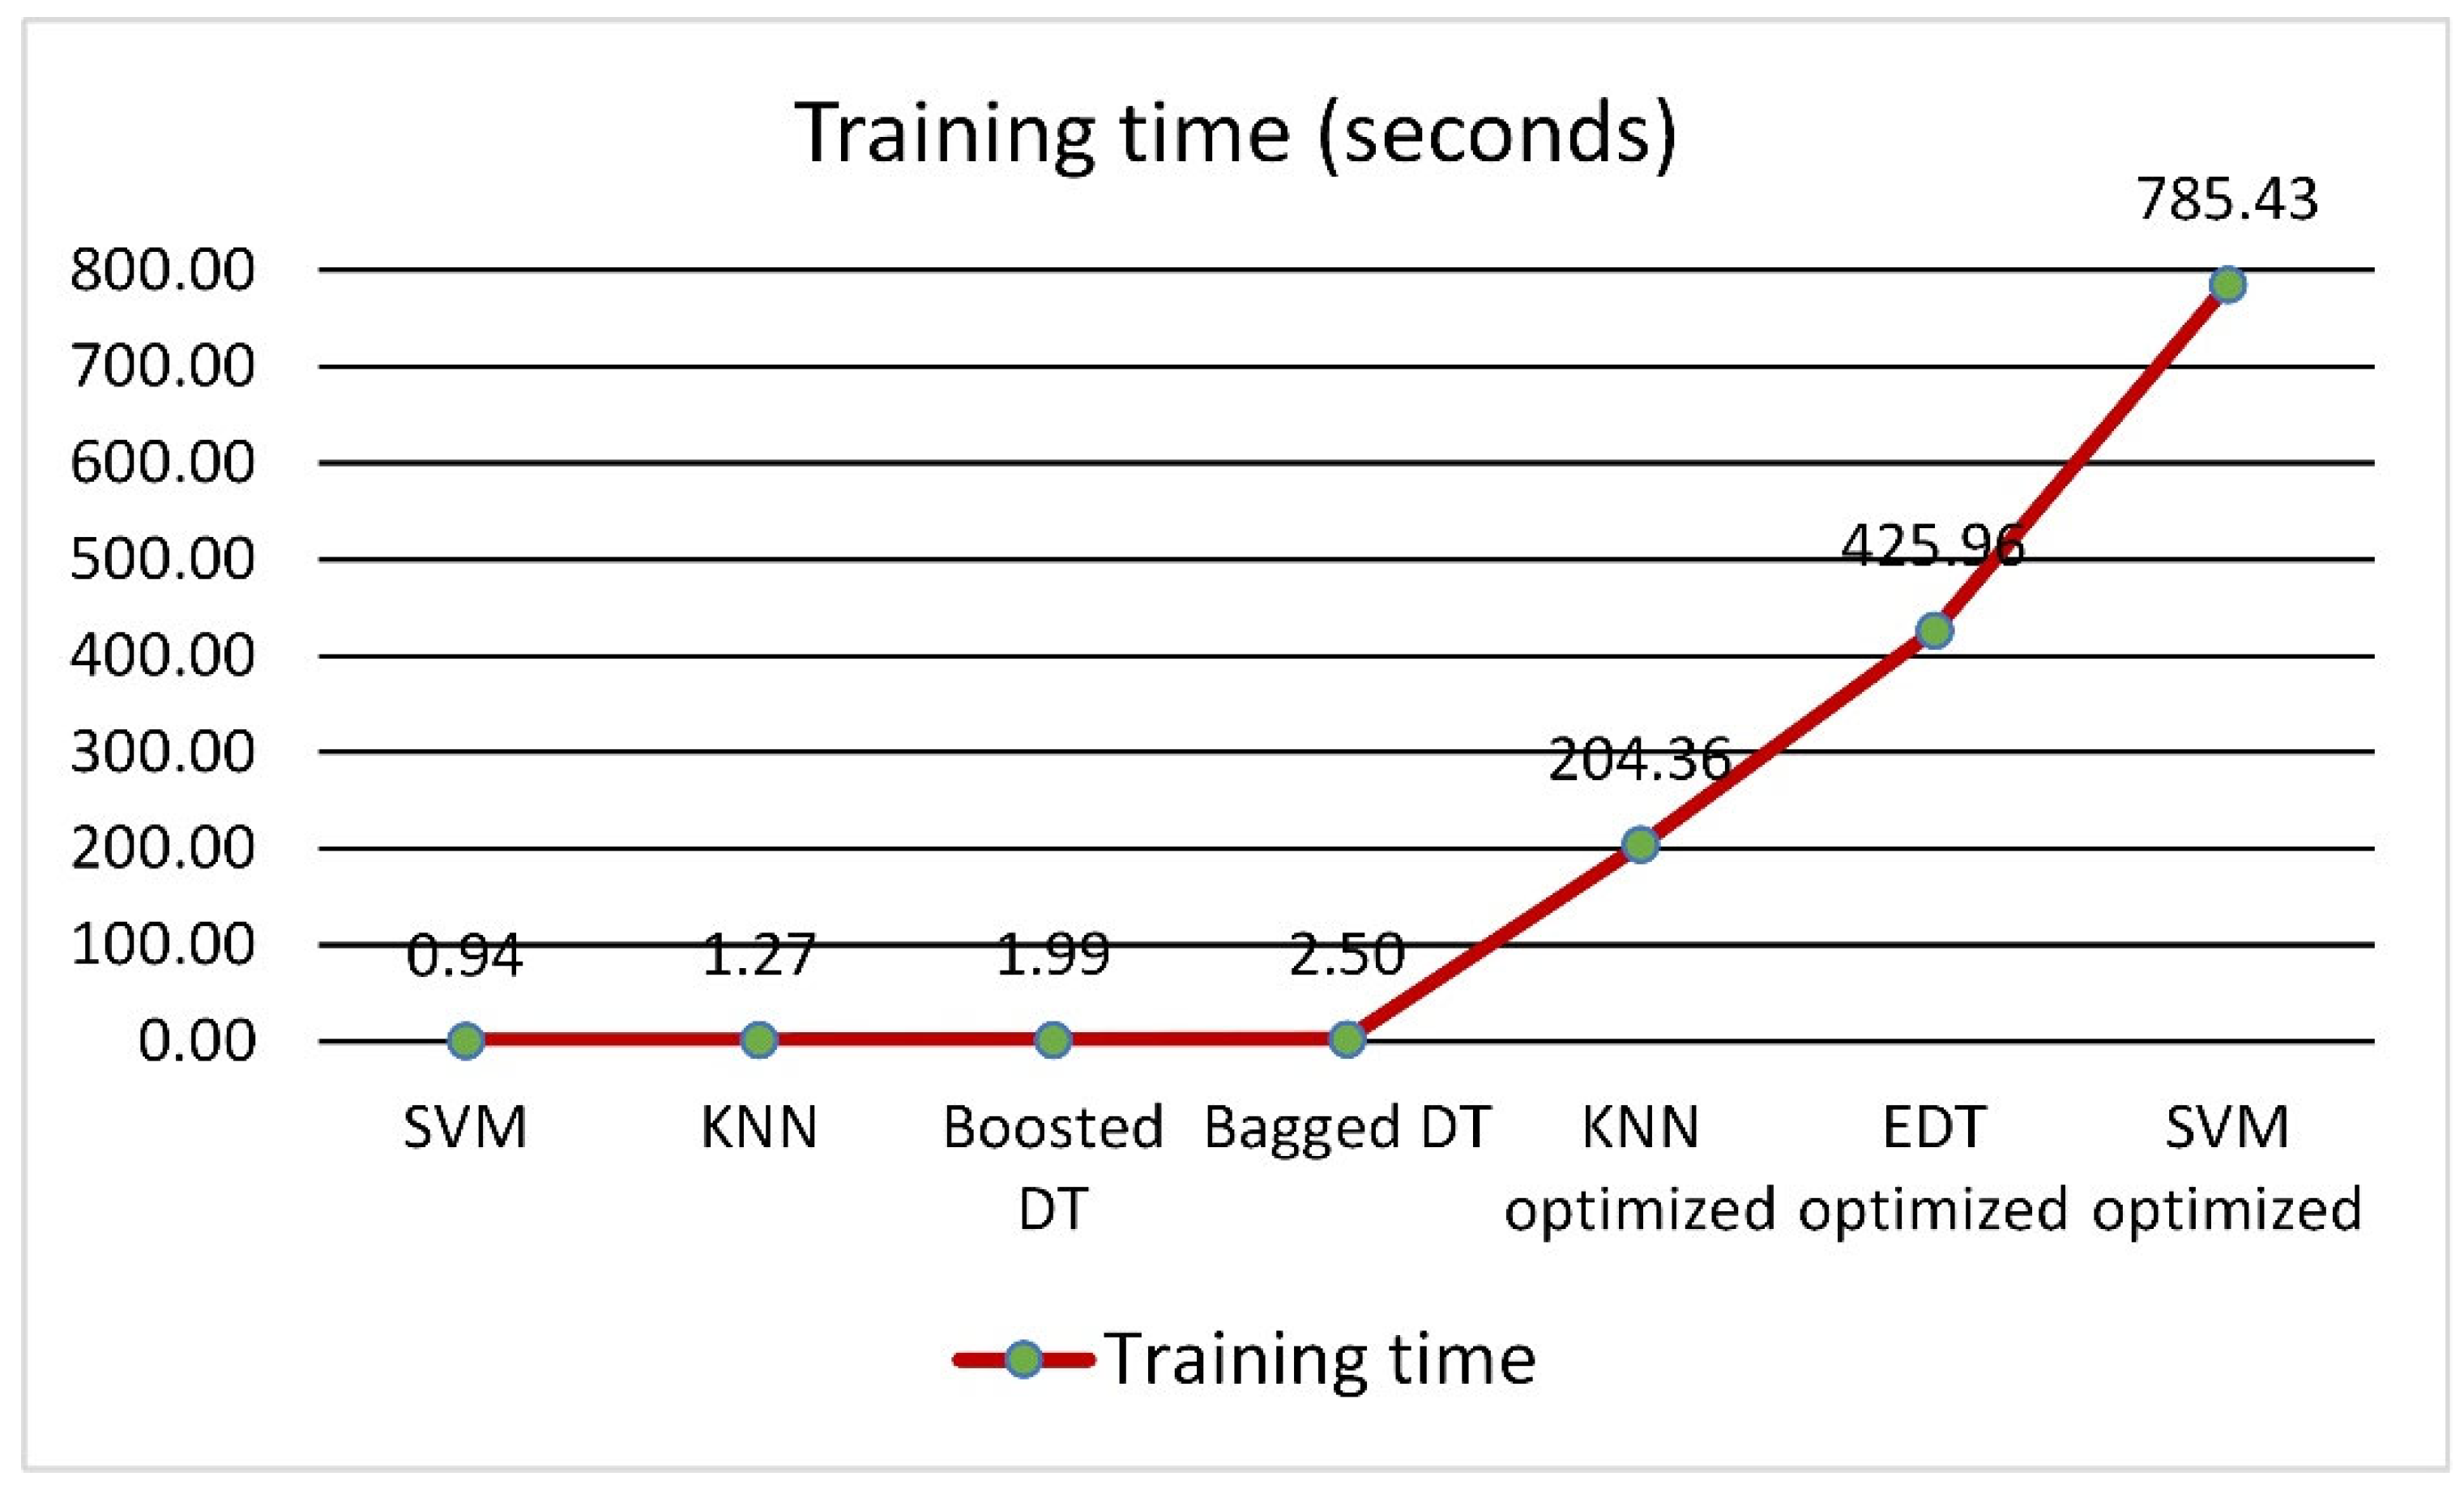
- SVM and EDT models required the higher training time than the KNN model. However, this higher training time resulted in higher accuracy for these two models. As a result, we can overlook the longer training times of SVM and EDT models when compared to KNN models in exchange for their higher accuracy and performance.
Author Contributions
Funding
Institutional Review Board Statement
Informed Consent Statement
Acknowledgments
Conflicts of Interest
References
- Australian Transport Council (ATC). National Road Safety Strategy 2011–2020; Australian Transport Council (ATC): Canberra, Australia, 2011. [Google Scholar]
- Department of Infrastructure Regional Development and Cities. Australian Road Deaths Database. 2021. Available online: https://www.bitre.gov.au/statistics/safety/fatal_road_crash_database (accessed on 13 November 2021).
- Bureau of Infrastructure and Transport Research Economics (BITRE). Road Trauma Involving Heavy Vehicles 2018 Crash Statistical Summary; BITRE: Canberra, Australia, 2020. [Google Scholar]
- Zegeer, C.V.; Bushell, M. Pedestrian crash trends and potential countermeasures from around the world. Accid. Anal. Prev. 2012, 44, 3–11. [Google Scholar] [CrossRef] [PubMed]
- Anderson, R.; Ponte, G.; Doecke, S. A Survey of Bullbar Prevalence at Pedestrian Crash Sites in Adelaide, South Australia; Centre for Automotive Safety Research: Adelaide, Australia, 2008. [Google Scholar]
- Samerei, S.A.; Aghabayk, K.; Shiwakoti, N.; Karimi, S. Modelling bus-pedestrian crash severity in the state of Victoria, Australia. Int. J. Inj. Control Saf. Promot. 2021, 28, 233–242. [Google Scholar] [CrossRef] [PubMed]
- Arnold, P.; Rosman, D.; Thornett, M. Pedestrian crash risk in Western Australia for both pedestrians and drivers. Road Transp. Res. 1992, 1, 60–75. [Google Scholar]
- Imprialou, M.; Quddus, M. Crash data quality for road safety research: Current state and future directions. Accid. Anal. Prev. 2019, 130, 84–90. [Google Scholar] [CrossRef] [Green Version]
- Mannering, F.L.; Bhat, C.R. Analytic methods in accident research: Methodological frontier and future directions. Anal. Methods Accid. Res. 2014, 1, 1–22. [Google Scholar] [CrossRef]
- Shaheed, M.S.; Gkritza, K. A latent class analysis of single-vehicle motorcycle crash severity outcomes. Anal. Methods Accid. Res. 2014, 2, 30–38. [Google Scholar] [CrossRef]
- Sun, M.; Sun, X.; Shan, D. Pedestrian crash analysis with latent class clustering method. Accid. Anal. Prev. 2019, 124, 50–57. [Google Scholar] [CrossRef]
- Aghaabbasi, M.; Shekari, Z.A.; Shah, M.Z.; Olakunle, O.; Armaghani, D.J.; Moeinaddini, M. Predicting the use frequency of ride-sourcing by off-campus university students through random forest and Bayesian network techniques. Transp. Res. Part A Policy Pract. 2020, 136, 262–281. [Google Scholar] [CrossRef]
- Qian, Y.; Aghaabbasi, M.; Ali, M.; Alqurashi, M.; Salah, B.; Zainol, R.; Moeinaddini, M.; Hussein, E.E. Classification of Imbalanced Travel Mode Choice to Work Data Using Adjustable SVM Model. Appl. Sci. 2021, 11, 11916. [Google Scholar] [CrossRef]
- Aghaabbasi, M.; Shah, M.Z.; Zainol, R. Investigating the Use of Active Transportation Modes among University Employees through an Advanced Decision Tree Algorithm. Civ. Sustain. Urban Eng. 2021, 1, 26–49. [Google Scholar] [CrossRef]
- Ali, M.; de Azevedo, A.R.G.; Marvila, M.T.; Khan, M.I.; Memon, A.M.; Masood, F.; Almahbashi, N.M.Y.; Shad, M.K.; Khan, M.A.; Fediuk, R.; et al. The Influence of COVID-19-Induced Daily Activities on Health Parameters—A Case Study in Malaysia. Sustainability 2021, 13, 7465. [Google Scholar] [CrossRef]
- Ali, M.; Dharmowijoyo, D.B.; Harahap, I.S.; Puri, A.; Tanjung, L.E. Travel behaviour and health: Interaction of Activity-Travel Pattern, Travel Parameter and Physical Intensity. Solid State Technol. 2020, 63, 4026–4039. [Google Scholar]
- Ali, M.; Dharmowijoyo, D.B.E.; de Azevedo, A.R.G.; Fediuk, R.; Ahmad, H.; Salah, B. Time-Use and Spatio-Temporal Variables Influence on Physical Activity Intensity, Physical and Social Health of Travelers. Sustainability 2021, 13, 12226. [Google Scholar] [CrossRef]
- Chen, Y.; Aghaabbasi, M.; Ali, M.; Anciferov, S.; Sabitov, L.; Chebotarev, S.; Nabiullina, K.; Sychev, E.; Fediuk, R.; Zainol, R. Hybrid Bayesian Network Models to Investigate the Impact of Built Environment Experience before Adulthood on Students’ Tolerable Travel Time to Campus: Towards Sustainable Commute Behavior. Sustainability 2022, 14, 325. [Google Scholar] [CrossRef]
- Fan, Q.; Zhang, Y. Self-adaptive differential evolution algorithm with crossover strategies adaptation and its application in parameter estimation. Chemom. Intell. Lab. Syst. 2016, 151, 164–171. [Google Scholar] [CrossRef]
- Zajac, S.S.; Ivan, J.N. Factors influencing injury severity of motor vehicle–crossing pedestrian crashes in rural Connecticut. Accid. Anal. Prev. 2003, 35, 369–379. [Google Scholar] [CrossRef]
- Rifaat, S.M.; Chin, H.C. Accident severity analysis using ordered probit model. J. Adv. Transp. 2007, 41, 91–114. [Google Scholar] [CrossRef]
- Obeng, K.; Rokonuzzaman, M. Pedestrian injury severity in automobile crashes. Open J. Saf. Sci. Technol. 2013, 3, 9–17. [Google Scholar] [CrossRef] [Green Version]
- Kwigizile, V.; Sando, T.; Chimba, D. Inconsistencies of ordered and unordered probability models for pedestrian injury severity. Transp. Res. Rec. 2011, 2264, 110–118. [Google Scholar] [CrossRef]
- Yasmin, S.; Eluru, N. Evaluating alternate discrete outcome frameworks for modeling crash injury severity. Accid. Anal. Prev. 2013, 59, 506–521. [Google Scholar] [CrossRef]
- Sze, N.-N.; Wong, S. Diagnostic analysis of the logistic model for pedestrian injury severity in traffic crashes. Accid. Anal. Prev. 2007, 39, 1267–1278. [Google Scholar] [CrossRef] [PubMed]
- Kim, S.; Ulfarsson, G.F. Traffic safety in an aging society: Analysis of older pedestrian crashes. J. Transp. Saf. Secur. 2019, 11, 323–332. [Google Scholar] [CrossRef]
- Ulfarsson, G.F.; Kim, S.; Booth, K.M. Analyzing fault in pedestrian–motor vehicle crashes in North Carolina. Accid. Anal. Prev. 2010, 42, 1805–1813. [Google Scholar] [CrossRef] [PubMed]
- Tay, R.; Choi, J.; Kattan, L.; Khan, A. A multinomial logit model of pedestrian–vehicle crash severity. Int. J. Sustain. Transp. 2011, 5, 233–249. [Google Scholar] [CrossRef]
- Zhou, Z.-P.; Liu, Y.-S.; Wang, W.; Zhang, Y. Multinomial logit model of pedestrian crossing behaviors at signalized intersections. Discret. Dyn. Nat. Soc. 2013, 2013, 172726. [Google Scholar] [CrossRef]
- Chen, Z.; Fan, W. Modeling pedestrian injury severity in pedestrian-vehicle crashes in rural and urban areas: Mixed logit model approach. Transp. Res. Rec. 2019, 2673, 1023–1034. [Google Scholar] [CrossRef]
- Kim, J.-K.; Ulfarsson, G.F.; Shankar, V.N.; Mannering, F.L. A note on modeling pedestrian-injury severity in motor-vehicle crashes with the mixed logit model. Accid. Anal. Prev. 2010, 42, 1751–1758. [Google Scholar] [CrossRef]
- Haleem, K.; Alluri, P.; Gan, A. Analyzing pedestrian crash injury severity at signalized and non-signalized locations. Accid. Anal. Prev. 2015, 81, 14–23. [Google Scholar] [CrossRef]
- Tulu, G.S.; Washington, S.; Haque, M.M.; King, M.J. Injury severity of pedestrians involved in road traffic crashes in Addis Ababa, Ethiopia. J. Transp. Saf. Secur. 2017, 9, 47–66. [Google Scholar] [CrossRef]
- Rifaat, S.M.; Tay, R.; de Barros, A. Urban street pattern and pedestrian traffic safety. J. Urban Des. 2012, 17, 337–352. [Google Scholar] [CrossRef]
- Sasidharan, L.; Menéndez, M. Partial proportional odds model—An alternate choice for analyzing pedestrian crash injury severities. Accid. Anal. Prev. 2014, 72, 330–340. [Google Scholar] [CrossRef] [PubMed]
- Pour, A.T.; Moridpour, S.; Tay, R.; Rajabifard, A. A partial proportional odds model for pedestrian crashes at mid-blocks in Melbourne metropolitan area. In MATEC Web of Conferences; EDP Sciences: Paris, France, 2016; p. 02020. [Google Scholar]
- Li, Y.; Fan, W.D. Modelling severity of pedestrian-injury in pedestrian-vehicle crashes with latent class clustering and partial proportional odds model: A case study of North Carolina. Accid. Anal. Prev. 2019, 131, 284–296. [Google Scholar] [CrossRef]
- Li, Y.; Fan, W. Pedestrian injury severities in pedestrian-vehicle crashes and the partial proportional odds logit model: Accounting for age difference. Transp. Res. Rec. 2019, 2673, 731–746. [Google Scholar] [CrossRef]
- Chang, L.-Y.; Chen, W.-C. Data mining of tree-based models to analyze freeway accident frequency. J. Saf. Res. 2005, 36, 365–375. [Google Scholar] [CrossRef]
- Gong, Y.; Abdel-Aty, M.; Cai, Q.; Rahman, M.S. A decentralized network level adaptive signal control algorithm by deep reinforcement learning. In Proceedings of the Transportation Research Board 98th Annual Meeting, Washington, DC, USA, 13–17 January 2019. [Google Scholar]
- Zhu, S.Y. Analyse vehicle-pedestrian crash severity at intersection with data mining techniques. Int. J. Crashworth. 2021, 9. [Google Scholar] [CrossRef]
- Das, S.; Le, M.; Dai, B.Y. Application of machine learning tools in classifying pedestrian crash types: A case study. Transp. Saf. Environ. 2020, 2, 106–119. [Google Scholar] [CrossRef]
- Ding, C.; Chen, P.; Jiao, J.F. Non-linear effects of the built environment on automobile-involved pedestrian crash frequency: A machine learning approach. Accid. Anal. Prev. 2018, 112, 116–126. [Google Scholar] [CrossRef]
- Guo, M.; Yuan, Z.; Janson, B.; Peng, Y.; Yang, Y.; Wang, W. Older pedestrian traffic crashes severity analysis based on an emerging machine learning XGBoost. Sustainability 2021, 13, 926. [Google Scholar] [CrossRef]
- Mokhtarimousavi, S. A Time of Day Analysis of Pedestrian-Involved Crashes in California: Investigation of Injury Severity, a Logistic Regression and Machine Learning Approach Using HSIS Data. ITE J.-Inst. Transp. Eng. 2019, 89, 25–33. [Google Scholar]
- Pour, A.T.; Moridpour, S.; Rajabifard, A.; Tay, R. Spatial and temporal distribution of pedestrian crashes in Melbourne metropolitan area. Road Transp. Res. 2017, 26, 4–20. [Google Scholar]
- Rahimi, A.; Azimi, G.; Asgari, H.; Jin, X. Injury severity of pedestrian and bicyclist crashes involving large trucks. In Proceedings of the ASCE International Conference on Transportation and Development (ASCE ICTD), Seattle, WA, USA, 26–29 May 2020; pp. 110–122. [Google Scholar]
- Saha, D.; Dumbaugh, E. Use of a model-based gradient boosting framework to assess spatial and non-linear effects of variables on pedestrian crash frequency at macro-level. J. Transp. Saf. Secur. 2021, 32, 1419–1450. [Google Scholar] [CrossRef]
- Tao, W.; Aghaabbasi, M.; Ali, M.; Almaliki, A.H.; Zainol, R.; Almaliki, A.A.; Hussein, E.E. An Advanced Machine Learning Approach to Predicting Pedestrian Fatality Caused by Road Crashes: A Step toward Sustainable Pedestrian Safety. Sustainability 2022, 14, 2436. [Google Scholar] [CrossRef]
- Zhu, R.; Guo, Y.; Xue, J.-H. Adjusting the imbalance ratio by the dimensionality of imbalanced data. Pattern Recognit. Lett. 2020, 133, 217–223. [Google Scholar] [CrossRef]
- Verron, S.; Tiplica, T.; Kobi, A. Fault detection and identification with a new feature selection based on mutual information. J. Process Control 2008, 18, 479–490. [Google Scholar] [CrossRef] [Green Version]
- Wali, B.; Khattak, A.J.; Ahmad, N. Injury severity analysis of pedestrian and bicyclist trespassing crashes at non-crossings: A hybrid predictive text analytics and heterogeneity-based statistical modeling approach. Accid. Anal. Prev. 2021, 150, 16. [Google Scholar] [CrossRef]
- Xie, W.; Nie, W.; Saffari, P.; Robledo, L.F.; Descote, P.-Y.; Jian, W. Landslide hazard assessment based on Bayesian optimization–support vector machine in Nanping City, China. Nat. Hazards 2021, 109, 931–948. [Google Scholar] [CrossRef]
- Alajmi, M.S.; Almeshal, A.M. Estimation and optimization of tool wear in conventional turning of 709M40 alloy steel using support vector machine (SVM) with Bayesian optimization. Materials 2021, 14, 3773. [Google Scholar] [CrossRef]
- Pandey, P.; Bandhu, K.C. A credit risk assessment on borrowers classification using optimized decision tree and KNN with bayesian optimization. Int. J. Inf. Technol. 2022, 1–11. [Google Scholar] [CrossRef]
- Xia, Y.; Liu, C.; Li, Y.; Liu, N. A boosted decision tree approach using Bayesian hyper-parameter optimization for credit scoring. Expert Syst. Appl. 2017, 78, 225–241. [Google Scholar] [CrossRef]
- Xu, H.; Lu, C.; Berendt, R.; Jha, N.; Mandal, M. Automated analysis and classification of melanocytic tumor on skin whole slide images. Comput. Med. Imaging Graph. 2018, 66, 124–134. [Google Scholar] [CrossRef]
- Xu, H.; Park, S.; Hwang, T.H. Computerized classification of prostate cancer gleason scores from whole slide images. IEEE/ACM Trans. Comput. Biol. Bioinform. 2019, 17, 1871–1882. [Google Scholar] [CrossRef] [PubMed]
- Rashedi, E.; Nezamabadi-Pour, H.; Saryazdi, S. GSA: A gravitational search algorithm. Inf. Sci. 2009, 179, 2232–2248. [Google Scholar] [CrossRef]
- Abdel-Basset, M.; Shawky, L.A. Flower pollination algorithm: A comprehensive review. Artif. Intell. Rev. 2019, 52, 2533–2557. [Google Scholar] [CrossRef]
- Oxley, J.; Whelan, M. It cannot be all about safety: The benefits of prolonged mobility. Traffic Inj. Prev. 2008, 9, 367–378. [Google Scholar] [CrossRef]
- Onieva-García, M.Á.; Martínez-Ruiz, V.; Lardelli-Claret, P.; Jiménez-Moleón, J.J.; Amezcua-Prieto, C.; de Dios Luna-del-Castillo, J.; Jiménez-Mejías, E. Gender and age differences in components of traffic-related pedestrian death rates: Exposure, risk of crash and fatality rate. Inj. Epidemiol. 2016, 3, 14. [Google Scholar] [CrossRef] [Green Version]
- Toran Pour, A.; Moridpour, S.; Tay, R.; Rajabifard, A. Influence of pedestrian age and gender on spatial and temporal distribution of pedestrian crashes. Traffic Inj. Prev. 2018, 19, 81–87. [Google Scholar] [CrossRef]
- Aarts, L.; Van Schagen, I. Driving speed and the risk of road crashes: A review. Accid. Anal. Prev. 2006, 38, 215–224. [Google Scholar] [CrossRef]
- Park, H.-C.; Joo, Y.-J.; Kho, S.-Y.; Kim, D.-K.; Park, B.-J. Injury severity of bus–pedestrian crashes in South Korea considering the effects of regional and company factors. Sustainability 2019, 11, 3169. [Google Scholar] [CrossRef] [Green Version]
- Li, P.; Abdel-Aty, M.; Yuan, J. Using bus critical driving events as surrogate safety measures for pedestrian and bicycle crashes based on GPS trajectory data. Accid. Anal. Prev. 2021, 150, 105924. [Google Scholar] [CrossRef]


| Study | Study Objective | ML Technique Used |
|---|---|---|
| Das, et al. [42] | Use ML techniques to categorize crash types based on unstructured textual inputs. | random forest, support vector machines, extreme gradient boosting |
| Ding, et al. [43] | In order to provide an alternative viewpoint on the consequences of pedestrian accidents. | multiple additive Poisson regression trees |
| Guo, et al. [44] | For the purpose of emulating the difficulty in determining severity levels in earlier pedestrian traffic accidents. | extreme gradient boosting |
| Mokhtarimousavi [45] | The goal is to estimate the extent of injury to pedestrians in an accident. | support vector machines, multinomial logit model |
| Pour, et al. [46] | To find out whether the severity of vehicle–pedestrian accidents is affected by factors such as time, location, and individual characteristics. | decision tree, kernel density estimation (no report) |
| Rahimi, et al. [47] | To find trends in pedestrian/bike fatalities caused by large trucks. | random forest, decision tree |
| Saha and Dumbaugh [48] | To examine the correlations between built environment factors and pedestrian accident rates at the census-block-group level. | gradient boosting, decision tree, generalized additive model |
| Tao, et al. [49] | To assess the feasibility of the use of Bayesian neural networks to predict pedestrian related crashes in Australia. | Bayesian neural networks |
| Zhu [41] | To investigate the factors that contribute to the intensity of pedestrian–vehicle incidents at crossings. | classification and regression trees, gradient boosting, random forest, artificial neural network, support vector machines |
| Variable and Sub-Variable | Description | Value |
|---|---|---|
| Age | Person’s age | 1–101 |
| Gender | Person’s sex | (1) Male, (2) female |
| Month | The month in which the crash occurred | 1–12 |
| Day of week | When the crash occurred: this value indicates whether it was a weekday or a weekend. | (0) Weekend, (1) weekday |
| Time of day | When the crash occurred: this value indicates whether it was during the day or at nighttime. | (0) Night, (1) day |
| Christmas Period | Indicates whether the accident occurred during the 12-day period beginning on 23 December. | (0) Yes, (1) no |
| Easter Period | If the accident occurred within 5 days of Good Friday, it is indicated. | (0) Yes, (1) no |
| Speed limit | The posted speed limit in the area where the accident occurred. | 10–130 km |
| National Road Type | (0) Access road, (2) pedestrian thoroughfare, (3) undetermined, (4) access road, (5) local road, (6) national or state highway, (7) arterial road, (8) collector road, (9) sub-arterial road | |
| Crash Type | Number of cars involved | (0) Multiple, (1) single |
| Bus involvement | This clearly indicates that a bus was a factor in the collision. | (1) Yes, (2) no |
| Heavy Rigid Truck Involvement | Reveals that the crash was caused by a large rigid truck. | (0) Yes, (2) no |
| Road User * | Road user kind of fatality. | (0) Non-pedestrian, (1) pedestrian |
| Hyperparameter | Description | Search Range | Optimized Value |
|---|---|---|---|
| Ensemble method | The regressor’s ensemble architecture | Bag, GentleBoost, LogitBoost, AdaBoost, RUSBoost | AdaBoost |
| Maximum number of splits | Number of possible splits in a decision | 1–799 | 6 |
| Number of learners | Number of base learners | 10–500 | 22 |
| Learning rate | Learning rate for reduction | 0.001–1 | 0.209 |
| Hyperparameter | Description | Search Range | Optimized Value |
|---|---|---|---|
| Kernel function | The kind of kernel function utilized in the conversion. | Gaussian, linear, quadratic, cubic | Cubic |
| Box constraint level (C) | Maximize the margin at the expense of as little training error as possible. | 0.001–1000 | 0.0152 |
| Multiclass method | Developing binary classifiers that discriminate between one label and the rest (one-versus-all) or between every pair of classifications (one-versus-one). | One-vs-all, one-vs-one | One-vs.-all |
| Hyperparameter | Description | Search Range | Optimized Value |
|---|---|---|---|
| Number of neighbours (K) | The number of nearest neighbors to include in the majority of the voting process. | 1–400 | 22 |
| Distance metric | In computing the degree of similarity between two sets of data, a distance metric is used. | City block, Chebyshev, Correlation, Cosine, Euclidean, Hamming, Jaccard, Mahalanobis, Minkowski, Spearman | Spearman |
| Distance weight | To classify an object, it sets the maximum number of neighbors that must be surveyed. | Equal, inverse, squared inverse | Equal |
| Standard Models | Optimized Models | Changes (%) | |||||||||
|---|---|---|---|---|---|---|---|---|---|---|---|
| Accuracy (%) | Boosted DT | Bagged DT | SVM | KNN | DT | SVM | KNN | DT | SVM | KNN | |
| Train | 87 | 87.6 | 83 | 82.4 | 88.4 | 88.4 | 87.6 | +0.8/+1.4 | +5.4 | +5.2 | |
| Test | 86.5 | 86.5 | 83 | 73.5 | 87 | 86 | 84.5 | +0.5 | +3 | +11 | |
Publisher’s Note: MDPI stays neutral with regard to jurisdictional claims in published maps and institutional affiliations. |
© 2022 by the authors. Licensee MDPI, Basel, Switzerland. This article is an open access article distributed under the terms and conditions of the Creative Commons Attribution (CC BY) license (https://creativecommons.org/licenses/by/4.0/).
Share and Cite
Yang, L.; Aghaabbasi, M.; Ali, M.; Jan, A.; Bouallegue, B.; Javed, M.F.; Salem, N.M. Comparative Analysis of the Optimized KNN, SVM, and Ensemble DT Models Using Bayesian Optimization for Predicting Pedestrian Fatalities: An Advance towards Realizing the Sustainable Safety of Pedestrians. Sustainability 2022, 14, 10467. https://doi.org/10.3390/su141710467
Yang L, Aghaabbasi M, Ali M, Jan A, Bouallegue B, Javed MF, Salem NM. Comparative Analysis of the Optimized KNN, SVM, and Ensemble DT Models Using Bayesian Optimization for Predicting Pedestrian Fatalities: An Advance towards Realizing the Sustainable Safety of Pedestrians. Sustainability. 2022; 14(17):10467. https://doi.org/10.3390/su141710467
Chicago/Turabian StyleYang, Lei, Mahdi Aghaabbasi, Mujahid Ali, Amin Jan, Belgacem Bouallegue, Muhammad Faisal Javed, and Nermin M. Salem. 2022. "Comparative Analysis of the Optimized KNN, SVM, and Ensemble DT Models Using Bayesian Optimization for Predicting Pedestrian Fatalities: An Advance towards Realizing the Sustainable Safety of Pedestrians" Sustainability 14, no. 17: 10467. https://doi.org/10.3390/su141710467