Abstract
This study examines microstructural modification as an effective strategy for reducing corrosion and its impact on the mechanical properties of mild steel. The effect of heat treatment on morphology, strength, toughness, and ductility was studied using optical microscopy, SEM, Scherrer equation, Vickers’s hardness test, and tensile-strength measurement. The heat treatment changed the microstructures, grain sizes, and particle sizes of the samples. It also increased the material strength by 56% and 25% for the quenched and tempered samples, respectively. The hardness was increased to 95% by quenching. The effect of the microstructural changes on the corrosion rate in chlorine-rich and chlorine-free media at different pH was studied using linear-polarization-resistance and dynamic-polarization-resistance methods. In both media, the quenched samples showed a lower corrosion rate compared to the original and tempered samples. The heat treatment resulted in the formation of homogenous martensite with coarse grains and small particle sizes that seemed to reduce the corrosion rate significantly. It also had an impact on the corrosion mechanism of these materials. The original and tempered samples showed pitting-corrosion behavior with high corrosion rates, while the quenched samples were more susceptible to intergranular corrosion. The rate of corrosion was investigated further at different pH, and it was shown to decrease when the pH was raised. This study confirms the impact of microstructural changes on the corrosion behavior of S275 structural steel.
1. Introduction
Corrosion is the degradation of metallic structures and pipes, leading to significant environmental and economic losses. Chemical processing plants, water-treatment facilities, the oil and gas industry, and power plants are affected by the detrimental effects of corrosion. External corrosion can be caused by different environments, such as seawater and industrial chemicals, while internal corrosion can occur through the presence of different chemical solvents []. Corrosion is an electrochemical process that is affected by three components. The anode that represents the corroding metal, the electrolyte that transfers electrons from the anode to the cathode, and the cathode, which is the electrical conductor.
The impact of chloride on corrosion, where it penetrates the imperfection and begins the process of pit initiation, has been studied by various researchers [,,,]. The presence of sulphur, organic or inorganic acids, nitrogen, etc., in the environment can increase corrosion []. Corrosive damage usually begins at the surface of a material []. A case study conducted by the US federal highway administration under the initiative of NACE (National Association of Corrosion Engineers) found that oil and gas and their subsidiaries are the industries that are the most affected by corrosion []. NACE have demonstrated the extensive economic and environmental impact of corrosion [,]. The detrimental effects can be controlled to an extent by employing different methods and strategies [,].
Steel is the most heavily used metal in the 21st century. Its low cost and ease of manipulation makes it an attractive candidate for different industries. Steel is an iron–carbon composite, with different percentages of carbon and other additives giving it specific properties. It can be categorized as low-, medium-, and high-carbon steel [,,]. Low-carbon steel has a carbon content of less than 0.25 wt.%, and it is the most heavily produced steel per year [,]. Due to its extensive usage in construction, structures, and automotive components, the research on low-carbon steel is thorough []. However, this type of steel is extremely vulnerable to corrosion. Even though more advanced materials with improved corrosion resistance are discovered every day, steel continues to be the most common material found in industry. Since heat treatment significantly affects the corrosion behavior of a material, it is essential to study the corrosion resistance of a material with respect to microstructural changes in order to enable informed decisions while using heat treatment as a method to make materials more appropriate in particular applications [].
Forms of hot deformation, such as forging, rolling etc., are performed in low-carbon steels to achieve desired mechanical properties. High energy consumption, difficult production procedures, cost, etc., are the drawbacks of these processes []. Heat treatment is a direct surface modification that improves the material’s mechanical properties and microstructure with low-cost processing [,]. It affects the electrochemical properties through microstructural transformation [] without changing the chemical structure or inflicting higher costs []. Heat treatment causes an increase in materials’ strength, ductility, and toughness [,,]. Senthilkumar et al. and Odusote et al. [,] used different types of heat treatment to increase materials’ strength and elongation. Jamiu et al. [] studied the difference in mechanical properties using water and palm oil as the cooling medium. Controlled cooling was observed for the palm oil, which gave better ductility, whereas better strength and hardness were observed for water-cooled samples []. Savas et al. [] observed water-quenched material to have better corrosion resistance than air- and vacuum-furnace-cooled AISI 440C stainless steel heat treated at 900 °C. Cyclic heat treatment and its effect was studied by Saha et al. [] by holding the samples at particular temperatures for repeated short time periods. It increased the spheroidization process, which increased the strength and ductility of the material. Heat treatment sometimes increases corrosion, as can be observed from the high corrosion in welded areas [,]. Ghorbani et al. [] observed that, performing heat treatment in post-weld austenitic and ferritic stainless steel up to 960 °C decreased corrosion resistance with increased temperature.
Steel is commonly used in high-salinity, high-humidity, and microorganism-rich environments. This causes a change in pH. The rate of corrosion is strongly influenced by the solubility or stability of corrosion products, such as oxides, hydroxides, oxyhydroxides, etc., which are themselves affected by the pH of the medium [,,]. Soil, in which the pipes are usually buried, can cause acidic attacks, which increases corrosion behavior []. Chung et al. [] studied the effect of chloride, sulphate, and pH on the corrosion of steel pipes using a statistical model and found all the factors caused an increase in corrosion. Abdo et al. [] studied the corrosion behavior of duplex steel in different mediums and at different pH, and the corrosion resistance increased with increasing pH. Different steels show varying corrosion behavior in changing pH, and the effect needs to be analyzed in lieu of microstructure []. This strongly indicates the influence of H+ ions on cathodic reactions, and acidic environments are extremely detrimental to metal surfaces.
In this study, we used S275 structural steel to study the effect of heat treatment and different electrolytes and pH on the corrosion behavior of S275 mild steel. It is a European-grade structural steel used for its good machinability and welding properties in industries such as oil and gas, mining, power plants, and drilling rigs []. Corrosion in these steels can cause reductions in tensile strength, yield strength, and ductility, which affect the service life and structural integrity []. To our best knowledge, this is the first study to have been conducted on the corrosion properties of S275 steel. Two types of heat treatment were used for modifying the S275 steel microstructure. We chose the better-performing heat treatment in terms of mechanical properties for the corrosion studies. The experiments were conducted in chorine and sulphate media under different pH. The microstructure, mechanical properties, effect of acidity, mechanism of corrosion behavior, and effect of electrolyte media are clearly outlined. It is an attempt to quantify the impact of corrosion on mild steel structures to ensure increased lifetime and strength.
2. Materials and Methods
2.1. Material
Chemical composition of S275 mild steel is given in Table 1. Its tensile strength, yield strength, and elongation are, at a minimum, 410 MPa, 275 MPa, and 22%, respectively. The samples have dimensions of 2 cm × 1 cm × 4 mm. For grinding and polishing the samples, abrasive surfaces (MD-Primo 220, MD-Allegro, MD-Mol and MD-Chem) were used with abrasive lubricants (Diapro Largo, Diapro Mol, and OP-S Suspension) with 9-nanometer, 3-nanometer, and 1-nanometer abrasive particles. Concentrations of 3.5% NaCl and 3.5% Na2SO4 in 600 mL of DI water were used to make chlorine-rich and chlorine-free electrolytes. An organic acid and an alkali were employed to create an acidic and alkaline environment in our electrolyte solution. The alkali utilized was a 0.2 M NaOH solution, while the organic acid was 5% glacial acetic acid. The impact of the pH was studied by adding acetic acid and sodium hydroxide solution drop by drop until the desired pH was reached.

Table 1.
Chemical composition of S275.
2.2. Heat Treatment
An appropriate heat treatment was chosen based on the iron–carbon equilibrium and isothermal transformation diagrams to improve the mechanical properties by changing the microstructure of the material. Two heat treatments (HT1, and HT2) were applied, as shown in Figure 1. In the first heat-treatment procedure (HT1), the material temperature was increased up to 600 °C at a rate of 10 °C/min and kept for a dwell period of 30 min. Next, the material was heated above the eutectoid temperature of 1000 °C for austenitizing at the same heating rate and a dwell period of 45 min. It was quenched to room temperature using a water bath for diffusion-less microstructural changes to increase material’s hardness. Some of the materials were further tempered by heating up to 600 °C at a rate of 10 °C/min and a dwell period of 30 min. They were air-cooled to room temperature to restore their ductility and toughness of the material.
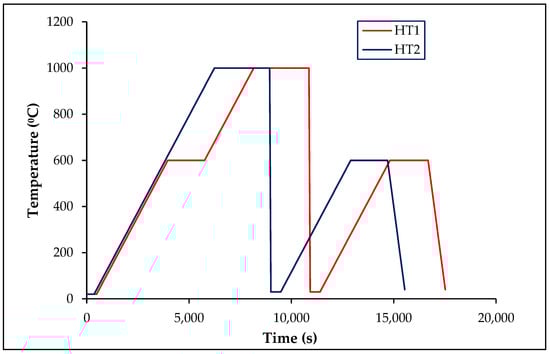
Figure 1.
Heat-treatment processes: HT1 and HT2.
In the second heat-treatment procedure (HT2), the material was heated to 1000 °C without a dwell time at 600 °C. The rest of the process was similar to HT1. The samples were quenched at room temperature using a water bath, and they were tempered by heating to 600 °C with a dwell period of 30 min. They were then air-cooled before use in experiments. The samples were labeled depending on the completed heat treatment process as follows: O, Q, and T for untreated (original), heat treated after quenching, and heat treated after tempering, respectively.
2.3. Sample Preparations
After heat treatment and cutting into appropriate shapes, the samples’ surfaces were ground and polished. Four stages of surface treatment with different abrasive surfaces were performed to attain different grinding and polishing stages. These were coarse and fine grinding, and rough and fine polishing (Table 2). After hardness test, the materials were etched using Nital solution (5% HNO3 + 95% Ethanol) for 10 s followed by water and ethanol washing. The samples were used to observe the microstructure under an optical microscope.
Table 2.
Grinding and polishing parameters.
2.4. Mechanical Testing
Tensile test specimens were prepared using ASTM A370 and ASTM E8 standards, as shown in Figure 2. Testing was conducted in MTS Alliance RF/150. An extensometer was connected to obtain the exact stress–strain measurements. The extension was controlled at a rate of 5 mm/min according to the standard. MTS TestWorks software was used for acquiring and analyzing data. After fine polishing, Vickers hardness test was performed to compare the effect of heat treatment on material’s localized force resistance. It was used to obtain hardness of the samples. HV5 Vickers hardness indenter was used to apply 5 kgf on the polished surface.
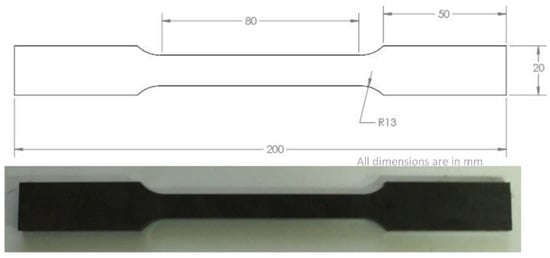
Figure 2.
Tensile testing sample.
2.5. Electrochemical Testing
Open-Circuit Potential (OCP) or Corrosion Potential, Linear Polarization Resistance (LPR), and Dynamic Polarization Resistance (TAFEL) methods were used to obtain the electrochemical data. The electrochemical analysis was conducted using a BioLogic VMP 300 potentiostat in a three-electrode chemical cell, as shown in Figure 3. The counter electrode was platinum, reference electrode was Ag/AgCl, and the working electrode was the sample.
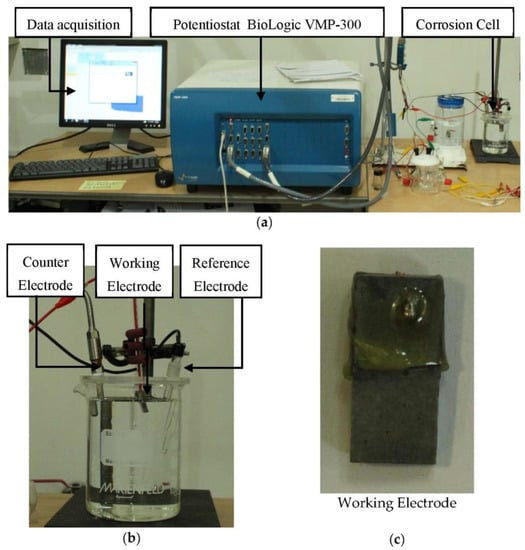
Figure 3.
Tensile testing sample (a) experimental apparatus, (b) corrosion cell, and (c) test sample with exposed area of 1 cm2.
EC-Lab software was used for data acquisition and analysis. OCP was conducted for 1 h before each experiment to make the system stable, as all the readings were made with respect to OCP value. LPR and Tafel measurements were conducted after OCP. LPR measurements were performed with a scan rate of 0.166 mV/s in voltage range of ±20 mV, whereas Tafel was conducted with a scan rate of 1 mV/s and voltage range of ± 0.8 V. The selection of voltage range was based on the pretesting conducted on the material. EC Lab software was used to fit the obtained curve based on Stern Geary formula, as given in Equation (1).
where Rp is the polarization resistance and Icorr is the current density. B is the constant, which is calculated from Equation (2), where βa and βb are the anodic and cathodic constants.
The corrosion rate is then calculated from Equation (3), where K is a constant that gives the unit for corrosion rate, Ew is the equivalent weight, D is the density, and A is the area of the test sample.
2.6. Microstructural Analysis
The microstructures and surfaces of O, Q, and T samples were analyzed by Olympus BX51M optical microscope and FEI-scanning electron microscope (SEM) before and after exposure to corrosive environments. SEM characterization was used to determine the surface properties of the material. EDS measurements were obtained for analyzing the composition of corroded surface. All these tests were carried out after the completion of electrochemical tests to study the effect of corrosion. To determine the effect of heat treatment on the particle size, Empyrean XRD was used with Scherer equation [].
3. Results
3.1. Mechanical Testing
3.1.1. Hardness Test and Microstructural Characterization
Following the heat-treatment procedures (HT1, and HT2), the microstructure and the hardness values were obtained for the original (O), quenched (Q), and tempered (T) samples.
Figure 4a–c presents microstructural images of the O, Q, and T samples of HT1 before corrosion. In the original sample, pearlite grains (dark regions) were homogeneously distributed between large ferrite regions (light regions) []. Unstable austenite was transformed to martensite by quenching. However, full transformation was not observed due to the presence of 0.03% Si in the sample []. All martensite regions were transformed to tempered martensite after tempering. New ferrite + pearlite grains grew in the martensite regions in elevated temperatures lower than the austenitizing temperature. This caused a decrease in hard-martensite regions and an increase in soft ferrite + pearlite regions. The quenching resulted in greater hardness and strength, and lower ductility, by reducing the grain size and martensite transformation of ferrite + pearlite. To restore the ductility and toughness of the material, the tempering formed new soft grains in the hard-martensite regions. However, this caused a reduction in hardness and strength. The ferrite and pearlite showed a polygonal structure in the tempered sample. As the grain size increased, the hardness decreased, so the quenched samples had a smaller grain size but greater hardness, whereas the tempered samples had a larger grain size but lower hardness.
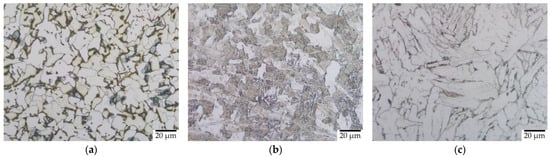
Figure 4.
Microstructure of (a) original (O), (b) quenched (Q), and (c) tempered (T) samples by HT1.
Figure 5a–c gives the microstructural images of the O, Q, and T samples of HT2 before corrosion. The quenching lead to the formation of heterogeneously distributed martensitic grains with retained austenite []. The samples underwent a polymorphic transformation [] that formed martensite laths parallel to each other in varying orientations. The tempering resulted in forming tempered martensite with some ferrite in the microstructure. The martensitic regions were more dominant in the tempered sample. Cementite and ferrite regions were formed as small strips between the martensite regions as it is difficult to form new regions freely in hard martensite. The semi-step in HT1 created bigger and more stress-free grains in the tempered samples, while the effect was not as significant in the quenched samples.
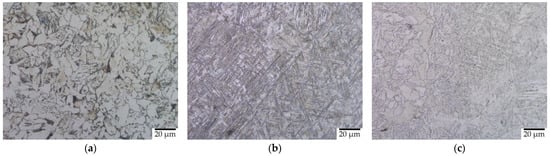
Figure 5.
Microstructure of (a) original (O), (b) quenched (Q), and (c) tempered (T) samples by HT2.
The Vickers hardness test, HV5, was repeated three times for each sample, as shown in Table 3, and the effect of the heat treatment on the hardness was evaluated. The hardness of the original samples were increased by 26% and 95% by quenching in both HT1 and HT2, while it dropped by 20% in HT1 and 62% in HT2 by tempering. As corrosion resistance is related to surface hardness, the second heat treatment (HT2) was selected as an effective method to improve the corrosion resistance of the material, and only these samples were tested in the following sections.
Table 3.
Hardness test results for original, quenched, and tempered samples for heat-treatment procedures.
3.1.2. Tensile Test
The mechanical properties of the original (O), quenched (Q), and tempered (T) samples were determined using tensile testing. The test was repeated five times and the average values are given in Figure 6.
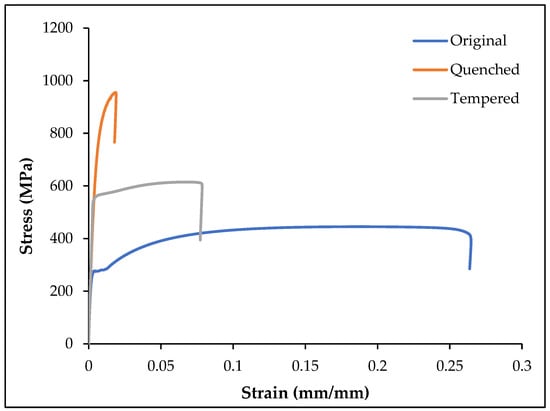
Figure 6.
The engineering stress–strain curves for original, quenched, and tempered samples.
Figure 6 shows the stress–strain curve for the O, Q, and T samples. As shown in Figure 6, the tensile and yield strength increased and the ductility reduced with heat treatment. The quenched samples had high tensile strength and low ductility, whereas the tempered samples had low tensile strength and high ductility. The tensile strength was the lowest in original sample with high ductility. As shown in Table 4, it was observed that the Young’s moduli of the different samples remained the same, irrespective of the different kinds of heat treatment applied.
Table 4.
Mechanical properties of original, quenched, and tempered samples.
The average tensile strength (σmax), Young’s modulus (E, slope of the linear elastic region), yield strength (σy, based on 0.2% offset method), fracture strength (σf), and fracture strain (εf) with standard deviations are given for O, Q, and T in Table 4.
Table 5 gives the percentage change in the mechanical properties of O, Q, and T. The quenching improved most of the mechanical properties: the tensile strength, yield strength, and fracture strength were improved by 128.8%, 184.8%, and 246.3%, while the fracture strain reduced by 92.5%. When the tempered samples were compared to the quenched samples, the tensile strength, yield strength, and fracture strength were reduced by 41.4%, 30.9%, and 61.4% respectively, while the elongation was increased by 116.7%. The yield strength of the original sample was increased up to 96.9% by tempering, which also regained some of the lost ductility. The Young’s modulus of the original sample was improved by 12.6% by tempering after quenching.
Table 5.
Percentage changes in the material properties, featuring improvement (+) or deterioration (−).
3.2. Electrochemical Testing
3.2.1. Effect of pH in Cl Environment
The TAFEL curves from the electrochemical test conducted for the O, Q, and T samples at HT2 at pH 4, 7, and 10 are given in Figure 7a–c, respectively.
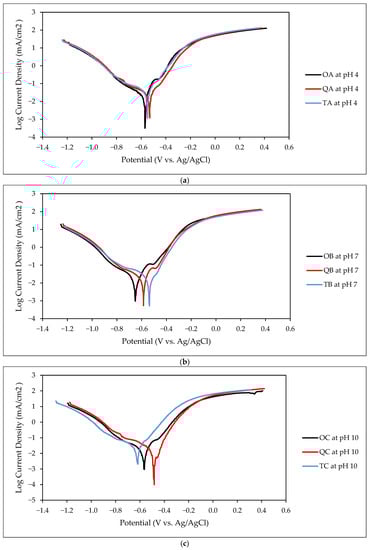
Figure 7.
TAFEL curve of O, Q, and T samples at (a) pH 4, (b) pH 7, and (c) pH 10 in Cl− environment.
The curves obtained from the electrochemical testing were used for TAFEL fit analysis and dynamic polarization data, as shown in Table 6.
Table 6.
Dynamic polarization data for O, Q, and T samples at pH 4, 7, and 10 in Cl− environment.
Compared to the quenched and tempered samples, the original samples showed intermediate CR. The highest CR, of 0.17 mm/yr (mmpy), was observed for the tempered samples at pH 4 with Rp of 438 Ω. The lowest CR, of 0.10 mmpy, was observed for the quenched samples, with a 28.6% reduction in CR and an 8% increase in Rp. A similar trend was observed for both pH 7 and pH 10. At pH 7, the tempered sample had a CR of 0.12 mmpy and Rp of 465 Ω. The lowest CR was observed for the quenched samples, with a 10% decrease in CR and 5% increase in Rp. Compared to the tempered samples, the original samples showed a 17% decrease in CR and a 3% increase in Rp. At pH 10, an 11% decrease in CR and a 5% increase in Rp were observed for the quenched samples. The tempered samples showed an 11% increase in CR and a 7.4% decrease in Rp compared to the original samples. Quenched samples have higher corrosion resistance and tempered samples have lower corrosion resistance throughout different pH. The difference in CR between the O, Q, and T reduces as the pH increases.
3.2.2. Effect of pH in Cl-Free Environment
The electrochemical test was conducted in 3.5% Na2SO4 electrolyte to study the effect of the Cl-free environment on the corrosion resistance of the O, Q, and T samples at different pH levels. The dynamic-polarization and linear-polarization data were obtained from Tafel and LPR measurements for all the samples at pH 4, 7, and 10, as shown in Figure 8.
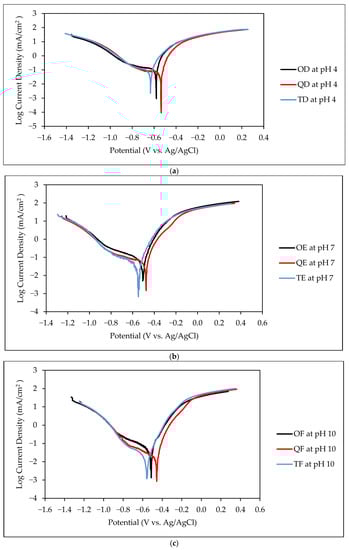
Figure 8.
TAFEL curve of O, Q, and T samples at (a) pH 4, (b) pH 7, and (c) pH 10 in Cl− free environment.
As shown in Table 7, a relationship can be deduced between the effect of heat treatment and pH on corrosion resistance. Across all the pHs, the quenched samples showed the most corrosion resistance, while the tempered samples showed the least corrosion resistance. In the case of Rp, the tempered samples showed the lowest values, while the quenched samples showed the highest values. The corrosion resistance also seems to have increased with increasing pH. The samples had the highest corrosion resistance in alkaline environments and the lowest corrosion resistance in acidic environments. The opposite was true for Rp. It was observed that in acidic, neutral, or alkaline environments, the tempered samples were more vulnerable to corrosion, and the quenched samples were least vulnerable to corrosion. This confirms that changes in microstructure using heat treatment influence corrosion resistance in mild steel.
Table 7.
Dynamic polarization data for O, Q, and T samples at pH 4, 7, and 10 in Cl−free environment.
3.3. Morphology and Microstructural Analysis
3.3.1. Optical Microscopy (OM)
Figure 9 shows the OM images of O, Q, and T in chlorine-rich environment at different pH before and after corrosion.
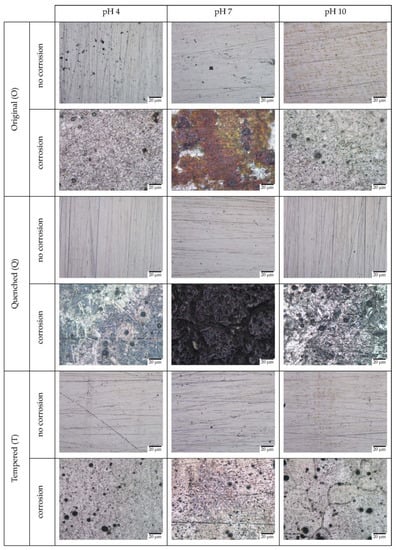
Figure 9.
OM images of O, Q, and T samples before and after corrosion in chlorine-rich environment at pH 4, 7, and 10.
The images show unambiguous evidence of distinct types of corrosion and corrosion products forming on the surface of the material across different pHs. The original sample showed the formation of uniform brown corrosion products at pH 7, while pit formation was observed at pH 4 and 10, with pH 4 having more pits. The quenched sample formed varying degrees of intergranular corrosion products across all pHs. The products formed were dark in color and at pH 4 and 10, there was a slight initiation of pitting corrosion. The tempered samples showed pitting corrosion across all pHs with the size of pits in pH 4 > pH 7 > pH 10. For all the samples, pH 7 seemed to have the lowest pitting corrosion.
Figure 10 shows the OM images of O, Q, and T in chlorine-free environments at different pH before and after corrosion.
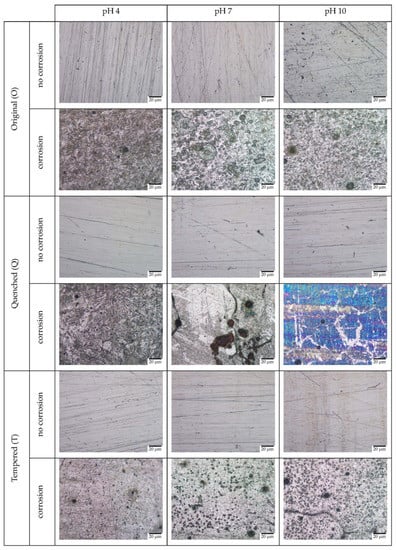
Figure 10.
OM images of O, Q, and T samples before and after corrosion in Cl-free environments at pH 4, 7, and 10.
Among the samples in the chlorine-free environment, the original samples showed a combination of uniform and pitting corrosion across all pHs. The smallest pits were observed for pH 4, with predominant uniform corrosion. The quenched samples showed characteristics of uniform, intergranular, and pitting corrosion across all pHs. At pH 4, few pits were formed after corrosion, with fine granular corrosion initiating at the surface. At pH 7 and 10, more granular corrosion was formed, with few pitting characteristics. For the tempered samples, pitting corrosion was observed across all pHs. With the increase in pH, the number and size of the pits increased. At pH 10, granular corrosion was initiated alongside the pitting.
3.3.2. SEM and EDS
SEM images of the O, Q, and T samples at pH 4, 7, and 10 are given in Figure 11.
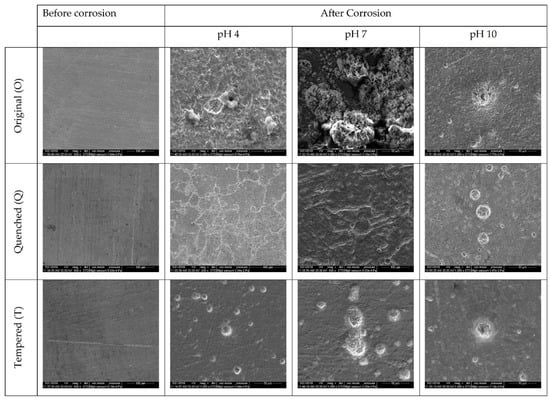
Figure 11.
SEM images of O, Q, and T samples before and after exposure to corrosive Cl-environments at pH 4, 7 and 10.
The SEM images supported the observations from the OM images in the case of both the chlorine-free and the chlorine-rich environment. A macroscopic image of the corrosion surface for all conditions is given in Figure S1 (Supplementary Material). In the case of chlorine-rich media, (Figure 11), the original samples showed localized pitting at pH 4 and pH 10 and uniform corrosion at pH 7, with the corrosion products uniformly distributed over the surface. The pits were formed due to the cathodic reaction to form iron chloride (FeCl3), which enhanced the reaction to synthesize iron oxyhydroxide (HFeO2). The pits formed at pH 4 had an average diameter of 2.5 µm, with a corrosion product flowing out of the pit covering an area of approximately 10 µm (Figure S2, Supplementary Material). The pits at pH 10 were larger, with diameters around 10 µm, with corrosion products spilling over around 30 µm (Figure S2). The quenched samples showed intergranular corrosion rather than pitting. Higher intergranular corrosion was observed for pH 4 and the lowest was observed for pH 10. Hydrogen atoms tended to attack the grain boundaries as the quenching increased the residual stress, causing corrosion to initiate at the boundaries. Therefore, the quenched samples were more susceptible to granular corrosion than pitting corrosion. Pitting corrosion was observed in all three samples, with pit sizes ranging from 20–24 µm. The pH of 4 had the greatest number of pits with diameters around 20 µm, while pH 10 had a smaller number of pits with a larger average diameter, of 25 µm (Figure S2).
In the case of the chlorine-free media (Figure 12), the original samples at pH 4 showed uniform corrosion, and the samples at pH 7 and 10 showed pitting corrosion. The average diameter of the pits in pH 7 was 14 µm, while at pH 10, it was 22 µm (Figure S2). The number of pits formed was also greater at pH 10, indicating a higher CR. The quenched samples at pH 7 and 10 showed intergranular corrosion. The tempered samples showed pitting corrosion across all pHs, and the number and size of the pits were larger in pH 10. The tempered samples at pH 4 showed pits of 16 µm, while at pH 7 and 10, the pits were larger, with diameters of approximately 25 µm (Figure S2).
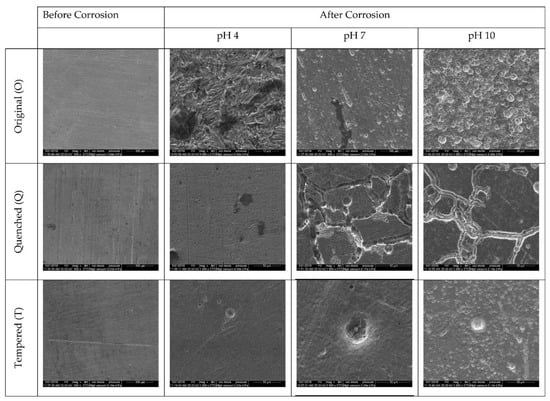
Figure 12.
SEM images of O, Q, and T samples before and after exposure to corrosive Cl-free environments at pH 4, 7, and 10.
The surface composition of the samples was analyzed using SEM-EDS, as shown in Table 8. Heat treatment increased the surface carbon content as the carbon moved towards the surface of the material, increasing in hardness and strength. This in turn reduced the iron content on the surface. The highest carbon content was observed for the quenched samples, resulting in high hardness and tensile strength. The corrosion products formed were iron oxyhydroxides. [,,]. The brown-colored corrosion product seen in the OM images is due to the presence of more iron on the surface. This was visible for the chlorine-rich electrolyte media.
Table 8.
SEM-EDS Analysis of O, Q, and T for Cl- rich and Cl- free environment.
For the original samples in chlorine-free media, corrosion products seemed to be nubbly like structure, compounds of iron and oxygen with traces of sodium and sulphur as studied by Tang et al. []. Quenched samples show a combination of uniform, intergranular and pitting corrosion at across all pHs. At pH 4, there was a high concentration of corrosion products containing iron as observed in EDS. At pH 7 and pH 10 carbon can be seen at the cracks due to the formation of iron sulphide at the grain boundaries which activates cracking on metal surface [,]. Iron sulphide is a black compound as seen in OM images. The initiation of granular corrosion can be attributed to either cathodic reactions causing the sulphide ions to become active or the presence of more carbon.
4. Discussion
4.1. Effect of Heat Treatment on Material’s Microstructure
Different heat treatments cause different mechanical enhancements as observed by different researchers [,,,,,]. In the original sample, the major phases observed were ferrite and pearlite. During quenching, the pearlite and ferrite transforms to martensite with smaller grain size arranged parallel in different orientations. This change in morphology has resulted in improved hardness and tensile strength while losing ductility. The tempering changed the crystal structure to tempered martensite that showed improved ductility with a slight loss of hardness and strength compared to quenched samples. Sudden cooling caused the formation of needle shaped martensitic structure which increased the strength but reduced the ductility as evidenced by SEM and OM []. Tempering caused the formation of tempered martensite with some δ-ferrite reducing strength and increasing ductility [,,]. The grain size of the samples were also affected by the heat treatment, as quenched samples showed homogenous arrangement of grains with smaller size compared to original and tempered samples. Heat treatment can also affect the size of material constituents, Using Scherrer formula [], particle size of the heat-treated samples was calculated. This was related to the material strength imparted by heat treatment and given in Figure 13. As the particle size reduces, strength increases.
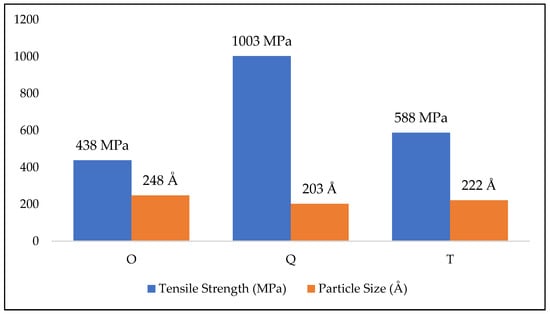
Figure 13.
Tensile strength vs. Particle size.
The particle size of original samples was 203 Å and quenching increased it by 22% and tempering reduced it by 8%. The material’s grain size also reduced as we moved from original to tempered to quenched samples. Quenched samples showed the lowest particle size and highest strength. The homogenous arrangement of smaller particles imparted strength to the material. All these factors are supposed to have a synergetic effect on the corrosion behavior of metals.
4.2. Effect of pH on Corrosion Rate
The pH has a significant influence on corrosion rate. Increase in pH can decrease corrosion rate [,,]. Figure 14 shows the corrosion rate of samples at different pHs. In both the electrolytic media, an increase in pH caused a decrease in corrosion rate. Alkaline environments seem to be more conducive for reducing corrosion. Across all heat treatment processes, the samples in pH 10 alkaline media showed significantly low corrosion rates. This phenomenon can be explained using the presence of H+ and OH− ions and the anodic and cathodic reactions that leads to corrosion. When the medium is acidic there are more H+ ions which increases the cathodic reaction. This causes higher corrosion at lower pH. When the pH is neutral or basic cathodic reaction creates more OH− ions that reduces the corrosion reaction at the anodic site []. Effect of pH was similar for both NaCl and Na2SO4 medium.
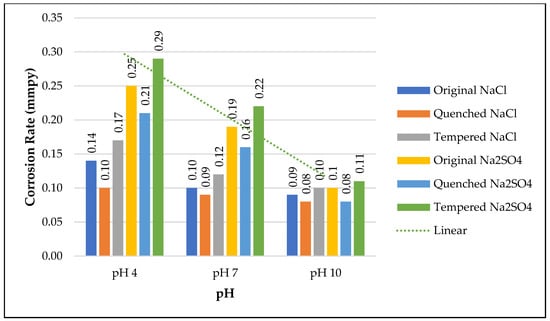
Figure 14.
Effect of pH on corrosion rate of O, Q, and T.
4.3. Effect of Heat Treatment on Corrosion Rate
Heat treatment is a metal-strengthening process that involves thermal diffusion and surface changes [,,,,,,]. As shown in Table 6 and Table 7 and Figure 15, the corrosion rate for Q is less than O and T. Q had closely packed martensite with small grain sizes that reduced corrosion. Homogeneous surfaces help to form protective layers that can reduce corrosion rates []. The highest corrosion rate was observed for T because of its non-homogenous morphology []. The presence of ferrite in T also increases the corrosion rate. The grain structure also plays a significant role in corrosion. When the grain structure is coarse, the corrosion rate is lower, and when it is fine, the corrosion rate is greater []. Q had a coarse grain structure and tempering caused the formation of a finer grain structure. The improved corrosion resistance in Q was due to the synergetic effect of the homogenous martensite and coarse grain structure.
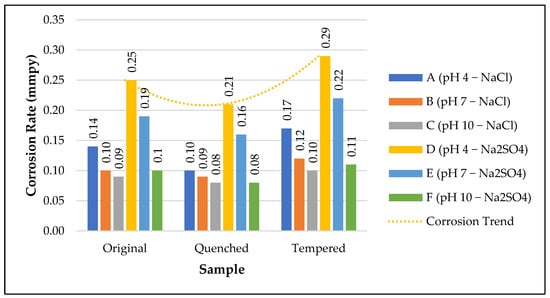
Figure 15.
Relation between O, Q, T vs. Corrosion Rate.
4.4. Effect of Cl− Environment
Corrosion occurs in metals through reaction of oxidation and reduction. Iron dissolves in an electrochemical reaction to form ferrous () and ferric () ions. is more reactive than []. The formation of these ions is an anodic reaction (Equation (4)) in the presence of oxygen. The cathodic reaction causes hydrogen evolution (Equation (5)). Anodic and cathodic reactions are directly proportional. When the pH was acidic, cathodic reaction in Equation (6) was observed. For basic and neutral solutions, the cathodic reaction shown in Equation (7) was observed [,].
NaCl(s) dissolves in distilled to water to form and ions. This ions react with the ferrous ions formed at the anodic site to form an iron-chloride complex, as shown in Equation (8).
The iron-chloride complex reacts with the ions to form ferrous oxide, which later oxidizes to form ferric oxide. These reactions are given in Equations (8)–(10) [].
The presence of NaOH resulted in the formation of a protective oxide layer Fe(OH)2 on the surface of our mild steel samples. When the solution is acidic, this oxide layer has less resistance to the ions and breaks the oxide layer to attack the metal surface []. This is due to the presence of more H+ ions than OH− ions []. As the pH value increases, the oxide-layer thickness also increases, which leads to a decrease in corrosion [,,].
Na2SO4 (s) dissolves in distilled water to form and . Iron dissolution is similar to Equation (4). If log [] < 2.25, then the reaction follows Equation (4), and if log [] > 2.25, then Equation (11) is followed [,].
The presence of sulphate ions increases the dissolution of mild steel to form Fe2+ ions, resulting in the formation of iron hydroxysulphate, which is a super-saturated non-protective layer formed in sulphate solutions [,]. The deposition of sulphates on the metallic parts is common when they are operated near marine environments, as in power plants or gas turbines [,]. A synergistic effect can be observed between sulfate and H2O + O2; they enhance the corrosion of metals in a similar way to that NaCl + H2O + O2. The presence of H2O causes the formation of FeSO4, which increases the chemical reactions during corrosion.
From Figure 16, it can be observed that the corrosion rate was higher for the Na2SO4 solution than for the NaCl. In Na2SO4, the oxide layer is unstable and the sulphate ions are more aggressive than the chloride ions []. From the potentiodynamic polarization curve given in Figure 7 and Figure 8, the dip formed by the oxide layer in chlorine media reduced the corrosion rate. No dip was observed in the case of the sulphate media. Oxide-layer formation is also related to ion concentration, as higher concentrations form thicker protective layers [].
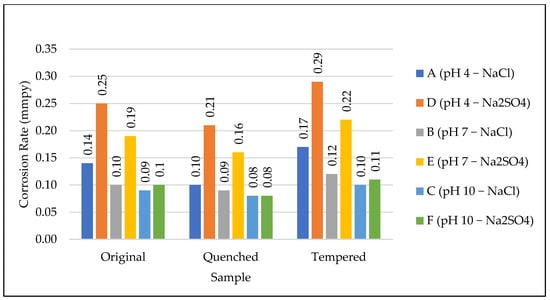
Figure 16.
O, Q, and T vs. corrosion rate for NaCl and Na2SO4.
5. Conclusions
This study analyzed the effect of heat treatments on the microstructure and the corrosion behavior of S275 mild steel in different chemical and acidic environments. Quenching and tempering were performed in two different heat-treatment cycles, and the mechanical behavior of the materials were analyzed. The quenching formed uniform martensite with small grain sizes, high hardness, strength, and low ductility. The tempering was able to regain some of the lost ductility by forming tempered martensite. Three different types of corrosion behavior were observed: uniform, pitting, and intergranular corrosion. The microstructure seems to have exerted a negligible influence on the corrosion behavior. Although the quenched samples showed the most corrosion resistance, the difference in the corrosion resistance was minimal for all the samples. Small particle sizes and small and homogenous grains along with martensite could have been the reason. However, the chemical medium and pH seemed to have an influence on the corrosion behavior. The samples in chlorine media in the alkaline environment showed the lowest corrosion. This was due to the formation of a stable passivation layer in the chlorine media. In the sulphate medium, the presence of FeSO4 increased the rate of corrosion. A decrease in pH caused an increase in corrosion because of the H+ ions in the cathodic reaction leading to corrosion. The findings from this study show that the corrosion behavior is dependent on the heat treatment and chemical environment of S275 steel. While heat treatment does not affect the corrosion rate significantly, it has an effect on the corrosion mechanism. The nature of the medium affects the mechanism of corrosion and the corrosion rate. These findings could be helpful in choosing appropriate conditions for controlling the corrosion behavior of S275 steel according to the corrosion medium.
Supplementary Materials
The following supporting information can be downloaded at: https://www.mdpi.com/article/10.3390/met12081386/s1, Figure S1: Macroscopic images of the corroded surface by SEM, Figure S2: SEM images of pits formed during corrosion.
Author Contributions
Conceptualization, S.P., L.J. and E.G.; methodology, S.P.; software, S.P.; validation, S.P. and L.J.; investigation, S.P.; resources, E.G.; writing—original draft preparation, S.P. and L.J.; writing—review and editing, N.V.; visualization, S.P.; supervision, E.G. and N.V.; All authors have read and agreed to the published version of the manuscript.
Funding
This research received no external funding.
Institutional Review Board Statement
Not applicable.
Informed Consent Statement
Not applicable.
Data Availability Statement
The data presented in this study are available on request from the corresponding author.
Conflicts of Interest
The authors declare no conflict of interest.
References
- Alabtah, F.G.; Mahdi, E.; Khraisheh, M. External Corrosion Behavior of Steel/GFRP Composite Pipes in Harsh Conditions. Materials 2021, 14, 6501. [Google Scholar] [CrossRef] [PubMed]
- Parapurath, S.; Ravikumar, A.; Vahdati, N.; Shiryayev, O. Effect of Magnetic Field on the Corrosion of API-5L-X65 Steel Using Electrochemical Methods in a Flow Loop. Appl. Sci. 2021, 11, 9329. [Google Scholar] [CrossRef]
- Ravikumar, A.; Rostron, P.; Vahdati, N.; Shiryayev, O. Parametric Study of the Corrosion of API-5L-X65 QT Steel Using Potentiostat Based Measurements in a Flow Loop. Appl. Sci. 2021, 11, 444. [Google Scholar] [CrossRef]
- Sadique, M.; Ainane, S.; Yap, Y.F.; Rostron, P.; Al Hajri, E. NaCl Erosion-Corrosion of Mild Steel under Submerged Impingement Jet. World Acad. Sci. Eng. Technol. Int. J. Mater. Metall. Eng. 2017, 11, 368–373. [Google Scholar]
- Parancheerivilakkathil, M.S.; Parapurath, S.; Ainane, S.; Yap, Y.F.; Rostron, P. Flow Velocity and Sand Loading Effect on Erosion–Corrosion during Liquid-Solid Impingement on Mild Steel. Appl. Sci. 2022, 12, 2530. [Google Scholar] [CrossRef]
- Lim, H.L. Assessing level and effectiveness of corrosion education in the UAE. Int. J. Corros. 2012, 2012, 785701. [Google Scholar] [CrossRef]
- Koch, G.H.; Brongers, M.P.; Thompson, N.G.; Virmani, Y.P.; Payer, J.H. Corrosion Cost and Preventive Strategies in the United States; United States Federal Highway Administration: Washton, DC, USA, 2002. [Google Scholar]
- Khattak, M.; Zareen, N.; Mukhtar, A.; Kazi, S.; Jalil, A.; Ahmed, Z.; Jan, M.M. Root cause analysis (RCA) of fractured ASTM A53 carbon steel pipe at oil & gas company. Case Stud. Eng. Fail. Anal. 2016, 7, 1–8. [Google Scholar]
- Lim, H.L.; Gunister, E. Awareness of corrosion importance among engineering undergraduates in the United Arab Emirates. Educ. Res. 2018, 9, 21–34. [Google Scholar] [CrossRef]
- Hegazy, M.; El-Etre, A.; El-Shafaie, M.; Berry, K. Novel cationic surfactants for corrosion inhibition of carbon steel pipelines in oil and gas wells applications. J. Mol. Liq. 2016, 214, 347–356. [Google Scholar] [CrossRef]
- Bhargava, A.; Sharma, C. Mechanical Behaviour and Testing of Materials; PHI Learning Pvt. Ltd.: Delhi, India, 2011. [Google Scholar]
- Cardarelli, F. Materials Handbook; Springer: Berlin/Heidelberg, Germany, 2000. [Google Scholar]
- Li, L.; Mahmoodian, M.; Li, C.-Q.; Robert, D. Effect of corrosion and hydrogen embrittlement on microstructure and mechanical properties of mild steel. Constr. Build. Mater. 2018, 170, 78–90. [Google Scholar] [CrossRef]
- Zhao, J.; Lee, J.H.; Kim, Y.W.; Jiang, Z.; Lee, C.S. Enhancing mechanical properties of a low-carbon microalloyed cast steel by controlled heat treatment. Mater. Sci. Eng. A 2013, 559, 427–435. [Google Scholar] [CrossRef]
- Jovičević-Klug, P.; Kranjec, T.; Jovičević-Klug, M.; Kosec, T.; Podgornik, B. Influence of the Deep Cryogenic Treatment on AISI 52100 and AISI D3 Steel’s Corrosion Resistance. Materials 2021, 14, 6357. [Google Scholar] [CrossRef] [PubMed]
- Rai, P.K.; Shekhar, S.; Mondal, K. Development of gradient microstructure in mild steel and grain size dependence of its electrochemical response. Corros. Sci. 2018, 138, 85–95. [Google Scholar] [CrossRef]
- Yang, J.; Lu, Y.; Guo, Z.; Gu, J.; Gu, C. Corrosion behaviour of a quenched and partitioned medium carbon steel in 3.5 wt.% NaCl solution. Corros. Sci. 2018, 130, 64–75. [Google Scholar] [CrossRef]
- Senthilkumar, T.; Ajiboye, T.K. Effect of heat treatment processes on the mechanical properties of medium carbon steel. J. Miner. Mater. Charact. Eng. 2012, 11, 143–152. [Google Scholar] [CrossRef]
- Odusote, J.K.; Ajiboye, T.K.; Rabiu, A.B. Evaluation of mechanical properties of medium carbon steel quenched in water and oil. AU J. Technol. 2012, 15, 218–224. [Google Scholar] [CrossRef]
- Saha, A.; Mondal, D.K.; Maity, J. Effect of cyclic heat treatment on microstructure and mechanical properties of 0.6 wt% carbon steel. Mater. Sci. Eng. A 2010, 527, 4001–4007. [Google Scholar] [CrossRef]
- Savas, T.P.; Wang, A.Y.-L.; Earthman, J.C. The effect of heat treatment on the corrosion resistance of 440C stainless steel in 20% HNO3+ 2.5% Na2Cr2O7 solution. J. Mater. Eng. Perform. 2003, 12, 165–171. [Google Scholar] [CrossRef]
- Ghorbani, S.; Ghasemi, R.; Ebrahimi-Kahrizsangi, R.; Hojjati-Najafabadi, A. Effect of post weld heat treatment (PWHT) on the microstructure, mechanical properties, and corrosion resistance of dissimilar stainless steels. Mater. Sci. Eng. A 2017, 688, 470–479. [Google Scholar] [CrossRef]
- Ofoegbu, S.U. Comparative Gravimetric Studies on Carbon Steel Corrosion in Selected Fruit Juices and Acidic Chloride Media (HCl) at Different pH. Materials 2021, 14, 4755. [Google Scholar] [CrossRef]
- Wu, W.; Liu, Z.; Hu, S.; Li, X.; Du, C. Effect of pH and hydrogen on the stress corrosion cracking behavior of duplex stainless steel in marine atmosphere environment. Ocean Eng. 2017, 146, 311–323. [Google Scholar] [CrossRef]
- Liu, M.; Cheng, X.; Li, X.; Lu, T.J. Corrosion behavior of low-Cr steel rebars in alkaline solutions with different pH in the presence of chlorides. J. Electroanal. Chem. 2017, 803, 40–50. [Google Scholar] [CrossRef]
- Chung, N.T.; So, Y.-S.; Kim, W.-C.; Kim, J.-G. Evaluation of the Influence of the Combination of pH, Chloride, and Sulfate on the Corrosion Behavior of Pipeline Steel in Soil Using Response Surface Methodology. Materials 2021, 14, 6596. [Google Scholar] [PubMed]
- Abdo, H.S.; Seikh, A.H.; Abdus Samad, U.; Fouly, A.; Mohammed, J.A. Electrochemical Corrosion Behavior of Laser Welded 2205 Duplex Stainless-Steel in Artificial Seawater Environment under Different Acidity and Alkalinity Conditions. Crystals 2021, 11, 1025. [Google Scholar] [CrossRef]
- Torić, N.; Brnić, J.; Boko, I.; Brčić, M.; Burgess, I.W.; Glavinić, I.U. Development of a high temperature material model for grade S275JR steel. J. Constr. Steel Res. 2017, 137, 161–168. [Google Scholar] [CrossRef]
- Valério, A.; Morelhao, S.L. Usage of Scherrer’s formula in X-ray diffraction analysis of size distribution in systems of monocrystalline nanoparticles. arXiv 2019, arXiv:1911.00701. [Google Scholar]
- Tarpani, J.R.; Braz, M.H.; Bose Filho, W.W.; Spinelli, D. Microstructural and fractographic characterization of a thermally embrittled nuclear grade steel: Part II-quenching and tempering. Mater. Res. 2002, 5, 365–371. [Google Scholar] [CrossRef]
- Brzuszek, R.; Rodrigues, P.; Motta, L.; Santos, D. Microstructural Evolution of Ultra Fine Grained C-Mn Steel Warm Rolling and Intercritical Annea. Mater. Res. 2002, 5, 343–348. [Google Scholar] [CrossRef][Green Version]
- Abdel-Karim, R.; Nabil, M.; Reda, Y.; El-Raghy, S. Corrosion characteristics of ASTM A106 grade B carbon steel pipelines exposed to sodium sulfate solutions. Mater. Perform. Charact. 2018, 7, 480–494. [Google Scholar] [CrossRef]
- Paul, S.; Pattanayak, A.; Guchhait, S.K. Corrosion behavior of carbon steel in synthetically produced oil field seawater. Int. J. Met. 2014, 2014, 628505. [Google Scholar]
- Tang, Y.; Liu, L.; Fan, L.; Li, Y.; Wang, F. The corrosion behavior of pure iron under solid Na2SO4 deposit in wet oxygen flow at 500 °C. Materials 2014, 7, 6144–6157. [Google Scholar] [CrossRef] [PubMed]
- Motagi, B.; Bhosle, R. Effect of heat treatment on microstructure and mechanical properties of medium carbon steel. Int. J. Eng. Res. Dev. 2012, 2, 7–13. [Google Scholar]
- Ndaliman, M.B. An assessment of mechanical properties of medium carbon steel under different quenching media. AU JT 2006, 10, 100–104. [Google Scholar]
- Murugan, V.; Mathews, P.K. Effect of tempering behavior on heat treated medium carbon (C35Mn75) steel. Int. J. Innov. Res. Sci. Eng. Technol. 2013, 2, 945–9540. [Google Scholar]
- Li, S.; Yuan, X.; Jiang, W.; Sun, H.; Li, J.; Zhao, K.; Yang, M. Effects of heat treatment influencing factors on microstructure and mechanical properties of a low-carbon martensitic stainless bearing steel. Mater. Sci. Eng. A 2014, 605, 229–235. [Google Scholar]
- Barlow, L.D.; Du Toit, M. Effect of austenitizing heat treatment on the microstructure and hardness of martensitic stainless steel AISI 420. J. Mater. Eng. Perform. 2012, 21, 1327–1336. [Google Scholar] [CrossRef]
- Moleejane, C.M.; Sanusi, K.O.; Ayodele, O.L.; Oliver, G.J. Microstructural features and Mechanical behaviour of Unalloyed Medium Carbon Steel (EN8 Steel) after subsequent heat treatment. In Proceedings of the world congress on engineering and computer science, San Francisco, CA, USA, 22–24 October 2014. [Google Scholar]
- Hwang, S.-M.; Wang, J.-P.; Lee, D.-W. Extraction of tantalum powder via the magnesium reduction of tantalum pentoxide. Metals 2019, 9, 205. [Google Scholar] [CrossRef]
- Boopathy, R.; Daniels, L. Effect of pH on anaerobic mild steel corrosion by methanogenic bacteria. Appl. Environ. Microbiol. 1991, 57, 2104–2108. [Google Scholar] [CrossRef]
- Prawoto, Y.; Ibrahim, K.; Wan Nik, W. Effect of pH and chloride concentration on the corrosion of duplex stainless steel. Arabian J. Sci. Eng. 2009, 34, 115. [Google Scholar]
- Khodair, Z.T.; Khadom, A.A.; Jasim, H.A. Corrosion protection of mild steel in different aqueous media via epoxy/nanomaterial coating: Preparation, characterization and mathematical views. J. Mater. Res. Technol. 2019, 8, 424–435. [Google Scholar] [CrossRef]
- Rihan, R.O. Electrochemical corrosion behavior of X52 and X60 steels in carbon dioxide containing saltwater solution. Mater. Res. 2013, 16, 227–236. [Google Scholar] [CrossRef]
- Sun, F.; Li, X.; Cheng, X. Effects of carbon content and microstructure on corrosion property of new developed steels in acidic salt solutions. Acta Metall. Sin. 2014, 27, 115–123. [Google Scholar] [CrossRef]
- Wang, X.; Chen, Y.-l.; Niu, G. The study on corrosion resistance of high-strength spring steel. Corros. Eng. Sci. Technol. 2018, 53, 54–64. [Google Scholar] [CrossRef]
- Callister, W.D.; Rethwisch, D.G. Materials Science and Engineering; John Wiley & Sons: New York, NY, USA, 2011; Volume 5. [Google Scholar]
- May, M. Corrosion behavior of mild steel immersed in different concentrations of NaCl solutions. J. Sebha Univ. 2016, 15, 1–12. [Google Scholar]
- Seikh, A.H. Influence of heat treatment on the corrosion of microalloyed steel in sodium chloride solution. J. Chem. 2013, 2013, 587514. [Google Scholar] [CrossRef]
- Pancheva, H.; Reznichenko, G.; Miroshnichenko, N.; Sincheskul, A.; Pilipenko, A.; Loboichenko, V. Study into the influence of concentration of ions of chlorine and temperature of circulating water on the corrosion stability of carbon steel and cast iron. Bocmoчнo-Eвponeйcкuй Жуpнал Пepeдoвыx Texнoлoгuй 2017, 4, 59–64. [Google Scholar] [CrossRef][Green Version]
- Song, Y.; Jiang, G.; Chen, Y.; Zhao, P.; Tian, Y. Effects of chloride ions on corrosion of ductile iron and carbon steel in soil environments. Sci. Rep. 2017, 7, 6865. [Google Scholar] [CrossRef]
- Arzola, S.; Palomar-Pardavé, M.; Genesca, J. Effect of resistivity on the corrosion mechanism of mild steel in sodium sulfate solutions. J. Appl. Electrochem. 2003, 33, 1233–1237. [Google Scholar] [CrossRef]
- Hasan, B.O.; Sadek, S.A. Corrosion behavior of carbon steel in oxygenated sodium sulphate solution under different operating conditions. Adv. Chem. Eng. Res 2013, 2, 61–71. [Google Scholar]
- Yang, H.; Gao, Y.; Qin, W. Investigation of the corrosion behavior of electroless Ni-P coating in flue gas condensate. Coatings 2017, 7, 16. [Google Scholar] [CrossRef]
- Yang, H.; Gao, Y.; Qin, W.; Ma, S.; Wei, Y. Investigation of corrosion behavior of 3003 aluminum alloy in flue gas condensate. Mater. Corros. 2017, 68, 664–673. [Google Scholar] [CrossRef]
- Kader, J.A.E.; Warraky, A.E.; Aziz, A.A.E. Corrosion inhibition of mild steel by sodium tungstate in neutral solution Part 2: Behaviour in NaCl and Na2SO4. Br. Corros. J. 1998, 33, 145–151. [Google Scholar] [CrossRef]
- Ikechukwu, A.S.; Obioma, E.; Ugochukwu, N.H. Studies on corrosion characteristics of carbon steel exposed to Na2CO3, Na2SO4 and NaCl solutions of different concentrations. Int. J. Eng. Sci 2014, 3, 48–60. [Google Scholar]
Publisher’s Note: MDPI stays neutral with regard to jurisdictional claims in published maps and institutional affiliations. |
© 2022 by the authors. Licensee MDPI, Basel, Switzerland. This article is an open access article distributed under the terms and conditions of the Creative Commons Attribution (CC BY) license (https://creativecommons.org/licenses/by/4.0/).