3. Results and Discussions
SEM micrographs showing a comparison of the differences in the morphology of unablated and central ablated areas of Cd targets exposed to 500, 1000, 1500, and 2000 pulses, and a full view of the ablated region for 2000 laser pulses at a constant fluence value of 3.6 Jcm
−2 in DI water are shown in
Figure 1a–f. The inset of
Figure 1f shows the magnified view of the peripheral ablated area for 2000 pulses.
Figure 1b shows conical structures (1.5 µm), pores with an average (avg) size of 0.7 µm, nanoparticles with an avg size of 0.35 µm, cavities with an avg size of 3.35 µm, and channel formation on the central ablated area of the irradiated target for 500 laser pulses. The destruction of cones and channels, along with the enhancement in density of cavities (avg size of 2.25 µm) and pores (avg size of 0.45 µm), is observed with the increase in the number of pulses to 1000. The increased number of pulses (1500) causes the enhancement in density of cavities along with the enhancement in their size to 3.53 µm. Pores with enhanced density and size of 0.7 µm along with redeposited flakes and the formation of nanoparticles (0.75 µm) is shown in
Figure 1d. For 2000 pulses, refilling of the cavities and pores is observed and shown in
Figure 1e. Generally, structural defects can be generated or removed during intense laser irradiation [
23].
Cones are 3D geometric shapes that are efficiently tapered from leveled material surfaces after laser irradiation. The melting of materials, formation of capillary waves, and ablation and evaporation of material cause the generation of cones. During laser ablation, preferential evaporation from the surface of the target due to the presence of erosional resistant impurities that are formed due to the segregation of surface defects is the basic reason behind the formation of conical microstructures [
24].
When the target is exposed to 500 laser pulses, holes/cavities and pores are formed. The reflection of the laser beam from the side walls into initially formed porous structures, holes/cavities, and recoil pressure introduced by the evaporated liquid in the target ambient cause the generation of hot spots on irradiated target surfaces. Consequently, it results in channel formation [
25]. With the increase in the number of pulses to 1000, the channels are destroyed, and an enhancement in the density of the cavities is observed. Further increase in the number of pulses to 1500 exfoliation and hydrodynamical sputtering becomes dominant, causing the generation of flakes and nanoparticles on the irradiated surface. Flakes are small, very thin, flat pieces of material that are broken or peeled off from the larger piece of material due to exfoliation sputtering during laser irradiation.
The formation of nanoparticles/droplets on the irradiated target surface during ablation in a liquid confined environment can be explained based on the condensation process inside a plasma plume [
26,
27]. During nanosecond laser ablation, material removal can be achieved by different mechanisms in which thermal evaporation is a well-known phenomenon. Nano/microparticle generation is achieved during the early stages of laser material interactions [
23]. Various mechanisms of nano/microparticle release during nanosecond laser ablation are related to the beginning and decay of meta-stable states after laser irradiation. It is observed that the destruction of layers nearer to the surface is affected via structural inhomogeneities in solids. The presence of various heterogeneities (voids, pores, inclusion of gasses, and ions from ambient plasma) cause inhomogenous laser absorption in the target material. The concentration of these heterogeneities for metals can vary between 10
19 cm
−3 and 10
20 cm
−3. The generation of particles is explainable on the basis of thermal mechanisms. During laser ablation, when the surface temperature approaches the critical point during superheating, homogeneous nucleation causes explosive boiling and particle formation [
23]. During superheating, laser material homogeneous nucleation on the irradiated target surface occurs, and the surface temperature reaches its critical point. The phenomenon of homogenous nucleation at high fluence values causes the formation of particles on the irradiated surface
The generation of particles on the irradiated Cd surface in DI water can also be related to non-thermal ablation, for example, mechanical fragmentation [
2]. Various methods lead to the generation of particles with diverse morphologies and sizes. High-pressure (>2 GPa) and high-speed (>1500 ms
−1) shock waves produced due to the abrupt expansion of high-pressure plasma plumes cause the generation of dislocations introducing mechanical rupture in the upper layer of the irradiated target surface [
2]. Condensation and nucleation can also produce nano-particles depending on plasma lifetime which is shorter in liquids than in air.
Exfoliation sputtering can generate microparticles (flakes) with uneven morphologies during ablation of refractory and brittle materials due to cleavage of crystal planes after photomechanical ablation. The variations in thermal compressive and tensile stresses are possible causes of flake formation. Microparticles can also be generated due to material spallation. The phase explosion in liquid ambient (water) causes the removal of material during ablation [
28].
The presence of pores on the irradiated material surface will be converted into bubbles after melting. The transition of a solid into a liquid phase causes the generation of nanobubbles in liquids and produces cavities with sizes regarding inter-atomic spacing equivalent to numerous angstroms [
29].
The concentration of these voids is about 10
18 cm
−3 in normal conditions [
30]. Laser-pulsed heating results in the increase of bubble growth which enhances the ejection of microdroplets and generation of microcavities/craters [
29].
Figure 2a–d show the SEM topographical images at the boundary of laser ablated areas of Cd targets for 500, 1000, 1500, and 2000 pulses, at a constant fluence of 3.6 Jcm
−2 in DI water ambient.
Figure 2a show the presence of cavities (avg size of 2.5 µm), pores (avg size of 0.25 µm), nanoparticles (avg size of 430 nm), and wave-like ridges on the irradiated target surface after laser irradiation with a minimal number of 500 pulses. With the increase of pulses to 1000, an enhancement in the size of pores (avg size of 0.3 µm) and nanoparticles (avg size of 500 nm) along with a reduction in their density is observed in
Figure 2a,b, whereas the wave-like ridges are destroyed with the increase in the number of pulses (
Figure 2b). The increased number of pulses causes the immigration of clusters and atoms, which results in the destruction/disappearance of initially developed surface structures [
3].
With the further increase of pulses to 1500, the filling of cavities (avg size of 2 µm) and pores (avg size of 0.25 µm) with reduced nanoparticles size (avg size of 480 nm) is observed (
Figure 2c). The new conical microstructures (avg size of 1.5 µm) are also developed on the irradiated target surface after 1500 pulses.
For 2000 pulses, wave-like ridges, hillocks (3.5 µm), pores (0.3 µm), and cavities (1.75 µm) are formed on the target surface. The conical microstructures are destroyed after irradiation by 2000 pulses.
During laser–material interactions, the target material is evaporated and causes the generation of plasma. The intensive recoil pressure of plasma causes the generation of bumps, cones, cavities, and wave-like ridges on the irradiated target surface [
3] (
Figure 2). The generation of ridges at the boundary of the ablated spot is related to the piston mechanism. During this mechanism, recoil pressure and laser-generated plasma of emitted material move the melted material layers to the boundary of the laser irradiated spot and can cause the generation of ridges. The surface becomes much planer with the refilling of cavities with the increase in the number of pulses from 500 to 2000. The refilling of cavities is due to enhanced melting as the relaxation phase becomes less effective, and the shock liquidized material fills the laser-generated cavities developed by melting of irradiated target material [
3].
Pores are tiny openings on irradiated material surfaces, and cavities are holes or hollow depressions generated after irradiation on the target surface. With the increase in the number of pulses from 500 to 2000 in water ambient, the porosity at the central ablated areas of Cd (
Figure 1b–e) is increased. It is reduced with the increase in the number of pulses at peripheral ablated areas (
Figure 2a–d). During laser–material interactions, heating, melting, thermal desorption, and explosive boiling cause the generation of cavities [
3]. The formation of cavities can be discussed on the basis of uneven energy absorption by irradiated material surface, causing material relocation on the nanoscale to nearby sites. The generation of cavities in various environments has been presented by many research groups [
31,
32]. Spatial non-uniformity of laser energy on the material surface melts the surface at localized sites on nano/microscales. This causes the generation of sharp temperature gradients and expels the liquid around the boundary of the ablated region. This phenomenon can cause the generation of pores and cavities by abrupt freezing of the expelled melted material at the edges of ablated areas [
33]. The study of surface structuring of Al by nanosec laser ablation in ethanol ambient was reported by Viau et al. [
32]. They studied the formation of cavities and nanoparticles after laser irradiation. Enhanced hydrogen dissolution in melted Al and its release during resolidification causes the generation of cavities.
Figure 3a–e show SEM images of central ablated areas of Cd targets exposed to 500, 1000, 1500, and 2000 pulses and a full view of the ablated region for 2000 laser pulses at a constant fluence value of 3.6 Jcm
−2 in ethanol. The inset of
Figure 3e show the magnified view of the peripheral ablated area for 2000 pulses.
Figure 3a show the traces of micro-cluster formation (avg size of 6.25 µm) with nanoparticles (avg size of 0.58 µm) for 500 pulses. Initially, the absorption of laser light into the plume of plasma occurs at the solid–liquid interface [
34]. This plasma confinement produces a shock wave which causes the enhancement in pressure and temperature of the plasma. The atoms, clusters, and ions ejected in this process react with (i) the plasma–liquid interface and (ii) with interfacial liquid molecules among liquid and plasma at the solid–liquid interface. Owing to the high pressure and temperature at the liquid–plasma interface, new plasma is generated called plasma-induced plasma, which enhances the ablation efficiency due to collisional sputtering. The spectroscopic observations confirm the generation of species produced after chemical reactions of plasma with liquid molecules and solid targets [
34]. The phenomena of rapid quenching and transient reactions cause the generation of clusters that are inadequately crystallized and oxidized. These clusters turn out to be nuclei for the development of oxide nanoparticles and can be quenched abruptly in liquid (ethanol) solution, along with other ions or radicals such as H
+ and OH
− generated inside liquid solution. Liquid works as a confinement agent for ablated plasmas and also as a capping agent for stabilizing nanosized materials generation on the surface of clusters (
Figure 3a).
For an increased number of pulses to 1000, the cluster and nanoparticles are removed from the target surface, whereas pores (avg size of 0.5 µm) and cavities (avg size of 2.75 µm) with distinct boundaries on the irradiated target surface are generated after irradiation in ethanol ambient. During laser ablation, localized melted pools are generated due to structural (vacancies, pores, and cracks) and compositional (foreign solid and gaseous insertions) inhomogeneities on the surface. The laser energy absorption on these sites is enhanced compared with the remaining surface. This non-uniform energy absorption causes enhanced localized energy deposition and surface temperature [
35]. Under compressed flow of plasma, pore formation occurs due to vicious boiling which causes the generation of bubbles in superheated liquid layers (presence of compressive stresses can be perceived from XRD results). Due to turbulent boiling, these bubbles burst into the liquid and rapid cooling of the target generates pores on the irradiated target surface during ablation in ethanol ambient. The generation of cavities/pores is related to the release of adsorbed gases beneath the surface caused by volume boiling during laser ablation [
36], whereas for 1500 pulses, the cavity and pore density is reduced, and a comparatively plain surface is perceived. The liquefied shock material, after melting, refills the cavities (avg size of 1.5 µm) and pores (avg size of 0.42 µm), causing a reduction in the size and number density of cavities and pores [
36]. With the enhancement in the number of pulses to 2000, ridges and hillocks with an avg size of 3.5 µm structures are observed along with enhancement in the density of cavities and pores as shown in
Figure 3d. This variation in the surface morphology can be related to the variation in residual stresses after laser irradiation.
Figure 4a–d show the SEM topographical images at the boundary of the laser ablated area of Cd targets using SEM analysis for 500, 1000, 1500, and 2000 laser pulses at a constant fluence value of 3.6 Jcm
−2 in ethanol.
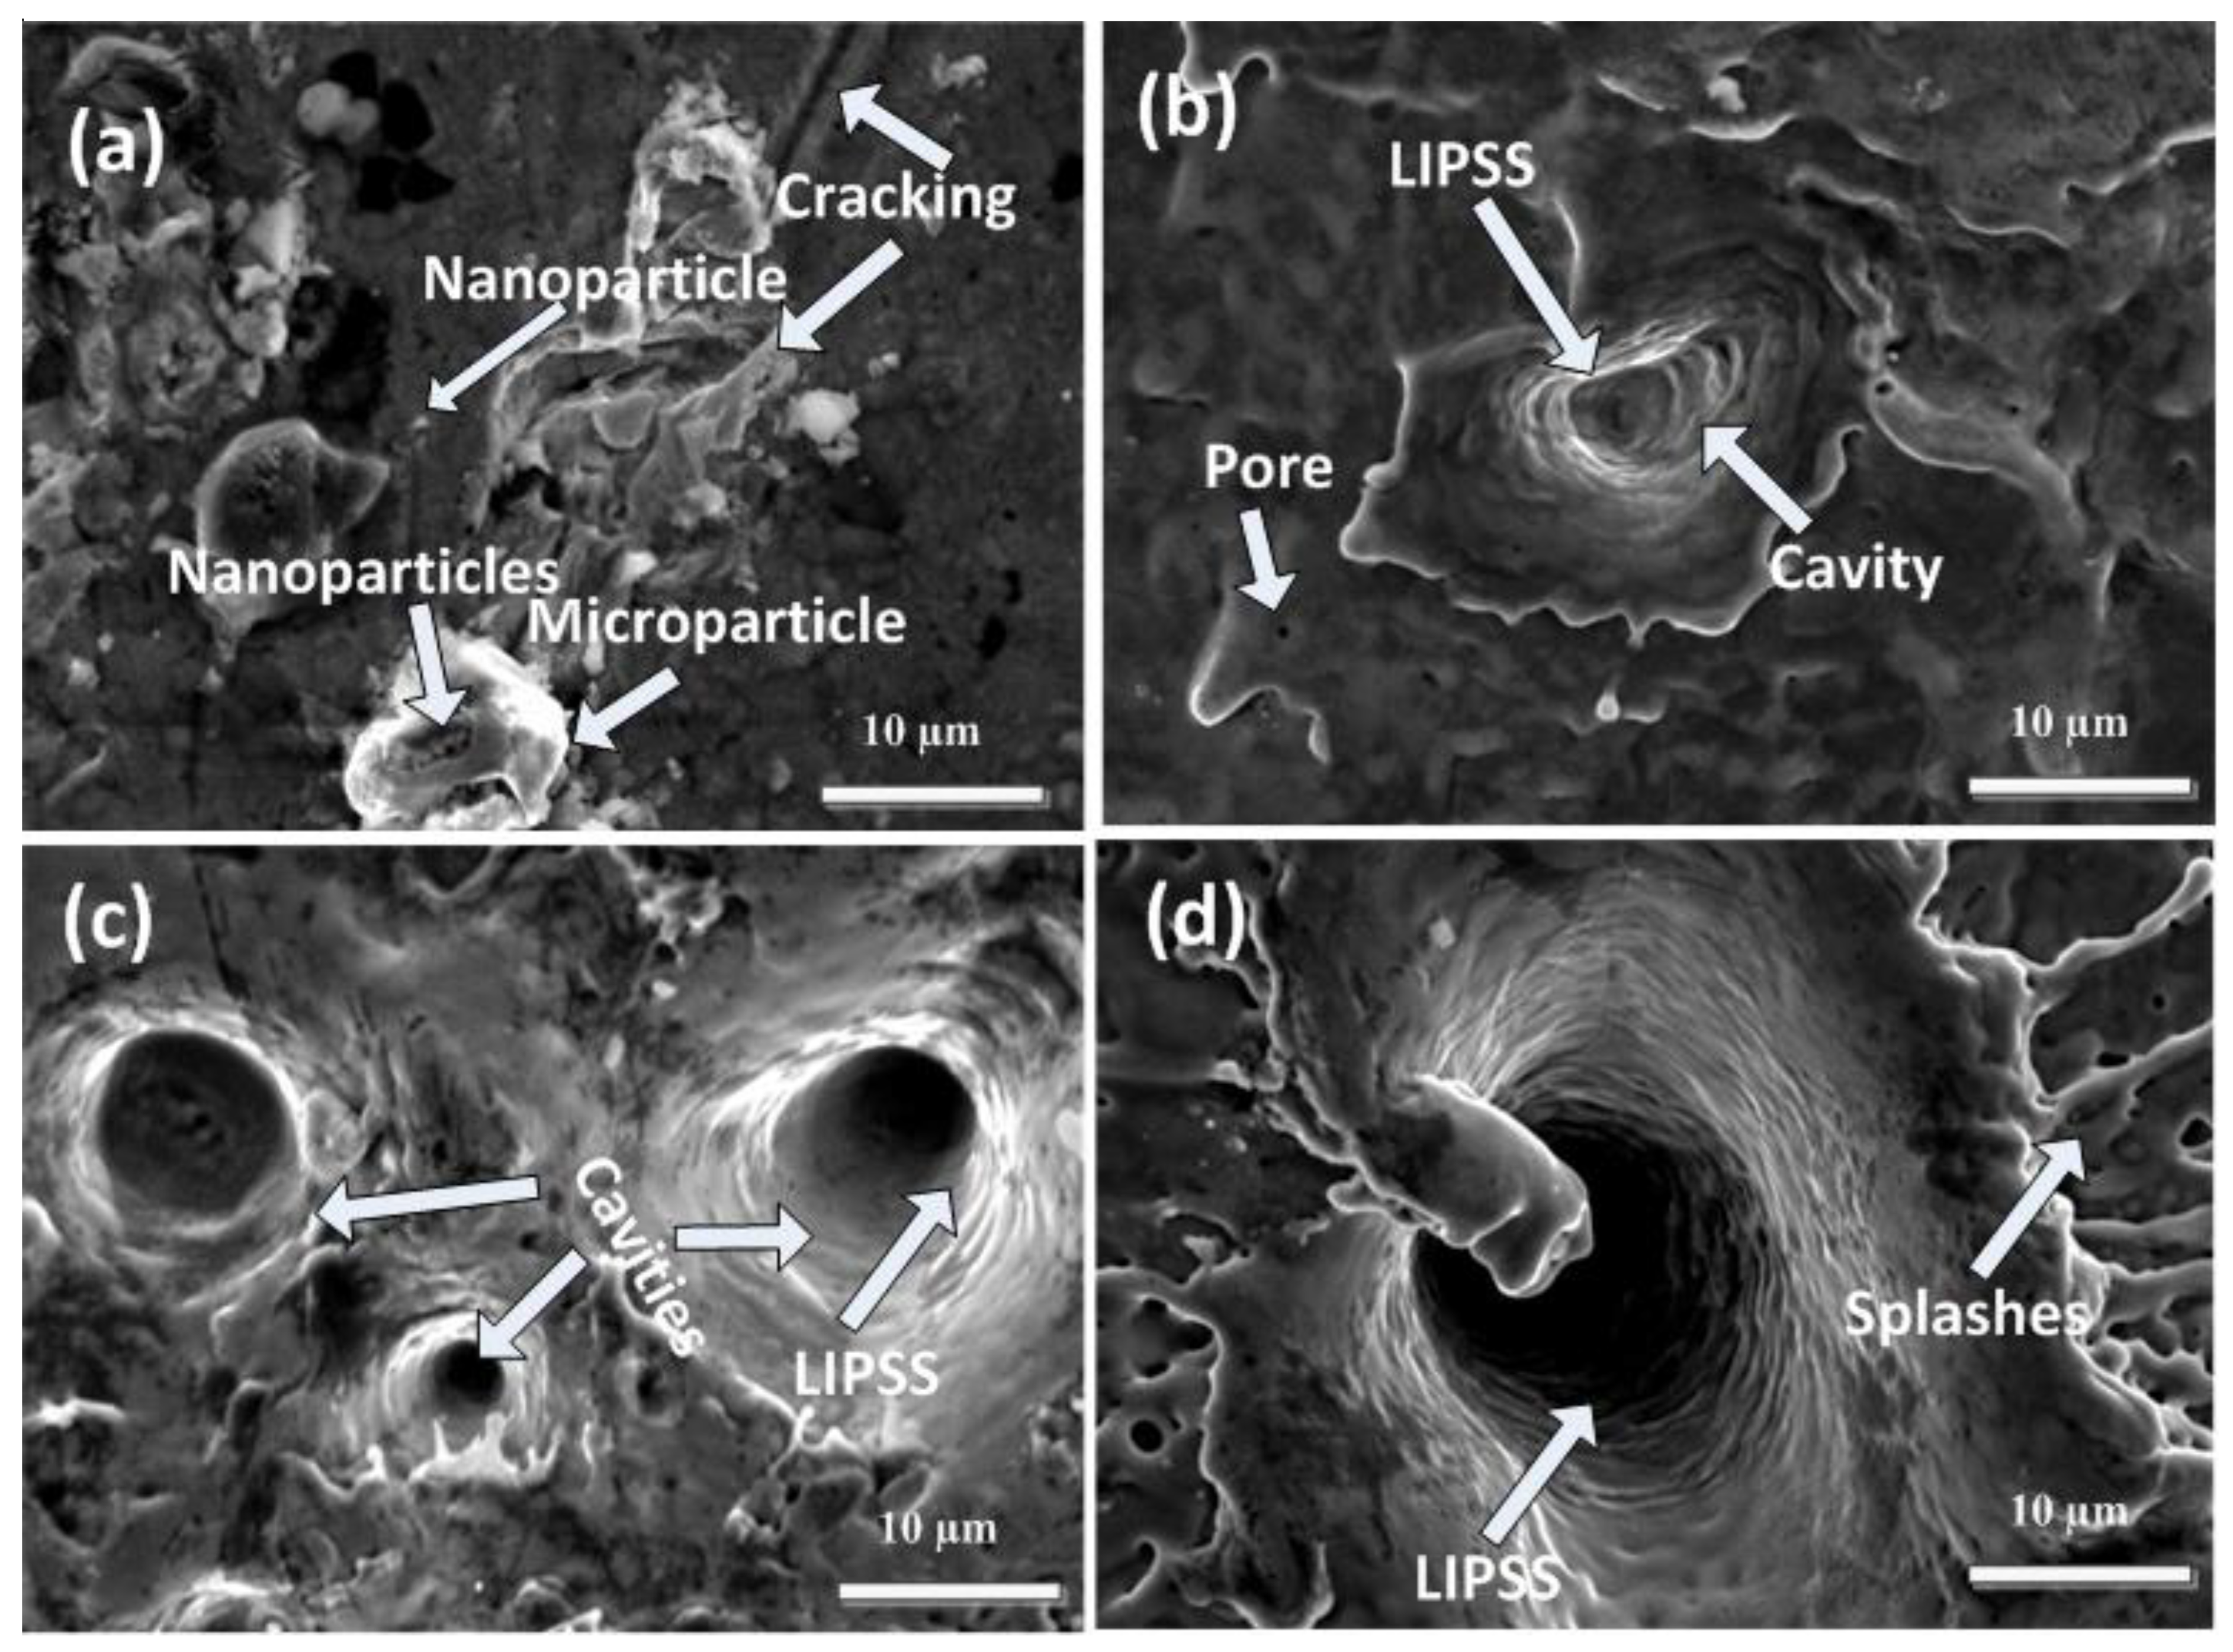
Figure 4a show cracking, redeposited particles with an avg size of 6.5 µm, nanoparticles (400 nm), and cavities (avg size of 2.25 µm) on the boundary area of the irradiated target for 500 laser pulses. With the increase in the number of pulses to 1000, the presence of pores, ridges, large-sized cavities/craters with an average diameter of 4.6 µm, and LIPSS and cones (avg size of 2.5 µm) are observed. While for 1500 pulses, crater size increases significantly from 4.6 µm to 7.1 µm with an appearance of multiple ablative layers and LIPSS. Along with small-sized cones with an average size of about 0.6 µm, ridges are formed during ablation in ethanol. The increase in crater density with the increase of pulses in ethanol as compared to DI water is due to the pronounced decomposition and evaporation rate of ethanol as compared to DI water [
3].
For 2000 pulses, along with a reduction in crater density, a large-sized crater with a diameter of 15.7 µm is observed. A cone with an enhanced diameter of 5.7 µm along with splashing, multiple ablative layers and LIPSS is also observed.
In this study, liquid (ethanol) played a significant role in confining and cooling the ablated target. Rapid temperature increase during laser-induced plasma formation/expansion produces cavitation bubbles in the liquid. The bubble motion contributes to the removal of ablated particles which redeposit on the surface. The aqueous media effectively cools the target, preventing excessive heat accumulation. The emission of shock waves generated by bubble implosion and/or liquid-jet formation during bubble collapse provides a substantial pressure impact on the target and photomechanical effect [
11]. Liquid-assisted laser ablation promotes material ablation efficiency in terms of nanostructuring via explosive liquid vaporization in association with mechanical impact on the sample. LIPSS formation can be achieved both by the ns [
22] and femtosecond (fs) [
37] laser irradiation of metallic targets. After ns laser irradiation, the LIPSS/ripples started to generate on the target surface in between the ablation threshold and melting of the irradiated material. Low-level heating causes less pronounced melting of the irradiated target surface, causing the development of these structures [
38].
This ripple formation can also be attributable to the interaction of ns laser radiation with the surface electromagnetic waves (SEW) formed during the laser interaction of the material [
39]. The excitation of surface plasmon polaritons (SPPs) induces the periodic enhancement of local fields in the surface layer. SPPs result from the coherent interaction of the incident laser field with free electrons created in the material [
39].
A comparison of surface structures on Cd in DI water and ethanol shows the growth of some common surface features in both environments, such as cavities, hillocks, pores, wave-like ridges, and nanoparticles. The formation of channels, pores, and flake-like structures are observed only in DI water, whereas micro-sized clusters, multiple ablative layers cracks/cavities, along with periodic surface structures and splashing are distinguished features on Cd surface after ablation in ethanol.
The generation of LIPSS is found only in ethanol ambient. For the KrF Excimer laser with a wavelength of 248 nm, the energy absorption of the laser beam is about 2% for DI water, and 98% of energy falls on the target surface, which causes melting and sputtering of the target. For ethanol, less energy is dropped on the target surface as ethanol absorbs about 12% of laser energy and only 88% of energy reaches the target surface. Additionally, the smaller ionization potential (10.47 eV) and smaller latent heat of vaporization (846 kJ/kg) of ethanol, as compared to water (75 eV, 2260 kJ/kg), may cause low-level heating [
38] and less pronounced melting as compared to DI water, hence causing the generation of LIPSS in ethanol. With the increase in the number of pulses from 500 to 2000 in ethanol ambient, the porosity at the central ablated areas of Cd (
Figure 3b–e) is increased with the increase in the number of pulses to 1000 and reduces with the increase of pulses to 1500 and again increases with the increase in the number of pulses to 2000. At the peripheral ablated areas, fewer pores are observed for 1000 pulses, while large-sized cavities/craters are observed at the boundary areas of the ablated region.
The relationship between the strength of inter-molecular forces and the liquid’s surface tension is that if the intermolecular forces are stronger, the surface tension of the liquid will be higher. DI water has stronger intermolecular bonding between hydrogen atoms, that is why it has a higher surface tension value of about 72 mN/m as compared to ethanol (22.50 mN/m) [
40,
41]. An increase in surface temperature can decrease the surface tension. In the case of DI water, as the surface tension is very high, the bubbles formed during irradiation will be responsible for the removal of debris [
39], whereas in the case of ethanol, the value of surface tension is low as compared to DI water, due to which the bubbles burst and more energy will reach the surface of the target. This results in a more pronounced ablated area and some redeposition over the ablated spot. This difference can be clearly seen in the overall view of DI water (
Figure 1f) and ethanol (
Figure 3e). The magnified view of central and peripheral ablated areas in the case of the ethanol environment also confirms the presence of redeposited material (
Figure 3 and
Figure 4).
In DI water for 1500 pulses (
Figure 1c), the cavities are converted into circular-shaped cavities compared to 500 and 1000 pulses. The liquid’s surface tension smoothens the rough edges of liquid lines, which converts the non-circular shapes of liquid dots to circular shapes. This might be due to the smooth edges of circular shapes representing the presence of thermal equilibrium at minimum energy. At higher temperatures, during laser–material interactions, the irregular-shaped structures are melted for a short time and during a molten state, the structures are reshaped with better geometries and minimal energy. Due to these minima in energy, the structures maintain their shapes during resolidification after irradiation. During this phenomenon of interaction between molten material and the target surface, the surface tension flows the material to minimal surface energy, resulting in smoothened circular dots generated from the non-circular ones [
42,
43]. XRD patterns of pristine and laser-irradiated Cd in DI water for varying numbers of pulses of 500, 1000, 1500, and 2000 are shown in
Figure 5.
The planes of reflection of Cd (JCPDS-00-005-0674) appearing at 2θ values of 31.67°, 34.66°, 38.25°, 47.82°, 61.155°, 62.167°, 66.43°, 71.57°, 73.28°, 75.46°, and 77.38° with
hkl values of (002), (100), (101), (102), (103), (110), (004), (112), (200), (201), and (104) are represented in
Figure 5. After ablation in DI water for 500 laser pulses, the Cubic CdO reflection planes with reference number (JCPDS-05-0640), appearing at 2θ values of 31.73°, 38.107°, 62.1447°, and 66.46°, are related to planes (−111), (200), (311), and (222). The CdO
2 cubic structure appearing at 2θ values of 47.80° and 60.82° is ascribed to (220) and (023) planes [
44], whereas Cadmium hydroxide, Cd(OH)
2, with a hexagonal structure (reference number (JCPDS-01-073-0969)) is perceived at 2θ values of 34.81° and 75.56° with reflection planes at (002) and (202). A combination of the two phases, Cd(OH)
2 + CdO, appears at 62.144° with (h k l) values of (161) and (311) (
Figure 5). From
Figure 5, it can be perceived that the peak intensity of dissimilar peaks is different from each other. This shows that every diffraction plane contains different quantities of different phases [
45].
Table 1 show the variation in peak intensity, full width at half maximum (FWHM), CS, dislocation density (D.D.), residual strain (ε), residual stress (σ), and lattice parameter (a) for the CdO reflection plane having a
hkl value of (200) perceived at a 2θ value of 37.59° after irradiation in DI water.
The C.S of laser irradiated Cd is calculated using peak broadening by Scherrer’s formula [
46].
where D is the C.S, λ is the 1.5406 Å and the X-ray’s wavelength, β is the FWHM, and θ is the Bragg’s angle of diffraction.
Imperfection in the crystal is called dislocation, and the length of dislocation lines/volume is D.D.
which can be measured by Williamson and Smallman’s equation [
47].
Laser-generated plasma ion implantation from laser-induced plasma (Cd, O, H, C, etc.) during irradiation of the target surface and thermal shocks developed after laser irradiation on the target surface cause the generation of compressive as well as tensile residual stresses, respectively. The peak shifting to the lower and higher angular positions also confirms the presence of these tensile/compressive stresses compared to stress-free peak positions [
48]. The development of residual stresses is directly related to the generation of lattice strains developed due to the implantation of plasma ions to interstitial sites and causes the presence of lattice defects and thermal shocks [
48].
However, the broadening of peaks in XRD is dependent on the C.S., stresses, and strains. This shows that the C.S. and residual microstains are interlocked with the peak’s line broadening and are hard to separate from each other. The strain broadening in the lattice is dependent on the variation in the displacement of atoms w.r.t the position of the reference lattice [
49].
The residual strains are evaluated by using the following equation [
22].
In Equation (7), residual strains are represented by ε, whereas, and d are standard and observed d-spacing values of CdO (200).
The presence of residual stresses (tensile or compressive) is evaluated by taking the product of residual strain (ε) with the Young’s modulus (E) of the corresponding phase and is 50 GPa for CdO [
50].
For cubic structures (CdO), the lattice parameter ‘a’ is determined using the following relation:
Here, dhkl is the inter-planer spacing with hkl miller indices (200) in the present case.
The calculated value of the lattice parameter decreases from 0.4781 nm to 0.47338 nm with the increase in the number of pulses from 500 to 2000 pulses. The enhancement in D.D. causes the reduction in the lattice parameter value towards the standard value (0.46918 nm) [
45].
Table 1 show that peak intensity, C.S., residual strains, stresses, and lattice parameter values are decreased with the increase in the number of pulses along with enhancement in FWHM and D.D. values.
Table 1 show that C.S is inversely related to the FWHM and D.D. This shows that reduction in C.S. of the CdO (200) plane causes the enhancement in FWHM and D.D. The increase in pulse numbers causes the reduction in C.S. from 37.65 nm to 24.19 nm, which causes the enhancement in dislocation line density and motion of the planes to the minimum strained positions and reduction of peak intensity from 1389 (a.u) to 632 (a.u). The reduction in C.S. can be related to the recrystallization phenomenon [
51]. With the increase in the number of pulses, the collision between the evaporated Cd target and O species is enhanced and, in turn, reduces the energy of the participating species. The species with low energy may be diffused into the CdO lattice resulting in a reduction in C.S. via broadening of peaks and generating lattice distortions and point defects, which in turn reduces the growth of the CdO phase [
52] and relaxation in tensile stresses. The relaxation of tensile residual stresses can be discussed on the basis of the annealing effect developed due to laser-induced heating [
48]. The increase in pulse numbers from 500 to 2000 causes the reduction in the number density of prior developed defects and residual stresses via annealing along with the decrease in density of cavities and enhancement in nano-hardness value confirmed from SEM (
Figure 1 and
Figure 2) and nano-hardness (Table 3) analysis.
XRD patterns of pristine and irradiated Cd targets are presented in
Figure 6 after ablation in ethanol with a varying number of pulses, 500, 1000, 1500, and 2000. After ablation with 500 pulses, Cadmium Hydroxide Cd(OH)
2 with a hexagonal structure and reference number JCPDS-01-073-0969 are revealed at 2θ values of 31.54° and 75.32°, with
hkl values of (−111) and (202). CdO (cubic structure) plane reflections (reference number JCPDS-05-0640) are perceived at 2θ values of 38.61° and 66.447°, with
hkl values of (200) and (222). CdO
2 cubic structures are identified at 47.48° and 61.05° and are ascribed to (220) and (023) planes [
44]. The mixture of rhombohedral Cadmium Carbonate CdCO
3 JPCDS (00-008-0456) and Cd(OH)
2 phases are identified at angular position 34.31° with
hkl values of (113) and (002). A mixture of Cd(OH)
2 + CdO shown at a 2θ value of 62.157° with
hkl values of (161) and (311) (
Figure 6) is also obtained.
The calculated value of the lattice parameter increases from 0.4691 nm to 0.47550 nm with the increase in the number of pulses from 500 to 2000 pulses. Here, we can see that the reduction in D.D. causes the reduction in lattice parameters [
45].
Table 2 show the variation of peak intensity, C.S, residual strain/stress, and lattice parameters of laser-irradiated Cd targets in ethanol ambient for varying numbers of pulses from 500 to 2000.
From
Table 2, it is observed that for CdO (200), the peak intensity (603 nm to 1252 nm), C.S (21.03 nm to 26.64 nm), and lattice parameter (0.4691 nm to 0.47550 nm) are increased with the increase in the number of pulses to 2000. While reciprocal to C.S., the values of FWHM and D.D are decreased. Here, we observed that the decrease in D.D. causes an increase in the value of the lattice parameter [
45]. The enhancement in the peak intensity shows the increase in preferential growth of the CdO (200) reflection plane with the increase of pulses. This shows that the development of new phases and relative contents of these phases are related to the ion energy from laser-produced plasmas for a varying number of laser pulses [
45], whereas the increase in crystallinity of the CdO (200) plane is due to enhancement in flux energy of the involved ions on the target surface. The increase in energy deposition by ions increases the surface temperature and causes annealing and annihilation of defects along with the relaxation of microstrains and stresses induced on the target generated due to initial laser pulses [
52].
The upper and lower angle shifting of reflection planes represents the existence of residual stresses.
Figure 6 reveals the shifting of reflection planes from their stress-free data and shows the existence of residual stresses.
From
Figure 6 and
Table 2, it is concluded that higher angular shifting is observed as compared to untreated targets and causes the generation of compressive stresses. With the increase in the number of pulses, the relaxation in the compressive stresses is observed [
52]. From SEM analysis, it can be observed that less density of pores/cavities at the central ablated area and redeposition is perceived as compared to DI water. Additionally, the relaxation of compressive stresses causes the generation of cones and hillocks (
Figure 3). These results are also compatible with hardness analysis. For maximum compressive stresses, maximum hardness is achieved, and with the relaxation of compressive stresses, the hardness value is decreased.
FT-IR is a non-destructive and important characterization tool that provides information related to the chemical bonds and molecular structures of atoms. The spectra are taken for the range of 400 cm
−1 to 4000 cm
−1 having a resolution of about 4 cm
−1 that contains distinct molecular fingerprints exhibiting vibration frequency of different functional groups. Every peak in the FT-IR provides information for one functional group.
Figure 7 present the FT-IR spectra of Cd exposed to various numbers of pulses, 500, 1000, 1500, and 2000, in DI water ambient. Many peaks related to different wave-numbers of 775 cm
−1, 922 cm
−1, 1212 cm
−1, 1364 cm
−1, 1532 cm
−1, 1742 cm
−1, 2095 cm
−1, and 2331 cm
−1 are identified in
Figure 7. Mostafa et al. [
53] reported in their research work that the peaks identified at wavenumbers ranging from 700 cm
−1 to 1500 cm
−1 are related to CdO [
53]. The peaks identified at 1532 cm
−1, 1742 cm
−1, 2095 cm
−1, and 2331 cm
−1 correspond to Cd-OH, Carbonyle (C=O), Hydrides of metal (Cd-H), and Carbonyle (C=O) [
54]. The presence of these small intensity C=O peaks can be related to the presence of a small percentage of carbon in pristine and ablated Cd in DI water as compared to ethanol, and its presence is also confirmed by EDS analysis (
Table 3). The peak intensity of almost all peaks increases with the increase in the number of pulses. Frequency shifting in peak positions is also observed with the increase in number of pulses to 1500 and is reduced with the increase in pulses to a maximum value of 2000 pulses. The absorption of CdO into the surface matrix during ablation causes slight variation in the absorption band intensities [
3,
55]. The increase in the peak intensity of certain peaks can be related to the adsorption of ions (Hydrogen/Oxygen) from ambient water into the surface of Cd [
56]. At the same time, the decrease in the peak intensities is explained on the basis of a reduction in intermolecular bonding, caused by bond breaking or bond scission or may be due to other chemical variations [
57].
Figure 8 represent the infrared spectra of Cd for various numbers of pulses (500, 1000, 1500, and 2000) in ethanol ambient. The peaks identified at wavenumber 731 cm
−1, 993 cm
−1, and 1396 cm
−1 correspond to CdO [
58]. Adnan et al. [
59], within their Composite Hydroxide Mediated (CHM) approach, reported that the range of 1386 cm
−1 to 1400 cm
−1 belongs to the CdCO
3 bond, which is also confirmed by XRD results. The additional peaks appearing at wave numbers 1541 cm
−1, 1735 cm
−1, 1998 cm
−1, 2096 cm
−1, 2336 cm
−1, and 2917 cm
−1 are related to the presence of Cd-OH, Aromatic (C=C), Carbonyle (C=O), Hydrides of metal (Cd-H), Carbonyle (C=O), and -CH
2 [
60]. With the increase in the number of pulses to 1000, an additional peak corresponding to CdO at a 1220 cm
−1 wavenumber is achieved. The stretching of CdO (the metal Oxygen stretching) can cause the generation of new absorption bands [
55].
Comparison of the two environments shows the presence of oxides, carbides, and hydrides in both environments, whereas more carbides and hydrides are present during ablation in ethanol as compared to DI water. This can be related to different mechanisms of interactions, such as the generation of bubbles, recoil pressures, different surface tension, the difference in the absorption coefficient of the two liquids, and the difference in boiling points.
During plume expansion in DI water and ethanol, the enhancement in plasma pressure provides an appropriate environment for the enhancement of reaction rate between the species generated during ablation with OH
− and atomic O ions liquesce in the liquid media [
61]. In the present work, active Cd atoms, clusters, and ions react with dissolved O plasma and liquid alliance regime. OH
− ions produced during the laser-generated breakdown of liquids produce CdO, Cd(OH)
2 [
61], and Carbonyle (C=O) during ablation and additional peaks of CdCO
3 are observed during ablation in ethanol ambient.
For water environment [
61]:
For ethanol environment [
3,
61,
62,
63]:
The presence of these elements is also confirmed by XRD results (
Figure 5 and
Figure 6).
The presence of the C=O stretching vibration bond represents the presence of enol complexes such as metal acetylacetonate compounds due to the reaction between alcohol (ethanol) and Cd. The ablation of Cd in ethanol causes an increase in the reaction rate between metal (Cd) ions and ethanol (alcohol). This causes the formation of clusters Cd+2 (CH3-CH2-CH2-CH3)n.
The association products are stabilized by the evaporation of one or many molecules, which can easily be understood from the following relation [
3,
61].
Here,
is the metal ion that is Cd
+2 in the present case. A represents alcohol. The interaction between
with m alcohol molecules
forms
while
is the number of molecules that do not take part in this reaction [
3].
The chemical composition of unablated and laser ablated Cd targets exposed to 500 pulses, at a constant fluence of 3.6 J/cm
2 in DI water and ethanol ambient, studied using EDS point analysis from the central ablated region of Cd targets, is collected and represented in
Table 3 with ±5%, percentage error.
Figure 9a–c show the original spatial elemental map of pristine and irradiated Cd targets for 500 pulses in DI water and ethanol ambient. The variation in the chemical composition in almost all elements measured in weight percent is shown in
Table 3. From the table, it is seen that the unablated Cd target contains (C, N, O, Al, Si, Cd, W, and Pa); in weight percent, these are about ∼(1.18%, 1.33%, 3.34%, 0.96%, 0.11%, 90.36%, 0.23%, and 2.49%), respectively. After ablation in DI water, atomic Silicon (Si) and Tungsten (W) vanished along with enhancement in atomic Oxygen (O) content. The variation in the composition of other elements is as follows (C, N, O, Al, Cd, and Pa), and the weight percentages (Wt%) are about ∼(1.55%, 0.33%, 17.68%, 1.91%, 76.10%, 2.43%), respectively. After ablation in ethanol, ambient Cd content is reduced from 90.36 Wt% to 79.71 Wt%, and enhancement in atomic C is introduced from 1.18 Wt% to 6.25 Wt%. In contrast, the percentage weight O is higher in DI water (17.68 Wt%) than in ethanol (9.93 Wt%). Its value is higher as compared to unablated targets. Cd irradiation in both environments shows the diffusion of O into the crystal matrix, which causes the formation of oxides and redeposition that can be observed from SEM, XRD, and FTIR results. Enhanced deposition of C is observed in ethanol ambient which causes the improvement in hardness and is confirmed by the presence of carbides (CdCO
3) on the irradiated target surface (XRD analysis
Figure 6).
After irradiation with a nanosecond (ns) laser, each and every element’s response is different due to the diverse photothermal, photophysical, photochemical, and photoacoustic properties of every element. An uneven energy deposition during laser ablation causes the generation of different structures such as channels, pores, cavities, nano-particles, conical micro-structures, and ridges on the irradiated Cd target surface.
Surface nano-hardness of ns laser irradiated Cd exposed to 500, 1000, 1500, and 2000 pulses is measured using a nano-indenter. Hardness analysis is utilized to study the resistance of the material to becoming plastically deformed. The un-irradiated Cd target has a hardness value of about 0.20 GPa. After ablation in DI water for 500 pulses, its value is increased to 0.51 GPa, which is about 2.55 times higher than the unablated target. With the further increase in pulses to 2000, an increase in surface hardness up to 0.67 GPa is achieved, which is about 3.35 times higher than the unirradiated Cd target. This enhancement in surface hardness can be related to the decrease in C.S and enhancement in dislocation line density which hinder the further motion of dislocations [
64]. Due to a decrease in crystallite/grain size, the density of grains increases with the increase in the number of pulses. This hinders the movement of dislocations and relaxation in tensile residual stresses, in turn, causing an increase in surface hardness (
Table 1 and
Table 4) [
4].
From
Table 4, it is perceived that the hardness of laser-ablated Cd targets is higher for all laser pulses as compared to the unablated target. This is related to the diffusion of O to interstitial and lattice sites, causing a decrease in C.S. after an increase in lattice distortions [
65].
Table 4 also show variation in surface nano-hardness after irradiation in ethanol ambient for a varying number of pulses. From
Table 4, it is perceived that the maximum surface hardness is 0.69 GPa which is 3.45 times greater than the unablated Cd target, which is achieved for a minimum number of pulses, i.e., 500 pulses. This maximum value of nano-hardness is related to significant plastic deformations that can be related to minimum C.S. and the presence of maximum compressive stresses after irradiation [
64]. The generation of laser-produced shock waves after expansion of high temperature and pressure plasma also causes enhancement in the mechanical strength of the material after shock processing. Laser irradiation causes the vaporization of the target and, in turn, causes the production of high-pressure and high-temperature plasmas [
8]. The expansion of this plasma generates compressive and pressure waves causing the movement of shock waves on laser ablated Cd surface. The Cd surface is plastically deformed owing to the increase in peak pressure by increasing more than dynamic yield strain/stress. The enhancement in surface hardness can be associated with the diffusion of C and O to the interstitial sites and surface lattice sites during irradiation in an ethanol environment. This causes the reduction in C.S. and enhancement in residual compressive stresses (
Table 2) and surface hardness (
Table 3).
With the increase in pulses to 2000, the decrease in surface hardness to 0.57 GPa is achieved, which is 2.85 times greater than the unablated Cd target. It is attributable to the enhancement in C.S as well as to the relaxation of residual compressive stresses. The decrease in surface hardness with the increase in the number of pulses is related to the diffusion of C/O across grain boundaries which causes the increase in density of cavities and their size, as can be perceived from
Table 2 and
Table 3.
The comparison of the nano-hardness of laser-irradiated Cd targets in both ambient (DI water and ethanol) shows that the maximum nano-hardness value of 0.69 GPa is achieved in ethanol as compared to irradiation in DI water. This can be related to more diffusion of C into interstitial sites and lattice due to less atomic size and with a greater chance of diffusion as compared to O [
66]. From EDS (
Table 3) analysis, it is observed that a greater amount of carbon (6.25%) is present in ethanol as compared to DI water (1.55%). This causes enhancement in surface nano-hardness in ethanol as compared to DI water.


 ,
, 


