
Application of the Innovative Model NIPA to Evaluate Service Satisfaction

1
Department of Early Childhood Development and Education, Chaoyang University of Technology, No. 168, Jifeng E. Rd., Wufeng District, Taichung 413310, Taiwan
2
Department of Industrial Education and Technology, National Changhua University of Education, No. 2, Shi-Da Rd., Changhua City 50007, Taiwan
3
Department of Leisure and Recreation, National Formosa University, No. 64, Wunhua Rd., Huwei Township, Yunlin 632301, Taiwan
*
Author to whom correspondence should be addressed.
Sustainability 2022, 14(16), 10036; https://doi.org/10.3390/su141610036
Submission received: 4 July 2022
/
Revised: 29 July 2022
/
Accepted: 11 August 2022
/
Published: 13 August 2022
(This article belongs to the Special Issue Multi-Functional Urban Innovations)
Abstract
:Customer satisfaction is one of the antecedent variables of customer loyalty, and customer satisfaction can positively affect customer loyalty. However, past research on consumer behavior has focused mainly on the direct consumption behavior of customers in service satisfaction, not in indirect behavior. This study takes the wedding garden as an example to explore the indirect behavior of customers, based on PZB’s service quality, and using the customer value hierarchy theory, adopts a questionnaire survey, and from the perspectives of users, investigates the current service quality, in order to analyze the quality of the service according to an evaluation formula. This study distributes a total of 380 questionnaires and collects 367 valid samples, for a valid return rate of 96.7%. In order to solve the problems caused by the original important performance analysis (IPA), the research constructs new important performance analysis (NIPA) to replace the original. This structural model presents a structured measurement process with risk management performance and judgment rules, which yielded different outcomes, as well as distinguished managerial implications. Furthermore, this new analysis model can provide managers with different perspectives in helping administrators in decision making.
1. Introduction
The wedding banquet has a vital meaning for traditional Chinese society. Therefore, a wedding banquet is the most important part of a wedding that involves a series of complex arrangements [1]. To help prospective wedding couples deal with wedding-related issues, wedding parties are often the best option to host a wedding [2,3]. Wedding banquets are not only disposable consumer products, but also personal-oriented products. Furthermore, products have a vital influence on the market offering, and the creation of value is paramount to the survival of any company [4]. Customers might have to buy at the lowest price; another might want to maximize only personal benefits. Furthermore, the customer could enjoy a loyal relationship with a company and buy its products, almost regardless of the delivered value [5]. Customer satisfaction is one of the antecedent variables of customer loyalty, and customer satisfaction may positively affect customer loyalty [6]. It not only has considerable implications for firm performance, but also affects consumer spending, repurchase intention, and customer lifetime value [7]. In other words, when customers are satisfied, they will not only increase their willingness to repurchase a product, accept the repurchase amount, and increase the repurchase frequency, but also advertise and introduce it spontaneously. Therefore, customer satisfaction improves the perception of the product and influences consumer repurchase intentions [8]. This study focused on customer satisfaction with the wedding garden and explored the corresponding products provided by the wedding garden for traditional wedding banquets, including high-quality products and key services. The findings could help wedding garden operators improve customer satisfaction by improving products and services on the market.
In terms of research on the wedding banquet venues, most researchers focus on the process of choosing a venue by newlyweds and the consideration of internal and external factors; however, they seldom conduct research based on the characteristics of the wedding banquet venue itself. From a marketing point of view, product attributes are the views and perceptions of products. In other words, consumers will only evaluate the product attributes they perceive, their own needs, and the degree of importance they attach to the product attributes and then decide whether to buy the product or not [9]. In addition, researchers mostly discuss the direct consumption behavior of customers in service satisfaction, but not the indirect behavior of customers. However, those who attend the wedding banquet are all invited guests and they are not the direct consumers. To fill this gap in consumer behavior research, this article sought to empirically determine the wedding garden as an example.
The method of important performance analysis (IPA) is the evaluation of the performance of consumers’ preference for product properties during the process from expectation to experience, indicates the importance of the properties of the quality properties, according to “importance” and “performance”, and develops the classification of specific services [10]. “Important” means the degree of importance of service quality for consumers, while performance is the evaluation of the service quality of service providers. This method allows an enterprise to recognize the degrees of importance as well as the performance of a product/service, in order to plan a marketing strategy that matches the position of the enterprise. IPA can quickly provide useful information to management and therefore is considered the ideal tool to investigate service quality. To improve the problems discovered in the “importance–satisfaction analysis” model, this study constructs the “NIPA service quality–importance and satisfaction analysis model” to manage the current market competition strategy of companies and validate operational improvement policies to guide the corporate operational model [11]. Research purposes are as follows:
- (1)
- Construct a new important performance analysis (NIPA) of service quality in order to improve the disadvantages of the original IPA.
- (2)
- To explore customer satisfaction with service quality after attending the wedding banquet and generalize the results through NIPA.
- (3)
- Through the NIPA results, this study explores the properties of service quality, as perceived by customers after attending the wedding banquet.
2. Literature Review
2.1. Wedding Servicescape
The definitions of servicescape propose that the environment is constructed when people engage in service behavior. The primary dimensions are as follows. (1) To influence customers’ holistic perceptions of the servicescape; for example, of perceived quality. (2) To influence internal subsequent responses; for example, satisfaction with the service servicescape. (3) Influence external customer responses; for example, of approach, avoidance, or staying [12]. A wedding banquet is not only related to the different nature of the restaurant; its activities are also affected by time and ceremony. Guest interaction occurs frequently at a wedding banquet; therefore, the flow of venue and space planning attracts relatively more attention. Additionally, wedding banquets are no longer limited to traditional banquet styles; they can also include food, activities, and services provided by the entire venue. Among them, the wedding banquet venue places great emphasis on venue management, decoration, interactions at the wedding banquet, and other factors [13,14]. In view of this, this research explored the particularities of wedding parties to determine their service models and product items for development.
2.2. Product Value
“Product” refers to a tangible item. However, in a broad sense, products are used to satisfy people’s wants and needs. Customers will choose a product based on their perceived value of it. Satisfaction is the degree to which the actual use of a product matches the perceived value at the time of purchase. According to Kotler’s Five Product Level model, products are a means to an end to meet the various needs of customers. The model is based on the three ways—customer needs, customer wants, customer demands—in which customers attach value to a product. Five levels of product can be identified—the customer value hierarchy—of which the levels add more customer value as follows [4].
The first and most basic level is called the core value of the customer. The first level of the product is the core product, which is the fundamental need or want that consumers satisfy by consuming the product or service. The second of the five levels of the product is the generic product, which is a version of the product that contains only the attributes or characteristics absolutely necessary for it to function. The third of the five levels of product is the expected product, which is the set of attributes or characteristics that buyers normally expect and agree to when they purchase a product. The fourth of the five levels of the product is the augmented product, which is the inclusion of additional features, benefits, attributes, or related services that serve to differentiate the product from its competitors. The fifth of the five levels of product is the potential product, which is the inclusion of all the augmentations and transformations a product might undergo in the future. To ensure future customer loyalty, a business must aim to surprise and delight customers in the future by continuing to augment products. Thus, this research started with the “customer value hierarchy” to explore potential products and determine the service model and product projects.
2.3. Service Quality
“Customers are First” is the slogan of the service industry, and competition is severe. However, complaints for negative service quality are common, leading to disputes and influencing the overall image of companies. Therefore, companies establish service SOPs and provide educational training to service personnel to enhance corporate image, as well as the positive impression of customers, to attract new customers, and to increase profits. Service quality is the criterion for customers to judge service quality, as provided by service personnel. Research shows that if the customer’s experience meets their expectations, their perceived service quality is positive; if the customer’s experience does not meet their expectations, their perceived service quality is negative, and therefore, the perceived service quality is subjective and depends on customer expectations [14,15]. Service quality is the gap between expected service and perceived service, including tangible and intangible services. To simplify the primary structure and evaluate the reliability and validity of these dimensions, Parasuaman, Zeithaml, and Berry reduced the dimensions of service quality into tangibles, reliability, responsiveness, assurance, and empathy [16]. Thus, this study is based on the five dimensions of SERVQUAL service quality as the evaluation formula.
2.4. Zone of Tolerance
From both the literature on service management and consumer behavior, one construct that has emerged is the zone of tolerance. The authors of [17,18] suggested that the zone of tolerance mediates between customers’ desired level of customer service and an adequate level of service. They also defined the zone of tolerance in terms of the customer’s assessment of in-process service performance, which can range from “minimum tolerable” to “ideal” or somewhere in between [19]. When the uncertainty margin is small, they will adjust their expectations within the person’s tolerance zone. Otherwise, it will have an irreversible negative impact on service results when it exceeds the person’s zone of tolerance [20]. Based on the previous studies, as customers enter and move through the service process, these pre-performance expectations are modified by the importance/satisfaction of individual transactions. Each of these can be judged, consciously or subconsciously, to be adequate, more than adequate, or less than adequate against the customer’s view of what could be acceptable, unacceptable, or more than acceptable. Adequate performance is defined as being within the tolerance performance zone. These performance evaluations lead to an assessment of overall service satisfaction. Levels below the tolerance zone will cause frustration for the customer, reduce loyalty, and result in dissatisfied customers. In contrast, levels above the tolerance zone will lead to customer satisfaction and increased loyalty [21]. An outcome that is neither important nor satisfying is defined as being within the zone of tolerance.
The boundaries of the customer tolerance zone are dynamic and can be adjusted during service delivery. As service quality is the result of satisfaction during the service process, managers have the opportunity to influence not only the customer’s satisfaction with each part of the process, but also the customer’s tolerance thresholds for subsequent parts of the process. Thus, this article is based on the premise that service satisfaction is a prerequisite for service quality and attempts to understand the connection between the importance and satisfaction of customers for a series of service encounters and the degree of satisfaction they feel with the overall service experience.
2.5. Important Performance Analysis (IPA)
IPA is the evaluation of the performance of the preference for the properties of products during the process from expectation to experience and indicates the importance of the quality of the properties of the service, according to “importance” and “performance”, and develops the ranking of specific services. “Important” means the degree of importance of service quality for consumers, while performance is the evaluation of service quality of service providers. In the research, they mainly analyzed the service quality of auto dealers from the consumer’s point of view and determined the importance of different service properties of service providers [22]. Therefore, IPA demonstrates the quality advantages and disadvantages of service providers and draws together the means of importance and performance in a two-dimensional matrix. The service properties are classified into four quadrants: high-importance high-satisfaction, high-importance low-satisfaction, low-importance low-satisfaction, and low-importance high-satisfaction, as shown in Figure 1. Related IPA applications manage the current market competition strategy in the market of companies and validate operational improvement policies to guide the corporate operational model [23]. Through importance and satisfaction analysis, analytical results can be applied to schedule improvements, help companies upgrade their key service points, and enhance customer satisfaction [8]. This method allows an enterprise to recognize the degrees of importance as well as the performance of a product/service, for the purpose of planning a marketing strategy that matches the position of the enterprise. IPA can quickly provide useful information to management and, therefore, is considered the ideal tool to investigate service quality.
“Important” in IPA means importance to consumers, while “performance” means the measurement of performance perceived by consumers; therefore, it is a technique to rank the properties of specific services and products, and three hypotheses for IPA have been proposed: (1) Importance is associated with performance. (2) In general, perceived importance and perceived performance are the opposite; in other words, when performance is satisfactory, the importance becomes lower. According to Maslow’s hierarchy of needs, when needs are satisfied, they are no longer a motive. (3) Importance is the function of the cause of performance; in other words, performance changes importance [9,24]. IPA treats the total mean of importance and satisfaction as the division point of a two-dimensional matrix. Importance is the x-axis and satisfaction is the y-axis, and there are four kinds of phenomenon in this two-dimensional matrix. According to the scoring of quality properties, the product/service falls into four types of phenomenon, which further propose strategic concerns of specific properties [16]. Based on the quadrants of quality properties, managers can recognize the service quality properties of companies as advantages or disadvantages. The meanings of the quadrants are shown as follows:
- (1)
- Quadrant I: maintenance, importance, and performance are high; therefore, the quality of the service of this part should be retained and actively promoted as a competitive advantage of the company.
- (2)
- Quadrant II: excessive development; it is of lower importance but higher satisfaction. It means that the company might have excessive emphasis on development, and thus wastes resources. Therefore, the resources in this part can be reorganized and reapplied to improve other more important quality items.
- (3)
- Quadrant III: secondary improvement; importance and satisfaction are low. The service quality items in this part are less important; therefore, they can be treated after Quadrant IV (prior improvement).
- (4)
- Quadrant IV: prior improvement; importance is high, but satisfaction is low. They are the quality items of a company that should be improved first.
To further define the value structure and qualitative measures of decision making, many researchers have combined other analytical methods to improve the IPA method. For example, the IPA model based on fuzzy AHP was used to evaluate the service requirements of Taiwan’s international port distribution centers [25]. The Fuzzy Kano model with importance performance analysis was used to address shortcomings [26]. The FCEM-AHP and IPA approach was used to measure tourist preferences for smart tourist attractions [27]. The diagrammatic trust tree and the hybrid evaluation and classification technique that combined a fuzzy set, simple additive weight, and important performance analysis (IPA) was used to address urgent improvement actions [28]. The Fuzzy Kano model and the performance of the analysis of fuzzy importance was used to resolve the attractive factors of new products [29]. Fuzzy MICMAC, with a revised IPA approach, was used to explore service quality improvement [30]. Compared to the original IPA, the authors developed a sentiment-based importance–performance analysis (SIPA) model to analyze the categorization of product features to guide product development [31]. Combination of the IPA and QFD models allow SMEs in Indonesia to allocate the benefit of directing resources more effectively and to provide a company as a reference for their priority strategic option [32]. Furthermore, to improve the shortcomings of important performance analysis (IPA), researchers proposed a new method for important performance analysis (new important performance analysis, NIPA), constructed by the researchers to conduct service quality research on the public bicycle system, iBike, in Taichung City, Taiwan. The results showed that it not only changed bicycle lanes in Taichung City, but also made iBike users willing to brave the road. It also improved user satisfaction and increased the rate of public bicycles [11]. Thus, this study aims to follow the new important performance analysis (NIPA) to improve the disadvantages of the original IPA and propose suggestions for future improvements accordingly.
3. Research Methods
3.1. Conceptual Model
Through IPA, this study analyzes the importance and satisfaction of the quality of related services for the case study of a wedding garden in Taichung, Taiwan. The research framework was a questionnaire on the five dimensions of SERVQUAL service quality, as proposed by Parasuraman, Zeithaml, and Berry, combined with the theory of customer value for modification and measurement. Through expert and scholarly discussions, the questionnaire was revised to proper dimensions: tangibles (core product), reliability (generic product), responsiveness (expect product), security (augmented product), empathy (potential product), and according to characteristics of the wedding garden, they were modified as appropriate items. The research model is shown in Figure 2.
3.2. Instrument and Measures
This study explores the service quality of a wedding garden in Taichung, Taiwan; therefore, questionnaires were distributed to wedding garden attendees. The researcher first explained the purpose and method of completion of the questionnaires and retrieved them after completion. Part 1 was the service quality items of the questionnaire, which uses five dimensions to measure customer cognition of service quality, based on the previous dimensions, “core service”, “generic service”, “expect service”, “augmented service”, and “potential service”. Service quality items were divided into two parts: “importance” and “performance”, and there were 20 items, respectively, shown in Table 1. Furthermore, in order to understand the connection between the importance and satisfaction of customers for a series of service encounters and the degree of satisfaction they feel with the overall service experience to reach the upper limit, the last item of the questionnaire was “What is your tolerance to the degree of importance superior to satisfaction?” Part 2 investigates the subjects’ gender, age, occupation, education, income, and main purpose in the wedding garden. According to the content, it recognizes the distribution and characteristics of the wedding garden customers.
3.3. Sampling
The case study was located in the Dakeng district, Taichung city in Taiwan. The distribution in this study lasted from 1 November 2021 to 28 February 2022, which is the popular time for weddings. In traditional customs, the period is the best time to get married. In addition, it is a party time to welcome Chinese New Year. Hence, this study survey was conducted during this period. Three hundred and eighty questionnaires were distributed in the study. After eliminating items with incomplete or repetitive responses, this study obtained 367 valid questionnaires. Regarding the gender of the subjects, females were 54.8% and males were 45.2%. Regarding age, most were aged 26–30 and 36–40, with the percentage being 26.77%; under (and including) 25 years old are the least, at only 20.47%. Regarding education, most had a college degree, and the percentage was 50.39%, and below high school was the least, at only 7.87%. Regarding income, above NTD 50,000 was the most, at 49.2%; below NTD 30,000 was the least, and the percentage was only 1.2%. Regarding patronage, the percentage was 69.29%, and never patronized was 30.71%. The sample characteristics are presented in Table 3.
4. Results and Discussion
4.1. Construction of NIPA (New Important Performance Analysis) Measurement Model
Using the “importance–satisfaction analysis” model, this study realizes the following issues:
- (1)
- When the gap between PS (perceived service) and ES (expected service) of the service quality evaluation formula of items is equal to one figure, it means that the customer satisfaction with service shows the same gap. These items should be based on the same evaluation degree; however, the gap between the importance and satisfaction of these items is of different degrees, such as item 2 (4.58, 4.28), item 16 (4.12, 4.42), and item 17 (3.82, 4.12) in Figure 2, which is 0.3, but it should have the same degree of evaluation. Item 2 (4.58, 4.28) is in Quadrant I, the maintenance zone, item 16 (4.12, 4.42) is in Quadrant II, which is the zone of excessive development, while item 17 (3.82, 4.12) is in Quadrant III, the zone of secondary improvement (see Figure 3). The three items are in three different quadrants, and thus, they should not have the same evaluation degree.
- (2)
- When PS (perceived service)-ES (expected service) of the service quality evaluation formula of an item is <0, evaluation of service quality should be unacceptable (lower than expectation). For instance, in Figure 2, PS (perceived service)-ES (expected service) of the service quality assessment formula for all items is <0, meaning that they are unacceptable (lower than expectation); however, there are different degrees in Quadrant I, the maintenance zone, Quadrant II, the excessive development zone, Quadrant III, the secondary improvement zone, and Quadrant IV, the prior improvement zone.
To improve the problems discovered in the “importance–satisfaction analysis” model, this study constructs the “NIPA service quality–importance and satisfaction analysis model” (see Figure 4). In PS (perceived service)-ES (expected service) of the service quality evaluation formula, there are the following situations:
- (1)
- When PS-ES = 0, customers are satisfied (it matches their need), such as ad lines, from (3,3) to (5,5).
- (2)
- When PS-ES < 0, customers cannot accept it (lower than expected and quality should be improved), such as the zone formed by ab5cd (right bottom zone of line ad).
- (3)
- When PS-ES > 0, customers are satisfied (excessive supply to demand and satisfied with quality), such as the zone formed by af5ed (left upper zone of the line ad).
However, when PS-ES = 0 in the service quality evaluation formula, customers are rarely satisfied (it matches their need). Therefore, when PS-ES > 0, customers are satisfied (excessive supply to demand and satisfied with quality). It constructs the upper limit by parameter v1 of risk management performance, such as line fe. When PS-ES < 0, customers cannot accept the service (lower than expectation and quality should be improved), and thus it constructs the lower limit by parameter v2 of risk management performance, such as line bc. Therefore, the NIPA model includes three zones: Zone A formed by b5c; Zone B formed by abcdef; and Zone C formed by f5e, as shown in Figure 3.
Regarding the application of companies, based on the previous theory, this study establishes the NIPA measurement procedure, as follows:
- (1)
- Service properties are listed and developed as questionnaire items.
- (2)
- Users are invited to evaluate the degrees of these properties in terms of “importance” and “performance”. The former is the preference of the users and the perceived importance of the properties of a product or service; the latter is the suppliers of the performance of the product or service.
- (3)
- Calculate the means of the items, where importance is the horizontal axis and performance is the vertical axis. The evaluation degrees of the properties are the coordinates, and the properties are indicated in a two-dimensional space.
- (4)
- The NIPA model includes Zones A, B, and C, as shown in Figure 3.
In order to determine whether risk management performance matches the standard, this study further established the judgment principles as follows:
- (1)
- Zone A: prior improvement, high importance, and low satisfaction.
These are the priority items of the service quality that should be improved. Labor, materials, and capital should be immediately invested to re-adjust policies, systems, and procedures; otherwise, the survival of the company will be threatened.
- (2)
- Zone B: maintenance, scores of importance and performance are high.
Service quality in this part should be maintained and promoted as the competitive advantage of the company. Immediate improvement is not necessary; however, it should be continuously monitored to maintain the current state of the competition.
- (3)
- Zone C: excessive development, lower importance, and higher satisfaction.
It means that the company might have excessive importance and development and might waste resources. Therefore, the resources in this part can be reorganized and reapplied to improve other more important services quality items.
4.2. NIPA of Satisfaction with Service
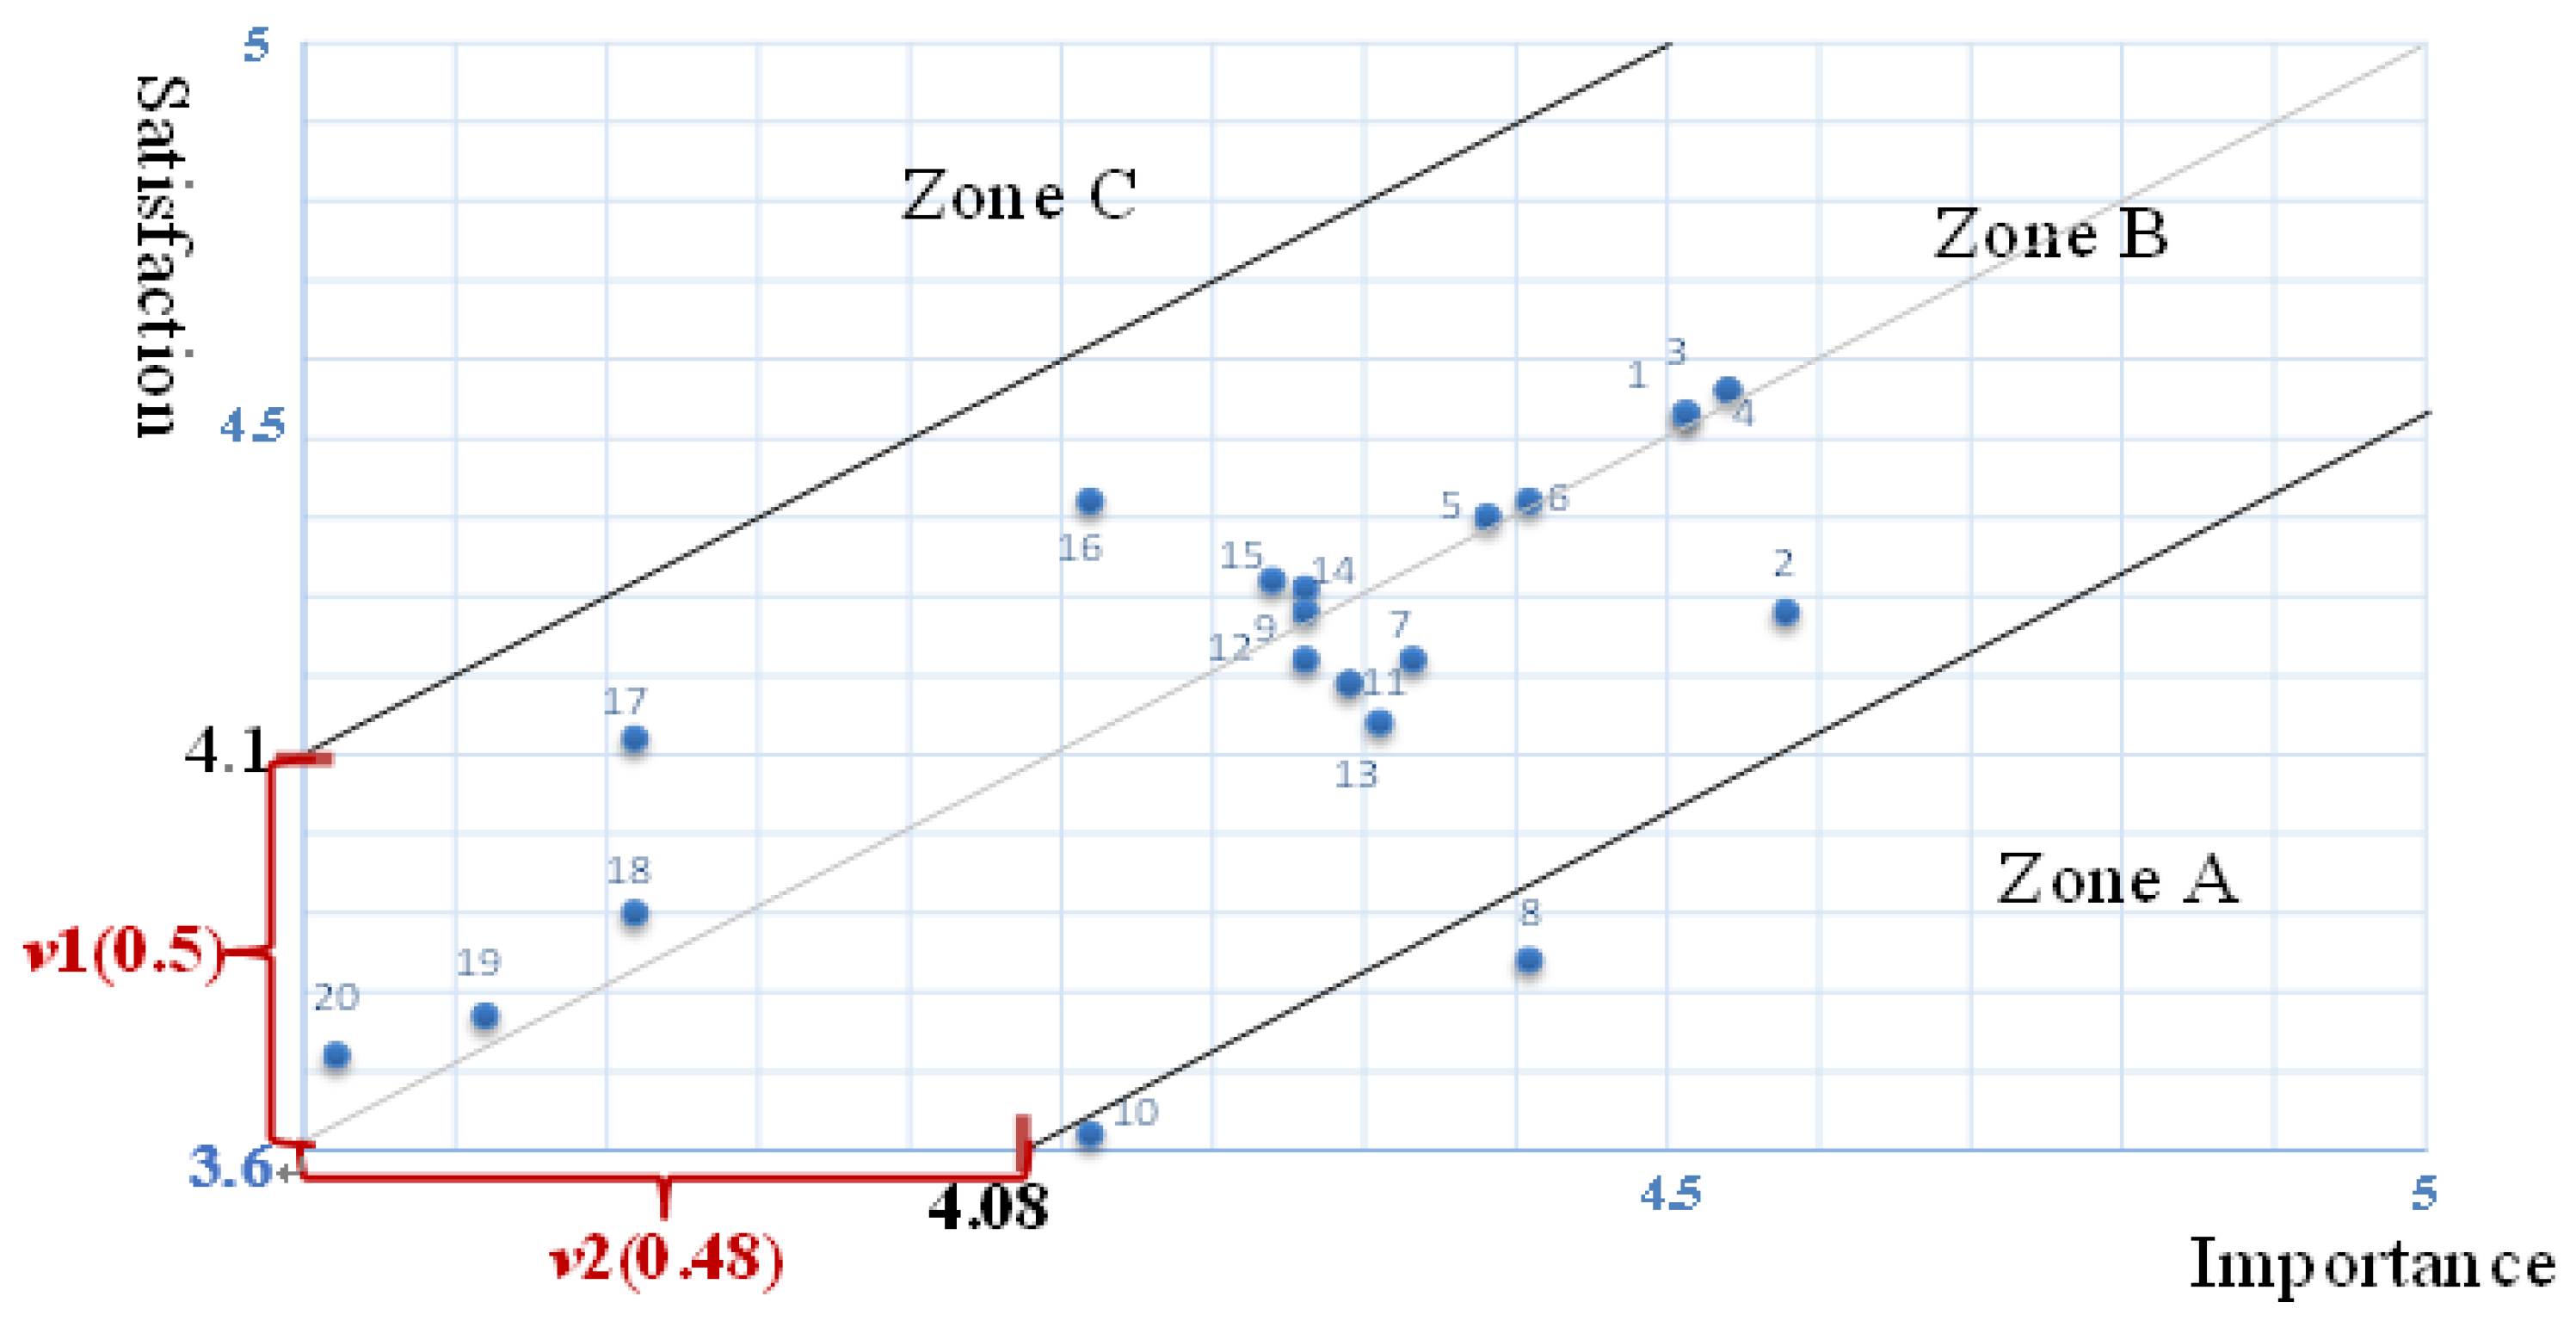
This study adopts NIPA, where importance is the x-axis and satisfaction is the y-axis. Interviews with the management of the wedding garden show the result of PS-ES > 0, and according to the evaluation formula of service quality, customers are satisfied (excessive supply to demand and satisfied with quality). This study constructs a parameter of v1 = 0.5 for risk management performance and the upper limit; in the questionnaire survey, the result of “what is your tolerance to the degree of importance superior to satisfaction?” shows that, when the parameter of risk management performance of NIPA model is v2, NIPA (v2) importance is higher than satisfaction by 0.48 point; thus, it does not match the need, customers are disappointed, and the items should be improved. When PS-ES < 0 in the service quality evaluation formula, customers cannot accept the service (lower than expectation and quality should be improved). This study constructs the parameter of risk management performance v2 = 0.48 and the lower limit. The NIPA model is shown in Figure 5, which includes three zones: Zone A, B, and C.
Zone A: prior improvement, including two items: Providing enough parking spaces (8); Service staff who will not ignore the needs of customers when they are busy (10)—importance is high, but satisfaction is low. These items should be given priority for improvement. In other words, the company should immediately invest in laborers, materials, and capital in order to re-adjust the policy, the system, and the procedures; otherwise, it might threaten the survival of the company.
Zone B: maintenance, including 18 items: Providing a satisfying feast (1); Use of modern equipment and decorations (2); Use of comforting music, layout, and atmosphere in the banquet hall (3); Good wedding reception procedure and smooth traffic flow (4); Providing a clean and convenient space (toilet) (5); Providing qualified fire-fighting equipment and escape exit settings (6); Service staff dressed in neat clothing (7); Providing Wi-Fi in the banquet hall (9); Providing customers with timely and appropriate services (11); Service staff that are familiar with customer needs (12); Fulfilling and completing the promise to customers in a timely manner (13); Maintaining a cordial and enthusiastic service attitude (14); Service staff who are willing to deal with customer complaints immediately (15); Service staff with enough professional knowledge to answer customer questions (16); Giving special attention to customers and help to solve problems (17); Providing customers with new banquet information (18); Sale of products related to wedding banquets; (19); Providing banquet hosts and performances (20). There are a total of 18 items, which are mostly among the three zones. The scores of importance and performance are high; therefore, the service quality of this part should be maintained and promoted as competitive advantages for the company. While immediate improvement is not necessary, these items should be continuously monitored in order to maintain the current status for competition.
Zone C: excessive development; none of the items were among this zone. For items among this zone, the importance is lower; however, satisfaction is higher, meaning that the wedding garden does not have excessive importance and development.
5. Conclusions and Suggestions
The research case study distributed 380 questionnaires and retrieved 367 valid questionnaires. All subjects were customers of the wedding garden. Questionnaire design was based on the five service quality dimensions of SERVQUAL, as proposed by Parasuraman, Zeithaml, and Berry, combined with the theory of customer value hierarchy for modification and measurement. The questionnaire was revised to proper dimensions: core service, generic service, expect service, augmented service, and potential service, and according to characteristics of the wedding garden, they were modified as appropriate items, including 20 items of service. This study conducted the three analyses according to the developed zones of NIPA. Based on previous analysis, this research summarized the importance and performance of the wedding garden customers. According to the results, this research summarized the items of the wedding garden that customers value and require the most and offers the following suggestions for the case study.
- (1)
- Providing enough parking spaces
This item is one of the core products. Due to changes in social patterns, as well as busy workloads and high work stress on weekdays, banquets and dinners are mostly held on holidays, leading to a large influx of vehicles on holidays, which causes parking problems. The case study is located in Dakeng district, Taichung city in Taiwan, where there is no public transportation system. Customers need to rely on personal transportation when they go to the wedding garden. For parking issues, wedding garden operators look for a venue near it to build a parking lot, which will increase the cost of purchasing land or renting land for the wedding garden. It will also cause the parking lot to be idle during non-holidays. Therefore, it is recommended to form alliances with golf courses for different nearby industries to rent short-term parking spaces during the peak seasons of the wedding garden and on holidays, or to rent adjacent vacant land, to improve the parking problem and increase the satisfaction of this item.
- (2)
- Service staff who will not ignore the needs of customers when they are busy
Wedding banquets are held on holidays. Due to the influx of guests on holidays, busy service staff may neglect the needs of customers. However, excessive recruitment of service personnel can cause staff idleness or time off on weekdays, resulting in poor staff cohesion. It is recommended to use work shift adjustments, recruit hourly employees, or cooperate with local schools for cooperative education to adjust the number of service personnel in the wedding garden. Increasing service personnel during busy hours and relatively reducing service personnel during unpopular hours can provide employees with opportunities for further training in their spare time, thus improving the problem of service staff neglecting the needs of customers when they are busy during popular hours.
IPA allows an enterprise to recognize the degrees of importance as well as the performance of a product/service in order to plan a marketing strategy that matches the position of the enterprise. IPA can quickly provide useful information to management and therefore is considered the ideal tool to investigate service quality. To further define the value structure and qualitative measures of decision making, many researchers have combined other analytical methods to improve the IPA method. To improve the problems discovered in the “importance–satisfaction analysis” model, this study constructs the “NIPA service quality–importance and satisfaction analysis model” to manage the current competitive market strategy of companies and validate operational improvement policies to guide the corporate operational model.
Past research on consumer behavior has focused mainly on the direct consumption behavior of customers in service satisfaction. However, those who attend the wedding banquet are all invited guests, and they are not in direct consumption. This study takes the wedding garden as an example to fill this research gap and to verify its effectiveness. In this study, the model is different from the IPA combined with other analytical methods used by other scholars in the past; it provided a structured measurement process with risk management performance and judgment rules that other researchers can use to understand the basic principles of importance–satisfaction analysis. This can also be applied to any other type of measurement and monitoring of service quality. The findings of this case study demonstrate that a new important performance analysis (NIPA) of service quality is necessary to improve the disadvantages of the original IPA. This structural model presents a structured measurement process, which yielded different results, as well as distinguished managerial implications. Furthermore, this new analysis model can provide managers with different perspectives to help administrators in decision making.
Author Contributions
Writing—original draft preparation, S.-P.L.; investigation, and data curation, Y.-H.L.; methodology, writing—review and editing, C.-C.H. All authors have read and agreed to the published version of the manuscript.
Funding
This research received no external funding.
Institutional Review Board Statement
This study did not require ethical approval.
Informed Consent Statement
This study did not require ethical approval.
Data Availability Statement
All data reported results were shown in this study.
Conflicts of Interest
The authors declare no conflict of interest.
References
- Lau, C.K.; Hui, S.H. Selection attributes of wedding banquet venues: An exploratory study of Hong Kong prospective wedding couples. Int. J. Hosp. 2010, 29, 268–276. [Google Scholar] [CrossRef]
- Cheng, C.C.; Wu, H.C.; Tsai, M.C.; Chang, Y.Y.; Chen, C.T. Identifying the strategic implications of service attributes of wedding banquet halls for market competition and risk management. Int. J. Hosp. Manag. 2021, 92, 102732. [Google Scholar] [CrossRef]
- Chen, C.T.; Chang, Y.Y.; Cheng, C.C.; Liu, K.H. A study on Constructing a tool to Assess the wedding Banquet service quality. J. Account. Financ. Dev. 2017, 10, 19–44. [Google Scholar]
- Kotler, P.; Keller, K.L. Marketing Management, 12th ed.; Pearson Prentice Hall: Hoboken, NJ, USA, 2006; p. 143. [Google Scholar]
- Lindgreen, A.; Hingley, M.K.; Grant, D.B.; Morgan, R.E. Value in business and industrial marketing: Past, present, and future. Ind. Mark. Manag. 2012, 41, 207–214. [Google Scholar] [CrossRef]
- Bitner, M.J. Evaluating service encounters: The effects of physical surroundings and employee responses. J. Mark. 1990, 54, 69–82. [Google Scholar] [CrossRef]
- Whitaker, J.; Krishnan, M.S.; Fornell, C.; Morgeson, F. How does customer service offshoring impact customer satisfaction? J. Comput. Inf. Syst. 2020, 60, 569–582. [Google Scholar] [CrossRef]
- Voorn, R.J.J.; van der Veen, G.; Van Rompay, T.J.L.; Hegner, S.M.; Pruyn, A.T.H. Human values as added value(s) in consumer brand congruence: A comparison with traits and functional requirements. J. Brand Manag. 2021, 28, 48–59. [Google Scholar] [CrossRef]
- Matzler, K.; Bailom, F.; Hinterhuber, H.H.; Renzl, B.; Pichler, J. The asymmetric relationship between attribute-level performance and overall customer satisfaction: A reconsideration of the importance–performance analysis. Ind. Mark. Manag. 2004, 33, 271–277. [Google Scholar] [CrossRef]
- Bitner, M.J. Servicescapes: The impact of physical surroundings on customers and employees. J. Mark. 1992, 56, 57–71. [Google Scholar] [CrossRef]
- Huang, C.C.; Lin, Y.H.; Lin, C.N.; Li, S.P. Research on Assessment of Service Satisfaction by Innovation Model: Using iBike as an Example. Basic Clin. Pharmacol. Toxicol. 2019, 124, 357–358. [Google Scholar]
- Paul, J.B. Guest Services in Hospitality Industry; Wiley: San Francisco, CA, USA, 2013; pp. 1–320. [Google Scholar]
- Getz, D. Event tourism: Definition, evolution, and research. Tour. Manag. 2008, 29, 403–428. [Google Scholar] [CrossRef]
- Gronroos, C.; Scheuing, E.E.; Christopher, W.F. Quality Comes to Service. In the Service Quality Handbook; AMACOM: New York, NY, USA, 1993; pp. 7–24. [Google Scholar]
- Yi, H.-T.; CYeo Amenuvor, F.E.; Boateng, H. Examining the relationship between customer bonding, customer participation, and customer satisfaction. J. Retail. Consum. Serv. 2021, 62, 1–11. [Google Scholar] [CrossRef]
- Parasuraman, A.; Zeithaml, V.A.; Berry, L. SERVQUAL: A multiple-item scale for measuring consumer perceptions of service quality. J. Retail. 1988, 64, 12–40. [Google Scholar]
- Berry, L.L.; Parasuraman, A. Marketing Services: Competing through Quality; Free Press: New York, NY, USA, 1991; p. 203. [Google Scholar]
- Zeithaml, V.A.; Berry, L.L.; Parasuraman, A. The Nature and Determinants of Customer Expectations of Service. J. Acad. Mark. Sci. 1993, 21, 1–12. [Google Scholar] [CrossRef]
- Gao, W.; Fan, H. Omni-channel customer experience (in) consistency and service success: A study based on polynomial regression analysis. J. Theor. Appl. Electron. Commer. Res. 2021, 16, 1997–2013. [Google Scholar] [CrossRef]
- Hussain, K.; Konar, R.; Nair, P.K.; Ragavan, N.A. Towards Service Excellence: The Zone of Tolerance for Hospitality and Tourism Education in Malaysia. In Service Excellence in Tourism and Hospitality; Springer: Cham, Switzerland, 2021; pp. 191–216. [Google Scholar]
- Bitner, M.J.; Hubbert, A.R. Encounter Satisfaction Versus Overall Satisfaction Versus Service Quality: The Consumer’s Voice”. In Service Quality: New Directions in Theory and Practice; Rust, R.T., Oliver, R.L., Eds.; Sage Publications: Thousand Oaks, CA, USA, 1994; p. 289. [Google Scholar]
- Martilla, J.A.; James, J.C. Importance-Performance Analysis. J. Mark. 1977, 41, 77–79. [Google Scholar] [CrossRef]
- Hawes, J.M.; Rao, C.P. Using Importance-Performance Analysis to Develop Health Care Marketing Strategies. J. Health Care Mark. 1985, 5, 19–25. [Google Scholar]
- Sampson, S.E.; Showalter, M.J. The performance-importance response function: Observations and implications. Serv. Ind. J. 1999, 19, 1–19. [Google Scholar] [CrossRef]
- Hsu, W.K.K.; Huang, S.H.S. Evaluating the service requirements of Taiwanese international port distribution centres using IPA model based on fuzzy AHP. Int. J. Shipp. Transp. Logist. 2014, 6, 632–651. [Google Scholar] [CrossRef]
- Meng, Q.; Jiang, X.; Bian, L. A decision-making method for improving logistics services quality by integrating fuzzy Kano model with importance-performance analysis. J. Serv. Sci. Manag. 2015, 8, 322. [Google Scholar] [CrossRef]
- Wang, X.; Li, X.R.; Zhen, F.; Zhang, J. How smart is your tourist attraction: Measuring tourist preferences of smart tourism attractions via a FCEM-AHP and IPA approach. Tour. Manag. 2016, 54, 309–320. [Google Scholar] [CrossRef]
- Alabool, H.M.; Mahmood, A.K.B. A novel evaluation framework for improving trust level of Infrastructure as a Service. Clust. Comput. 2016, 19, 389–410. [Google Scholar] [CrossRef]
- Xi, L.; Zhang, H.; Li, S.; Cheng, J. Integrating fuzzy Kano model and fuzzy importance–performance analysis to analyse the attractive factors of new products. Int. J. Distrib. Sens. Netw. 2020, 16, 1–18. [Google Scholar] [CrossRef]
- Chen, J.K. An integrated fuzzy MICMAC with a revised IPA approach to explore service quality improvement. Total Qual. Manag. Bus. Excell. 2020, 31, 1487–1505. [Google Scholar] [CrossRef]
- Wang, A.; Zhang, Q.; Zhao, S.; Lu, X.; Peng, Z. A review-driven customer preference measurement model for product improvement: Sentiment-based importance–performance analysis. Inf. Syst. e-Bus. Manag. 2020, 18, 61–88. [Google Scholar] [CrossRef]
- Sanny, L.; Angelina, V.; Christian, B.B. Innovation of SME service industry in Indonesia in improving customer satisfaction. J. Sci. Technol. Policy Manag. 2021, 12, 351–370. [Google Scholar] [CrossRef]
- Parasuraman, A.; Zeithaml, V.A.; Berry, L.L. A conceptual model of service quality and its implications for future research. J. Mark. 1985, 49, 41–50. [Google Scholar] [CrossRef]
Figure 1.
Importance–satisfaction matrix.

Figure 2.
Research model.

Figure 3.
IPA model.

Figure 4.
NIPA model.

Figure 5.
NIPA of satisfaction with service.


Table 1.
Constructs and items.
| Constructs | Items |
|---|---|
| Tangibles (Core Service) | 1. Providing a satisfying feast. 2. Use of modern equipment and decorations. 3. Use of comforting music, layout, and atmosphere in the banquet hall. 4. Good wedding reception procedure and smooth traffic flow. |
| Reliability (Generic Service) | 5. Providing a clean and convenient space (toilet). 6. Providing qualified fire-fighting equipment and escape exit settings. 7. Service staff dressed in neat clothing. 8. Providing enough parking spaces. |
| Responsiveness (Expect Service) | 9. Providing Wi-Fi in the banquet hall. 10. Service staff who will not ignore the needs of customers when they are busy. 11. Providing customers with timely and appropriate services. 12. Service staff that are familiar with customer needs. |
| Security (Augmented Service) | 13. Fulfilling and completing the promise to customers in a timely manner. 14. Maintaining a cordial and enthusiastic service attitude. 15. Service staff who are willing to deal with customer complaints immediately. 16. Service staff with enough professional knowledge to answer customer questions. |
| Empathy (Potential Service) | 17. Giving special attention to customers and help to solve problems. 18. Providing customers with new banquet information. 19. Sale of products related to wedding banquets. 20. Providing banquet hosts and performances. |
| Tolerance | 21. What is your tolerance to the degree of importance superior to satisfaction? |
Table 2.
The evaluation formula of service quality.
| PS (Perceived Service)-ES (Expected Service) | ||
|---|---|---|
| positive | PS-ES > 0 | customers are satisfied (excessive supply to demand and satisfied with quality) |
| negative | PS-ES < 0 | customers cannot accept it (lower than expectation, and the quality should be improved) |
| equal | PS-ES = 0 | customers are satisfied (it matches their need) |
Table 3.
Sample description.
| Item | N | (%) | |
|---|---|---|---|
| Gender | Male | 166 | 45.20 |
| Female | 201 | 54.80 | |
| Age | Under 25 | 75 | 20.47 |
| 26–35 | 98 | 26.77 | |
| 36–40 | 98 | 26.77 | |
| 41–45 | 46 | 12.63 | |
| 46–50 | 37 | 10.12 | |
| Above 50 | 13 | 3.24 | |
| Education | High school | 29 | 7.87 |
| College | 185 | 50.39 | |
| Master | 153 | 41.74 | |
| Income | Below 30,000 | 4 | 1.20 |
| 30,001–40,000 | 48 | 13.00 | |
| 40,001–50,000 | 134 | 36.60 | |
| Above 50,001 | 181 | 49.20 | |
| Patronage | Yes | 254 | 69.29 |
| No | 113 | 30.71 | |
Publisher’s Note: MDPI stays neutral with regard to jurisdictional claims in published maps and institutional affiliations. |
© 2022 by the authors. Licensee MDPI, Basel, Switzerland. This article is an open access article distributed under the terms and conditions of the Creative Commons Attribution (CC BY) license (https://creativecommons.org/licenses/by/4.0/).
Share and Cite
MDPI and ACS Style
Li, S.-P.; Lin, Y.-H.; Huang, C.-C. Application of the Innovative Model NIPA to Evaluate Service Satisfaction. Sustainability 2022, 14, 10036. https://doi.org/10.3390/su141610036
AMA Style
Li S-P, Lin Y-H, Huang C-C. Application of the Innovative Model NIPA to Evaluate Service Satisfaction. Sustainability. 2022; 14(16):10036. https://doi.org/10.3390/su141610036
Chicago/Turabian StyleLi, Shang-Pin, Ying-Hsiang Lin, and Chih-Cheng Huang. 2022. "Application of the Innovative Model NIPA to Evaluate Service Satisfaction" Sustainability 14, no. 16: 10036. https://doi.org/10.3390/su141610036
Note that from the first issue of 2016, this journal uses article numbers instead of page numbers. See further details here.