Article

Experimental Measurement of Forward Scattering from Very Rough Sand Ripples in a Water Tank

1
Department of Marine Technology, Ocean University of China, Qingdao 266100, China
2
State Key Laboratory of Acoustics, Institute of Acoustics, Chinese Academy of Sciences, Beijing 100190, China
*
Author to whom correspondence should be addressed.
Remote Sens. 2022, 14(16), 3865; https://doi.org/10.3390/rs14163865
Submission received: 24 June 2022 / Revised: 1 August 2022 / Accepted: 7 August 2022 / Published: 9 August 2022
(This article belongs to the Special Issue Remote Sensing Technology for New Ocean and Seafloor Monitoring)

Abstract

:
High order Bragg scattering from sand ripples is investigated by a tank experiment, where the artificially produced sand ripples have a spatial period of 0.2 m and ripple height of 5 cm. Bragg scattering has been measured at three frequencies 22 kHz, 24.57 kHz, and 27 kHz and three incident grazing angles 20 , 30 , 40 by a method based on the conventional beamforming using two horizontal receiving arrays. It is illustrated that high order Bragg scatterings can be observed, and the corresponding scattered grazing angles agree with the theoretical prediction. Owing to the ripple height being on the order of wavelength, it is found that the distribution of forward scattering amplitude is different from the distribution for sand ripples of small height, i.e., the diffuseness of scattering amplitude is increased with the ripple height.

1. Introduction

Understanding seafloor scattering is of importance in research areas such as sediment property inversion [1,2,3], target detection, and recognition near the seafloor [4,5,6]. Therefore, great efforts have been made to investigate the seabed backscatter strength by theory and experiment [7,8,9,10,11,12,13,14,15,16,17,18,19,20,21,22,23,24], in which theoretical models based on the small-roughness perturbation and the Kirchhoff approximation were widely used to interpret the experimental data, and it was illustrated that the backscatter strength had dependence on the grazing angle, frequency, and sediment types.
Different from the measurement of backscatter strength, the acquisition of bistatic seafloor scattering data becomes much more complex, due to the separation between transmitter and receiver. Some theoretical models [25,26] were proposed to study the bistatic scattering process, and a few experimental data were published in literature [26,27,28,29,30,31,32]. The early bistatic scattering experiment carried by Urick [27] demonstrated that out-of-plane scattering had little dependence on the azimuthal angle as long as it was away from the specular direction [26]. High-frequency bistatic scattering measurements made by Stanic et al. [28,29] showed little variation in scattering strength, where the source and receiver were in close proximity. Williams and Jackson [26] presented a bistatic scattering model, which was tested against data from coarse-grained sand bottom and gassy-mud bottom; however, only the bistatic scattering strength away from the specular direction was provided for comparison. Low grazing angle bistatic seafloor scattering measured by Day and Yamamoto [30] on the Florida Atlantic coastal shelf demonstrated that the scattering strength was highest along the transect between the source and transmitter, and its maximum value appeared near the receiver, which means that the forward scattering is much larger than the out-of-plane scattering. Although the seafloor statistics in above were often assumed to be transversely isotropic, the anisotropy of seafloor roughness should be considered when there exists ripples [31,32,33,34,35,36] in shallow water environments. High-frequency bistatic scattering from the rippled seafloor was measured by Choi et al. [31,32]. By comparing with the scattering from the isotropic rough seafloor, it was illustrated that the out-of-plane scattering was augmented, especially for the orientation of ripples being parallel to the direction of incoming waves [31]. In addition, the measurement of forward-scattering strength [32] was found to be in good agreement with the prediction by the APL-UW bistatic scattering model; however, the forward scattering did not demonstrate the characteristic of Bragg scattering, which was the primary cause for the observed subcritical acoustic penetration into the rippled seafloors [33,34,35,36].
On the other hand, because the measurement of bistatic scattering from sand ripples in the frequency range from 10–100 kHz is quite complex, scale-model scattering experiments have been carried at frequencies 500 kHz [37,38] and 1 MHz [39], where directional ripples were produced by machining the soft blue wax. It was shown that [37,38], in the longitudinal direction of ripples, the maximum scattering strength was in the specular direction, whereas, in the transversal direction of the ripples, the scattering strength showed maxima and minima at specific scattered angles. Note that the advantage of using the blue wax ripple is that its size and shape are controllable, and its shape is not changed in water, which means that scale-model scattering experiments can be easily made. However, different from the sand bottom (fluid medium), the blue wax is a type of elastic medium and its density is smaller than 1000 kg / m 3 . Therefore, in this paper, we make efforts to measure the forward scattering from sand ripples into water, and discern the orders of Bragg scattering.
In order to better understand acoustic scattering from sand ripples, a water tank experiment is designed for the forward scattering in the transversal direction of the ripples. Because the received waveform consists of the incident wave and scattered waves, a method based on the conventional beamforming is proposed to extract the scattered waves using two horizontal receiving arrays, which can be considered as a variant of spatial Fourier transform method to obtain the reflection coefficient [40,41]. In addition, we focus on the forward scattering with the ripple height being on the order of wavelength. Usually, when the incident grazing angle is lower than the critical angle, the strongest scattered strength appears in the specular direction, whereas, in the direction away from the specular direction, the scattered strength decreases rapidly. However, as has been illustrated by Yu and Peng [42], the diffuseness of scattered energy increased with the ripple height, i.e., the scattered energy away from the specular direction decreases slowly. Although the similar phenomenon has been observed for the scattering from the pressure-release surface [43], it has not been reported in an experiment for sound scattering from the rough seafloor to the best of our knowledge.
In Section 2, we first present a method to extract scattered waves from the conventional beamforming using two horizontal receiving arrays, and then in Section 3 investigate the Bragg scattering from sand ripples using experimental data, which are being compared with theoretical results. Finally, a conclusion is given in Section 4.

2. Method to Extract Scattered Waves

Two horizontal receiving arrays located at positions z = z 1 and z = z 2 in Figure 1a are used to extract scattered waves. We assume that the sound field at a given horizontal wavenumber k x = k cos θ can be decomposed into downward and upward propagating waves,
p θ , x , z = A θ e j ω t k x x + k 2 k x 2 z + B θ e j ω t k x x k 2 k x 2 z
where A ( θ ) represents the amplitude of downward propagating wave, and B ( θ ) represents the amplitude of upward propagating wave. For A = 0 and B 0 , θ denotes the scattered grazing angle θ s . For A 0 and B = 0 , θ denotes the incident grazing angle θ relative to the center of the receiving array. For A 0 and B 0 , θ = θ = θ s . By combining the total field p θ , x , z z = z 1 and p θ , x , z z = z 2 , we obtain
A θ = p θ , x , z 2 α * p θ , x , z 1 α α * , B θ = α p θ , x , z 1 p θ , x , z 2 α α *
with α = e j k sin θ z 2 z 1 = e j k sin θ z 0 , where the interval z 0 should be smaller than λ / 2 . If the grazing angle θ is zero, then α α * = 0 , which means the values of A θ and B θ are sensitive to the errors when the grazing angle θ is near zero. Therefore, the amplitude of downward and upward propagating waves obtained by our method should be discarded at a near-zero grazing angle.
The sound field p θ , x , z in Equations (1) and (2) only describes the propagating waves at a given grazing angle θ ; however, the sound pressure received by each hydrophone of the receiving array consists of waves propagating at different grazing angles. We denote the complex sound pressure received by each hydrophone at position x n , z as a vector r = p x 1 , z , p x 2 , z , , p x N , z T , and the conventional beamforming method is used to obtain
p θ , x , z = s H r
where s = e j k cos θ x 1 x , e j k cos θ x 2 x , , e j k cos θ x N x T , as a steering vector at grazing angle θ . Usually, the interval d between the neighboring hydrophone should not be larger than λ / 2 for the conventional beamforming to avoid the appearance of grating lobes, however, with an interval d > λ λ 2 2 ( d = 3 cm; f = 27 kHz) in experiments, and the grating lobe does not appear at scattered grazing angles for the forward scattering; therefore, the experimental result at frequency f = 27 kHz is also being presented below.

3. Results

3.1. Experimental System

Figure 1a illustrates a schematic diagram of experiments to measure the scattering from sand ripples with the incident grazing angle θ g 1 θ g 2 and scattered grazing angle θ s , where θ g 1 θ g 2 is defined by the positions of the source S, the mirror image source S , and the center of array1 (array2). Owing to the small interval ( z 0 = 1 cm) between the two arrays, i.e., λ / 6 at frequency f = 24.57 kHz, θ g 1 is approximately equal to θ g 2 , and we then define the incident grazing angle relative to the surface of sand bottom as θ g θ g 1 . Because spherical waves are radiated by a source in our experiment, an incident wave received by the array2 in Figure 1a is at grazing angle θ relative to the center of receiving array, which is smaller than θ g .
The water tank in Figure 1b is 3.8 m long, 1.9 m wide, and 2.8 m high. A layer of sand sediment of density ρ = 1820 kg / m 3 is laid on the bottom of tank, and the average thickness of layer is 0.4 m. Sand ripples shown in Figure 1c are then artificially produced by using a sinusoidal mold, which has a spatial period Λ = 0.2 m and surface amplitude h = 5 cm. Finally, the water tank is filled with water to a height of h 1 = 2.17 m, where sound speed in water is measured to be 1474.7 m/s. Figure 1d shows a horizontal receiving array of five hydrophones with an interval d = 3 cm, which satisfies d = λ / 2 at frequency f = 24.57 kHz. The sensitivities of hydrophones are about 210 dB ( r e 1 V/ μ Pa ) in the frequency range from 5 to 40 kHz. A spherical transducer (not shown in Figure 1), of which the source level is measured at about 140 dB ( r e 1 μ Pa . m / V ) in the frequency range used in the experiment, radiates five cycles of sine waves at three different frequencies f = 22 kHz, 24.57 kHz, and 27 kHz. Three different depths h 3 = 1.794 m; 1.474 m; 1.0814 m are chosen for the transducer, which correspond to three incident grazing angles relative to the surface of sand bottom, θ g = 20 , 30 , 40 , respectively. Because the performance of acoustic absorption by the floating absorbing wedges at the water surface is not very good, scattering from the water surface can not be neglected, especially when the transducer is near it. This leads to a limit on the measurements at large incident grazing angles.

3.2. Processing Experimental Data

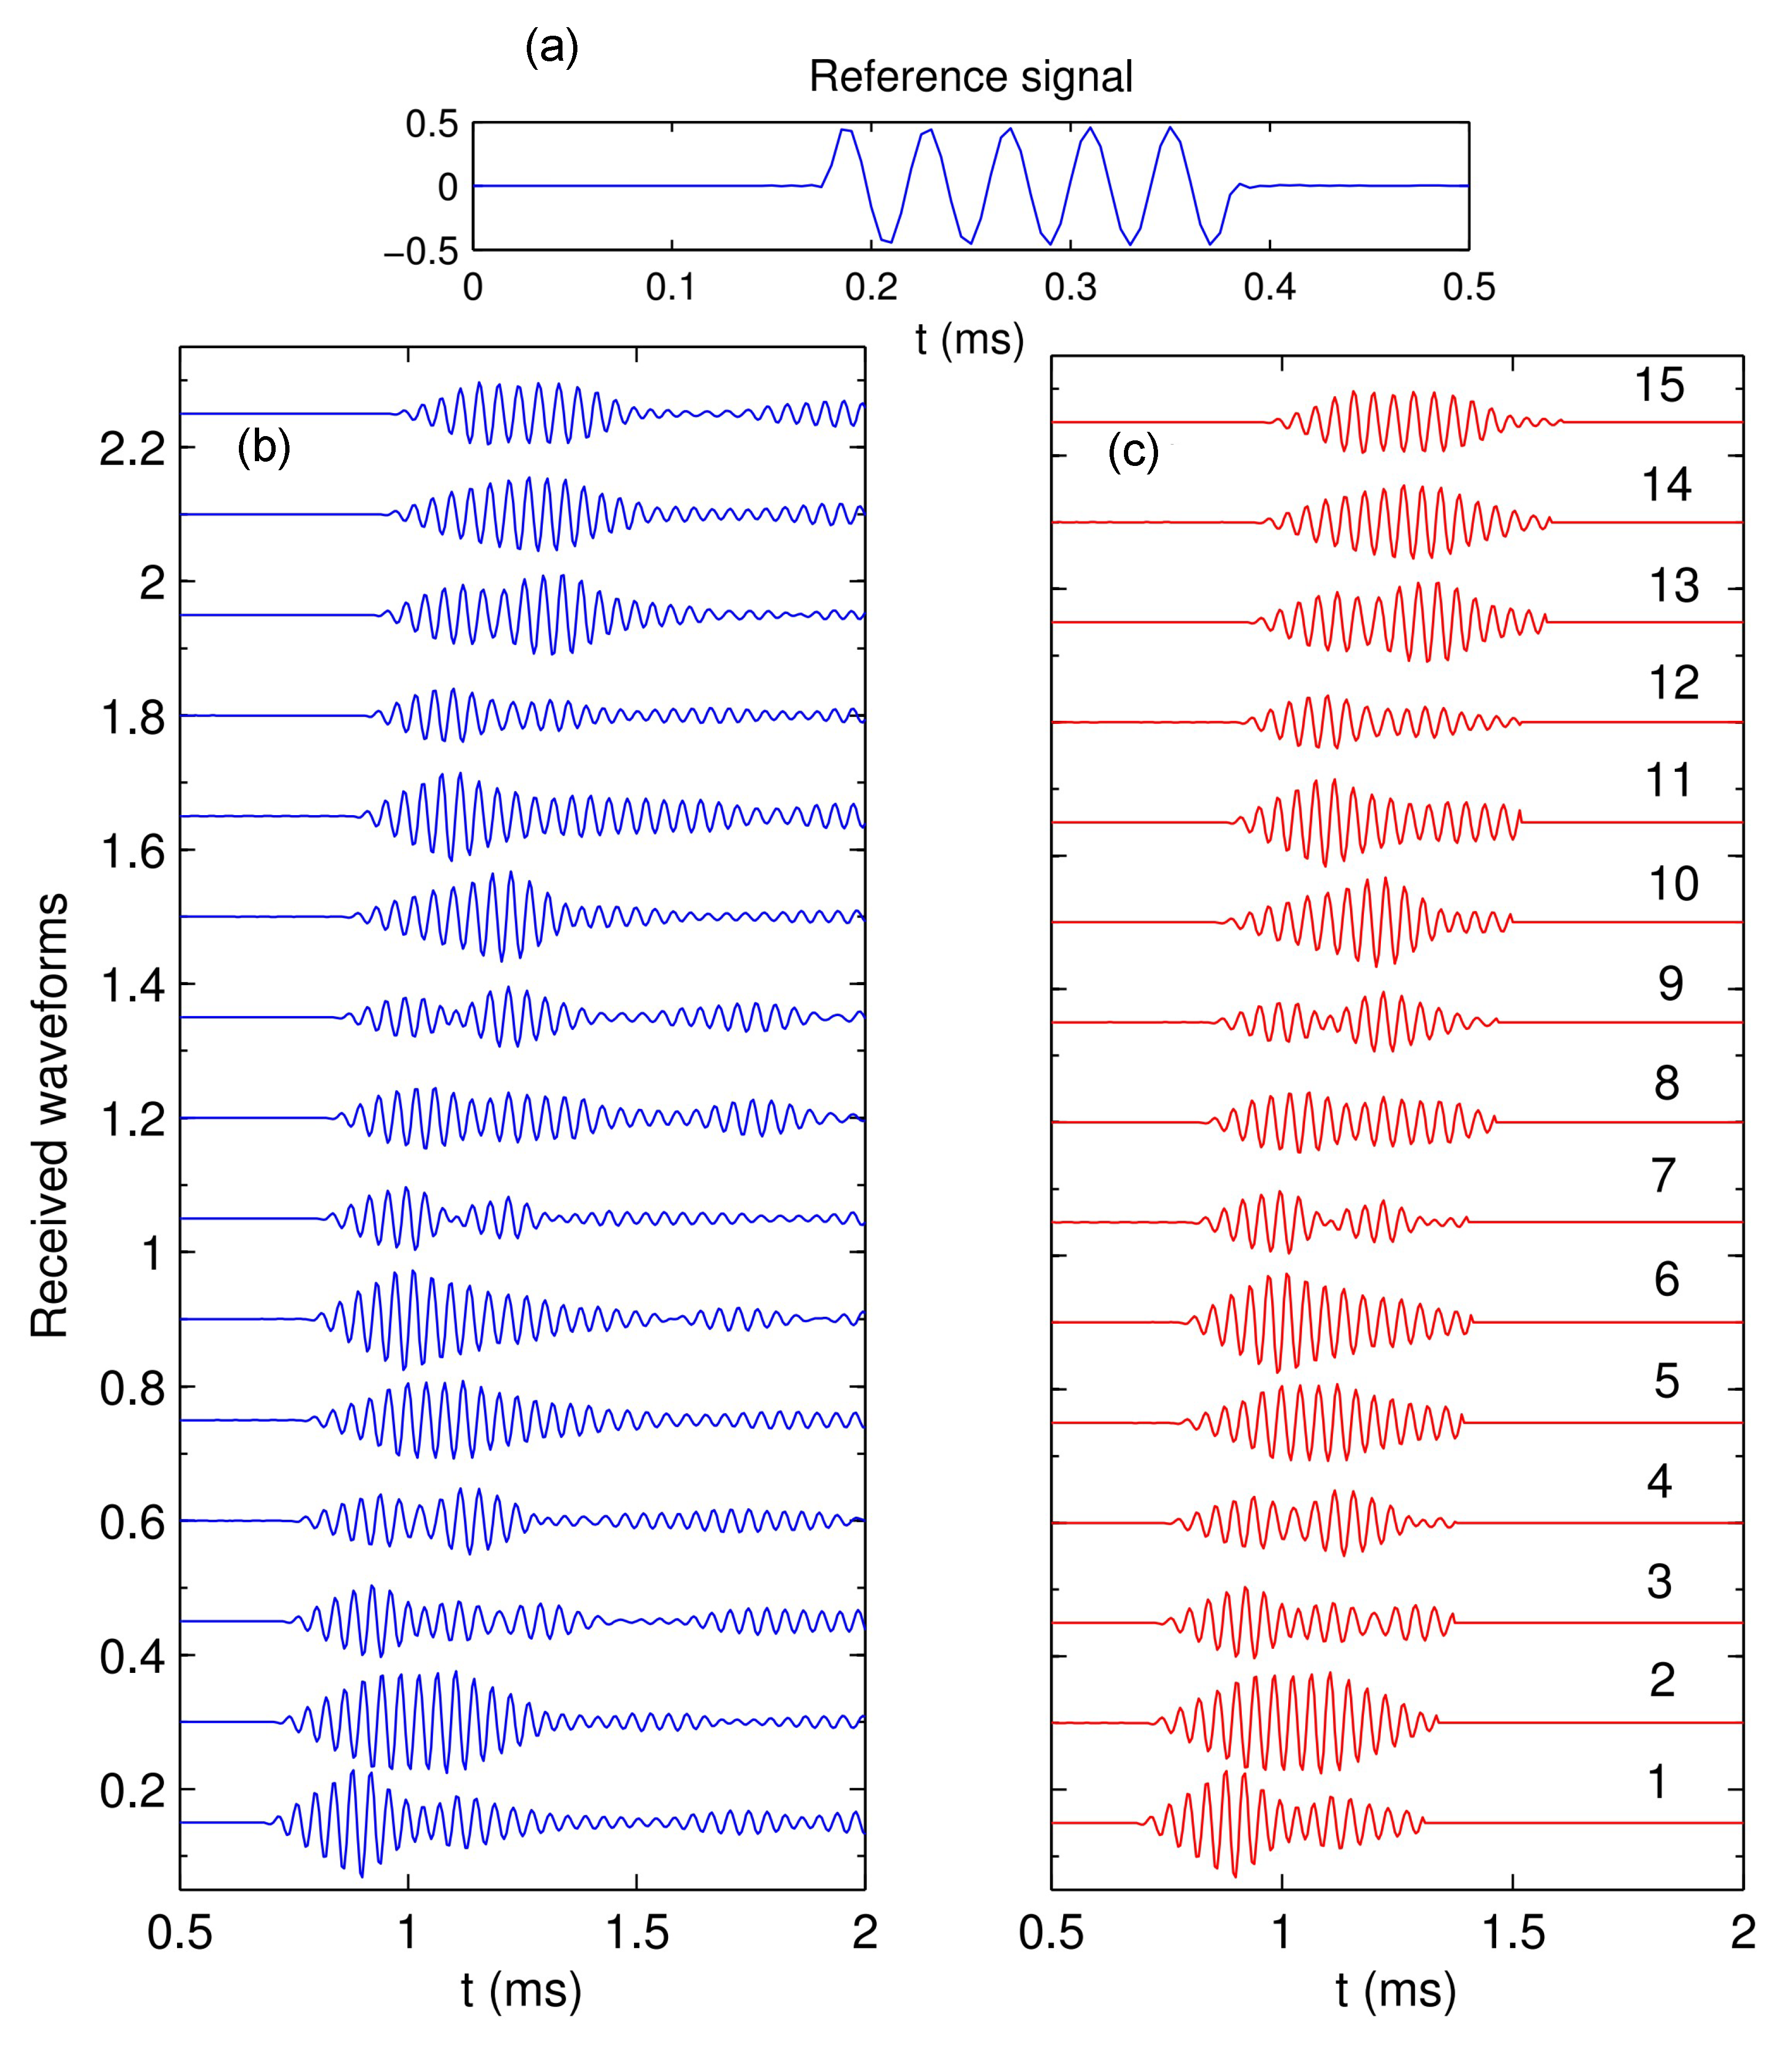
In order to improve the scattered grazing angle resolution, a virtual horizontal receiving array is adopted. For a grazing angle θ g = 30 relative to the surface of sand bottom and frequency f = 24.57 kHz, Figure 2a shows the output signal of a power amplifier, which is used as a reference signal for a measurement with a horizontal array of five hydrophones at z = z 1 . By three measurements with a horizontal array of five hydrophones, i.e., moving the horizontal receiving array shown in Figure 1d along the x-axis twice, three reference signals are obtained to synthetize a virtual receiving array of 15 hydrophones. Figure 2b illustrates the received waveforms of array1, each of which represents the temporal correlation between the received sound pressure by each hydrophone and the corresponding reference signal. By the temporal correlation, the virtual receiving array plays a role as a real receiving array of the same length; therefore, the received waveforms by the virtual array are used to obtain the complex pressure for beamforming. In order to eliminate the effects of reverberation in the water tank, the received waveforms are truncated by assuming the pulse duration of incident waves and scattered waves from sand ripples are almost the same for each hydrophone, and the truncated waveforms are illustrated in Figure 2c. For the other grazing angles and frequencies, the received waveforms are obtained in the same way as above.
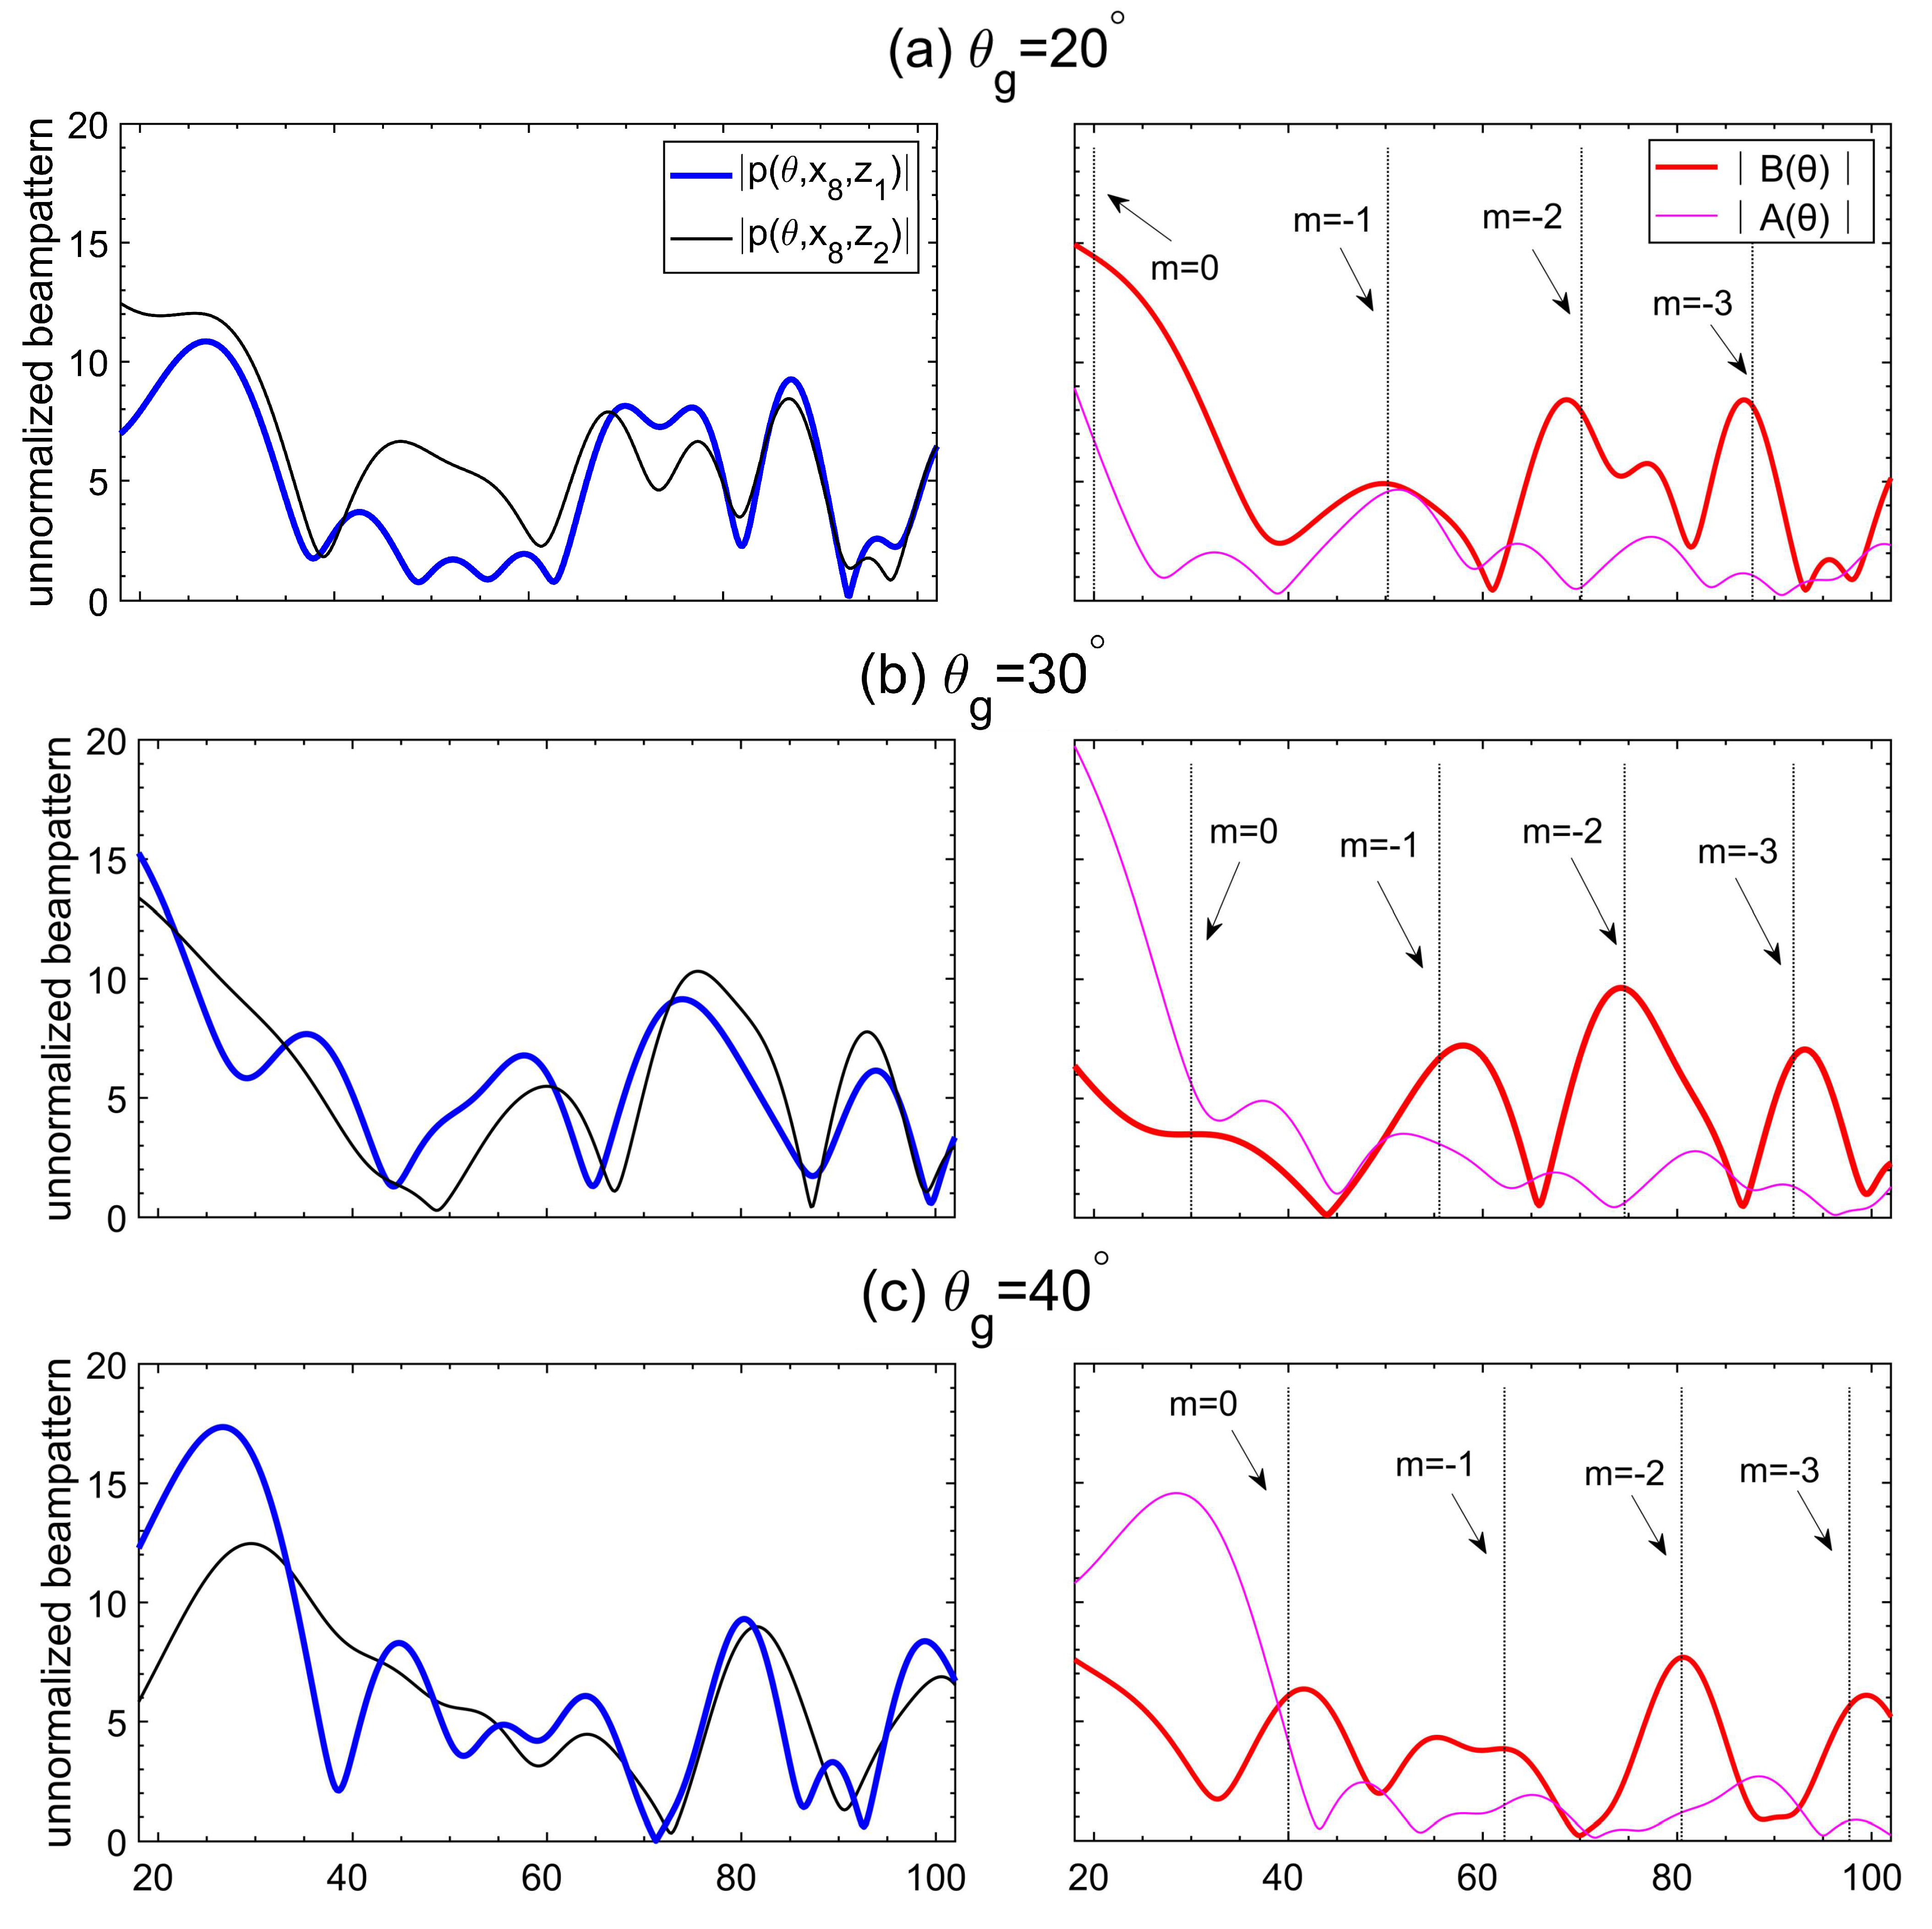
By the fast Fourier transform of the truncated waveforms, we obtain the complex pressure p x n , z for each hydrophone located at position x n , z with n = 1 , 2 , . . . , 15 . The unnormalized beam pattern is defined as p θ , x 8 , z using Equation (3), where x 8 , z is the central position of the array, and the beampatterns for two virtual receiving array1 and array2 are obtained by setting z = z 1 and z = z 2 , respectively. We can not discriminate the incident waves from the scattered waves by p θ , x 8 , z , in which the grazing angle θ represents either the incident grazing angle θ relative to the center of the receiving array or the scattered grazing angle θ s . In order to extract the scattered waves from the received waveforms, by substituting the complex beamoutput p θ , x 8 , z 1 and p θ , x 8 , z 2 of two virtual receiving arrays into Equation (2), we obtain two beampatterns B θ and A θ , which correspond to the upward propagating waves and the downward propagating waves, respectively.

3.3. Analysis of Experimental Data

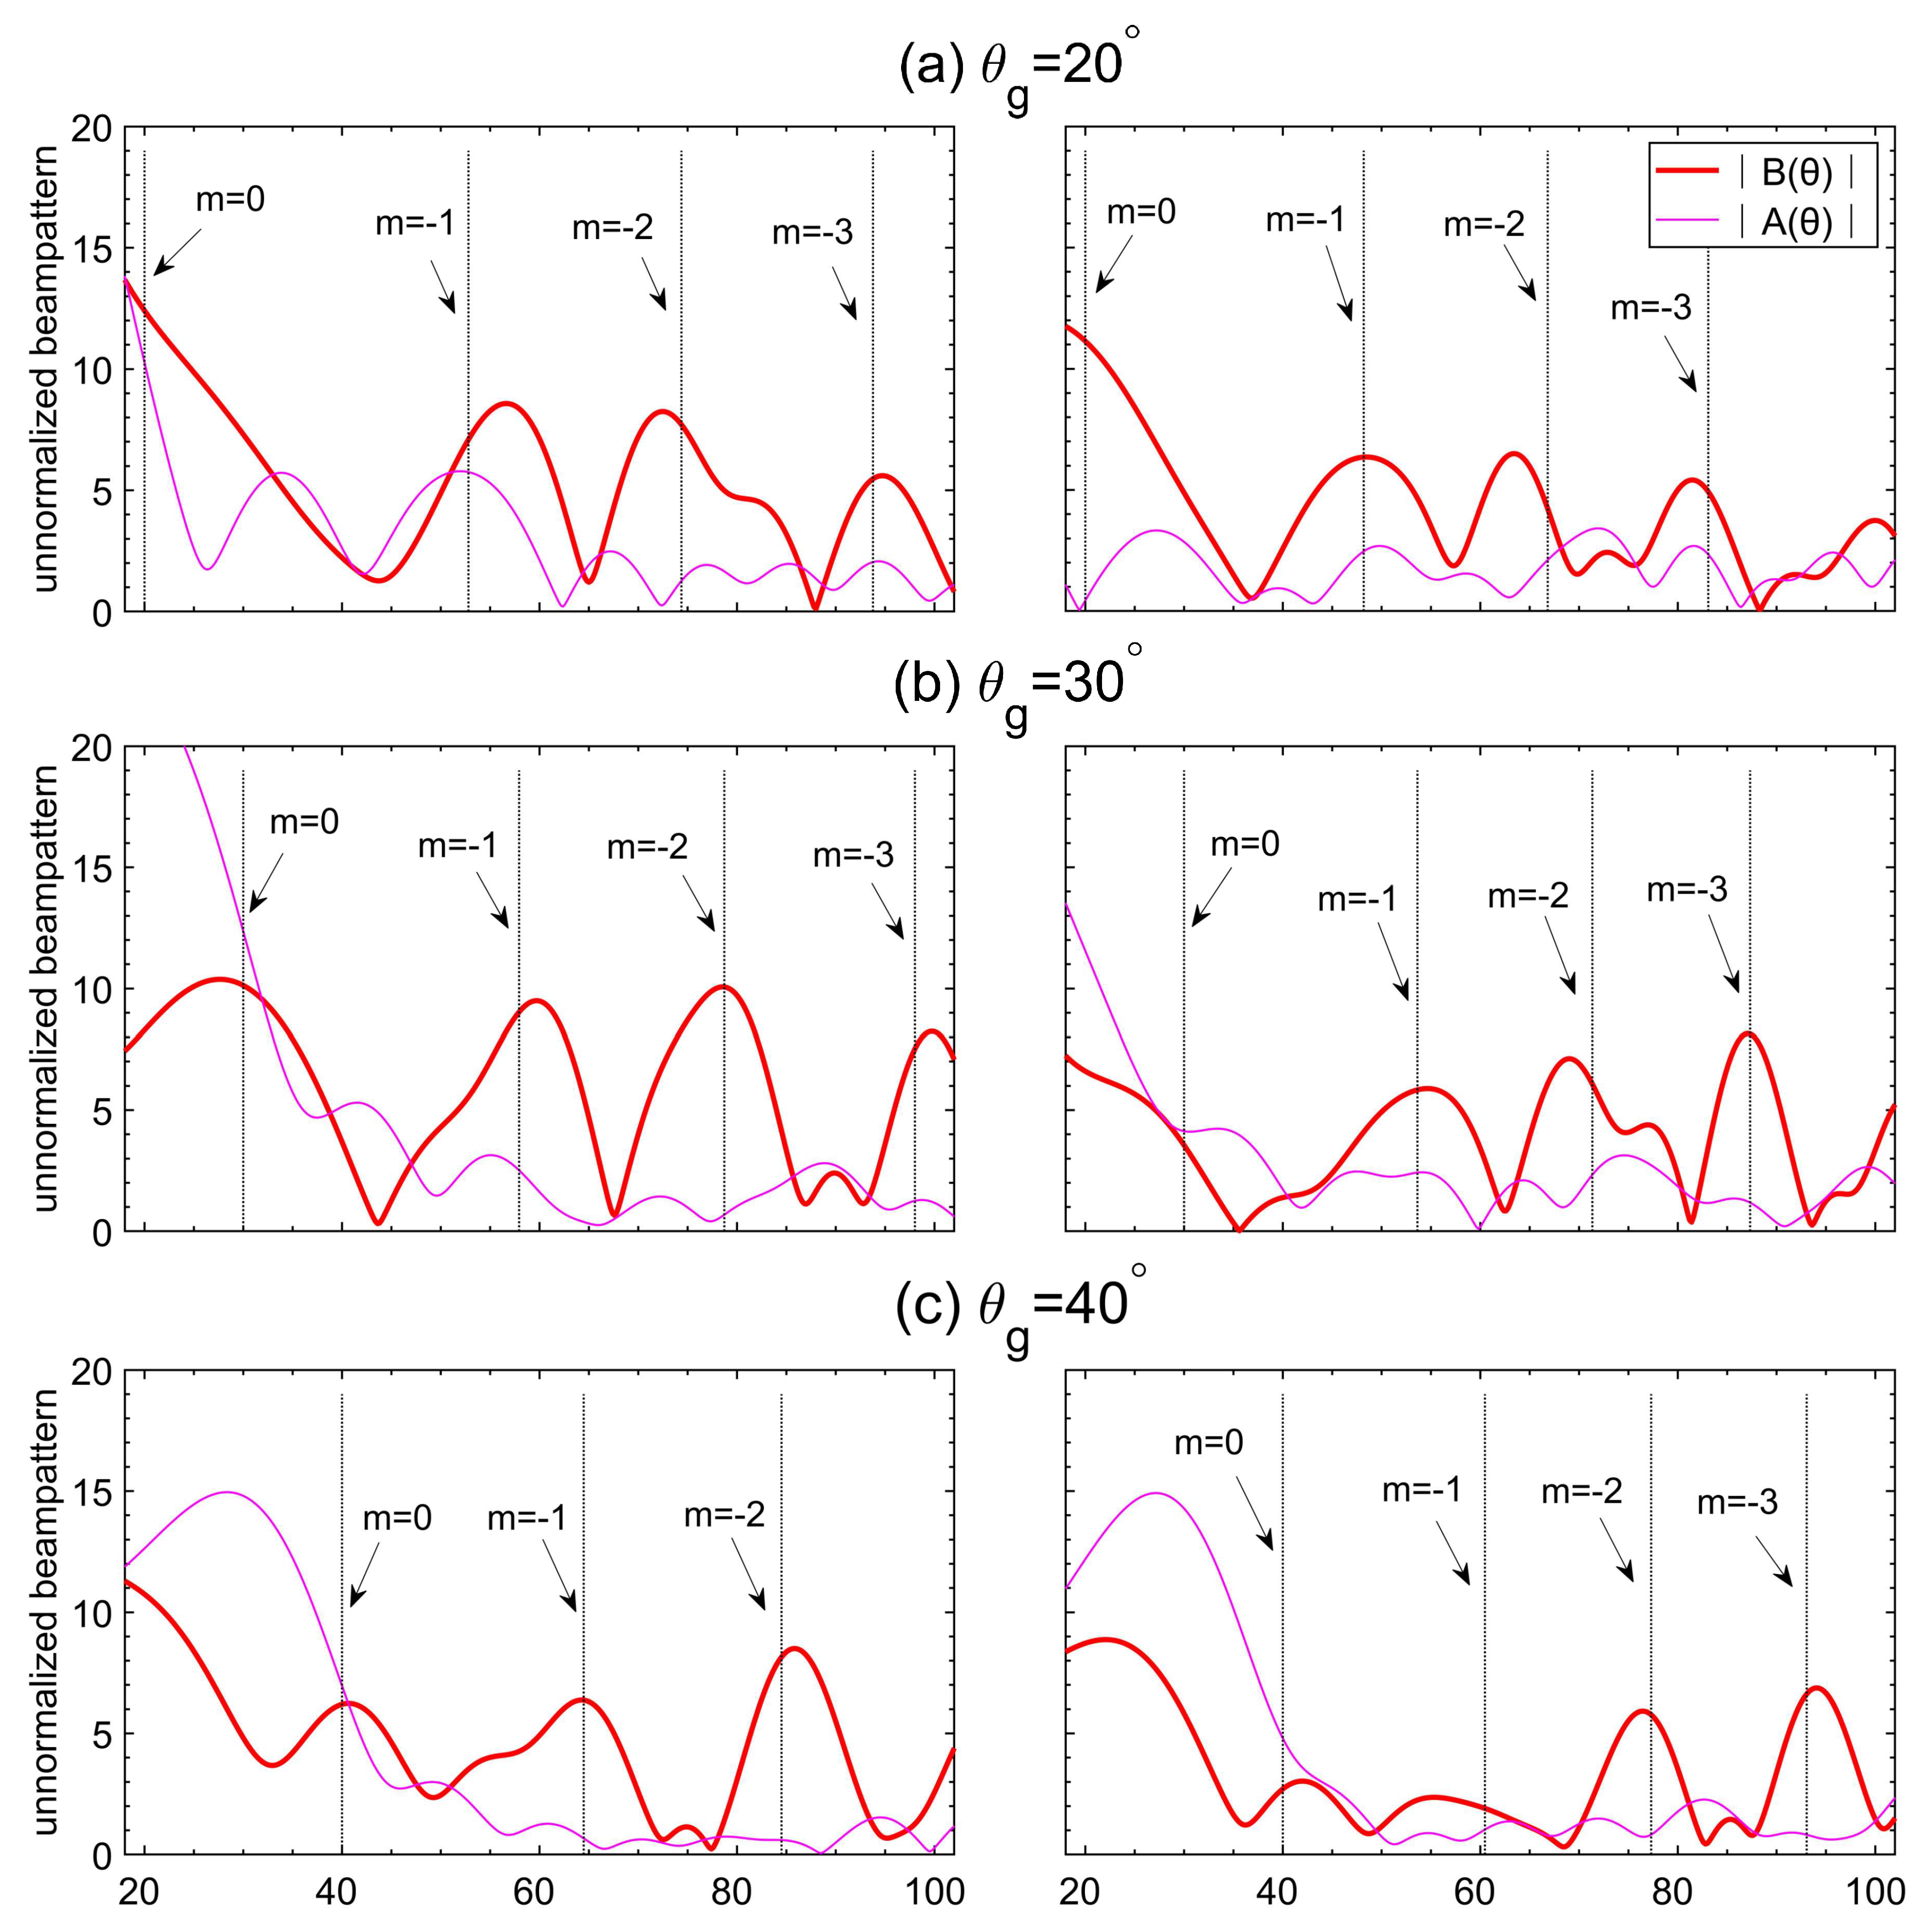
By using two horizontal receiving arrays at z = z 1 and z = z 2 to eliminate the incident wave, the high order Bragg scatterings are clearly discerned in Figure 3 and Figure 4, and the distribution of forward scattering amplitude demonstrates a distinct feature. Figure 3 illustrates the unnormalized beampatterns obtained at frequency f = 24.57 kHz for three different incident grazing angles θ g = 20 , 30 , 40 relative to the surface of the sand bottom. In the right column of Figure 3, the beampatterns of upward ( B θ ) and downward ( A θ ) propagating waves extracted from the beamforming outputs of two single arrays are illustrated, where Bragg angles θ s m at which the m-th order scattering occurs are marked by dotted lines. The θ s m satisfies the Bragg condition k cos θ s m = k cos θ g + 2 m π π Λ Λ , in which m is an integer, Λ the spatial period of sand ripples, and k the wavenumber. It is seen that Bragg angles θ s m predicted by the Bragg condition are consistent with the peak positions of B θ (upward propagating waves), and the values of A θ (downward propagating waves) at these Bragg angles are small; therefore, we believe Equation (2) is valid in extracting the scattered wave from the total field. It is also interesting to observe that the high order Bragg scattering amplitude does not decrease rapidly with the scattering order m , and this phenomenon is different from sound scattering from rough surfaces of small amplitude. In addition, the 0-th scattering amplitude is large at θ g = 20 , and has an obvious decrease at θ g = 30 and θ g = 40 , which is consistent with experimental measurement carried by Choi et al. [31]. Unfortunately, we can not discern the incident grazing angle θ for θ g = 20 , 30 , due to the lower grazing angle resolution of conventional beamforming and the sensitivity of Equation (2) to errors at small grazing angles. However, at θ g = 40 , the incident grazing angle θ = 27 . 4 is discerned from the peak position of the beampattern A θ , which slightly deviates from θ 31 determined by the position of source and the center of receiving array. Figure 4 illustrates the unnormalized beampatterns obtained at frequencies f = 22 kHz ( d < λ λ 2 2 ) and f = 27 kHz ( d > λ λ 2 2 ). High order Bragg scatterings are also observed, resulting in a slow decrease of the scattering amplitude away from the specular direction. In addition, at θ g = 40 , we obtain the incident grazing angles θ from the beampatterns A θ , i.e., θ 29 . 4 for f = 22 kHz and θ 27 . 2 for f = 27 kHz.

3.4. Theoretical Interpretation

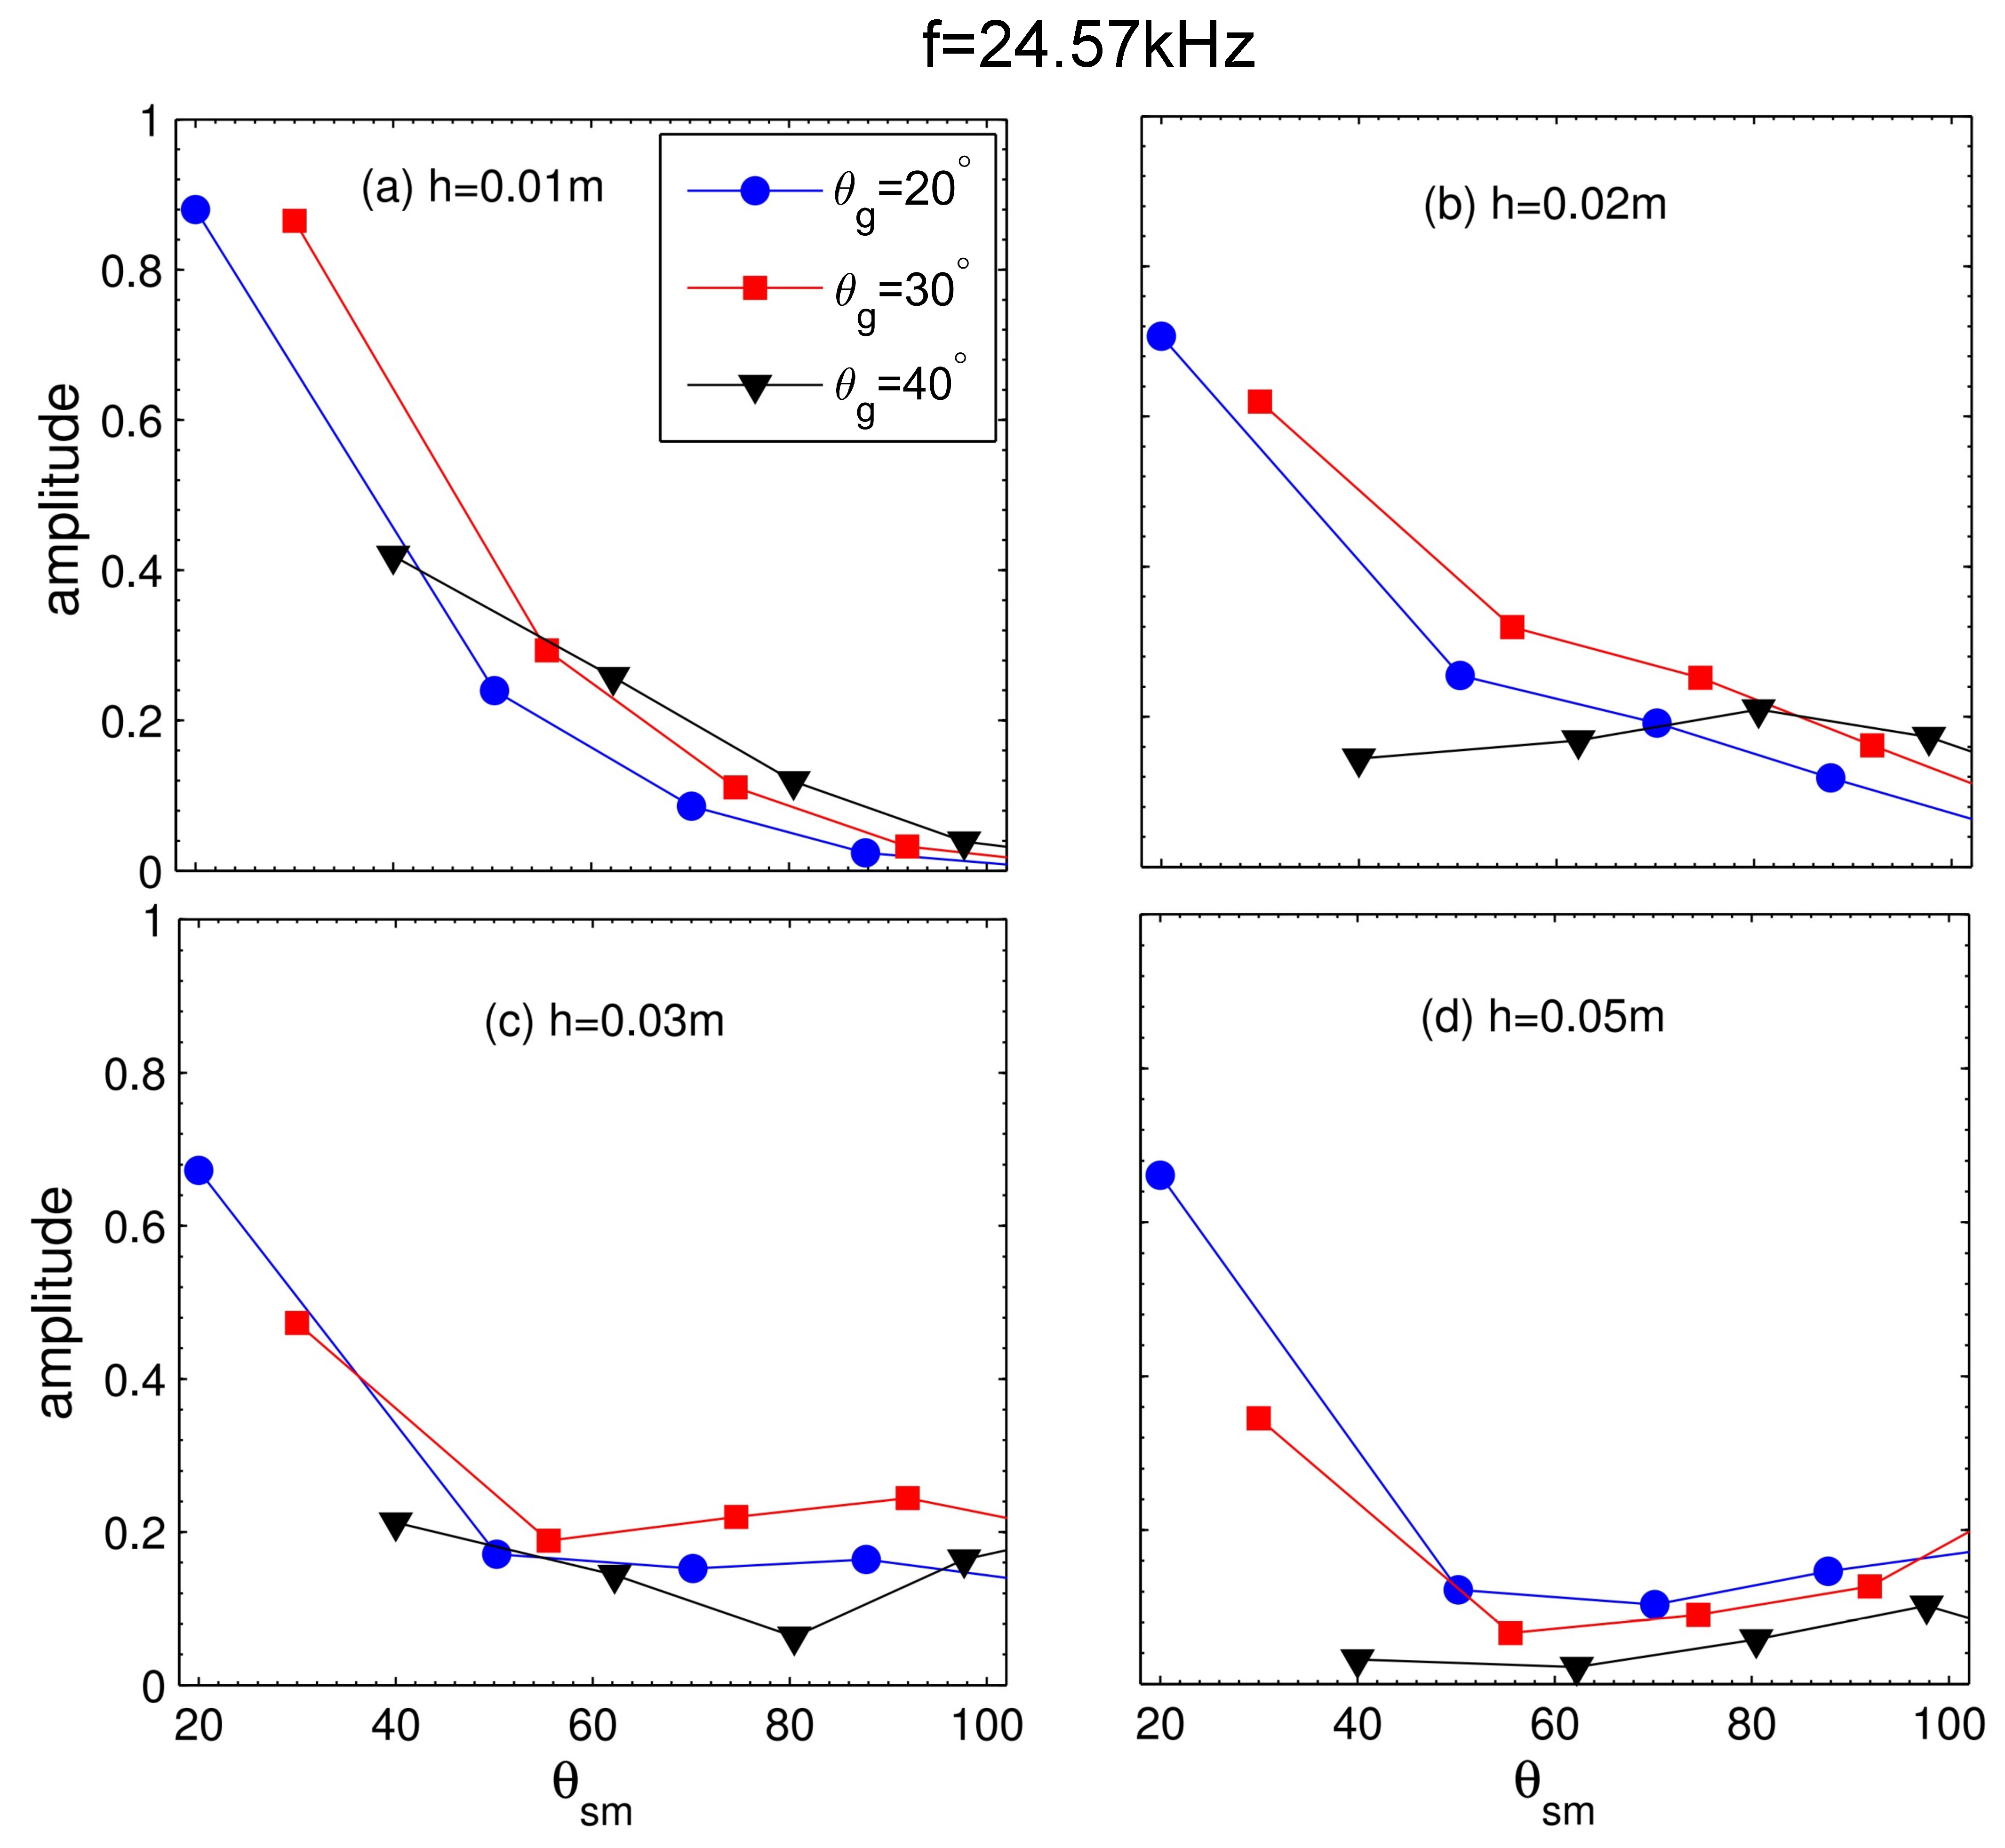
In order to well understand the experimental observation of forward scattering from sand ripples, by using the method developed by Yu and Peng [42], we calculate scattering amplitudes at different scattered grazing angles θ s m for a plane wave incident on a periodic surface of sand bottom under three different incident grazing angles θ g . In calculations, sound speed in sand is chosen to be 1800 m/s, and the other parameters are the same as the experiment except for the surface amplitude h. Since similar scattering features are observed in experiments for three frequencies, the scattering amplitudes are calculated only at frequency f = 24.57 kHz. Figure 5 illustrates scattering amplitudes for four different surface amplitudes h of sand ripples. For the small incident grazing angle, for example, θ g = 20 , the 0-th scattering amplitude (scattering in the specular direction) is large, whereas, for θ g = 40 , there is a reduction of the 0-th scattering amplitude, which is confirmed by the experimental measurement. It is shown in Figure 5a,b that the scattering amplitude decreases rapidly with the scattered grazing angle θ s m for θ g = 20 and θ g = 30 when the surface amplitude is small. However, the diffuseness of the scattering amplitude is increased with the surface amplitude as illustrated in Figure 5c,d, i.e., high order Bragg scattering becomes strong, resulting in the distribution of scattering amplitude different from that in Figure 5a,b. By comparing the experimental measurement with the theoretical calculation, it is found that our experiment result is consistent with the theoretical calculation.

4. Conclusions

A water tank experiment has been carried out to investigate forward scattering from very rough sand ripples, and the height of sand ripples is on the order of wavelength. It is confirmed that high order Bragg scattering can be measured, and the measured Bragg angles are consistent with the theoretical predictions. It is also interesting to observe that the high order Bragg scattering amplitude does not decrease rapidly with the scattering order, and this phenomenon is different from sound scattering from a rough surface of small amplitude. To sum up, our result demonstrates that the distribution of forward scattering amplitudes has obvious dependence on the ripple height, and the diffuseness of the scattering amplitude is increased with the ripple height. This characteristic should be considered in the modeling of the bistatic scattering from the rough seafloors.

Author Contributions

Conceptualization, L.P. and G.Y.; methodology, L.W., G.Y. and M.L.; software, L.W., G.Y. and M.L.; validation, L.W., G.Y. and M.L.; formal analysis, L.W., G.Y. and M.L.; investigation, L.W., M.L. and L.P.; resources, G.Y., Y.R. and L.P.; writing—original draft preparation, L.W., G.Y. and M.L.; writing—review and editing, L.W., M.L., L.P. and G.Y.; visualization, L.W., M.L. and Y.R.; supervision, L.P., G.Y. and Y.R.; project administration, L.P. and G.Y.; funding acquisition, L.P. and L.W. All authors have read and agreed to the published version of the manuscript.

Funding

This research was funded by the National Natural Science Foundation of China (Grant No. 11474258) and the State Key Laboratory of Acoustics, Chinese Academy of Sciences (Grant No. SKLA202206).

Institutional Review Board Statement

Not applicable.

Informed Consent Statement

Not applicable.

Data Availability Statement

Not applicable.

Conflicts of Interest

The authors declare no conflict of interest.

References

  1. Brown, D.C.; Brownstead, C.F.; Lyons, A.P.; Gabrielson, T.B. Measurements of two-dimensional spatial coherence of normal-incidence seafloor scattering. J. Acoust. Soc. Am. 2018, 144, 2095–2108. [Google Scholar] [CrossRef] [PubMed] [Green Version]
  2. Weber, T.C.; Ward, L.G. Observations of backscatter from sand and gravel seafloors between 170 and 250 kHz. J. Acoust. Soc. Am. 2015, 138, 2169–2180. [Google Scholar] [CrossRef] [PubMed]
  3. Hefner, B.; Hodgkiss, W. Reverberation due to a moving, narrowband source in an ocean waveguide. J. Acoust. Soc. Am. 2019, 146, 1661. [Google Scholar] [CrossRef] [PubMed]
  4. Lopes, J.; Williams, K.; Kargl, S.; Hefner, T.; Thorsos, E.; Marston, P.; Paustian, I.; Lim, R. Monostatic and bistatic measurements of targets resting on or buried under the seafloor. J. Acoust. Soc. Am. 2009, 125, 2701. [Google Scholar] [CrossRef]
  5. Sabra, K.G.; Roux, P.; Song, H.C.; Hodgkiss, W.S.; Kuperman, W.; Akal, T.; Stevenson, J.M. Experimental demonstration of iterative time-reversed reverberation focusing in a rough waveguide. Application to target detection. J. Acoust. Soc. Am. 2006, 120, 1305–1314. [Google Scholar] [CrossRef]
  6. Yildiz, S.; Roux, P.; Rakotonarivo, S.T.; Marandet, C.; Kuperman, W. Target localization through a data-based sensitivity kernel: A perturbation approach applied to a multistatic configuration. J. Acoust. Soc. Am. 2014, 135, 1800–1807. [Google Scholar] [CrossRef]
  7. Boehme, H.; Chotiros, N.; Rolleigh, L.; Pitt, S.; Garcia, A.; Goldsberry, T.; Lamb, R. Acoustic backscattering at low grazing angles from the ocean bottom. Part I. Bottom backscattering strength. J. Acoust. Soc. Am. 1985, 77, 962–974. [Google Scholar] [CrossRef]
  8. Chotiros, N.; Boehme, H.; Goldsberry, T.; Pitt, S.; Lamb, R.; Garcia, A.; Altenburg, R. Acoustic backscattering at low grazing angles from the ocean bottom. Part II. Statistical characteristics of bottom backscatter at a shallow water site. J. Acoust. Soc. Am. 1985, 77, 975–982. [Google Scholar] [CrossRef]
  9. Jackson, D.R.; Baird, A.M.; Crisp, J.J.; Thomson, P.A. High-frequency bottom backscatter measurements in shallow water. J. Acoust. Soc. Am. 1986, 80, 1188–1199. [Google Scholar] [CrossRef]
  10. Jackson, D.R.; Winebrenner, D.P.; Ishimaru, A. Application of the composite roughness model to high-frequency bottom backscattering. J. Acoust. Soc. Am. 1986, 79, 1410–1422. [Google Scholar] [CrossRef]
  11. Stanic, S.; Briggs, K.; Fleischer, P.; Ray, R.; Sawyer, W. Shallow-water high-frequency bottom scattering off panama city, florida. J. Acoust. Soc. Am. 1988, 83, 2134–2144. [Google Scholar] [CrossRef]
  12. Stanic, S.; Briggs, K.B.; Fleischer, P.; Sawyer, W.; Ray, R. High-frequency acoustic backscattering from a coarse shell ocean bottom. J. Acoust. Soc. Am. 1989, 85, 125–136. [Google Scholar] [CrossRef]
  13. de Moustier, C.; Alexandrou, D. Angular dependence of 12-kHz seafloor acoustic backscatter. J. Acoust. Soc. Am. 1991, 90, 522–531. [Google Scholar] [CrossRef]
  14. Jackson, D.R.; Briggs, K.B. High-frequency bottom backscattering: Roughness versus sediment volume scattering. J. Acoust. Soc. Am. 1992, 92, 962–977. [Google Scholar] [CrossRef]
  15. Jackson, D.R.; Briggs, K.B.; Williams, K.L.; Richardson, M.D. Tests of models for high-frequency seafloor backscatter. IEEE J. Ocean. Eng. 1996, 21, 458–470. [Google Scholar] [CrossRef]
  16. Stanic, S.; Goodman, R.R.; Briggs, K.B.; Chotiros, N.P.; Kennedy, E.T. Shallow-water bottom reverberation measurements. IEEE J. Ocean. Eng. 1998, 23, 203–210. [Google Scholar] [CrossRef]
  17. Holland, C.W.; Hollett, R.; Troiano, L. Measurement technique for bottom scattering in shallow water. J. Acoust. Soc. Am. 2000, 108, 997–1011. [Google Scholar] [CrossRef]
  18. Williams, K.L.; Jackson, D.R.; Thorsos, E.I.; Tang, D.; Briggs, K.B. Acoustic backscattering experiments in a well characterized sand sediment: Data/model comparisons using sediment fluid and Biot models. IEEE J. Ocean. Eng. 2002, 27, 376–387. [Google Scholar] [CrossRef]
  19. Soukup, R.J.; Gragg, R.F. Backscatter from a limestone seafloor at 2–3.5 kHz: Measurements and modeling. J. Acoust. Soc. Am. 2003, 113, 2501–2514. [Google Scholar] [CrossRef]
  20. Hines, P.C.; Osler, J.C.; MacDougald, D.J. Acoustic backscatter measurements from littoral seabeds at shallow grazing angles at 4 and 8 kHz. J. Acoust. Soc. Am. 2005, 117, 3504–3516. [Google Scholar] [CrossRef]
  21. Williams, K.L.; Jackson, D.R.; Tang, D.; Briggs, K.B.; Thorsos, E.I. Acoustic backscattering from a sand and a sand/mud environment: Experiments and data/model comparisons. IEEE J. Ocean. Eng. 2009, 34, 388–398. [Google Scholar] [CrossRef]
  22. La, H.; Choi, J.W. 8-kHz bottom backscattering measurements at low grazing angles in shallow water. J. Acoust. Soc. Am. 2010, 127, EL160–EL165. [Google Scholar] [CrossRef] [PubMed]
  23. Jackson, D.R.; Odom, R.I.; Boyd, M.L.; Ivakin, A.N. A geoacoustic bottom interaction model (GABIM). IEEE J. Ocean. Eng. 2010, 35, 603–617. [Google Scholar] [CrossRef]
  24. Yu, S.; Liu, B.; Yu, K.; Yang, Z.; Kan, G.; Feng, Z.; Zong, L. Measurements of midfrequency acoustic backscattering from a sandy bottom in the South Yellow Sea of China. IEEE J. Ocean. Eng. 2017, 43, 1179–1186. [Google Scholar] [CrossRef]
  25. Ellis, D.D.; Crowe, D.V. Bistatic reverberation calculations using a three-dimensional scattering function. J. Acoust. Soc. Am. 1991, 89, 2207–2214. [Google Scholar] [CrossRef]
  26. Williams, K.L.; Jackson, D.R. Bistatic bottom scattering: Model, experiments, and model/data comparison. J. Acoust. Soc. Am. 1998, 103, 169–181. [Google Scholar] [CrossRef]
  27. Urick, R. Side scattering of sound in shallow water. J. Acoust. Soc. Am. 1960, 32, 351–355. [Google Scholar] [CrossRef]
  28. Stanic, S.; Kennedy, E.; Ray, R. Variability of shallow-water bistatic bottom backscattering. J. Acoust. Soc. Am. 1991, 90, 547–553. [Google Scholar] [CrossRef]
  29. Stanic, S.; Kennedy, E.; Ray, R. High-frequency bistatic reverberation from a smooth ocean bottom. J. Acoust. Soc. Am. 1993, 93, 2633–2638. [Google Scholar] [CrossRef]
  30. Day, C.M.; Yamamoto, T. Low grazing angle bistatic sea floor scattering on the Florida Atlantic coastal shelf. J. Acoust. Soc. Am. 1999, 106, 1744–1754. [Google Scholar] [CrossRef]
  31. Choi, J.W.; Na, J.; Seong, W. 240-kHz bistatic bottom scattering measurements in shallow water. IEEE J. Ocean. Eng. 2001, 26, 54–62. [Google Scholar] [CrossRef]
  32. Choi, J.W.; Na, J.; Yoon, K.S. High-frequency bistatic sea-floor scattering from sandy ripple bottom. IEEE J. Ocean. Eng. 2003, 28, 711–719. [Google Scholar] [CrossRef]
  33. Jackson, D.R.; Williams, K.L.; Thorsos, E.I.; Kargl, S.G. High-frequency subcritical acoustic penetration into a sandy sediment. IEEE J. Ocean. Eng. 2002, 27, 346–361. [Google Scholar] [CrossRef]
  34. Pouliquen, E.; Lyons, A.; Pace, N. Penetration of acoustic waves into rippled sandy seafloors. J. Acoust. Soc. Am. 2000, 108, 2071–2081. [Google Scholar] [CrossRef]
  35. Hefner, B.T.; Jackson, D.R.; Williams, K.L.; Thorsos, E.I. Mid-to high-frequency acoustic penetration and propagation measurements in a sandy sediment. IEEE J. Ocean. Eng. 2009, 34, 372–387. [Google Scholar] [CrossRef]
  36. Peng, L.; Yu, G. Subcritical penetration into rough seafloors due to Bragg scattering. J. Acoust. Soc. Am. 2013, 134, 166–175. [Google Scholar] [CrossRef]
  37. Jaud, V.; Sessarego, J.P.; Gervaise, C.; Stephan, Y. Bistatic scattering from an anisotropic rough surface in water tank. In Proceedings of the 4th International Conference on Underwater Acoustics Measurements, Kos Island, Greece, 20–24 June 2011; pp. 809–816. [Google Scholar]
  38. Jaud, V.; Sessarego, J.P.; Gervaise, C.; Stephan, Y. High frequency roughness scattering from various rough surfaces: Theory and laboratory experiments. Open J. Acoust. 2012, 2, 50–59. [Google Scholar] [CrossRef] [Green Version]
  39. Calvo, D.C.; Nicholas, M.; Fialkowski, J.M.; Gauss, R.C.; Olson, D.R.; Lyons, A.P. Scale-model scattering experiments using 3D printed representations of ocean bottom features. In Proceedings of the OCEANS 2015-MTS/IEEE Washington, Washington, DC, USA, 19–22 October 2015; pp. 1–7. [Google Scholar]
  40. Tamura, M. Spatial Fourier transform method of measuring reflection coefficients at oblique incidence. I: Theory and numerical examples. J. Acoust. Soc. Am. 1990, 88, 2259–2264. [Google Scholar] [CrossRef]
  41. Tamura, M.; Allard, J.F.; Lafarge, D. Spatial Fourier-transform method for measuring reflection coefficients at oblique incidence. II. Experimental results. J. Acoust. Soc. Am. 1995, 97, 2255–2262. [Google Scholar] [CrossRef]
  42. Yu, G.; Peng, L. Range of validity of the Rayleigh hypothesis for sound wave scattering from a periodic seafloor. IEEE J. Ocean. Eng. 2014, 39, 779–787. [Google Scholar] [CrossRef]
  43. Welton, P.; Frey, H.; Moore, P. Experimental measurements of the scattering of acoustic waves by rough surfaces. J. Acoust. Soc. Am. 1972, 52, 1553–1563. [Google Scholar] [CrossRef]
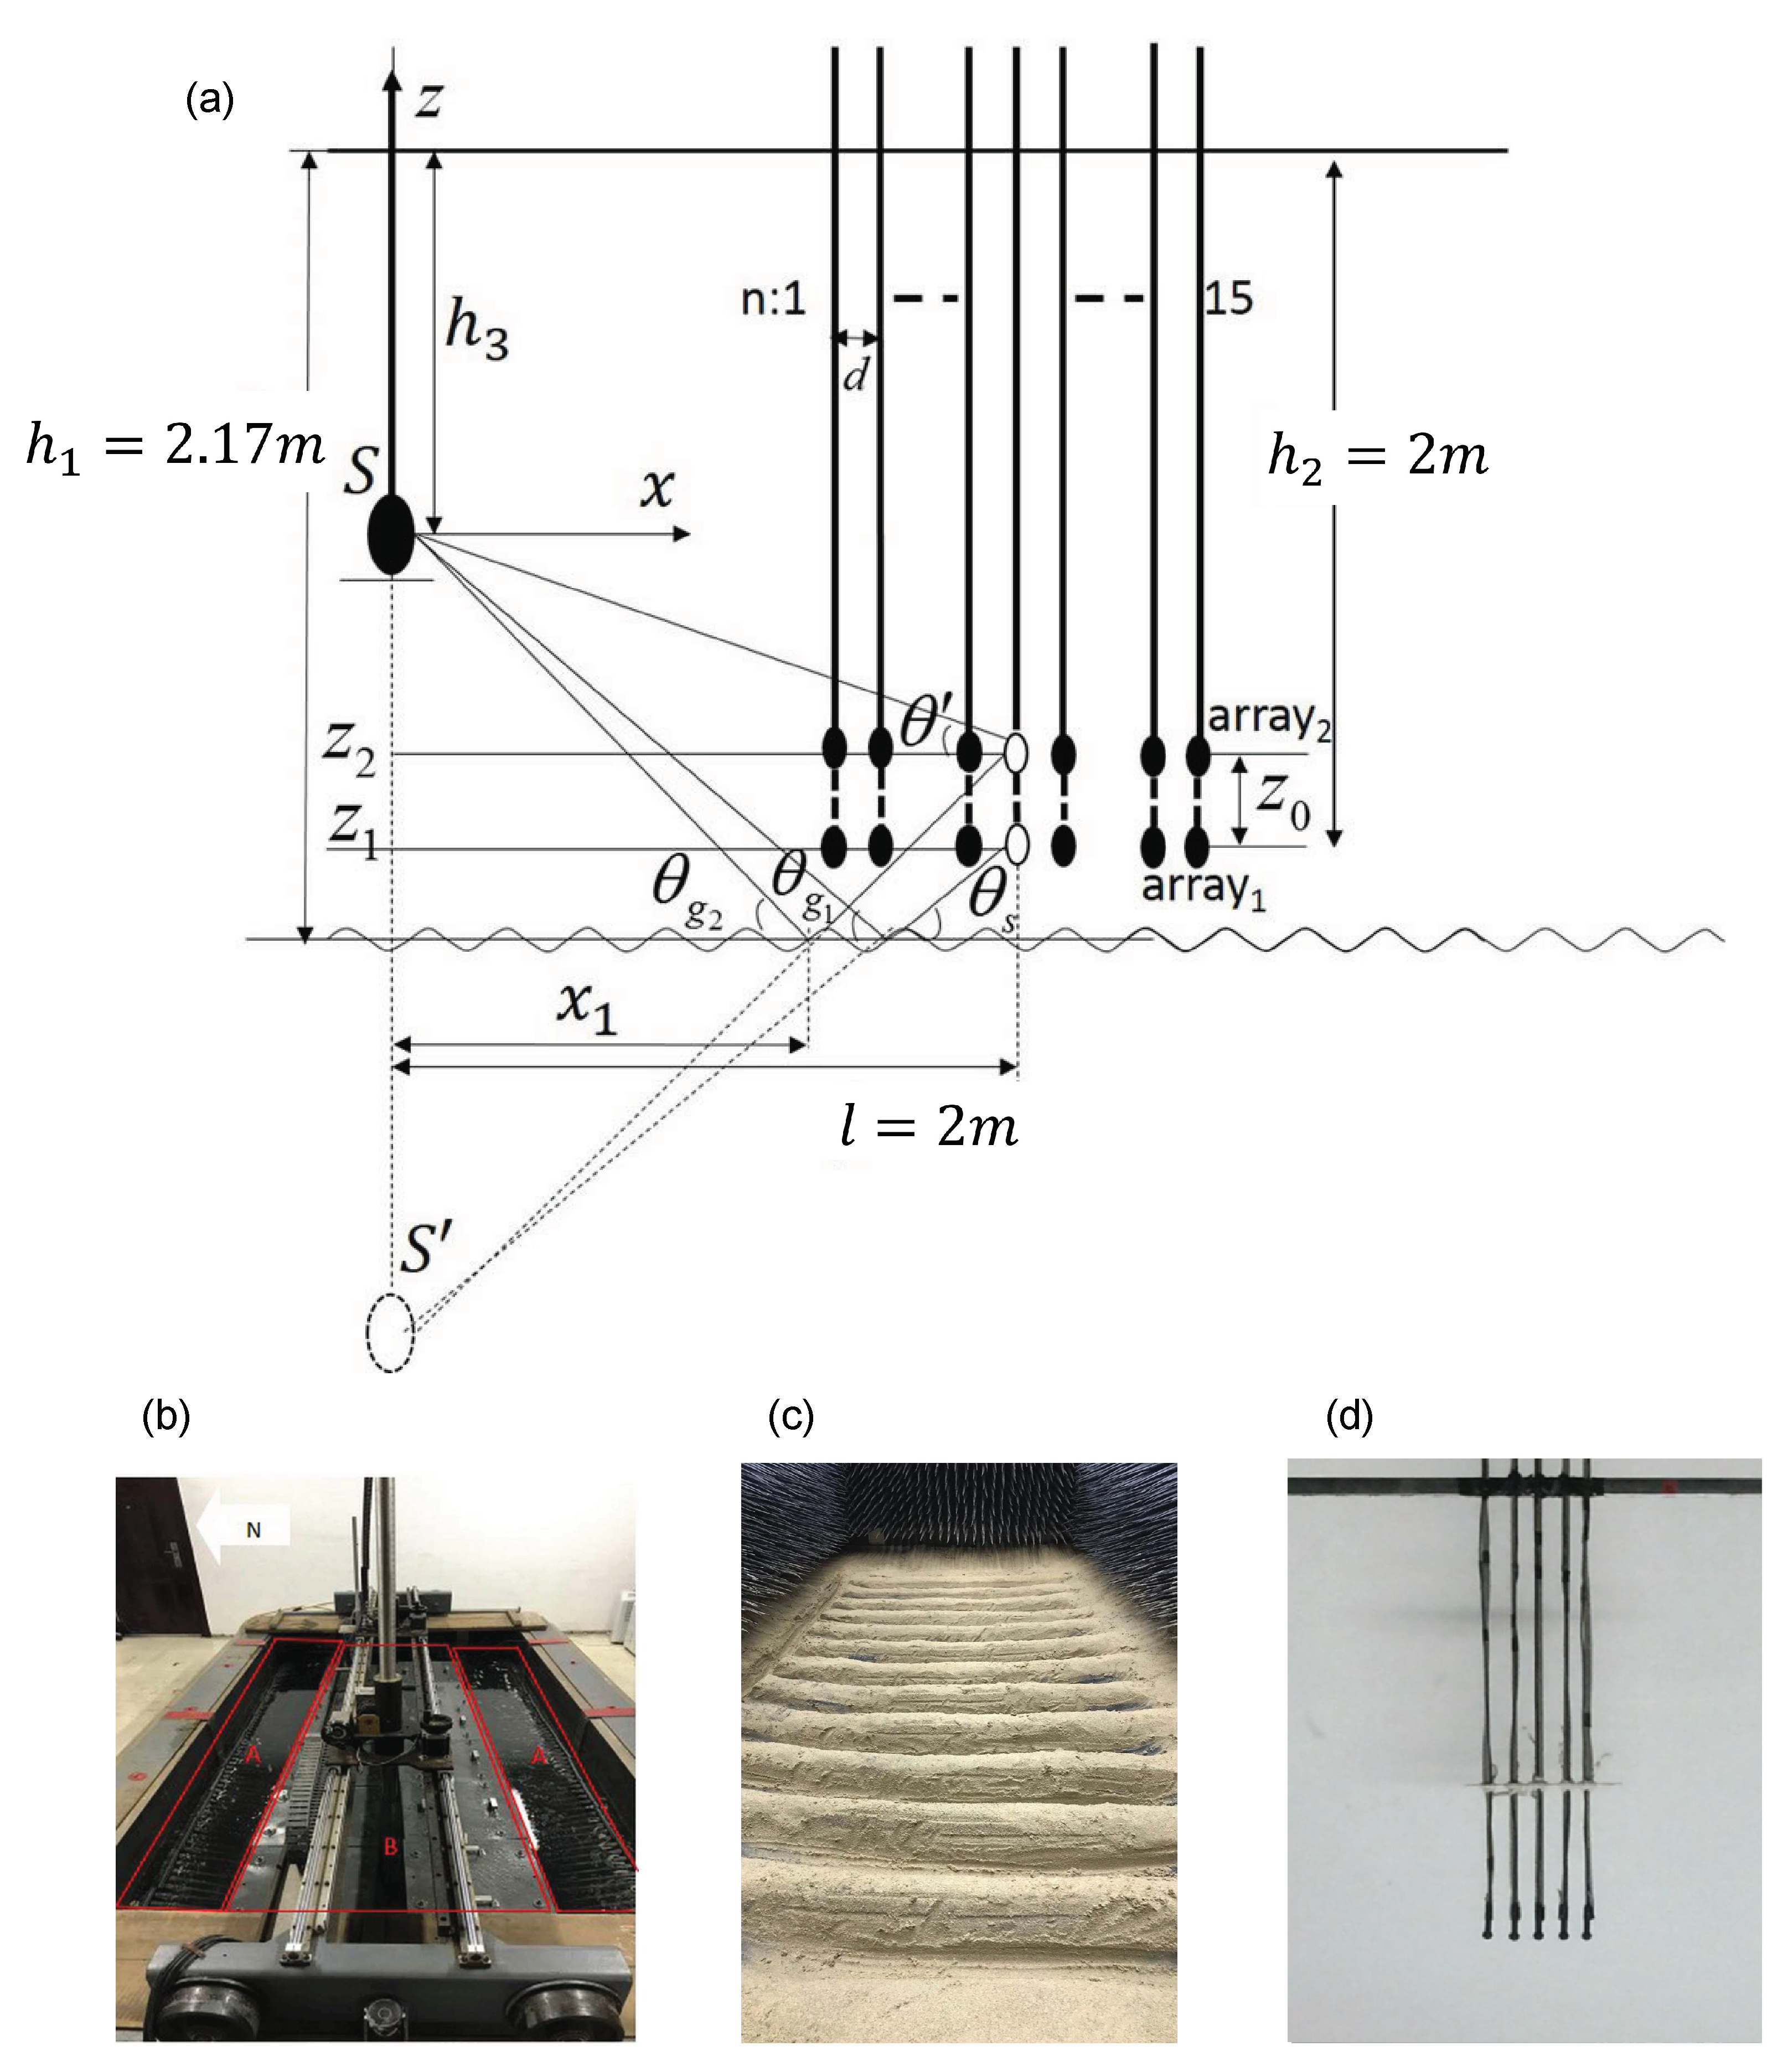
Figure 1. Experimental setup for scattering from sand ripples of surface amplitude h = 5 cm and spatial period Λ = 0.2 m in water tank. In addition, the following parameters h 1 = 2.17 m, h 2 = 2 m, l = 1.5 m, z 0 = 1 cm, d = 3 cm are fixed, whereas the depth h 3 of source is adjusted to obtain different incident grazing angles θ g . (a) a schematic diagram; (b) water tank in experiment; (c) sand ripples in the tank; (d) a horizontal receiving array.
Remotesensing 14 03865 g001
Figure 2. Received waveforms by the receiving array1 of 15 hydrophones located at z = z 1 , where sound waves are incident at an grazing angle θ g = 30 relative to the surface of sand bottom and frequency f = 24.57 kHz. (a) reference signal for a measurement with a horizontal array of five hydrophones at z = z 1 ; (b) received waveforms (temporal correlation between the received sound pressure and the corresponding reference signal); (c) the truncated waveforms adopted for beamforming are marked by numbers from n = 1 to n = 15.
Remotesensing 14 03865 g002
Figure 3. Beamforming output at frequency f = 24.57 kHz ( d = λ / 2 ) for three different incident grazing angles, θ g = 20 in (a), θ g = 30 in (b), and θ g = 40 in (c), where the left column of figure is for the beampatterns obtained just by a single array, and the right column is for the beampatterns of upward ( B θ ) and downward ( A θ ) propagating waves extracted from the beamforming outputs of two single arrays. The dotted lines represent the scattered grazing angles predicted by the Bragg condition.
Remotesensing 14 03865 g003
Figure 4. Beamforming output for three different incident grazing angles, θ g = 20 in (a), θ g = 30 in (b), and θ g = 40 in (c). The left column of figure is for frequency f = 22 kHz ( d < λ / 2 ), whereas the right column is for f = 27 kHz ( d > λ / 2 ). The dotted lines represent the scattered grazing angles predicted by the Bragg condition.
Remotesensing 14 03865 g004
Figure 5. Dependence of the scattering amplitude on the scattered grazing angle θ s m at three different incident grazing angles ( θ g = 20 ; 30 ; 40 ) for frequency f = 24.57 kHz. (a) h = 0.01 m; (b) h = 0.02 m; (c) h = 0.03 m; (d) h = 0.05 m.
Remotesensing 14 03865 g005
Publisher’s Note: MDPI stays neutral with regard to jurisdictional claims in published maps and institutional affiliations.