
Development of a Scale for COVID-19 Stigma and Its Psychometric Properties: A Study among Pregnant Japanese Women

 , , and
Abstract
:1. Introduction
2. Methods
2.1. Study Procedures and Participants
2.2. Measurements
2.3. Data Analysis
2.4. Ethical Considerations
3. Results
3.1. Characteristics of the Participants
3.2. Scale Items
3.3. EFA
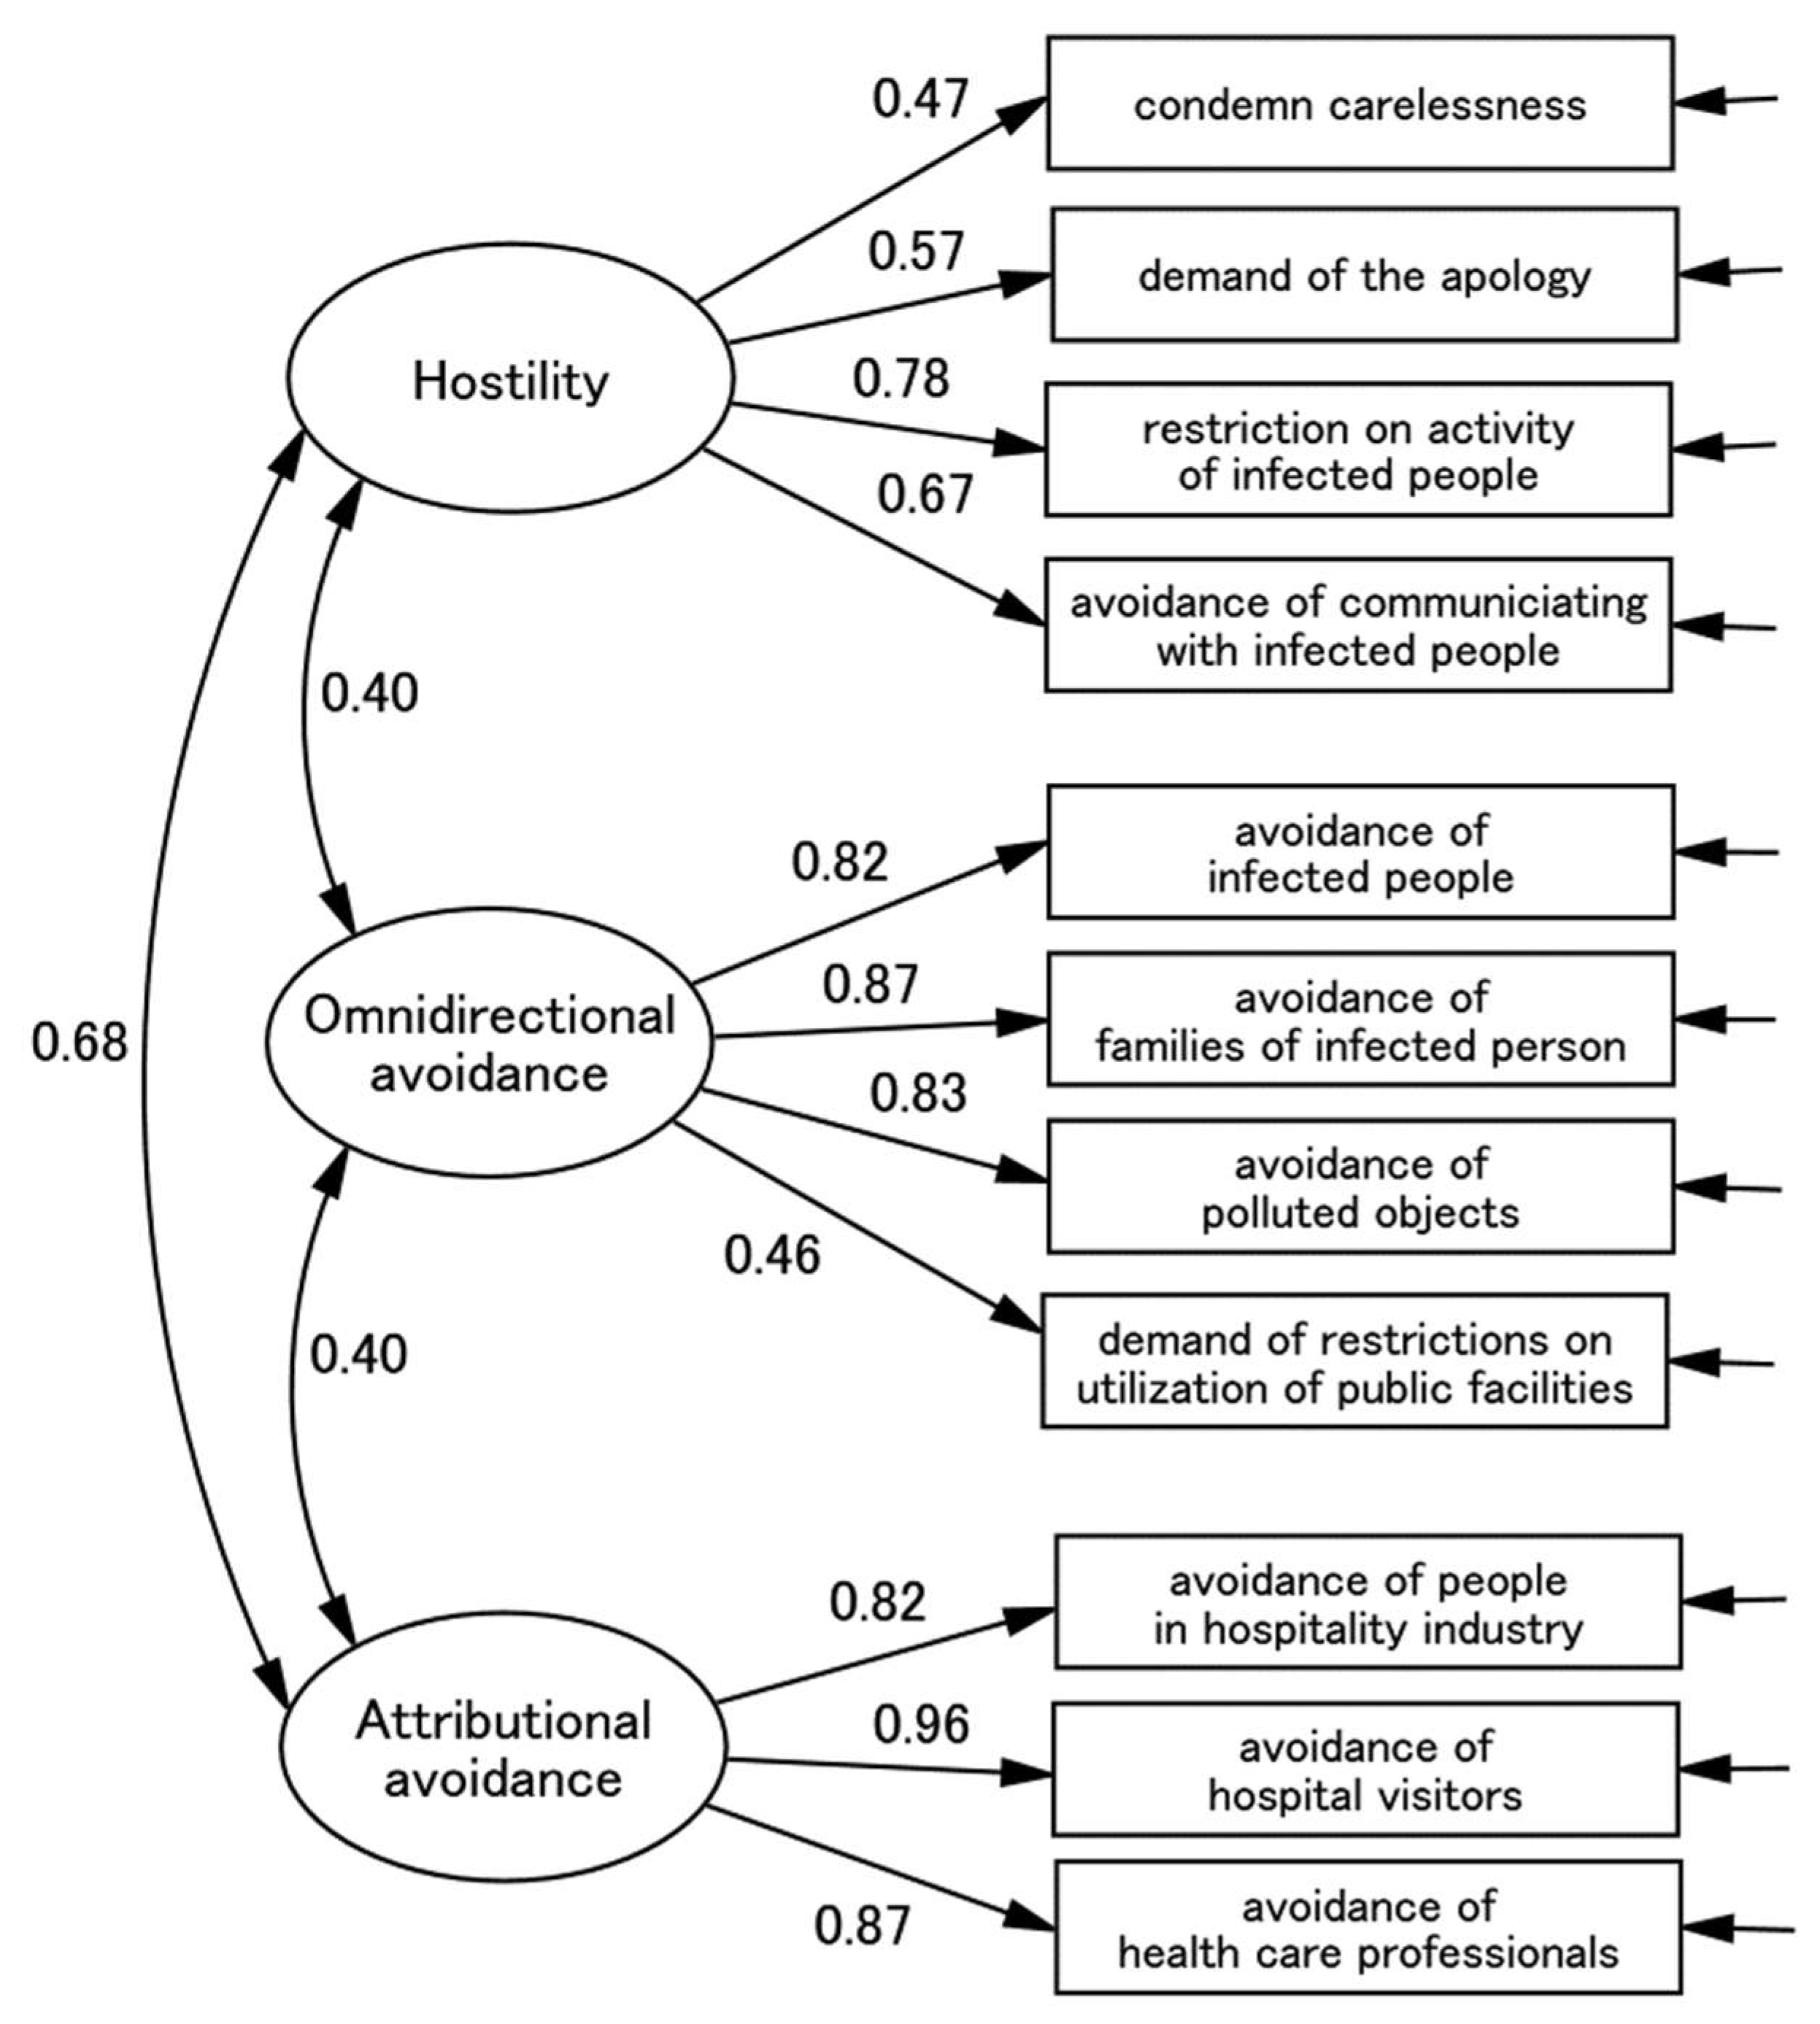
3.4. CFA
3.5. Measurement Invariance
3.6. Construct Validity
4. Discussion
Author Contributions
Funding
Institutional Review Board Statement
Informed Consent Statement
Data Availability Statement
Acknowledgments
Conflicts of Interest
References
- Abdelhafiz, A.S.; Alorabi, M. Social Stigma: The Hidden Threat of COVID-19. Front. Public Health 2020, 8, 429. [Google Scholar] [CrossRef]
- Yoshioka, T.; Maeda, Y. COVID-19 Stigma Induced by Local Government and Media Reporting in Japan: It’s Time to Reconsider Risk Communication Lessons From the Fukushima Daiichi Nuclear Disaster. J. Epidemiol. 2020, 30, 372–373. [Google Scholar] [CrossRef] [PubMed]
- Link, B.G.; Phelan, J.C. Conceptualizing Stigma. Annu. Rev. Sociol. 2001, 27, 363–385. [Google Scholar] [CrossRef]
- Link, B.G.; Phelan, J.C. Stigma and its public health implications. Lancet 2006, 367, 528–529. [Google Scholar] [CrossRef]
- Bagcchi, S. Stigma during the COVID-19 pandemic. Lancet Infect. Dis. 2020, 20, 782. [Google Scholar] [CrossRef]
- Bhanot, D.; Singh, T.; Verma, S.K.; Sharad, S. Stigma and Discrimination During COVID-19 Pandemic. Front. Public Health 2021, 8, 577018. [Google Scholar] [CrossRef]
- Sotgiu, G.; Dobler, C.C. Social stigma in the time of coronavirus disease 2019. Eur. Respir. J. 2020, 56, 2002461. [Google Scholar] [CrossRef] [PubMed]
- Villa, S.; Jaramillo, E.; Mangioni, D.; Bandera, A.; Gori, A.; Raviglione, M.C. Stigma at the time of the COVID-19 pandemic. Clin. Microbiol. Infect. 2020, 26, 1450–1452. [Google Scholar] [CrossRef]
- Smith, R.A.; Hughes, D. Infectious Disease Stigmas: Maladaptive in Modern Society. Commun. Stud. 2014, 65, 132–138. [Google Scholar] [CrossRef] [PubMed]
- Preis, H.; Mahaffrey, B.; Heiselman, G.; Lobel, M. Vulnerability and resilience to pandemic-related stress among U.S. women pregnant at the start of the COVID-19 pandemic. Soc. Sci. Med. 2020, 266, 1133–1148. [Google Scholar] [CrossRef]
- Yan, H.; Ding, Y.; Guo, W. Mental health of pregnant and postpartum women during the coronavirus disease 2019 pandemic: A systematic review and meta-analysis. Front. Psychol. 2020, 11, 617001. [Google Scholar] [CrossRef] [PubMed]
- Ransing, R.; Ramalho, R.; de Filippis, R.; Ojeahere, M.I.; Karaliuniene, R.; Orsolini, L.; da Costa, M.P.; Ullah, I.; Grandinetti, P.; Bytyçi, D.G.; et al. Infectious disease outbreak related stigma and discrimination during the COVID-19 pandemic: Drivers, facilitators, manifestations, and outcomes across the world. Brain Behav. Immun. 2020, 89, 555–558. [Google Scholar] [CrossRef] [PubMed]
- Hada, A.; Minatani, M.; Yamagishi, Y.; Wakamatsu, M.; Koren, G.; Kitamura, T. The Pregnancy-Unique Quantification of Emesis and Nausea (PUQE-24): Configural, measurement, and structural invariance between nulliparas and multiparas and across two measurement time points. Healthcare 2021, 9, 1553. [Google Scholar] [CrossRef]
- Koren, G.; Boskovic, R.; Hard, M.; Maltepe, C.; Navioz, Y.; Einarson, A. Motherisk: PUQE (pregnancy-unique quantification of emesis and nausea) scoring systm for nausea and vomiting of pregnancy. Am. J. Obstet. Gynecol. 2002, 186, s210–s214. [Google Scholar] [CrossRef]
- Koren, G.; Piwko, C.; Ahn, E.; Boskovic, R.; Maltepe, C.; Einarson, A.; Navioz, Y.; Ungar, W.J. Validation studies of the Pregnancy Unique-Quantification of Emesis (PUQE) scores. J. Obstet. Gynaecol. 2005, 25, 241–244. [Google Scholar] [CrossRef]
- Takegata, M.; Haruna, M.; Matsuzaki, M.; Shiraishi, M.; Okano, T.; Severinsson, E. Aetiological relationship between factors associated with postnatal traumatic symptoms among Japanese primiparas and multiparas: A longitudinal study. Midwifery 2017, 44, 14–23. [Google Scholar] [CrossRef]
- Wijma, K.; Wijma, B.; Zar, M. Psychometric aspects of the W-DEQ; A new questionnaire for the measurement of fear of childbirth. J. Psychosom. Obstet. Gynecol. 1998, 19, 84–97. [Google Scholar] [CrossRef]
- Hada, A.; Imura, M.; Takeda, S.; Kitamura, T. Development and validation of a short version of the Scale for Parent to Baby Emotions (SPBE-20): Conceptual replication among pregnant women in Japan. 2022; Journal article under review. [Google Scholar]
- Hada, A.; Imura, M.; Kitamura, T. Development of a scale for parent-to-baby emotions: Concepts, design, and factor structure. Psychiatry Clin. Neurosci. Rep. 2022, 1, e30. [Google Scholar] [CrossRef]
- Koike, H.; Tsuchiyagaito, A.; Hirano, Y.; Oshima, F.; Asano, K.; Sugiura, Y.; Kobori, O.; Ishikawa, R.; Nishinaka, H.; Shimizu, E.; et al. Reliability and validity of the Japanese version of the Obsessive-Compulsive Inventory-Revised (OCI-R). Curr. Psychol. 2017, 39, 89–95. [Google Scholar] [CrossRef]
- Foa, E.B.; Huppert, J.D.; Leiberg, S.; Langner, R.; Kichic, R.; Hajcak, G.; Salkovskis, P.M. The obsessive-compulsive inventory: Development and validation of a short version. Psychol. Assess. 2002, 14, 485–496. [Google Scholar] [CrossRef]
- Bowling, A. Just one question: If one question works, why ask several? J. Epidemiol. Community Health 2005, 59, 342–345. [Google Scholar] [CrossRef] [PubMed]
- Chochinov, H.M.; Wilson, K.G.; Enns, M.; Lander, S. “Are you depressed?” Screening for depression in the terminally ill. Am. J. Psychiatry 1997, 154, 674–676. [Google Scholar] [CrossRef] [PubMed]
- Cutler, C.B.; Legano, L.A.; Dreyer, B.P.; Fierman, A.H.; Berkule, S.B.; Lusskin, S.I.; Tomopoulos, S.; Roth, M.; Mendelsohn, A.L. Screening for maternal depression in a low education population using a two item questionnaire. Arch. Women’s Ment. Health 2007, 10, 277–283. [Google Scholar] [CrossRef]
- De Boer, A.G.E.M.; van Lanschot, J.J.B.; Stalmeier, P.F.M.; van Sandick, J.W.; Hulscher, J.B.F.; de Haes, J.C.J.M.; Sprangers, M.A.G. Is a single-item visual analogue scale as valid, reliable and responsive as mitiitem scales in measuring quality of life? Qual. Life Res. 2004, 13, 311–320. [Google Scholar] [CrossRef]
- Mitchell, A.J. Are one or two simple questions sufficient to detect depression in cancer and palliative care? A Bayesian meta-analysis. Br. J. Cancer 2008, 98, 1934–1943. [Google Scholar] [CrossRef]
- Mitchell, A.J.; Coyne, J.C. Do ultra-short screening instruments accurately detect depression in primary care? A pooled analysis and meta-analysis of 22 studies. Br. J. Gen. Pr. 2007, 57, 144–151. [Google Scholar]
- Mishina, H.; Hayashino, Y.; Fukuhara, S. Test performance of two-question screening for postpartum depressive symptoms. Pediatr. Int. 2009, 51, 48–53. [Google Scholar] [CrossRef]
- Richardson, L.P.; Rockhill, C.; Russo, J.E.; Grossman, D.C.; Richards, J.; McCarty, C.; McCauley, E.; Katon, W. Evaluation of the PHQ-2 as a Brief Screen for Detecting Major Depression Among Adolescents. Pediatrics 2010, 125, e1097–e1103. [Google Scholar] [CrossRef]
- Matsuoka, N.; Uji, M.; Hiramura, H.; Chen, Z.; Shikai, N.; Kishida, Y.; Kitamura, T. Adolescents’ attachment style and early experiences: A gender difference. Arch. Women’s Ment. Health 2006, 9, 23–29. [Google Scholar] [CrossRef]
- Bartholomew, K.; Horowitz, L.M. Attachment styles among young adults: A test of four-category model. J. Personal. Soc. Psychol. 1991, 61, 226–244. [Google Scholar] [CrossRef]
- Yamada, F.; Kataoka, Y.; Nagara, T.; Kitamura, T. Development and Validation of a Short Version of the Primary Scales of the Inventory of Personality Organization: A Study among Japanese University Students. Psychology 2022, 13, 872–890. [Google Scholar] [CrossRef]
- Kernberg, O.F.; Clarkin, J.F. The Inventory of Personality Organization; New York Hospital-Cornell Medical Center: New York, NY, USA, 1995. [Google Scholar]
- Burton, L.J.; Mazerolle, S.M. Survey instrument validity Part I: Principles of survey instrument development and validity in athletic training education research. Athl. Train. Educ. J. 2011, 6, 27–35. [Google Scholar] [CrossRef]
- Cliff, N. Some Cautions Concerning the Application of Causal Modeling Methods. Multivar. Behav. Res. 1983, 18, 115–126. [Google Scholar] [CrossRef]
- Cudeck, R.; Browne, M.W. Cross-Validation of Covariance Structures. Multivar. Behav. Res. 1983, 18, 147–167. [Google Scholar] [CrossRef] [PubMed]
- Romera, I.; Delgado-Cohen, H.; Perez, T.; Caballero, L.; Gilaberte, I. Factor analysis of the Zung self-rating depression scale in a large sample of patients with major depressive disorder in primary care. BMC Psychiatry 2008, 8, 4. [Google Scholar] [CrossRef]
- Bentler, P.M. Comparative Fit Indexes in Structural Models. Psychol. Bull. 1990, 107, 238–246. [Google Scholar] [CrossRef] [PubMed]
- Schermelleh-Engel, K.; Moosbrugger, H.; Müller, H. Evaluating the fit of structural equation models: Tests of significance and descriptive goodness-of-fit measures. Methods Psychol. Res. 2003, 8, 23–74. [Google Scholar]
- Akaike, H. Factor analysis and AIC. Psychometrika 1987, 52, 317–332. [Google Scholar] [CrossRef]
- Dunn, T.J.; Baguley, T.; Brunsden, V. From alpha to omega: A practical solution to the pervasive problem of internal consistency estimation. Br. J. Psychol. 2014, 105, 399–412. [Google Scholar] [CrossRef]
- Peters, G.-J.Y. The alpha and the omega of scale reliability and validity: Why and how to abandon Cronbach’s alpha and the route towards more comprehensive assessment of scale quality. Eur. Health Psychol. 2014, 16, 56–69. [Google Scholar]
- Zinberg, R.E.; Revelle, W.; Yovel, I.; Li, W. Cronbach’s α, Revelle’s β, and McDonald’s ωH: Their relations with each other and two alternative conceptualizations of reliability. Psychomterika 2005, 70, 123–133. [Google Scholar] [CrossRef]
- Chen, F.F. Sensitivity of Goodness of Fit Indexes to Lack of Measurement Invariance. Struct. Equ. Model. A Multidiscip. J. 2007, 14, 464–504. [Google Scholar] [CrossRef]
- Cheung, G.W.; Rensvold, R.B. Evaluating goodness-of-fit indexes for testing measurement invariance. Struct. Equ. Model. 2002, 9, 233–255. [Google Scholar] [CrossRef]
- Costello, A.B.; Osborne, J. Best practices in exploratory factor analysis: Four recommendations for getting the most from your analysis. Pract. Assess. Res. Eval. 2005, 10, 7. [Google Scholar]
- Størksen, H.T.; Garthus-Niegel, S.; Adams, S.S.; Vangen, S.; Eberhard-Gran, M. Fear of childbirth and elective caesarean section: A population-based study. BMC Pregnancy Childbirth 2015, 15, 221. [Google Scholar] [CrossRef] [PubMed]
- Takegata, M.; Haruna, M.; Morikawa, M.; Yonezawa, K.; Komada, M.; Severinsson, E. Qualitative exploration of fear of childbirth and preferences for mode of birth among Japanese primiparas. Nurs. Health Sci. 2018, 20, 338–345. [Google Scholar] [CrossRef]
- Branjerdporn, G.; Meredith, P.; Strong, J.; Garcia, J. Association between maternal-foetal attachment and infant development outcomes: A systematic review. Matern. Child Health 2017, 21, 540–553. [Google Scholar] [CrossRef]
- Yarcheski, A.; Mahon, N.E.; Yarcheski, T.J.; Hanks, M.M.; Cannella, B.L. A meta-analytic study of predictors of maternal-fetal attachment. Int. J. Nurs. Stud. 2009, 46, 708–715. [Google Scholar] [CrossRef]

| Mean | SD | |
|---|---|---|
| Age | 31.7 | 4.53 |
| Gestational age (weeks) | 13.4 | 1.14 |
| n | % | |
| Gravidity | ||
| 0 | 394 | 56.6 |
| 1 time | 169 | 24.3 |
| 2 times | 79 | 11.4 |
| 3 times | 34 | 4.9 |
| 4 times | 12 | 1.7 |
| 5 times | 6 | 0.9 |
| 6 times | 2 | 0.3 |
| Parity | ||
| Nuliarae | 512 | 73.6 |
| Multiparae | 184 | 26.4 |
| 1 time | 126 | 18.1 |
| 2 times | 41 | 5.9 |
| 3 times | 14 | 2.0 |
| 4 times | 3 | 0.4 |
| Education | ||
| Secondary school | 17 | 2.4 |
| High school | 132 | 19.0 |
| Junior college or Vocational school | 192 | 27.6 |
| Bachelor’s | 320 | 46.0 |
| Master’s | 32 | 4.6 |
| Doctorate | 3 | 0.4 |
| Infertility treatment | ||
| None (spontaneously) | 466 | 67.0 |
| Intercourse timing therapy | 149 | 21.4 |
| Assisted conception | 81 | 11.6 |
| Mean | SD | |
| Treatment duration (years) | 0.29 | 0.72 |
| n | % | |
| Student | ||
| Yes | 6 | 0.9 |
| No | 690 | 99.1 |
| Employment | ||
| Unemployed | 83 | 11.9 |
| Temporary work | 109 | 15.7 |
| Full-time employment or Self-employed | 504 | 72.4 |
| Have a partner | ||
| Yes | 690 | 99.1 |
| No | 6 | 0.9 |
| Item No. | Items (Abbreviations) | Mean (SD) | Skewness | Kurtosis |
|---|---|---|---|---|
| 1 | People get infected because they are careless. (condemn carelessness) | 2.03 (1.48) | 0.06 | −0.92 |
| 2 | Those who are infected/positive should apologise. (demand for apology) | 0.56 (1.07) | 1.96 | 3.34 |
| 3 | I do not want to get close to those who are infected/positive. (avoidance of infected people) | 4.97 (1.32) | −1.59 | 2.92 |
| 4 | I do not want to get close to the families of those who are infected/positive. (avoidance of families of infected person) | 4.34 (1.50) | −0.82 | 0.47 |
| 5 | I do not want to touch anything touched by those who are infected/positive. (avoidance of polluted objects) | 4.56 (1.53) | −1.12 | 1.08 |
| 6 | I do not want to get close to those who are in the hospitality industry. (avoidance of people in the hospitality industry) | 1.55 (1.50) | 0.65 | −0.24 |
| 7 | I do not want to get close to those who visit hospitals. (avoidance of hospital visitors) | 1.40 (1.47) | 0.82 | −0.18 |
| 8 | I do not want to get close to health care professionals. (avoidance of health care professionals) | 1.14 (1.42) | 1.05 | 0.17 |
| 9 | Those who were infected/positive should not go to workplace (school) even after they are cured. (restriction on activity of infected people) | 1.25 (1.49) | 1.01 | 0.09 |
| 10 | Those who are infected/positive should not use public transportation or public places. (restrictions on utilisation of public facilities) | 4.12 (1.99) | −0.89 | −0.34 |
| 11 | I do not think I will be able to associate as before with those who are infected/positive. (avoidance of communicating with infected people) | 0.84 (1.24) | 1.49 | 1.70 |
| Item No. | Item Contents (Label) | 1-Factor | 2-Factor | 3-Factor | 4-Factor | ||||||
|---|---|---|---|---|---|---|---|---|---|---|---|
| I | I | II | I | II | III | I | II | III | IV | ||
| 1 | condemn carelessness | 0.33 | 0.22 | 0.20 | 0.17 | 0.03 | 0.30 | 0.11 | 0.02 | 0.03 | 0.44 |
| 2 | demand for apology | 0.43 | 0.35 | 0.13 | 0.08 | 0.08 | 0.43 | −0.05 | 0.01 | 0.03 | 0.80 |
| 3 | avoidance of infected people | 0.37 | −0.02 | 0.83 | 0.85 | −0.00 | −0.07 | 0.83 | −0.00 | −0.11 | 0.07 |
| 4 | avoidance of families of infected person | 0.45 | 0.06 | 0.83 | 0.84 | 0.05 | −0.02 | 0.85 | 0.05 | −0.01 | −0.02 |
| 5 | avoidance of polluted objects | 0.42 | 0.01 | 0.86 | 0.86 | −0.05 | 0.06 | 0.87 | −0.04 | 0.06 | −0.01 |
| 6 | avoidance of people in hospitality industry | 0.80 | 0.80 | −0.00 | 0.02 | 0.75 | 0.05 | 0.00 | 0.76 | −0.03 | 0.11 |
| 7 | avoidance of hospital visitors | 0.93 | 0.97 | −0.04 | −0.02 | 1.01 | −0.03 | −0.02 | 1.01 | −0.03 | −0.01 |
| 8 | avoidance of health care professionals | 0.88 | 0.89 | −0.02 | 0.01 | 0.83 | 0.05 | 0.02 | 0.85 | 0.07 | −0.08 |
| 9 | restriction on activity of infected people | 0.55 | 0.50 | 0.07 | −0.02 | 0.08 | 0.69 | 0.02 | 0.09 | 0.67 | 0.00 |
| 10 | restrictions on utilisation of public facilities | 0.29 | 0.11 | 0.37 | 0.34 | −0.01 | 0.18 | 0.36 | −0.00 | 0.21 | −0.05 |
| 11 | avoidance of communicating with infected people | 0.49 | 0.44 | 0.07 | −0.04 | −0.05 | 0.81 | −0.00 | −0.03 | 0.75 | 0.05 |
| Models | χ2/df | Dχ2 (df) | CFI | DCFI | RMSEA | DRMSEA | AIC |
|---|---|---|---|---|---|---|---|
| Models derived from EFA | |||||||
| 1-factor | 905.466/46 = 19.684 | Ref | 0.515 | Ref | 0.233 | Ref | 967.466 |
| 2-factor | 314.468/44 = 7.147 | 590.998 (2) *** | 0.847 | 0.332 | 0.133 | 0.100 | 380.468 |
| 3-factor | 111.439/41 = 2.718 | 203.029 (3) *** | 0.960 | 0.113 | 0.071 | 0.062 | 183.439 |
| χ2 | df | χ2/df | Δχ2 (df) | CFI | ΔCFI | RMSEA | ΔRMSEA | AIC | Judgement | |
|---|---|---|---|---|---|---|---|---|---|---|
| Configuration | 198.317 | 82 | 2.419 | Ref | 0.968 | Ref | 0.045 | Ref | 342.317 | ACCEPT |
| Metric | 205.422 | 90 | 2.282 | 7.015(8)NS | 0.968 | 0.000 | 0.043 | 0.002 | 333.422 | ACCEPT |
| Scalar | 219.989 | 101 | 2.178 | 14.567(11)NS | 0.967 | 0.001 | 0.041 | 0.001 | 325.989 | ACCAPT |
| Residual | 244.051 | 112 | 2.179 | 24.062(11) * | 0.964 | 0.003 | 0.041 | 0.000 | 328.051 | ACCEPT |
| Factor variance | 248.448 | 115 | 2.160 | 4.397(3) NS | 0.963 | 0.001 | 0.041 | 0.000 | 326.448 | ACCEPT |
| Factor covariance | 253.443 | 228 | 2.148 | 5.365(113) NS | 0.963 | 0.001 | 0.041 | 0.000 | 325.813 | ACCEPT |
| χ2 | df | χ2/df | Δχ2 (df) | CFI | ΔCFI | RMSEA | ΔRMSEA | AIC | Judgement | |
|---|---|---|---|---|---|---|---|---|---|---|
| Configuration | 213.294 | 82 | 2.601 | Ref | 0.964 | Ref | 0.048 | Ref | 357.294 | ACCEPT |
| Metric | 220.685 | 90 | 2.452 | 7.391(8)NS | 0.964 | 0.000 | 0.046 | −0.004 | 348.685 | ACCEPT |
| Scalar | 234.256 | 101 | 2.319 | 13.571(11)NS | 0.963 | 0.001 | 0.044 | −0.002 | 340.256 | ACCAPT |
| Residual | 253.925 | 112 | 2.267 | 19.669(11) * | 0.961 | 0.002 | 0.043 | −0.001 | 337.925 | ACCEPT |
| Factor variance | 259.720 | 115 | 2.258 | 5.795(3)NS | 0.960 | 0.001 | 0.043 | 0.000 | 337.720 | ACCEPT |
| Factor covariance | 267.575 | 118 | 2.268 | 7.855(3) * | 0.959 | 0.001 | 0.043 | 0.000 | 339.575 | ACCEPT |
| Factor Mean (SE) | |||
|---|---|---|---|
| F1: Omnidirectional Avoidance | F2: Attributional Avoidance | F3: Hostility | |
| Nulliparae (n = 512) compared with multiparae (n =184) | −0.070 (0.082) NS | −0.199 (0.115) NS | 0.034 (0.359) NS |
| age less than 32 years (n = 344) compared with age 32 years or older (n = 353) | −0.122 (0.074) NS | −0.049 (0.101) NS | −0.052 (0.083) NS |
| Omnidirectional Avoidance | Attributional Avoidance | Hostility | |
|---|---|---|---|
| Demographic and obstetric variables | |||
| Age | 0.06 | 0.04 | 0.02 |
| Gestational age | 0.1 | 0.2 | 0.7 |
| Past pregnancy (times) | −0.04 | 0.00 | −0.06 |
| Past childbirth (times) | −0.05 | 0.04 | −0.04 |
| Preventive means against COVID-19 | |||
| Mask | −0.02 | −0.06 | −0.13 ** |
| Hand washing | −0.03 | −0.07 | −0.12 ** |
| Gargling | −0.06 | 0.01 | −0.03 |
| Showering | −0.07 | −0.02 | −0.05 |
| Alcohol disinfection | −0.03 | −0.04 | −0.05 |
| Gloves | −0.13 ** | −0.04 | −0.08 * |
| Faceguard | −0.10 ** | −0.04 | −0.01 |
| Attitude towards the present pregnancy | |||
| Denial of pregnancy | −0.03 | 0.01 | 0.04 |
| Unintended pregnancy | −0.06 | −0.03 | 0.03 |
| Quit caring | −0.04 | 0.10 ** | 0.04 |
| Wish to terminate | 0.01 | 0.07 | 0.10 ** |
| Current pregnancy | |||
| PUQE Total | 0.00 | −0.04 | 0.06 |
| Perceived impact of pregnancy | 0.05 | −0.00 | −0.10 |
| Assisted conception (yes, 1; no, 0) | 0.09 | −0.00 | 0.05 |
| Infertility treatment duration (years) | 0.07 | 0.03 | 00.05 |
| Mental state and psychopathology | |||
| Fear of child birth | 0.04 | 0.13 *** | 0.15 *** |
| Foetal bonding | |||
| Happiness | 0.03 | −0.09 * | −0.15 ** |
| Anger | −0.04 | 0.09 * | 0.13 ** |
| Fear | 0.01 | 0.07 | 0.15 *** |
| Sadness | −0.01 | 0.12 ** | 0.18 *** |
| Disgust | −0.03 | 0.10 ** | 0.16 *** |
| Surprise | 0.01 | 0.04 | 0.17 *** |
| Shame | −0.03 | 0.10 ** | 0.14 *** |
| Guilt | −0.10 | 0.04 | 0.12 ** |
| Alpha pride | 0.02 | 0.02 | 0.04 |
| Beta pride | 0.05 | −0.01 | −0.07 |
| Substance use | |||
| Smoking amount | 0.00 | 0.01 | 0.02 |
| Alcohol | −0.05 | −0.06 | −0.07 |
| Obsessive compulsive symptoms | |||
| Washing | 0.17 *** | 0.31 *** | 0.31 *** |
| Checking | 0.03 | 0.23 *** | 0.21 *** |
| Ordering | 0.12 ** | 0.21 *** | 0.24 *** |
| Obsession | 0.11 ** | 0.19 *** | 0.24 *** |
| Hoarding | 0.07 | 0.15 *** | 0.23 *** |
| Neutralising | 0.06 | 0.20 *** | 0.28 *** |
| MDE | |||
| Depression | 0.08 * | 0.13 ** | 0.15 *** |
| Anhedonia | 0.04 | 0.14 *** | 0.15 ** |
| Total | 0.06 | 0.14 *** | 0.15 *** |
| Adult attachment | |||
| Self-model | 0.02 | −0.14 *** | −0.15 *** |
| Other-model | 0.08 * | −0.08 * | −0.05 |
| Borderline personality traits | |||
| Primitive difences | 0.03 | 0.11 ** | 0.24 *** |
| Identity delusion | 0.06 | 0.11 ** | 0.21 *** |
| Reality testing | 0.01 | 0.20 *** | 0.21 *** |
| Total | 0.04 | 0.16 *** | 0.26 *** |
Publisher’s Note: MDPI stays neutral with regard to jurisdictional claims in published maps and institutional affiliations. |
© 2022 by the authors. Licensee MDPI, Basel, Switzerland. This article is an open access article distributed under the terms and conditions of the Creative Commons Attribution (CC BY) license (https://creativecommons.org/licenses/by/4.0/).
Share and Cite
Kitamura, T.; Matsunaga, A.; Hada, A.; Ohashi, Y.; Takeda, S. Development of a Scale for COVID-19 Stigma and Its Psychometric Properties: A Study among Pregnant Japanese Women. Behav. Sci. 2022, 12, 257. https://doi.org/10.3390/bs12080257
Kitamura T, Matsunaga A, Hada A, Ohashi Y, Takeda S. Development of a Scale for COVID-19 Stigma and Its Psychometric Properties: A Study among Pregnant Japanese Women. Behavioral Sciences. 2022; 12(8):257. https://doi.org/10.3390/bs12080257
Chicago/Turabian StyleKitamura, Toshinori, Asami Matsunaga, Ayako Hada, Yukiko Ohashi, and Satoru Takeda. 2022. "Development of a Scale for COVID-19 Stigma and Its Psychometric Properties: A Study among Pregnant Japanese Women" Behavioral Sciences 12, no. 8: 257. https://doi.org/10.3390/bs12080257