
Cognitive Capacity Genome-Wide Polygenic Scores Identify Individuals with Slower Cognitive Decline in Aging

Highlights
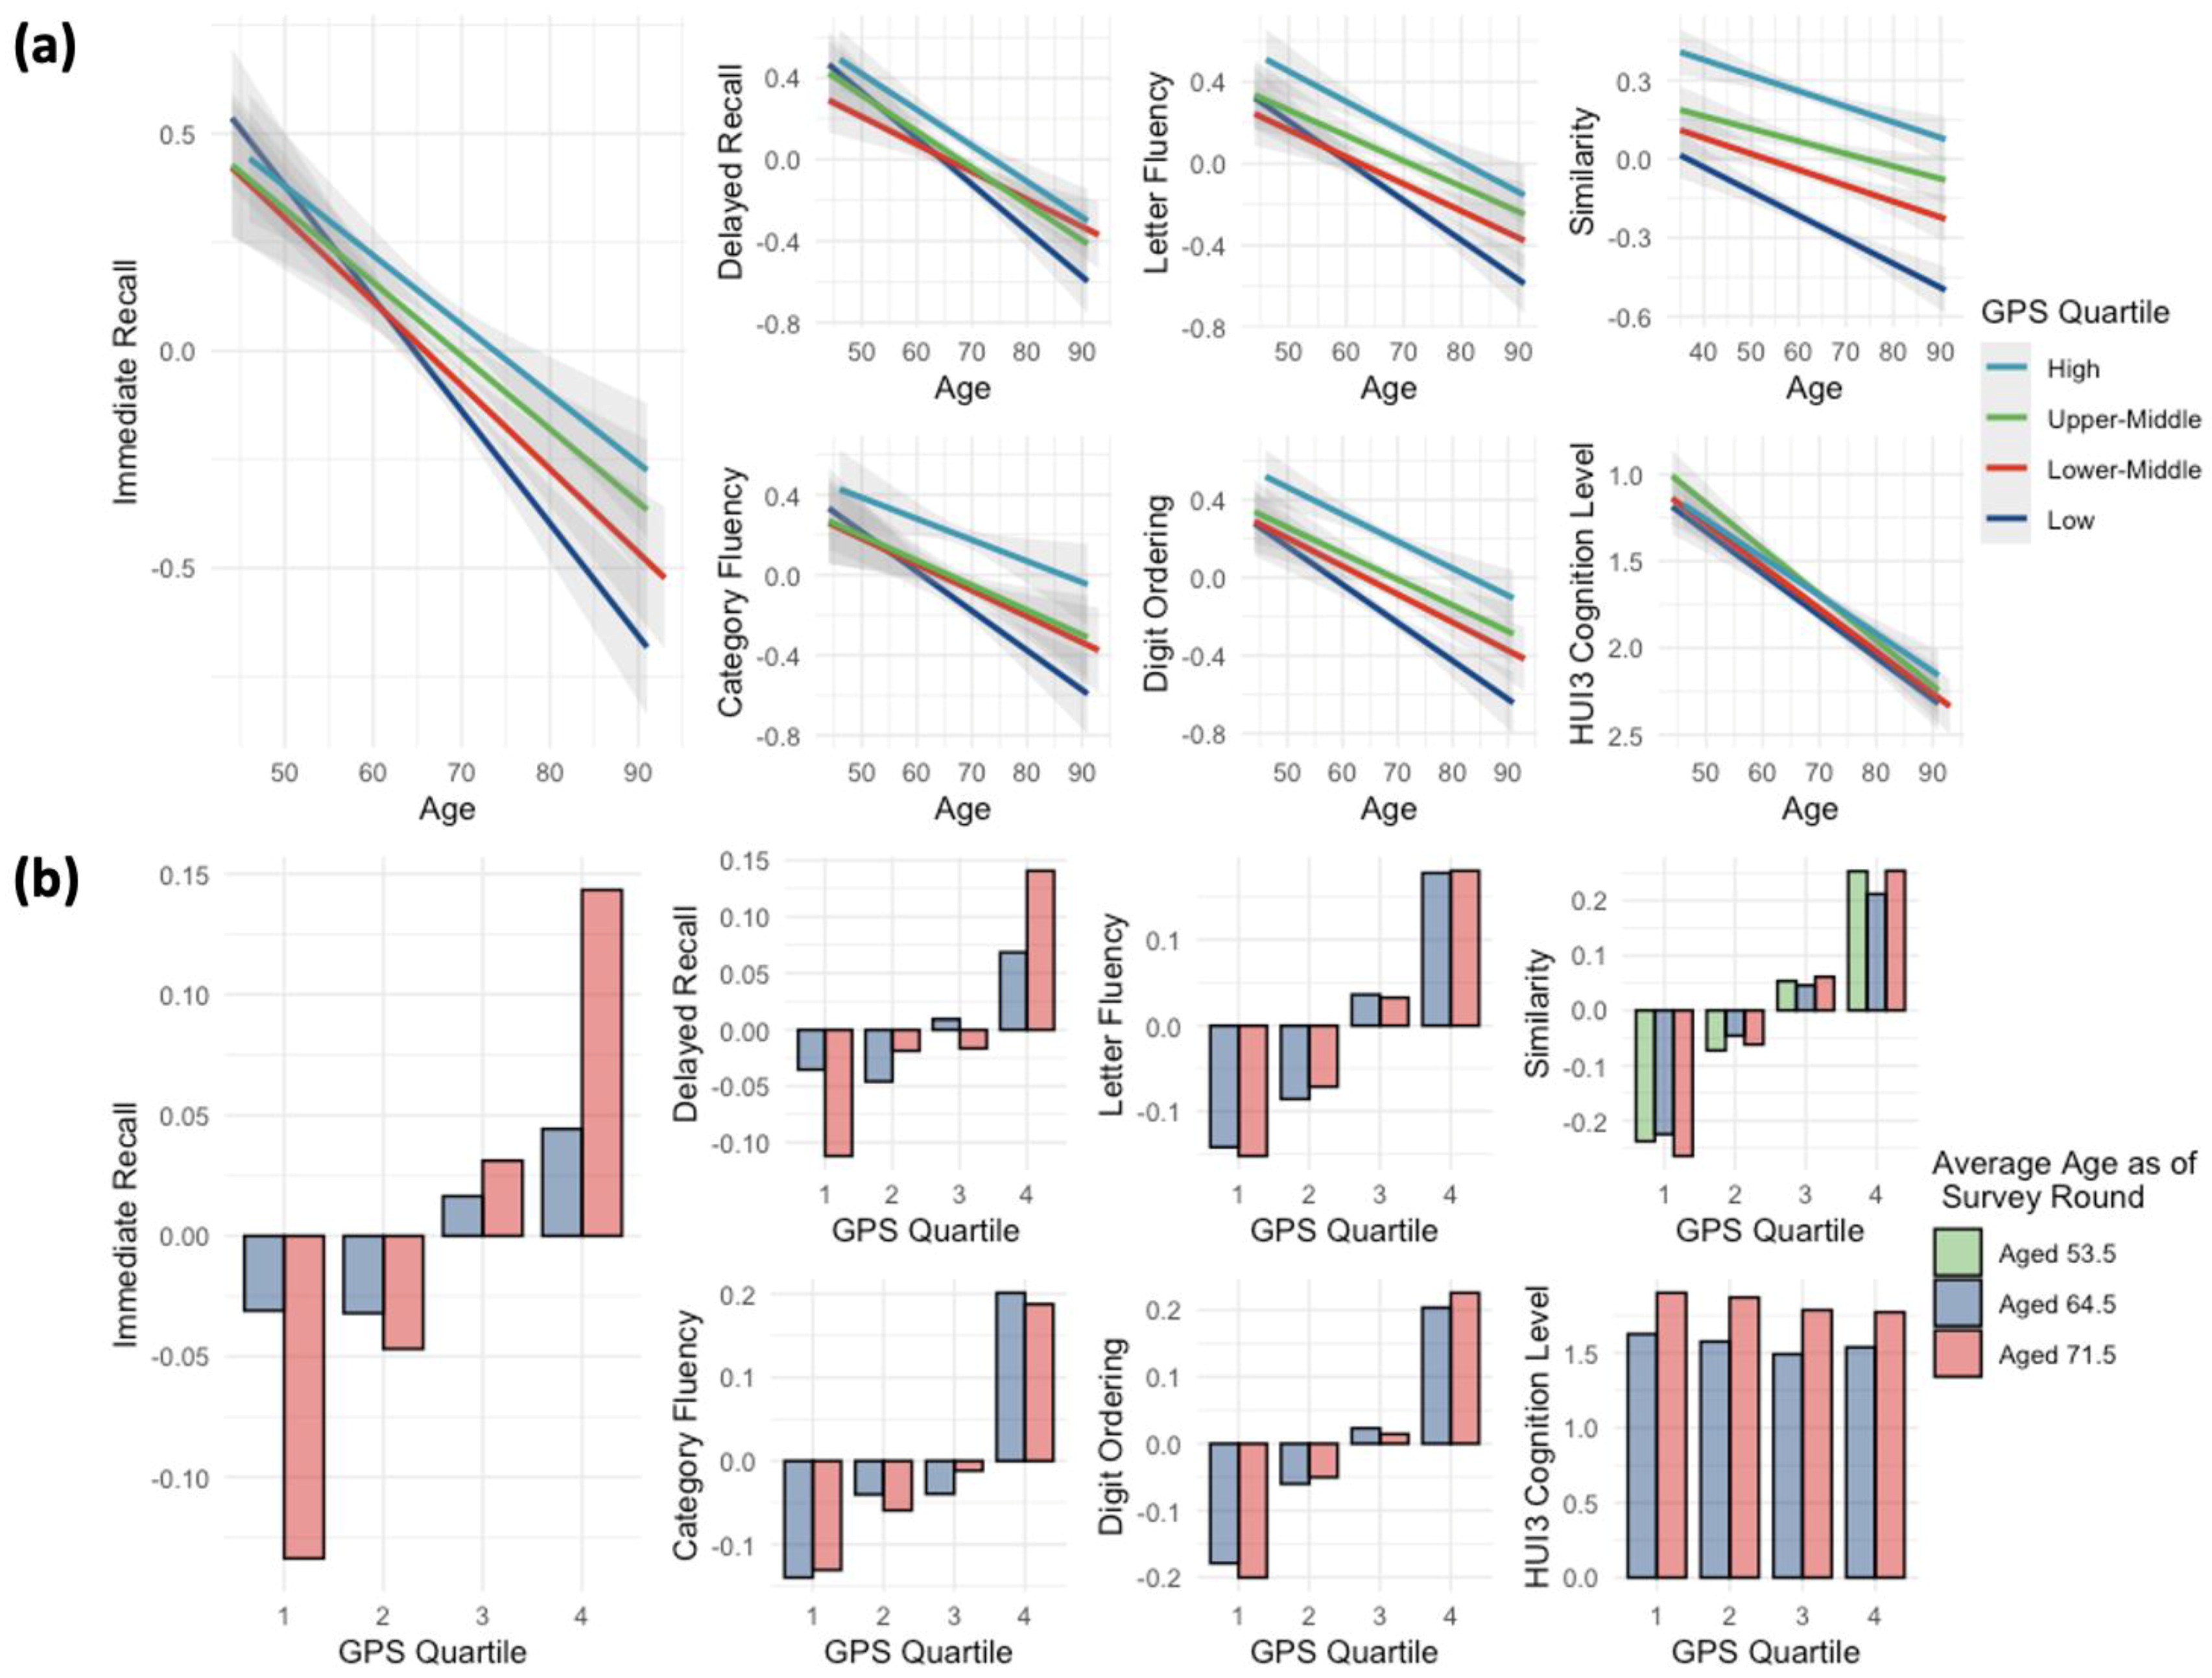
- Higher genome-wide polygenic scores (GPSs) for cognitive capacity are significantly associated with slower cognitive decline during aging, particularly in the domain of immediate memory recall.
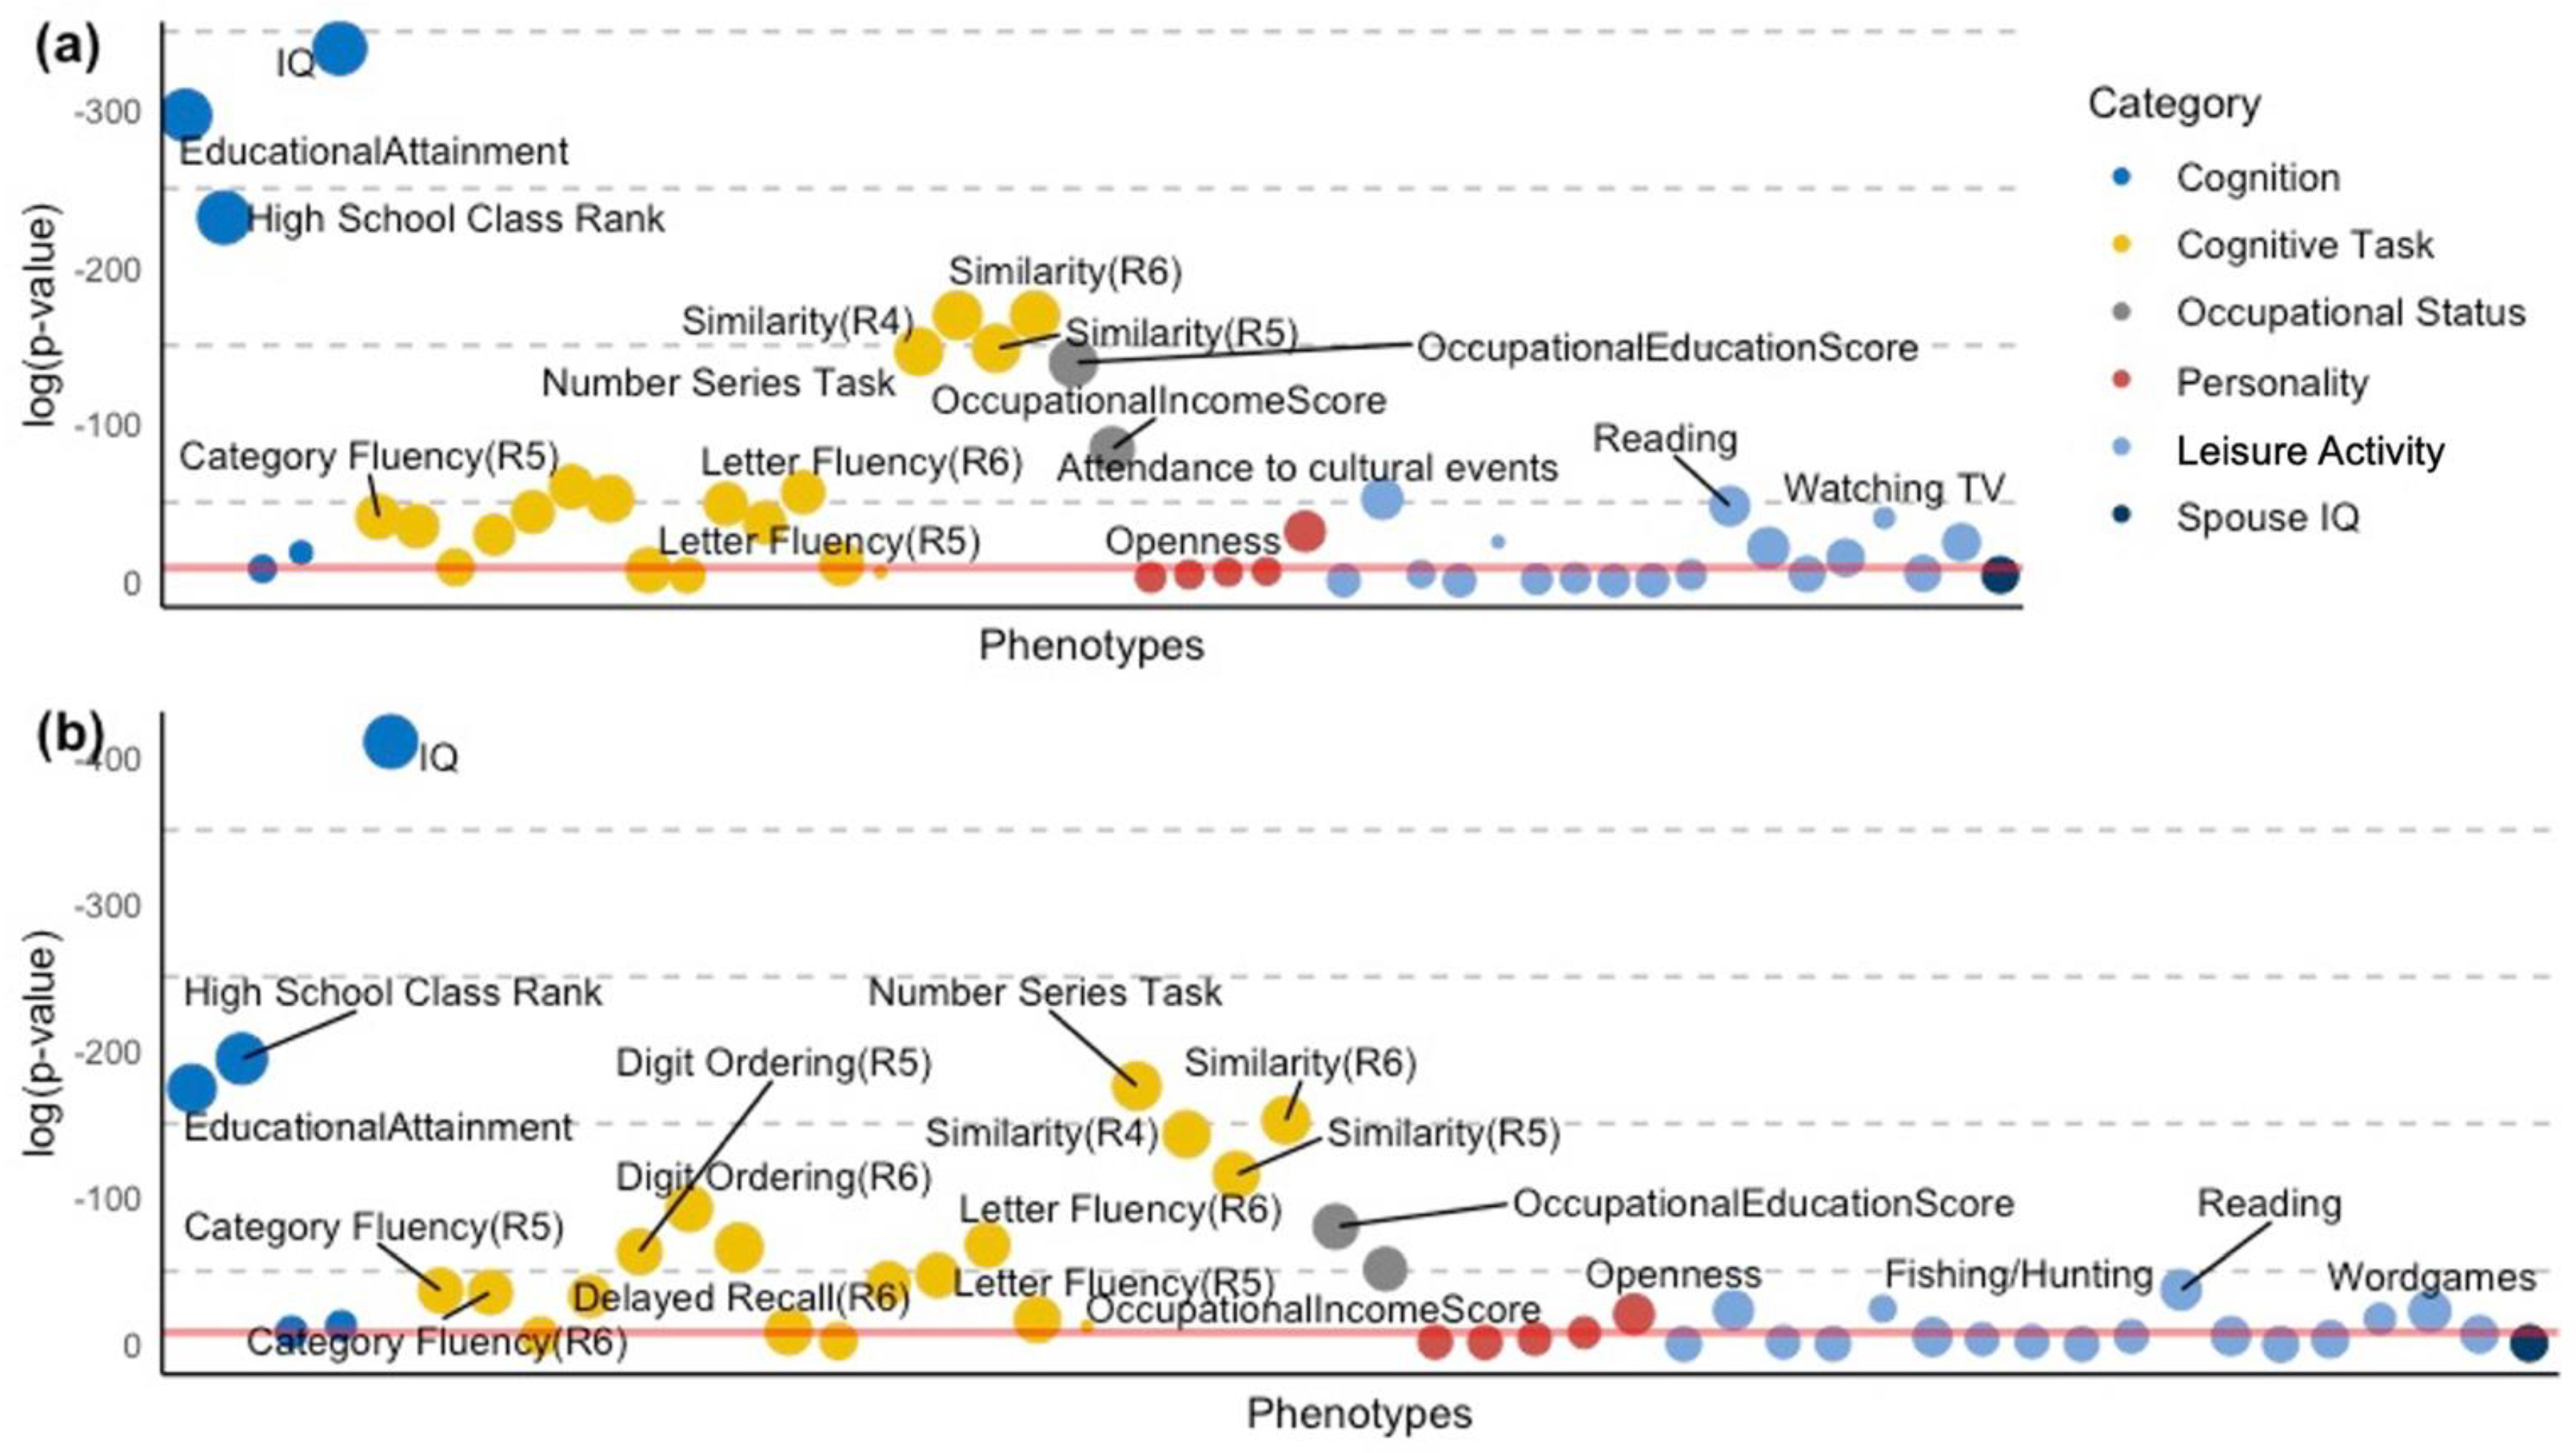
- The study finds several associations between cognitive trait GPSs and other cognitive phenotypes, including IQ scores, educational attainment, and performance in tasks such as similarities and number series.
- The study identified significant interactions between age and cognitive capacity GPSs, indicating that individuals with higher GPSs exhibit better cognitive resilience over time.
- GPSs are also associated with several behavioral and personality traits, such as openness from the BIG 5 personality factors, leisure activities such as reading books, attending cultural events, and watching TV.
- This study is the first to conduct a phenome-wide association study (PheWAS) using 60 years of longitudinal sociobehavioral data, spanning an individual's lifetime from high school to elderly; this highlights the potential of GPS to predict and identify individuals at a lower risk of cognitive decline.
- The discovery of a link between GPS and an individual's rate of cognitive decline emphasizes the importance of considering genetic factors in understanding cognitive decline and developing tailored interventions to maintain cognitive health in aging populations.
- The strong associations between GPS and leisure activities, as well as personality traits, open up new avenues for sociogenomic research into how genetics influence the social and behavioral domains.
Abstract
:1. Introduction
2. Materials and Methods
2.1. Data
2.2. Genotype Data and Quality Control Process
2.3. Construction of Cognitive Capacity GPS
2.4. Outcome Measures
2.4.1. Cognitive Phenotypes
2.4.2. Behavioral Phenotypes
2.5. Statistical Analysis
2.5.1. Cognitive/Behavioral PheWAS
2.5.2. Cognitive Changes
3. Results
3.1. Participant Demographics
3.2. PheWAS of Cognitive GPSs in the Cognitive/Behavioral Phenome
3.2.1. Cognitive Phenotypes
3.2.2. Behavioral Phenotypes
3.3. Cognitive GPSs Correlate with Immediate Recall Changes
4. Discussion
Supplementary Materials
Author Contributions
Funding
Institutional Review Board Statement
Informed Consent Statement
Data Availability Statement
Conflicts of Interest
References
- Deary, I.J.; Yang, J.; Davies, G.; Harris, S.E.; Tenesa, A.; Liewald, D.; Luciano, M.; Lopez, L.M.; Gow, A.J.; Corley, J.; et al. Genetic contributions to stability and change in intelligence from childhood to old age. Nature 2012, 482, 212–215. [Google Scholar] [CrossRef] [PubMed]
- Sharp, E.S.; Gatz, M. Relationship between education and dementia: An updated systematic review. Alzheimer Dis. Assoc. Disord. 2011, 25, 289–304. [Google Scholar] [CrossRef] [PubMed] [Green Version]
- Stern, Y. What is cognitive reserve? Theory and research application of the reserve concept. J. Int. Neuropsychol. Soc. 2002, 8, 448–460. [Google Scholar] [CrossRef] [PubMed]
- Stern, Y. Cognitive reserve in ageing and Alzheimer’s disease. Lancet Neurol. 2012, 11, 1006–1012. [Google Scholar] [CrossRef] [Green Version]
- Stern, Y. Cognitive reserve. Neuropsychologia 2009, 47, 2015–2028. [Google Scholar] [CrossRef]
- Melikyan, Z.A.; Corrada, M.M.; Leiby, A.M.; Sajjadi, S.A.; Bukhari, S.; Montine, T.J.; Kawas, C.H. Cognitive resilience to three dementia-related neuropathologies in an oldest-old man: A case report from The 90+ Study. Neurobiol. Aging 2022, 116, 12–15. [Google Scholar] [CrossRef]
- Bolton, A.; Yaroush, R.; Staal, M.; Bourne, L., Jr. Cognitive Performance and Resilience to Stress. In Biobehavioral Resilience to Stress; Routledge: London, UK, 2008; pp. 259–299. [Google Scholar]
- Yu, L.; Petyuk, V.A.; Gaiteri, C.; Mostafavi, S.; Young-Pearse, T.; Shah, R.C.; Buchman, A.S.; Schneider, J.A.; Piehowski, P.D.; Sontag, R.L.; et al. Targeted brain proteomics uncover multiple pathways to Alzheimer’s dementia. Ann. Neurol. 2018, 84, 78–88. [Google Scholar] [CrossRef]
- Yu, L.; Tasaki, S.; Schneider, J.A.; Arfanakis, K.; Duong, D.M.; Wingo, A.P.; Wingo, T.S.; Kearns, N.; Thatcher, G.R.J.; Seyfried, N.T.; et al. Cortical Proteins Associated With Cognitive Resilience in Community-Dwelling Older Persons. JAMA Psychiatry 2020, 77, 1172–1180. [Google Scholar] [CrossRef]
- Andrews, S.J.; Das, D.; Cherbuin, N.; Anstey, K.J.; Easteal, S. Association of genetic risk factors with cognitive decline: The PATH through life project. Neurobiol. Aging 2016, 41, 150–158. [Google Scholar] [CrossRef]
- Morley, J.F.; Xie, S.X.; Hurtig, H.I.; Stern, M.B.; Colcher, A.; Horn, S.; Dahodwala, N.; Duda, J.E.; Weintraub, D.; Chen-Plotkin, A.S.; et al. Genetic influences on cognitive decline in Parkinson’s disease. Mov. Disord. 2012, 27, 512–518. [Google Scholar] [CrossRef] [Green Version]
- Raj, T.; Chibnik, L.B.; McCabe, C.; Wong, A.; Replogle, J.M.; Yu, L.; Gao, S.; Unverzagt, F.W.; Stranger, B.; Murrell, J.; et al. Genetic architecture of age-related cognitive decline in African Americans. Neurol. Genet. 2017, 3, e125. [Google Scholar] [CrossRef] [PubMed] [Green Version]
- Zammit, A.R.; Yu, L.; Petyuk, V.; Schneider, J.A.; De Jager, P.L.; Klein, H.U.; Bennett, D.A.; Buchman, A.S. Cortical Proteins and Individual Differences in Cognitive Resilience in Older Adults. Neurology 2022, 98, e1304–e1314. [Google Scholar] [CrossRef] [PubMed]
- Mostafavi, S.; Gaiteri, C.; Sullivan, S.E.; White, C.C.; Tasaki, S.; Xu, J.; Taga, M.; Klein, H.-U.; Patrick, E.; Komashko, V. A molecular network of the aging human brain provides insights into the pathology and cognitive decline of Alzheimer’s disease. Nat. Neurosci. 2018, 21, 811–819. [Google Scholar] [CrossRef]
- Furlong, L.I. Human diseases through the lens of network biology. Trends Genet. 2013, 29, 150–159. [Google Scholar] [CrossRef]
- Hindorff, L.A.; Sethupathy, P.; Junkins, H.A.; Ramos, E.M.; Mehta, J.P.; Collins, F.S.; Manolio, T.A. Potential etiologic and functional implications of genome-wide association loci for human diseases and traits. Proc. Natl. Acad. Sci. USA 2009, 106, 9362–9367. [Google Scholar] [CrossRef] [Green Version]
- Chakravarti, A.; Turner, T.N. Revealing rate-limiting steps in complex disease biology: The crucial importance of studying rare, extreme-phenotype families. Bioessays 2016, 38, 578–586. [Google Scholar] [CrossRef] [PubMed]
- Lee, J.J.; Wedow, R.; Okbay, A.; Kong, E.; Maghzian, O.; Zacher, M.; Nguyen-Viet, T.A.; Bowers, P.; Sidorenko, J.; Karlsson Linner, R.; et al. Gene discovery and polygenic prediction from a genome-wide association study of educational attainment in 1.1 million individuals. Nat. Genet. 2018, 50, 1112–1121. [Google Scholar] [CrossRef] [PubMed] [Green Version]
- Rietveld, C.A.; Medland, S.E.; Derringer, J.; Yang, J.; Esko, T.; Martin, N.W.; Westra, H.J.; Shakhbazov, K.; Abdellaoui, A.; Agrawal, A.; et al. GWAS of 126,559 individuals identifies genetic variants associated with educational attainment. Science 2013, 340, 1467–1471. [Google Scholar] [CrossRef] [PubMed] [Green Version]
- Okbay, A.; Beauchamp, J.P.; Fontana, M.A.; Lee, J.J.; Pers, T.H.; Rietveld, C.A.; Turley, P.; Chen, G.B.; Emilsson, V.; Meddens, S.F.; et al. Genome-wide association study identifies 74 loci associated with educational attainment. Nature 2016, 533, 539–542. [Google Scholar] [CrossRef] [Green Version]
- Plomin, R.; von Stumm, S. The new genetics of intelligence. Nat. Rev. Genet. 2018, 19, 148–159. [Google Scholar] [CrossRef]
- Trampush, J.W.; Yang, M.L.Z.; Yu, J.; Knowles, E.; Davies, G.; Liewald, D.C.; Starr, J.M.; Djurovic, S.; Melle, I.; Sundet, K.; et al. GWAS meta-analysis reveals novel loci and genetic correlates for general cognitive function: A report from the COGENT consortium. Mol. Psychiatry 2017, 22, 1651–1652. [Google Scholar] [CrossRef] [PubMed] [Green Version]
- Sniekers, S.; Stringer, S.; Watanabe, K.; Jansen, P.R.; Coleman, J.R.I.; Krapohl, E.; Taskesen, E.; Hammerschlag, A.R.; Okbay, A.; Zabaneh, D.; et al. Genome-wide association meta-analysis of 78,308 individuals identifies new loci and genes influencing human intelligence. Nat. Genet. 2017, 49, 1107–1112. [Google Scholar] [CrossRef]
- Davies, G.; Marioni, R.E.; Liewald, D.C.; Hill, W.D.; Hagenaars, S.P.; Harris, S.E.; Ritchie, S.J.; Luciano, M.; Fawns-Ritchie, C.; Lyall, D.; et al. Genome-wide association study of cognitive functions and educational attainment in UK Biobank (N = 112,151). Mol. Psychiatry 2016, 21, 758–767. [Google Scholar] [CrossRef] [PubMed] [Green Version]
- Davies, G.; Armstrong, N.; Bis, J.C.; Bressler, J.; Chouraki, V.; Giddaluru, S.; Hofer, E.; Ibrahim-Verbaas, C.A.; Kirin, M.; Lahti, J.; et al. Genetic contributions to variation in general cognitive function: A meta-analysis of genome-wide association studies in the CHARGE consortium (N = 53,949). Mol. Psychiatry 2015, 20, 183–192. [Google Scholar] [CrossRef] [PubMed] [Green Version]
- Davies, G.; Tenesa, A.; Payton, A.; Yang, J.; Harris, S.E.; Liewald, D.; Ke, X.; Le Hellard, S.; Christoforou, A.; Luciano, M.; et al. Genome-wide association studies establish that human intelligence is highly heritable and polygenic. Mol. Psychiatry 2011, 16, 996–1005. [Google Scholar] [CrossRef] [Green Version]
- Bouchard, T.J., Jr.; McGue, M. Genetic and environmental influences on human psychological differences. J. Neurobiol. 2003, 54, 4–45. [Google Scholar] [CrossRef]
- Rietveld, C.A.; Esko, T.; Davies, G.; Pers, T.H.; Turley, P.; Benyamin, B.; Chabris, C.F.; Emilsson, V.; Johnson, A.D.; Lee, J.J.; et al. Common genetic variants associated with cognitive performance identified using the proxy-phenotype method. Proc. Natl. Acad. Sci. USA 2014, 111, 13790–13794. [Google Scholar] [CrossRef] [Green Version]
- Trampush, J.W.; Lencz, T.; Knowles, E.; Davies, G.; Guha, S.; Pe’er, I.; Liewald, D.C.; Starr, J.M.; Djurovic, S.; Melle, I.; et al. Independent evidence for an association between general cognitive ability and a genetic locus for educational attainment. Am. J. Med. Genet. B Neuropsychiatr. Genet. 2015, 168B, 363–373. [Google Scholar] [CrossRef] [Green Version]
- Herd, P.; Carr, D.; Roan, C. Cohort profile: Wisconsin longitudinal study (WLS). Int. J. Epidemiol. 2014, 43, 34–41. [Google Scholar] [CrossRef]
- Carney, A.K. Wisconsin longitudinal study. Int. J. Aging Hum. Dev. 2014, 79, 332–333. [Google Scholar] [CrossRef] [Green Version]
- McCarthy, S.; Das, S.; Kretzschmar, W.; Delaneau, O.; Wood, A.R.; Teumer, A.; Kang, H.M.; Fuchsberger, C.; Danecek, P.; Sharp, K.; et al. A reference panel of 64,976 haplotypes for genotype imputation. Nat. Genet. 2016, 48, 1279–1283. [Google Scholar] [CrossRef] [PubMed] [Green Version]
- Okbay, A.; Benjamin, D.; Visscher, P. Documentation for the Data of Educational Attainment, Cognitive Performance and Math-Related Scores. Available online: https://www.ssc.wisc.edu/wlsresearch/documentation/GWAS/Lee_et_al_(2018)_PGS_WLS.pdf (accessed on 1 June 2021).
- Center, T.U.o.W.G.A. A Longitudinal Resource for Genetic Research in Behavioral and Health Sciences—Imputation Report Wisconsin Longitudinal Study Nov 2, 2016. 2016. Available online: https://www.ssc.wisc.edu/wlsresearch/documentation/GWAS/Herd_1000G_IMPUTE2report.pdf (accessed on 1 June 2021).
- Purcell, S.; Neale, B.; Todd-Brown, K.; Thomas, L.; Ferreira, M.A.; Bender, D.; Maller, J.; Sklar, P.; de Bakker, P.I.; Daly, M.J.; et al. PLINK: A tool set for whole-genome association and population-based linkage analyses. Am. J. Hum. Genet. 2007, 81, 559–575. [Google Scholar] [CrossRef] [PubMed] [Green Version]
- Vilhjalmsson, B.J.; Yang, J.; Finucane, H.K.; Gusev, A.; Lindstrom, S.; Ripke, S.; Genovese, G.; Loh, P.R.; Bhatia, G.; Do, R.; et al. Modeling Linkage Disequilibrium Increases Accuracy of Polygenic Risk Scores. Am. J. Hum. Genet. 2015, 97, 576–592. [Google Scholar] [CrossRef] [PubMed] [Green Version]
- Hauser, R.M.; Palloni, A. Adolescent IQ and Survival in the Wisconsin Longitudinal Study. J. Gerontol. Ser. B 2011, 66B (Suppl. S1), i91–i101. [Google Scholar] [CrossRef]
- Henmon, V. Henmon-Nelson Tests of Mental Ability, High School Examination-Grades 7 to 12-Forms a, b, and c. Teacher’s Manual; Houghton-Mifflin Company: Boston, MA, USA, 1946. [Google Scholar]
- Henmon, V.A.C.; Holt, F.O. A Report on the Administration of Scholastic Aptitude Tests to 34,000 High. School Seniors in Wisconsin in 1929 and 1930: Prepared for the Committee on Cooperation, Wisconsin Secondary Schools and Colleges; Bureau of Guidance and Records of the University of Wisconsin: Madison, WI, USA, 1931. [Google Scholar]
- John, O.P.; Donahue, E.M.; Kentle, R.L. The Big Five Inventory—Versions 4a and 54; University of California, Berkeley, Institute of Personality: Berkeley, CA, USA, 1991. [Google Scholar]
- Halpin, B. Educational homogamy in Ireland and Britain: Trends and patterns. Br. J. Sociol. 2003, 54, 473–496. [Google Scholar] [CrossRef]
- Mascie-Taylor, C.G.; Vandenberg, S.G. Assortative mating for IQ and personality due to propinquity and personal preference. Behav. Genet. 1988, 18, 339–345. [Google Scholar] [CrossRef]
- Watson, D.; Klohnen, E.C.; Casillas, A.; Simms, E.N.; Haig, J.; Berry, D.S. Match makers and deal breakers: Analyses of assortative mating in newlywed couples. J. Pers. 2004, 72, 1029–1068. [Google Scholar] [CrossRef]
- Hur, Y.M. Assortive mating for personaltiy traits, educational level, religious affiliation, height, weight, adn body mass index in parents of Korean twin sample. Twin Res. 2003, 6, 467–470. [Google Scholar] [CrossRef]
- Pan, Y.; Wang, K. Spousal concordance in academic achievements and IQ a principal component analysis. Open J. Psychiatry 2011, 1, 15–19. [Google Scholar] [CrossRef] [Green Version]
- Bates, D.; Mächler, M.; Bolker, B.; Walker, S. Fitting Linear Mixed-Effects Models Using lme4. J. Stat. Softw. 2015, 67, 1–48. [Google Scholar] [CrossRef]
- Johnson, P.C.D. Extension of Nakagawa & Schielzeth’s R2GLMM to random slopes models. Methods Ecol. Evol. 2014, 5, 944–946. [Google Scholar] [CrossRef] [PubMed] [Green Version]
- Nakagawa, S.; Johnson, P.C.; Schielzeth, H. The coefficient of determination R 2 and intra-class correlation coefficient from generalized linear mixed-effects models revisited and expanded. J. R. Soc. Interface 2017, 14, 20170213. [Google Scholar] [CrossRef] [PubMed] [Green Version]
- Nakagawa, S.; Schielzeth, H. A general and simple method for obtaining R2 from generalized linear mixed-effects models. Methods Ecol. Evol. 2013, 4, 133–142. [Google Scholar] [CrossRef]
- Plassman, B.L.; Welsh, K.A.; Helms, M.; Brandt, J.; Page, W.F.; Breitner, J.C. Intelligence and education as predictors of cognitive state in late life: A 50-year follow-up. Neurology 1995, 45, 1446–1450. [Google Scholar] [CrossRef]
- Katzman, R. Education and the prevalence of dementia and Alzheimer’s disease. Neurology 1993, 43, 13–20. [Google Scholar] [CrossRef]
- Griffith, H.R.; Pyzalski, R.W.; O’Leary, D.; Magnotta, V.; Bell, B.; Dow, C.; Hermann, B.; Seidenberg, M. A controlled quantitative MRI volumetric investigation of hippocampal contributions to immediate and delayed memory performance. J. Clin. Exp. Neuropsychol. 2003, 25, 1117–1127. [Google Scholar] [CrossRef]
- Golomb, J.; Kluger, A.; de Leon, M.J.; Ferris, S.H.; Convit, A.; Mittelman, M.S.; Cohen, J.; Rusinek, H.; De Santi, S.; George, A.E. Hippocampal formation size in normal human aging: A correlate of delayed secondary memory performance. Learn. Mem. 1994, 1, 45–54. [Google Scholar] [CrossRef]
- Hackert, V.H.; den Heijer, T.; Oudkerk, M.; Koudstaal, P.J.; Hofman, A.; Breteler, M.M. Hippocampal head size associated with verbal memory performance in nondemented elderly. Neuroimage 2002, 17, 1365–1372. [Google Scholar] [CrossRef]
- Erickson, K.I.; Prakash, R.S.; Voss, M.W.; Chaddock, L.; Hu, L.; Morris, K.S.; White, S.M.; Wojcicki, T.R.; McAuley, E.; Kramer, A.F. Aerobic fitness is associated with hippocampal volume in elderly humans. Hippocampus 2009, 19, 1030–1039. [Google Scholar] [CrossRef] [Green Version]
- Latimer, C.S.; Brewer, L.D.; Searcy, J.L.; Chen, K.C.; Popovic, J.; Kraner, S.D.; Thibault, O.; Blalock, E.M.; Landfield, P.W.; Porter, N.M. Vitamin D prevents cognitive decline and enhances hippocampal synaptic function in aging rats. Proc. Natl. Acad. Sci. USA 2014, 111, E4359–E4366. [Google Scholar] [CrossRef] [Green Version]
- Goveas, J.S.; Xie, C.; Ward, B.D.; Wu, Z.; Li, W.; Franczak, M.; Jones, J.L.; Antuono, P.G.; Li, S.J. Recovery of hippocampal network connectivity correlates with cognitive improvement in mild Alzheimer’s disease patients treated with donepezil assessed by resting-state fMRI. J. Magn. Reson. Imaging 2011, 34, 764–773. [Google Scholar] [CrossRef] [PubMed] [Green Version]
- Jin, K.; Peel, A.L.; Mao, X.O.; Xie, L.; Cottrell, B.A.; Henshall, D.C.; Greenberg, D.A. Increased hippocampal neurogenesis in Alzheimer’s disease. Proc. Natl. Acad. Sci. USA 2004, 101, 343–347. [Google Scholar] [CrossRef] [PubMed] [Green Version]
- Krishnan, K.R.; Charles, H.C.; Doraiswamy, P.M.; Mintzer, J.; Weisler, R.; Yu, X.; Perdomo, C.; Ieni, J.R.; Rogers, S. Randomized, placebo-controlled trial of the effects of donepezil on neuronal markers and hippocampal volumes in Alzheimer’s disease. Am. J. Psychiatry 2003, 160, 2003–2011. [Google Scholar] [CrossRef]
- Toda, T.; Gage, F.H. Review: Adult neurogenesis contributes to hippocampal plasticity. Cell Tissue Res. 2018, 373, 693–709. [Google Scholar] [CrossRef] [PubMed]
- Snyder, J.S.; Kee, N.; Wojtowicz, J.M. Effects of adult neurogenesis on synaptic plasticity in the rat dentate gyrus. J. Neurophysiol. 2001, 85, 2423–2431. [Google Scholar] [CrossRef] [PubMed] [Green Version]
- Scarmeas, N.; Albert, S.M.; Manly, J.J.; Stern, Y. Education and rates of cognitive decline in incident Alzheimer’s disease. J. Neurol. Neurosurg. Psychiatry 2006, 77, 308–316. [Google Scholar] [CrossRef]
- Akshoomoff, N.; Beaumont, J.L.; Bauer, P.J.; Dikmen, S.S.; Gershon, R.C.; Mungas, D.; Slotkin, J.; Tulsky, D.; Weintraub, S.; Zelazo, P.D.; et al. VIII. NIH Toolbox Cognition Battery (CB): Composite scores of crystallized, fluid, and overall cognition. Monogr. Soc. Res. Child Dev. 2013, 78, 119–132. [Google Scholar] [CrossRef] [Green Version]
- DeYoung, C.G. Openness/intellect: A dimension of personality reflecting cognitive exploration. In APA Handbook of Personality and Social Psychology, Volume 4: Personality Processes and Individual Differences. APA Handbooks in Psychology®; American Psychological Association: Washington, DC, USA, 2015; pp. 369–399. [Google Scholar]
- DeYoung, C.G.; Peterson, J.B.; Higgins, D.M. Sources of openness/intellect: Cognitive and neuropsychological correlates of the fifth factor of personality. J. Pers. 2005, 73, 825–858. [Google Scholar] [CrossRef]
- Schmidt, F.L.; Hunter, J. General mental ability in the world of work: Occupational attainment and job performance. J. Pers. Soc. Psychol. 2004, 86, 162–173. [Google Scholar] [CrossRef] [Green Version]
- Wechsler, D. The Wechsler Adult Intelligence Acale—Revised; The Psychological Corporation: New York, NY, USA, 1981. [Google Scholar]
- Wechsler, D. WAIS-III, Wechsler Adult Intelligence Scal. In Administration and Scoring Manual; The Psychological Corporation: New York, NY, USA, 1997. [Google Scholar]
- Hubbard, R.C. Newest Vital Sign (NVS). Available online: https://pfe-pfizercom-prod.s3.amazonaws.com/health/nvs_flipbook_english_final.pdf (accessed on 1 June 2021).
- Maenner, M.J.; Greenberg, J.S.; Mailick, M.R. Association Between Low IQ Scores and Early Mortality in Men and Women: Evidence from a Population-Based Cohort Study. Am. J. Intellect. Dev. Disabil. 2015, 120, 244–257. [Google Scholar] [CrossRef] [Green Version]
- Henmon, V.A.C.; Nelson, M.J. The Henmon-Nelson tests of mental ability. In Manual for Administration; Houghton-Mifflin Company: Boston, MA, USA, 1954; Volume 171, pp. 297–318. [Google Scholar]
- Willingham, W.W.; Pollack, J.M.; Lewis, C. Grades and test scores: Accounting for observed differences. J. Educ. Meas. 2002, 39, 1–37. [Google Scholar] [CrossRef]


| Category | Strongest Cognitive Capacity GPS | β | 95% CI* (lower) | 95% CI* (upper) | p | Adjusted R2 | |
|---|---|---|---|---|---|---|---|
| IQ | Cognition | CP GPS | 1.42 | 1.32 | 1.51 | 7.74 × 10−179 | 10.4% |
| High School Class Rank | Cognition | EA GPS | 1.86 | 1.69 | 2.02 | 3.07 × 10−101 | 17.1% |
| EducationalAttainment | Cognition | EA GPS | 1.73 | 1.59 | 1.87 | 1.62 × 10−129 | 12.0% |
| HUI3 Cognition Level (R6)** | Cognition | HM GPS | −0.32 | −0.42 | −0.22 | 2.63 × 10⁻¹⁰ | 1.2% |
| Immediate Recall (R6) | Cognitive Task | EA GPS | 0.80 | 0.64 | 0.96 | 5.29 × 10⁻²² | 8.6% |
| Similarity (R4) | Cognitive Task | EA GPS | 1.35 | 1.20 | 1.49 | 3.86 × 10−74 | 5.1% |
| Similarity (R5) | Cognitive Task | EA GPS | 1.27 | 1.12 | 1.41 | 5.05 × 10−65 | 5.6% |
| Similarity (R6) | Cognitive Task | EA GPS | 1.36 | 1.22 | 1.51 | 3.59 × 10−74 | 6.1% |
| Number Series Task | Cognitive Task | HM GPS | 0.94 | 0.85 | 1.04 | 2.55 × 10−78 | 7.9% |
| Category Fluency (R5) | Cognitive Task | EA GPS | 0.95 | 0.74 | 1.16 | 2.03 × 10⁻¹⁸ | 4.9% |
| Category Fluency (R6) | Cognitive Task | CP GPS | 0.61 | 0.46 | 0.75 | 3.45 × 10⁻¹⁶ | 6.0% |
| Delayed Recall (R6) | Cognitive Task | CP GPS | 0.45 | 0.34 | 0.56 | 5.00 × 10⁻¹⁵ | 7.9% |
| Digit Ordering (R5) | Cognitive Task | CP GPS | 0.65 | 0.53 | 0.76 | 4.51 × 10⁻²⁸ | 3.3% |
| Digit Ordering (R6) | Cognitive Task | CP GPS | 0.78 | 0.67 | 0.89 | 8.63 × 10−41 | 5.0% |
| Health Literacy Task (NVS) | Cognitive Task | CP GPS | 0.92 | 0.76 | 1.07 | 2.28 × 10⁻²⁹ | 10.0% |
| Letter Fluency (R5) | Cognitive Task | EA GPS | 0.73 | 0.56 | 0.90 | 7.98 × 10⁻¹⁷ | 4.2% |
| Letter Fluency (R6) | Cognitive Task | CP GPS | 0.61 | 0.50 | 0.71 | 5.01 × 10⁻³⁰ | 5.5% |
| OccupationalEducationScore | Occupational Status | EA GPS | 1.22 | 1.08 | 1.36 | 4.77 × 10−61 | 4.8% |
| OccupationalIncomeScore | Occupational Status | EA GPS | 0.90 | 0.76 | 1.03 | 3.50 × 10−37 | 13.4% |
| Watching TV | Leisure Activity | EA GPS | −0.48 | −0.59 | −0.37 | 4.16 × 10⁻¹⁸ | 1.9% |
| Reading | Leisure Activity | EA GPS | 0.50 | 0.40 | 0.60 | 2.03 × 10⁻²¹ | 4.8% |
| Fishing/Hunting | Leisure Activity | EA GPS | −0.59 | −0.77 | −0.42 | 1.72 × 10⁻¹¹ | 15.3% |
| Attendance to cultural events | Leisure Activity | EA GPS | 0.60 | 0.49 | 0.72 | 2.06 × 10⁻²³ | 4.8% |
| Openness | Personality | EA GPS | 0.57 | 0.42 | 0.71 | 2.19 × 10⁻¹⁴ | 4.0% |
| Dependent Variable | ||||
|---|---|---|---|---|
| Immediate Recall | ||||
| Educational Attainment GPS | Cognitive Performance GPS | Math Ability GPS | Highest Math Class Taken GPS | |
| Age | −0.108 *** | −0.161 *** | −0.160 *** | −0.161 *** |
| (−0.149, −0.066) | (−0.185, −0.136) | (−0.185, −0.136) | (−0.185, −0.136) | |
| GPS | 0.204 *** | 0.032 *** | 0.021* | 0.028 ** |
| (0.077, 0.331) | (0.013, 0.051) | (0.002, 0.040) | (0.009, 0.047) | |
| Years of Educational Attainment | 0.069 *** | 0.070 *** | 0.072*** | 0.070 *** |
| (0.061, 0.077) | (0.062, 0.078) | (0.064, 0.079) | (0.062, 0.078) | |
| Sex | 0.148 *** | 0.149 *** | 0.150 *** | 0.149 *** |
| (0.111, 0.186) | (0.111, 0.186) | (0.112, 0.187) | (0.111, 0.187) | |
| Age:GPS interaction | 0.186 *** | 0.027 ** | 0.026 ** | 0.035 *** |
| (0.069, 0.303) | (0.009, 0.046) | (0.007, 0.044) | (0.017, 0.053) | |
| Log likelihood | −15,805.540 | −15,809.350 | −15,812.970 | −15,808.150 |
| Akaike Inf. Crit. | 31,649.08 | 31,656.71 | 31,663.94 | 31,654.31 |
| Bayesian Inf. Crit. | 31,788.53 | 31,796.16 | 31,803.39 | 31,793.75 |
Publisher’s Note: MDPI stays neutral with regard to jurisdictional claims in published maps and institutional affiliations. |
© 2022 by the authors. Licensee MDPI, Basel, Switzerland. This article is an open access article distributed under the terms and conditions of the Creative Commons Attribution (CC BY) license (https://creativecommons.org/licenses/by/4.0/).
Share and Cite
Joo, Y.Y.; Cha, J.; Freese, J.; Hayes, M.G. Cognitive Capacity Genome-Wide Polygenic Scores Identify Individuals with Slower Cognitive Decline in Aging. Genes 2022, 13, 1320. https://doi.org/10.3390/genes13081320
Joo YY, Cha J, Freese J, Hayes MG. Cognitive Capacity Genome-Wide Polygenic Scores Identify Individuals with Slower Cognitive Decline in Aging. Genes. 2022; 13(8):1320. https://doi.org/10.3390/genes13081320
Chicago/Turabian StyleJoo, Yoonjung Yoonie, Jiook Cha, Jeremy Freese, and M. Geoffrey Hayes. 2022. "Cognitive Capacity Genome-Wide Polygenic Scores Identify Individuals with Slower Cognitive Decline in Aging" Genes 13, no. 8: 1320. https://doi.org/10.3390/genes13081320
APA StyleJoo, Y. Y., Cha, J., Freese, J., & Hayes, M. G. (2022). Cognitive Capacity Genome-Wide Polygenic Scores Identify Individuals with Slower Cognitive Decline in Aging. Genes, 13(8), 1320. https://doi.org/10.3390/genes13081320