Abstract
Reliance on natural gas for power generation has increased the coupling between gas and power networks. While this coupling can bring operational and economic benefits, it can also yield challenges, as the constraints in one system can impact the other. Co-simulation can capture the constraints and interactions between these systems, but so far, there has been limited comparison of co-simulation results to those of an integrated model. In this work, we develop a new co-simulation framework using the HELICS platform and the SAInt tool for modeling transient gas and AC optimal power flow. We evaluate this co-simulation framework against a fully integrated version of the SAInt power and gas simulators, thus providing a benchmarking of the co-simulation approach. We compare results across the two approaches for two test networks and a network representing the Belgian power and gas networks, testing both normal operating conditions and cases with compressor disruptions. In each of the cases tested, we find nearly identical results from the two approaches across various metrics of interest, such as nodal pressure, gas flow rates, and active power generation. This alignment suggests that co-simulation can yield comparable results to fully integrated models for modeling coupled gas and electricity networks.
1. Introduction
Electric power networks and natural gas pipeline systems have grown increasingly coupled in many regions across the globe. In the United States, natural gas supplied just over 40% of total annual electricity generation in 2020, up from 24% the previous decade [1]. Europe has demonstrated similar trends, with natural gas providing 21% of all electricity generated in 2019, double what its value was 25 years prior [2]. The importance of the coupling extends in both directions: in the U.S., electric power was responsible for nearly 40% of all natural gas consumption [3]. This interdependence is expected to continue given the relatively low cost of gas in some parts of the world and as countries transition away from other sources of electricity such as coal.
The increasing linkage between these two sectors can pose operational challenges to both networks. For example, gas generators are highly flexible, and thus sought by electric power system operators to meet peak load requirements or to manage variability from wind and solar. However, ramping by natural gas plants to provide these services has increased the variability in natural gas offtakes from the gas pipeline system, which has traditionally not had to manage this variability [4,5]. Rapid changes in demand from gas generators can reduce pressures on the pipeline network, which can result in the inability to deliver gas to generators or other customers [6]. Furthermore, extreme weather events—such as the Polar Vortex and Winter Storm Uri in the U.S.—can limit the gas pipeline network’s ability to deliver fuel, leading to power outages [7,8].
The operational and reliability challenges posed by the coupling of gas and power systems has led to efforts to develop analytical tools that better capture the interactions of both systems. Two fundamental approaches exist for such coordinated models. The first approach is to develop a single model that represents the operations and constraints of both sectors. This “integrated” approach has the advantage of ensuring that aspects of both sectors are considered in a unified way; however, the size of such problems can pose computational challenges, particularly given the non-linearity of gas pipeline equations. Furthermore, in many cases, modelers may want to leverage pre-existing simulation tools to capture dynamics of the gas and grid subproblems; rebuilding these tools to create an integrated tool may introduce substantial additional work, or, in some cases, may not be feasible.
The second approach is to establish a communication link between two separate models, both of which iterate based on information received from the other. Although such “co-simulations” are not as straightforward as a single, unified problem, they have the advantage of maintaining simpler sub-problems that represent each sector and lend themselves to parallelization. In addition, the co-simulation approach can make use of existing simulation tools that focus on each sector individually, using the relevant inputs and outputs to communicate between the two without having to rebuild the tools entirely.
There are a number of studies that have modeled gas–grid interactions—either from investment or operational perspectives—from both co-optimization and tightly coupled simulation [9,10,11,12] and co-simulation [13,14,15,16] approaches. However, there has been little ability to compare results from the two methods to determine how the results from co-simulation compare to those from a fully integrated simulation. Validation that co-simulation provides comparable results in the gas–grid modeling domain would offer support for the greater utilization of co-simulation for problems where a fully integrated model may be computationally intractable, time-intensive, or difficult to arrange due to the use of pre-existing simulation tools.
In this study, we address this gap by developing a co-simulation framework for coupled modeling of a bulk power electric grid and a transmission-level natural gas pipeline system. This framework is developed for the SAInt simulation tool, utilizing the HELICS co-simulation platform. We then evaluate results from this co-simulation platform against those from coupled simulation, using the same modeling tools, gas and electricity network data, and scenario conditions. We compare results across six different case studies, including three distinct network topologies and scenarios with disruptions on the natural gas network via compressor failure. By developing and validating this co-simulation framework, this study also supplies a new gas–grid modeling tool that can be utilized for future research on coordination between the two sectors.
In Section 2, we present details on the gas and power system modeling tool utilized in this study and the co-simulation framework that we develop for this tool. We also outline the test cases used for validation of the co-simulation approach. Subsequently, Section 3 evaluates the co-simulation and fully integrated approaches using key metrics of the two networks, such as generator dispatch, unserved energy, nodal gas delivery and pressures, and compressor station pressure ratio and driver power.
2. Materials and Methods
2.1. SAInt Modeling Tool
At the core of the co-simulation framework of this study is the Scenario Analysis Interface for Energy Systems modeling tool (SAInt), a commercially available software developed by encoord for modeling the operations of natural gas pipeline and electric networks [17]. On the power simulation side, the model utilizes a quasi-dynamic AC optimal power flow to determine the optimal dispatch of the network generators after considering load profiles, network topology, intertemporal constraints (e.g., generator ramp limits, start-up time), and other generator characteristics. On the gas network side, the pipeline transmission is modeled using a transient hydraulic simulation model that takes into account constraints and control set points of controlled facilities, such as the minimum delivery pressures at each gas node, compression ratio and driver power constraints of compressor stations, and the operating envelope of gas storage facilities.
Linking the electric and gas portions of the SAInt model are coupling equations that define the interactions between corresponding two components. For example, gas-fired power plants are represented as offtakers of natural gas on the gas pipeline network and suppliers of electric power on the power network. There are several other possible coupling points between gas and power networks; these include compressor stations powered by electricity, liquefied natural gas (LNG) terminals that typically require electricity to inject or remove gas from the pipeline system, and electrolyzers or other facilities that consume electricity to produce hydrogen and inject it into the pipeline network. Although this study focuses primarily on the linkage from gas-fired power plants and does not explicitly consider networks with other types of coupling, the tools and methods we develop are extensible to cases that consider such interactions.
For gas-fired power plants, the central coupling relates to the quantity of gas consumed by the plant to provide its active power requirement. This quantity of gas can be determined by calculating the required thermal power of generator g based on its heat rate (HR) and active power setpoint (PG); this relationship is detailed in Equation (1), as derived in Pambour et al. [17].
In this equation, is the required thermal power at gas generator g (MW), is the active power generation (MW), and and are coefficients for the quadratic heat rate function of each generator, g. The physical gas flow required to supply this thermal power can then be calculated based on the energy content of the gas, shown in Equation (2) [17].
Equation (2) is a coupling equation for gas-fired power plants, where the gas flow Q (sm3/s) at node j is computed as a function of the gross calorific value (GCV) of the gas (MJ/sm3) and the total thermal power PT (MW) of all generators g that are coupled to node j, indicated by the mapping Mgj. This coupling equation is defined for all generators g that are mapped to nodes j on the gas network.
The coupling equation provides the link between the constraints of the two systems. To increase active power generation, gas-fired power plants must increase their consumption of gas fuel. Doing so increases the flow rate of delivered gas at the connected node, which, all else equal, decreases the pressure at that delivery node. As most gas-fired power plants have minimum pressure requirements for operation, the ability to increase offtakes may be constrained, resulting in curtailed gas generator power output. If the gas network can increase flows to the specified node, then the increased offtake can be satisfied, but doing so depends on the gas network linepack, pipeline capacity, compressor operations, and other demands for gas at those times.
2.2. Co-Simulation Framework
When mapping is provided between gas-fired power plants and gas nodes, the SAInt tool can be run in a combined simulation mode that simultaneously considers the constraints on each system as well as the coupling equations as a single mathematical program for every timestep (i.e., integrated simulation). However, the SAInt model can also be configured to run the gas and power networks independently, and it is this feature that we utilize to develop the co-simulation framework.
In the co-simulation mode, “federates” representing the power and gas networks are solved separately, with each simulation tool or network serving as a federate and the relevant coupling information being passed between them. To coordinate passing messages between the two federates and to control the timing of the simulation, we utilize the Hierarchical Engine for Large-scale Infrastructure Co-simulation (HELICS), which is a co-simulation framework that supports co-iteration across distinct simulators [18]. HELICS manages the data flows and timing between the federates, enabling communication and coupling between the two. We select HELICS for this study because it supports co-simulation with iteration at each timestep until simulators have converged. In addition, although the co-simulation validation in this work involves two relatively simple federates, HELICS is an open-source tool with bindings to a wide range of programming languages and can support scaling up many federates for more complex co-simulations [19].
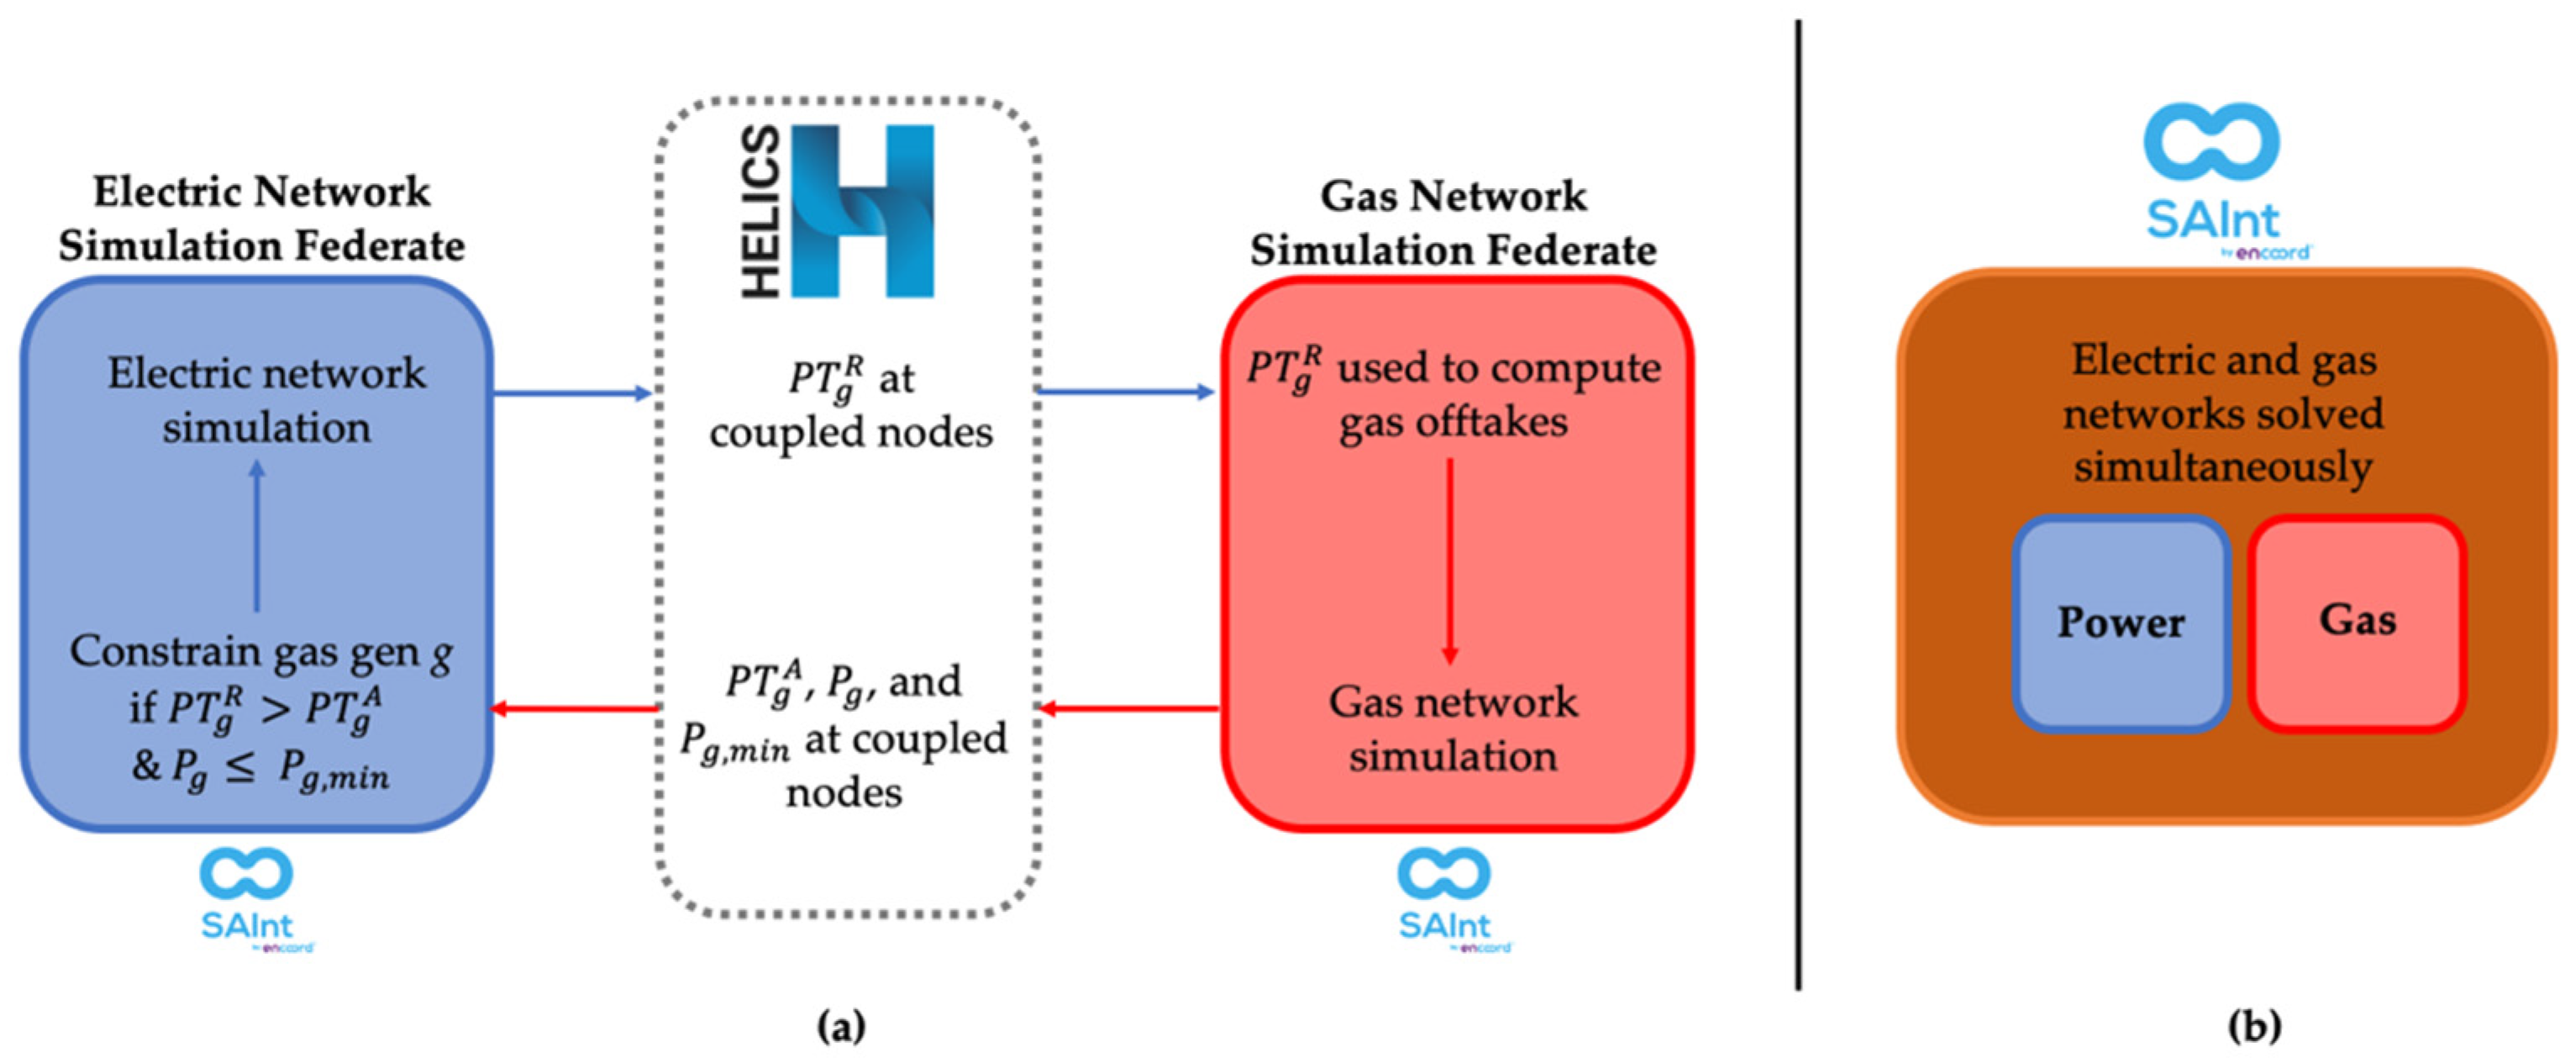
Figure 1 illustrates the conceptual framework of the co-simulation approach relative to the integrated model. The primary data passed between the federates are thermal power for each generator (). The power federate first estimates the requested thermal power () based on load and generator characteristics, which is sent via HELICS to the gas federate. The gas federate uses the values for to determine the volume of gas needed at each coupled node via Equation (2), and then simulates to determine how much gas offtake is feasible given the gas network constraints. This value is converted to available thermal power () for each generator, which the gas federate returns to the power federate via HELICS.
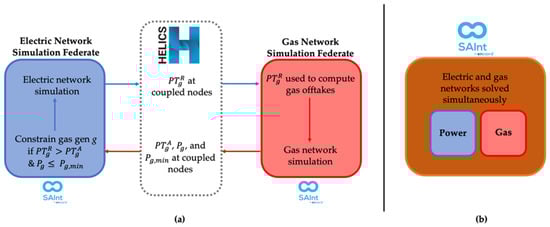
Figure 1.
Conceptual depiction of the (a) co-simulation framework developed in this study, with a comparison to (b) the integrated simulation approach used for benchmarking.
In addition to available thermal power, the gas federate also passes information on the minimum and actual delivery pressure values at the coupled generator. The power federate then uses the requested () and available () and as well as the offtake pressure for that generator ()—based on its coupled gas node—as inputs to determine whether generators must be curtailed. In the case that requested thermal is less than what is available, the dispatch is feasible and no further action is necessary. If , the co-simulation uses the pressure to determine whether action is needed. If the pressure of the node is at its minimum allowable level (), then the available is treated as a hard constraint and is used to cap the value of the requested thermal power in the next iteration. If the pressure is above the minimum level, more gas could be feasibly delivered to that node without violating pressure constraints; as such, is not used to constrain the generator. In this case, the co-simulation continues to iterate on the same timestep to ensure the gas and electric networks are both optimized.
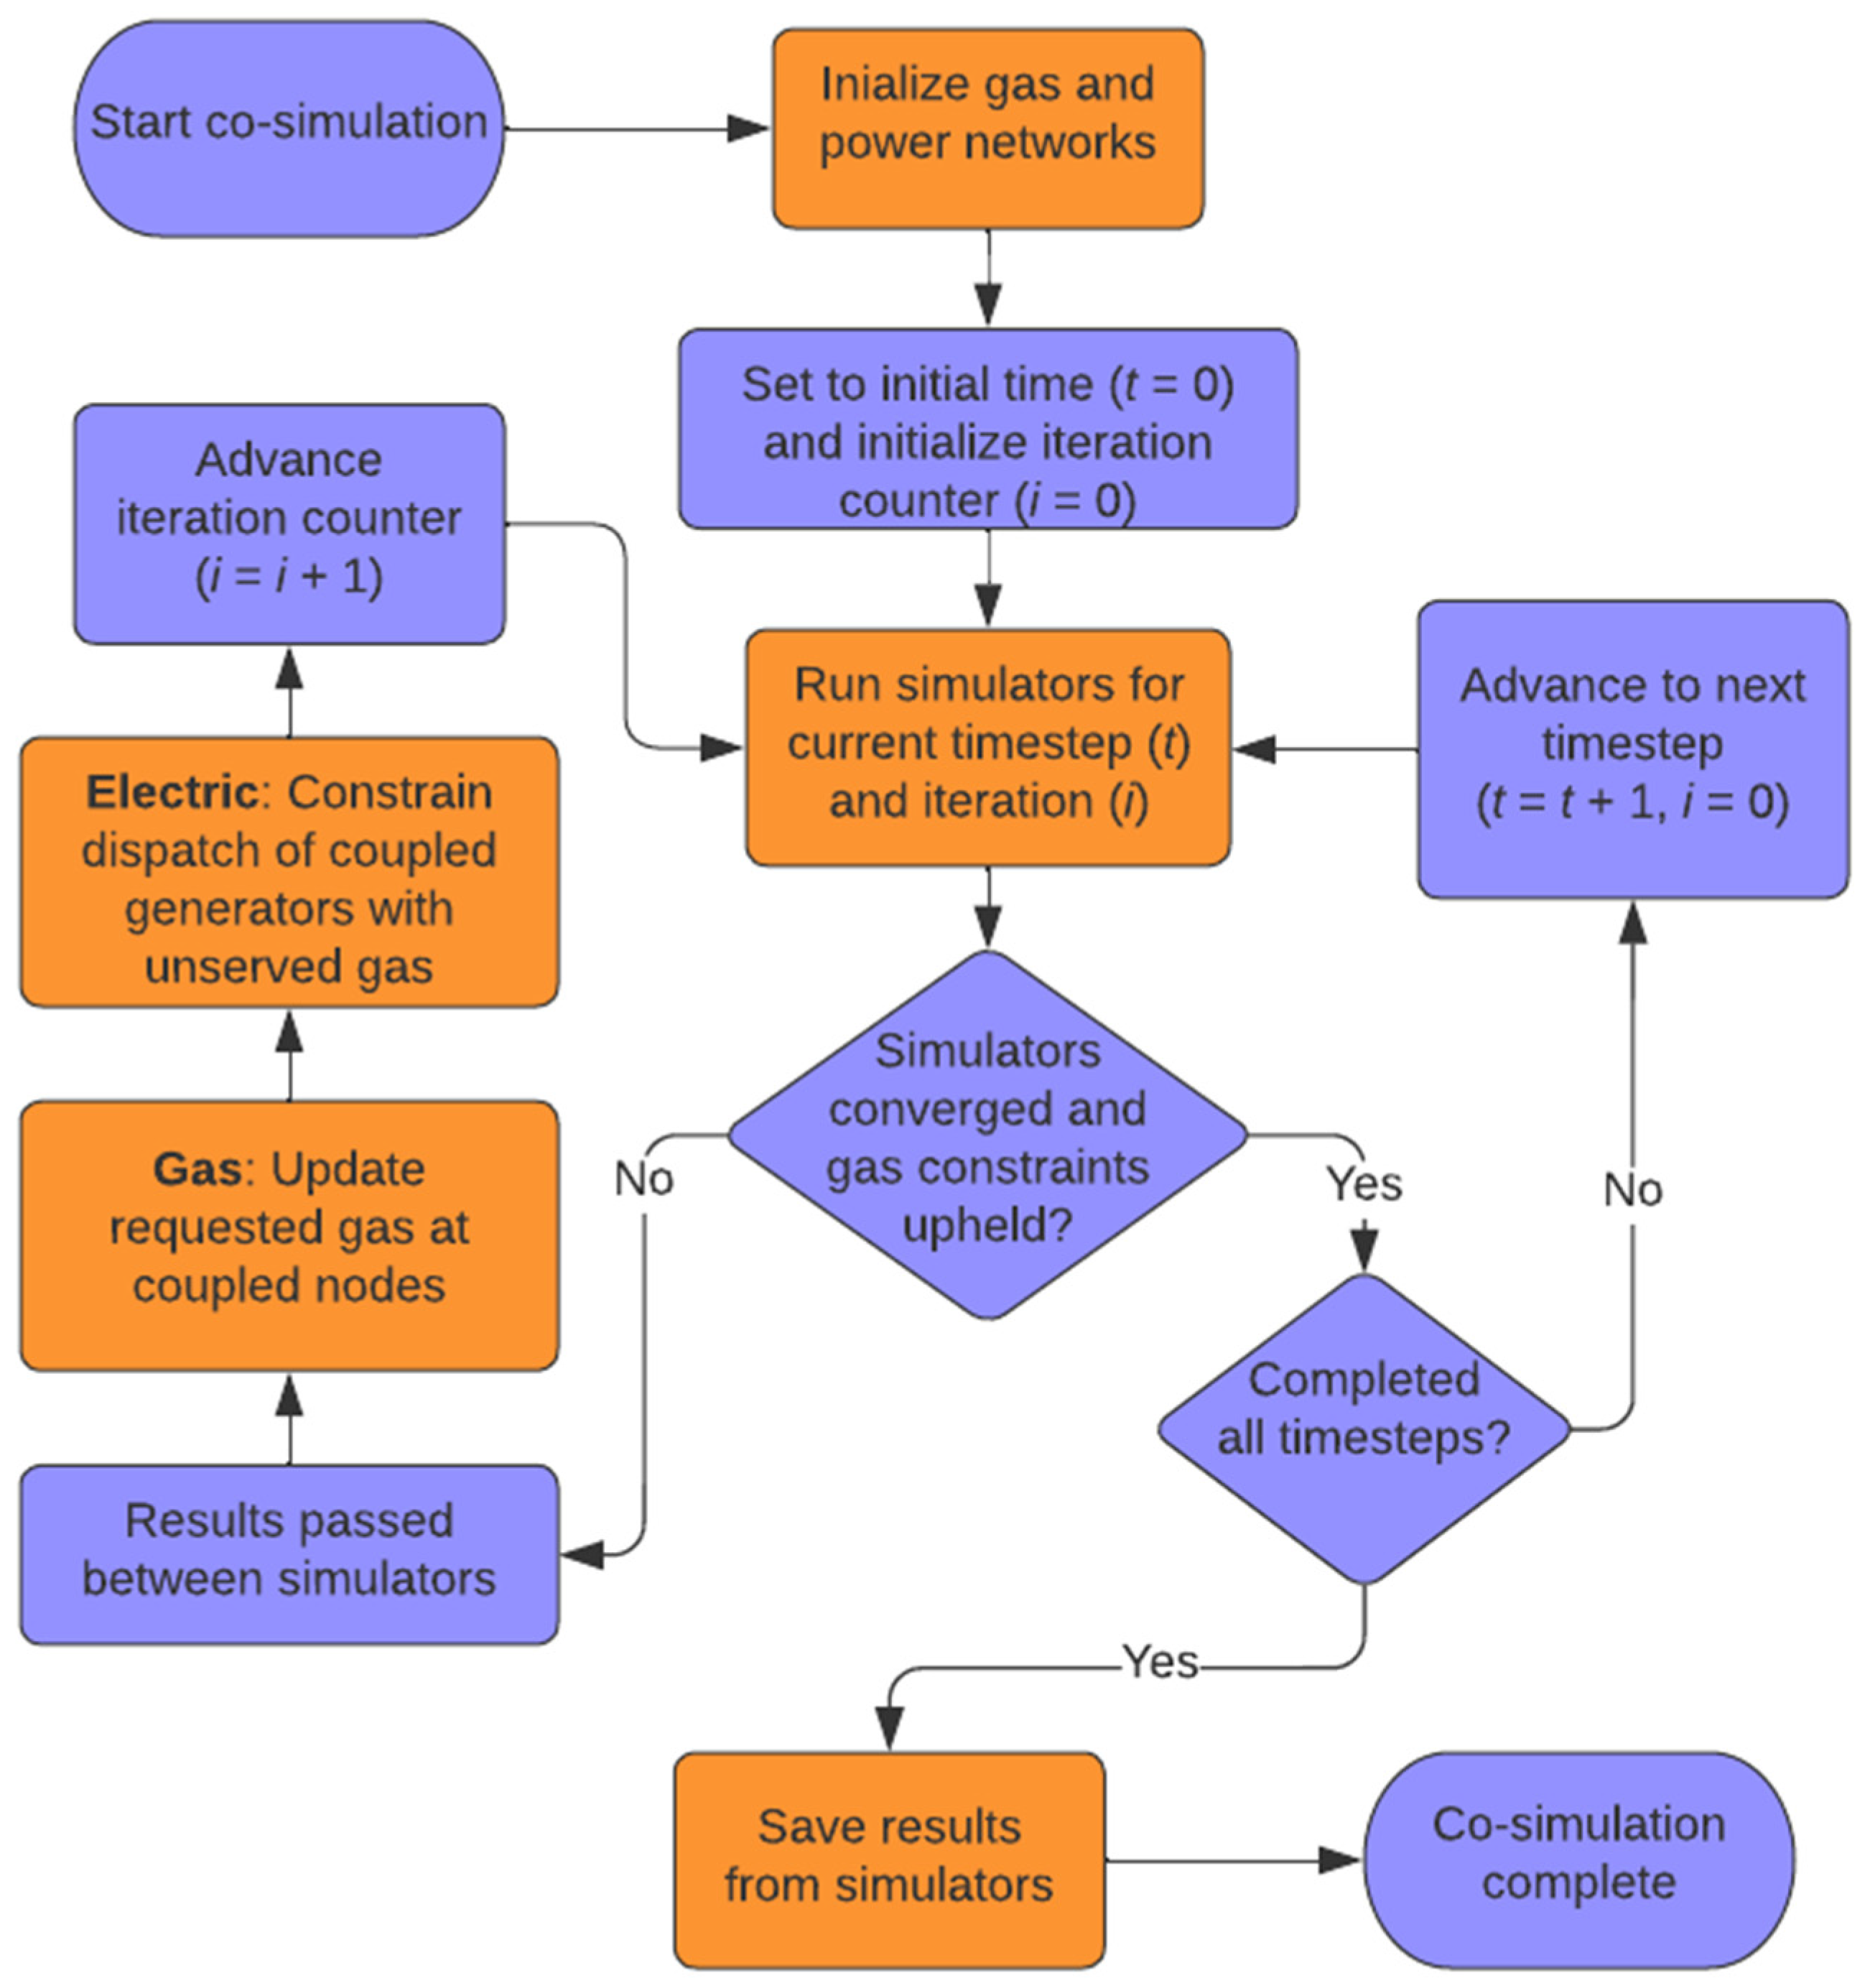
Because the constraints from the two federates are no longer directly integrated, they must be solved iteratively at each timestep to ensure that all constraints are upheld in the last solution. Figure 2 illustrates the analytical process governing the co-simulation. Information on the required and available thermal power is passed via HELICS between the federates at each timestep until the co-simulation converges. Convergence is determined when there are no violations in gas delivery () and when the changes between values for requested thermal power across iterations are below a tolerance level (, where is a tolerance level specified at 0.001), with limit of 20 iterations for each timestep.

Figure 2.
Analytical structure of the co-simulation framework, where t represents a timestep and i represents an iteration. Objects in purple indicate stages coordinated by the HELICS co-simulation framework, and objects in orange indicate stages run by the gas and electric federates. The electric and gas federates iterate on each timestep until convergence and then move to the subsequent timestep.
2.3. Test Cases
We validate the co-simulation approach by comparing results against the combined SAInt model, as depicted in Figure 1 above. For this comparison, we evaluate results from both approaches against three distinct test networks, described in more detail below. To benchmark the co-simulation framework’s performance, we explicitly developed test cases that are sufficiently small to be solved as a fully integrated model. Thus, although in the case of this analysis, there is no direct computational benefit to co-simulation, the intent is to provide a foundation for co-simulation in cases where an integrated model is not feasible or co-simulation might be preferred.
Each test network is evaluated under two scenarios: a scenario reflecting normal operating conditions, and a scenario in which a compressor station fails during the simulation. The combination creates a total of six scenarios evaluated, as summarized in Table 1. Data for the demo networks the scenarios tested in this paper are open access and available on Github at https://github.com/NREL/SAInt_HELICS_interface (accessed on 11 April 2022).

Table 1.
Description of the test cases used to evaluate the co-simulation.
2.3.1. Demo Model
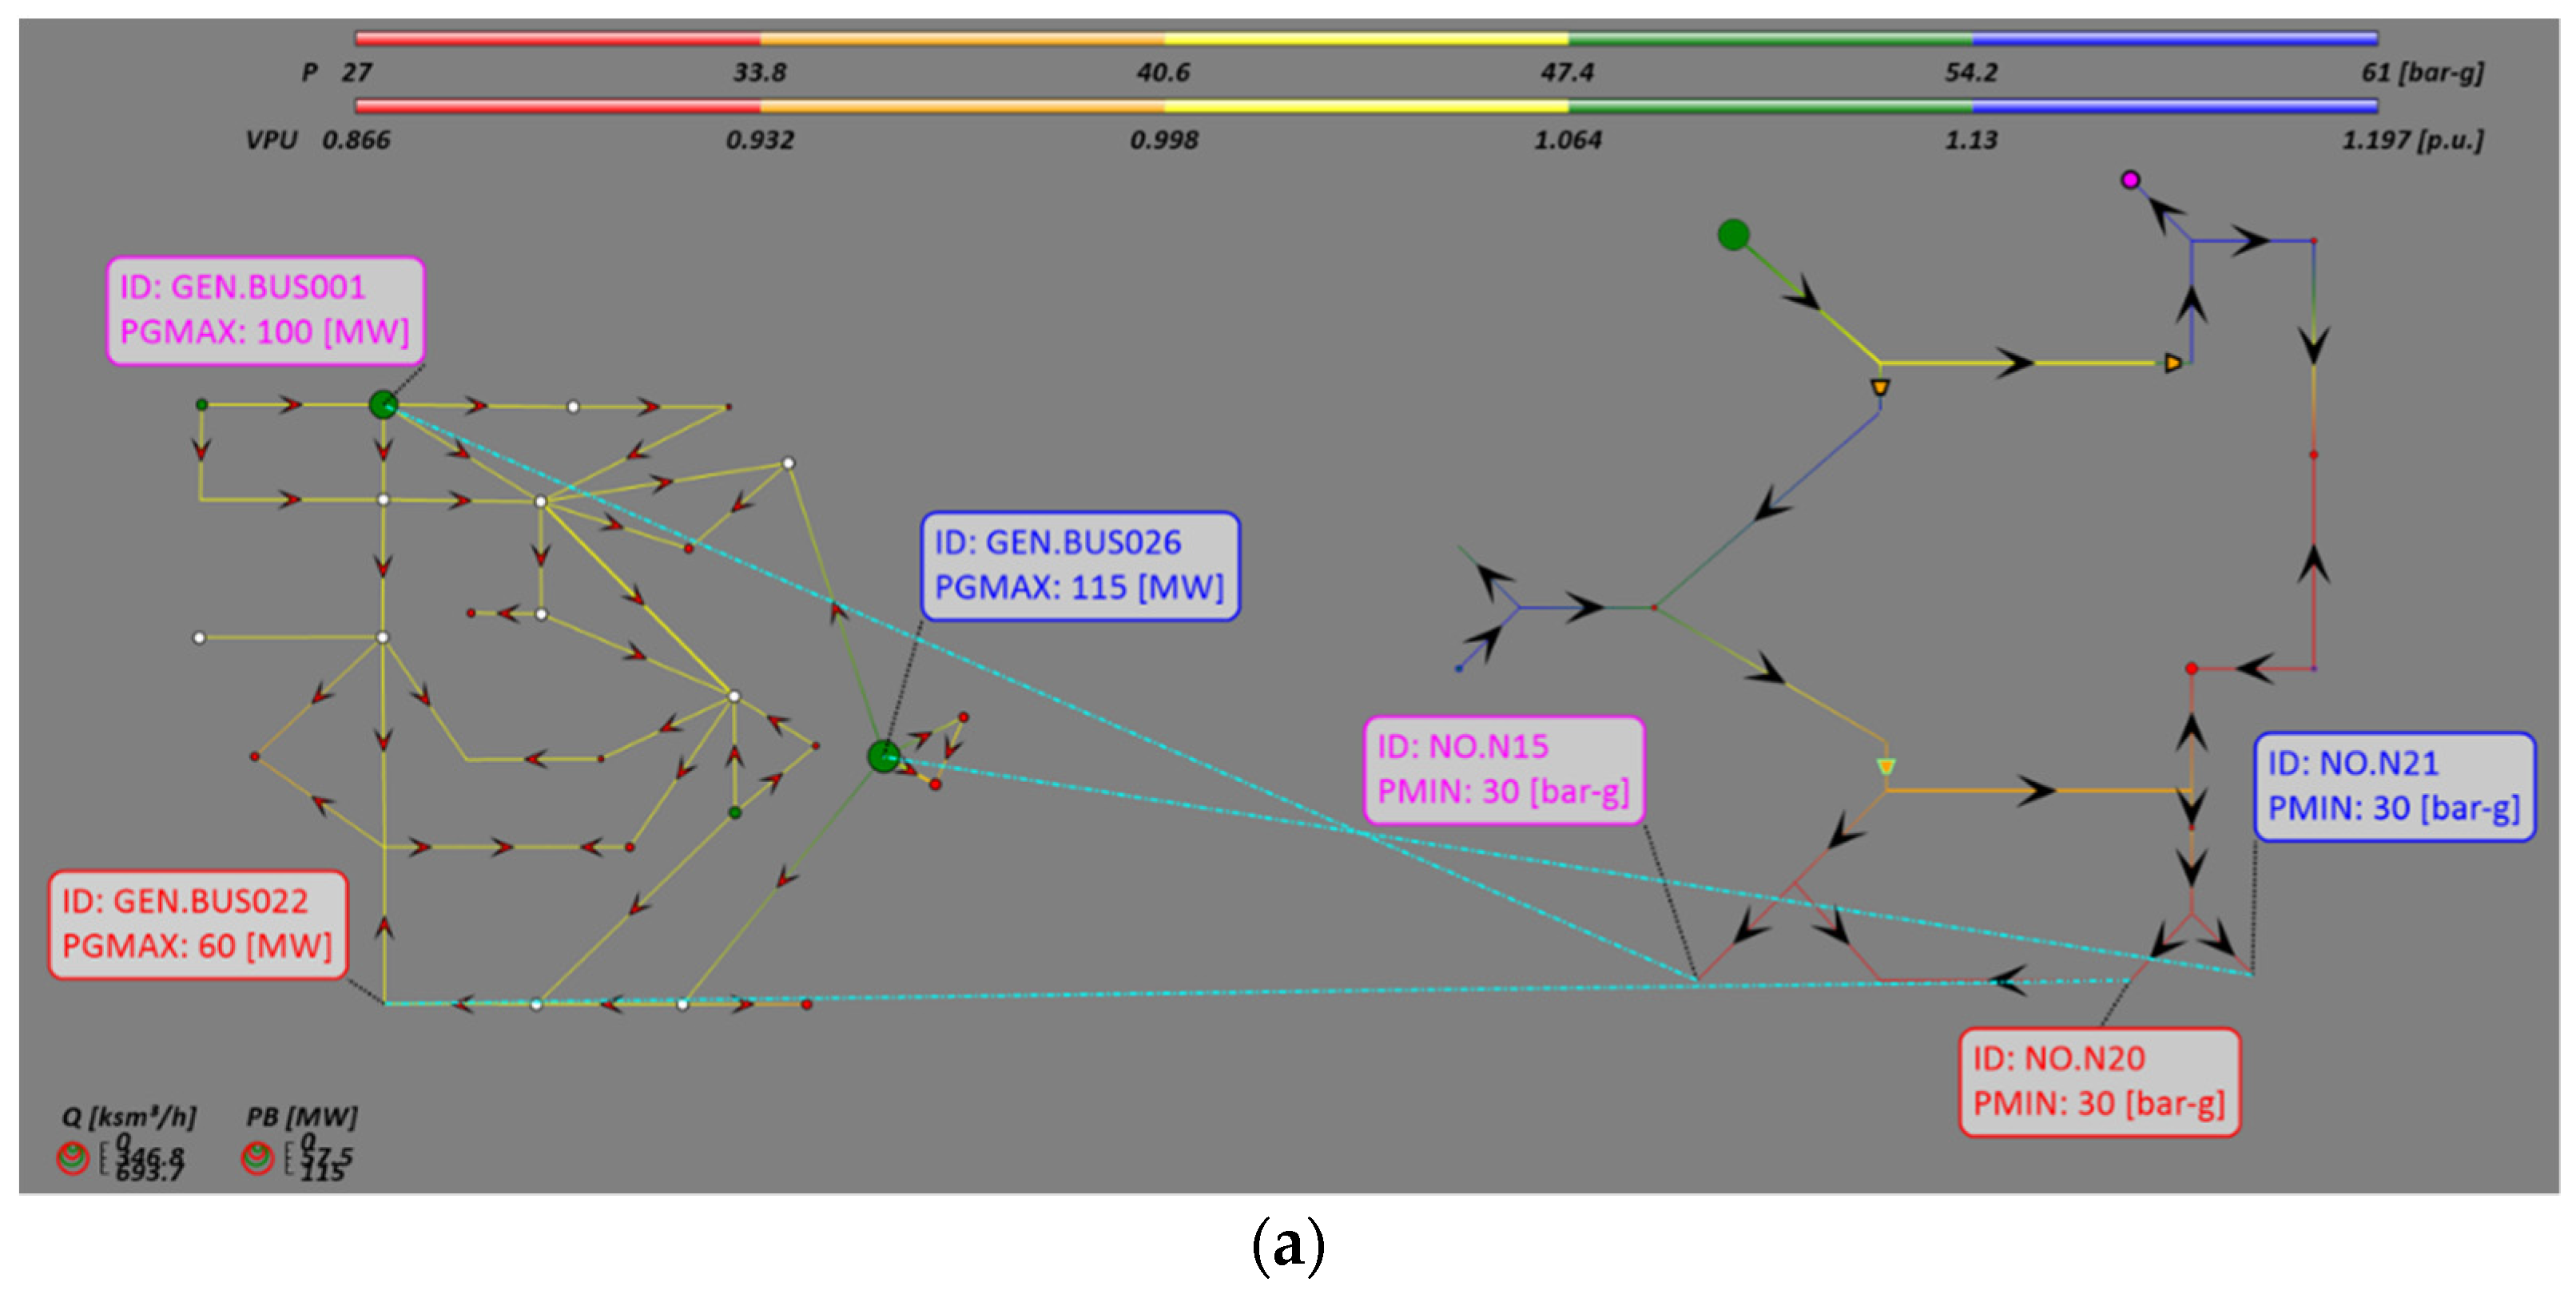
The demo model consists of a 25-node gas pipeline network and a 30-bus electric network. The gas network has 23 pipes, 3 compressors (at nodes NO1, NO3, and NO7), 1 LNG facility (at NO10), and 1 underground gas storage (at NO22). The electricity network consists of 41 lines and 6 generators (at buses BUS000, BUS001, BUS012, BUS021, BUS022, and BUS026), 3 of which are gas-fired power plants. The network parameters and scenario data are adapted from [17].
We test two variants of this demo network: a “base” model with the coupled gas generators in one part of the system typically intended for receiving gas deliveries, and an “alternate” configuration in which the coupled generators are distributed across the gas network. Figure 3 depicted the networks and configurations for both cases, while Table 2 provides an overview of the coupled generators and gas nodes, and the minimum delivery pressure at each coupled node. Additional constraints include minimum delivery pressures at all gas nodes; compression ratio and driver power constraints at the compressor stations; and flow rate constraints on pipelines, supply points, and offtake nodes.
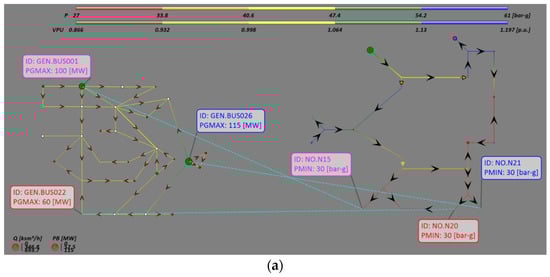
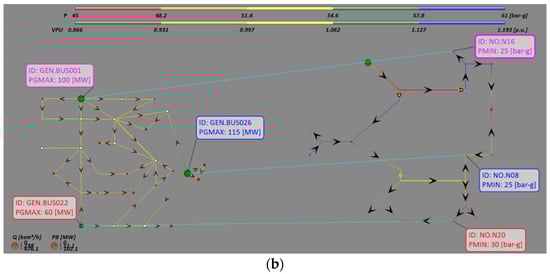
Figure 3.
Depiction of the demo electricity (left) and gas networks (right). Circles represent electric buses or gas nodes, while orange trapezoids represent compressor stations. The light blue dashed lines indicate gas-fired power plants and their corresponding offtake node on the gas network. Panel (a) illustrates the base configuration, whereas panel (b) highlights an alternate configuration of the coupled generators.
Table 2.
Overview of coupled generators and gas node in each demo network, with details on the minimum delivery pressure (Pmin) at each gas generator node.
Both demo networks simulate 24 h of operations at 15 min resolution, with load profile data taken from load shapes representative of the winter period [17]. In the compressor outage scenario, compressor station CS2 toward the bottom of the network is disrupted from 6:00 p.m. onwards.
2.3.2. Belgian Model
In addition to the demo networks, we test the co-simulation on a larger, more realistic system using data on the Belgian power and gas system. The gas network of this system comprises 147 nodes, 172 pipeline sections, and 3 compressor stations, synthesized from [20,21]. The electricity network includes 58 buses and 83 transmission lines based on data from the system operator [22]. The 13 generators in the network comprise approximately 10 GW of installed capacity. Four of the generators are gas-fired power plants, representing approximately 15% of the installed capacity on the system; the remainder of the capacity on the system is made up of nuclear (30% of total capacity), wind (29%), hydro (13%), coal (9%), and other fuel types (5%). Figure 4 depicts the combined networks for the Belgian case, and Table 3 provides the coupled nodes of the four gas-fired power plants in the system.
Figure 4.
Depiction of the Belgian electricity (top) and gas networks (bottom). Circles represent electric buses or gas nodes, and the orange trapezoids represent compressor stations. Labels indicate coupled natural gas generators and their gas network nodes.
Table 3.
Overview of coupled generators and gas nodes in the Belgian network, with the minimum delivery pressure (Pmin) at each node.
The Belgian model scenarios simulate 24 h of operation based on data from February 2018 and are simulated at a resolution of 15 min. In the compressor outage scenario, compressor station CS1 in the central portion of the network is disrupted from 8:00 a.m. onwards.
3. Results
Here, we present a comparison of the results from the integrated simulation and co-simulation approaches. We first compare results for the gas network, followed by results from the electricity network, and subsequently, a summary of the co-simulation performance. All scenarios were run on the same computer, equipped with two Intel® Xenon® Gold 2.50 GHz processors and 32 GB RAM running Windows 10.
3.1. Gas Network Results
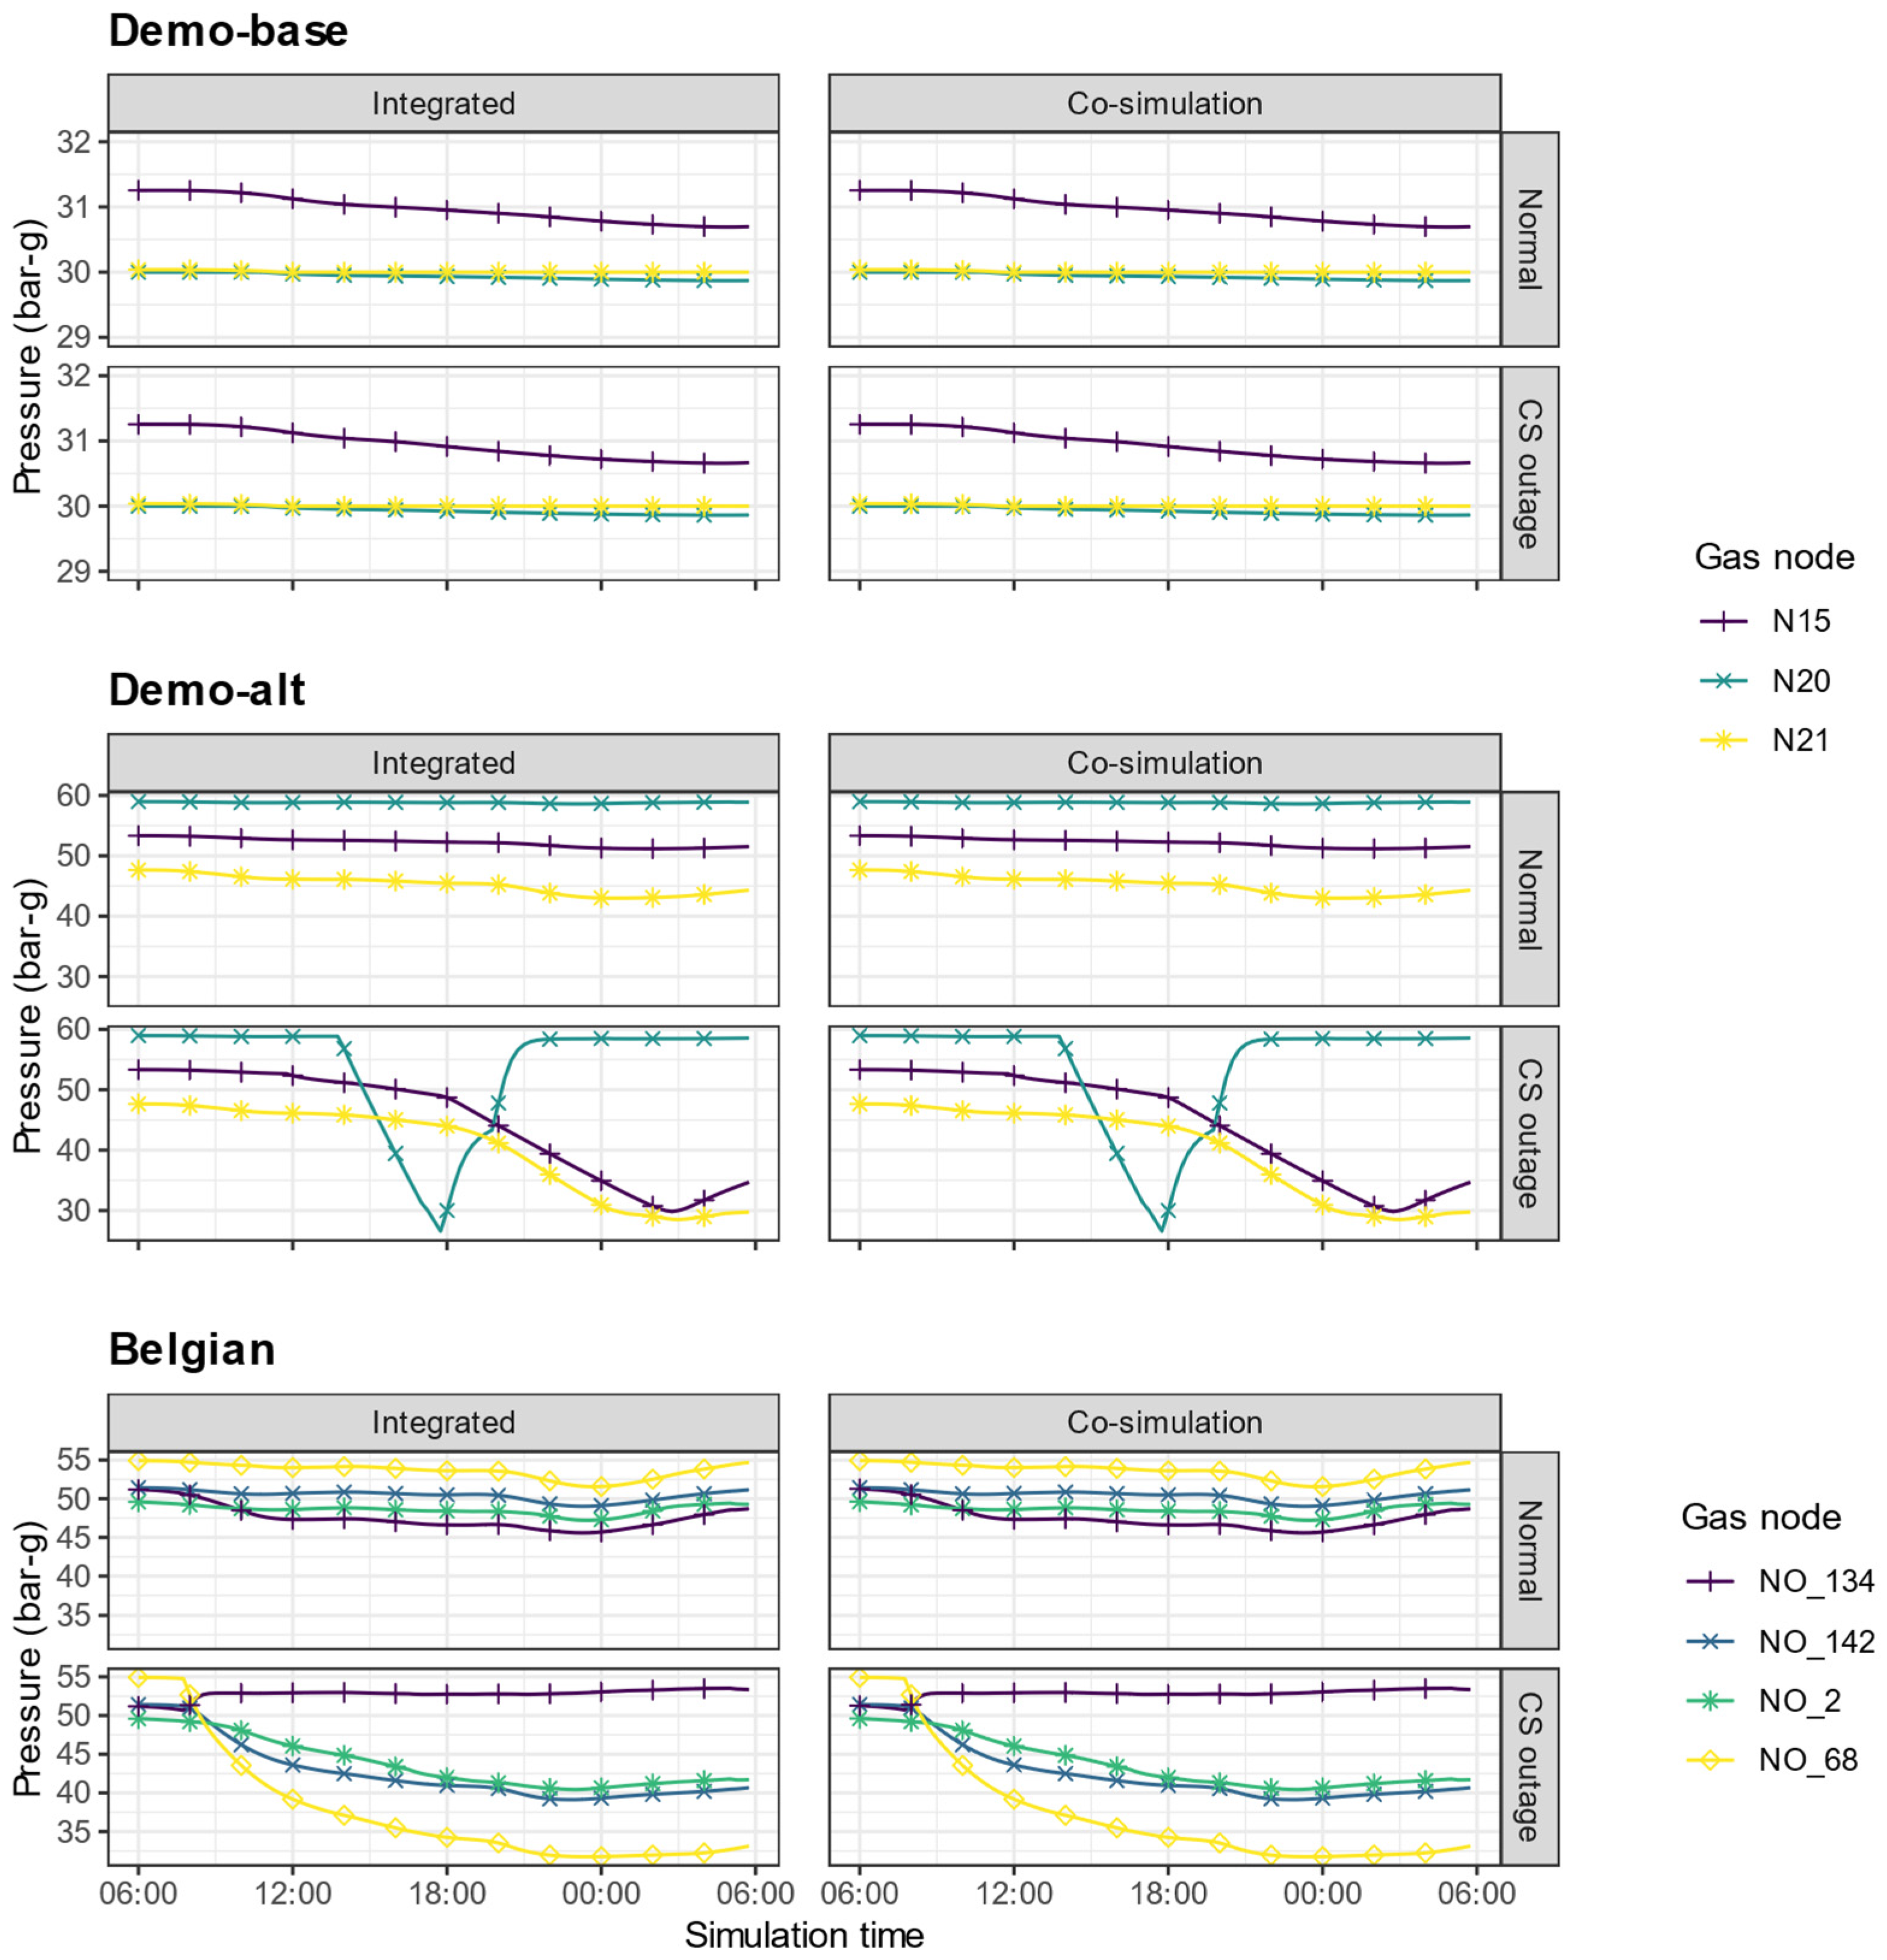
Figure 5 summarizes the pressure (in bar-g) at gas delivery nodes in the nodes network over a 15 min timestep of the 24 h simulation for each combination of network and disruption scenario, with the left column providing results for the fully integrated, coupled simulation and the right side providing results for the co-simulation framework. Figure 6 provides a similar overview, focusing on gas flow at the offtake nodes, which may be coupled to gas generators or provide gas for non-power sector users.
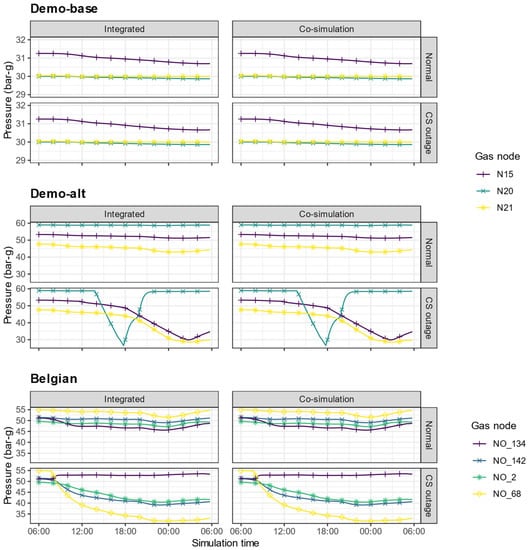
Figure 5.
Pressure (bar-g) at gas delivery nodes that are coupled to the power system for each network and disruption scenario. The maximum MAPE across all scenarios is 0.012%.
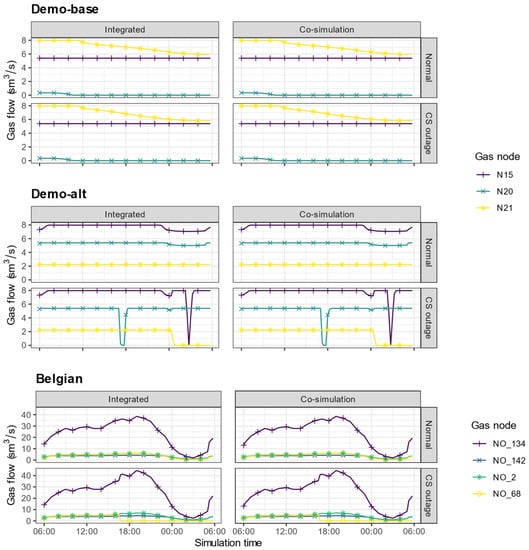
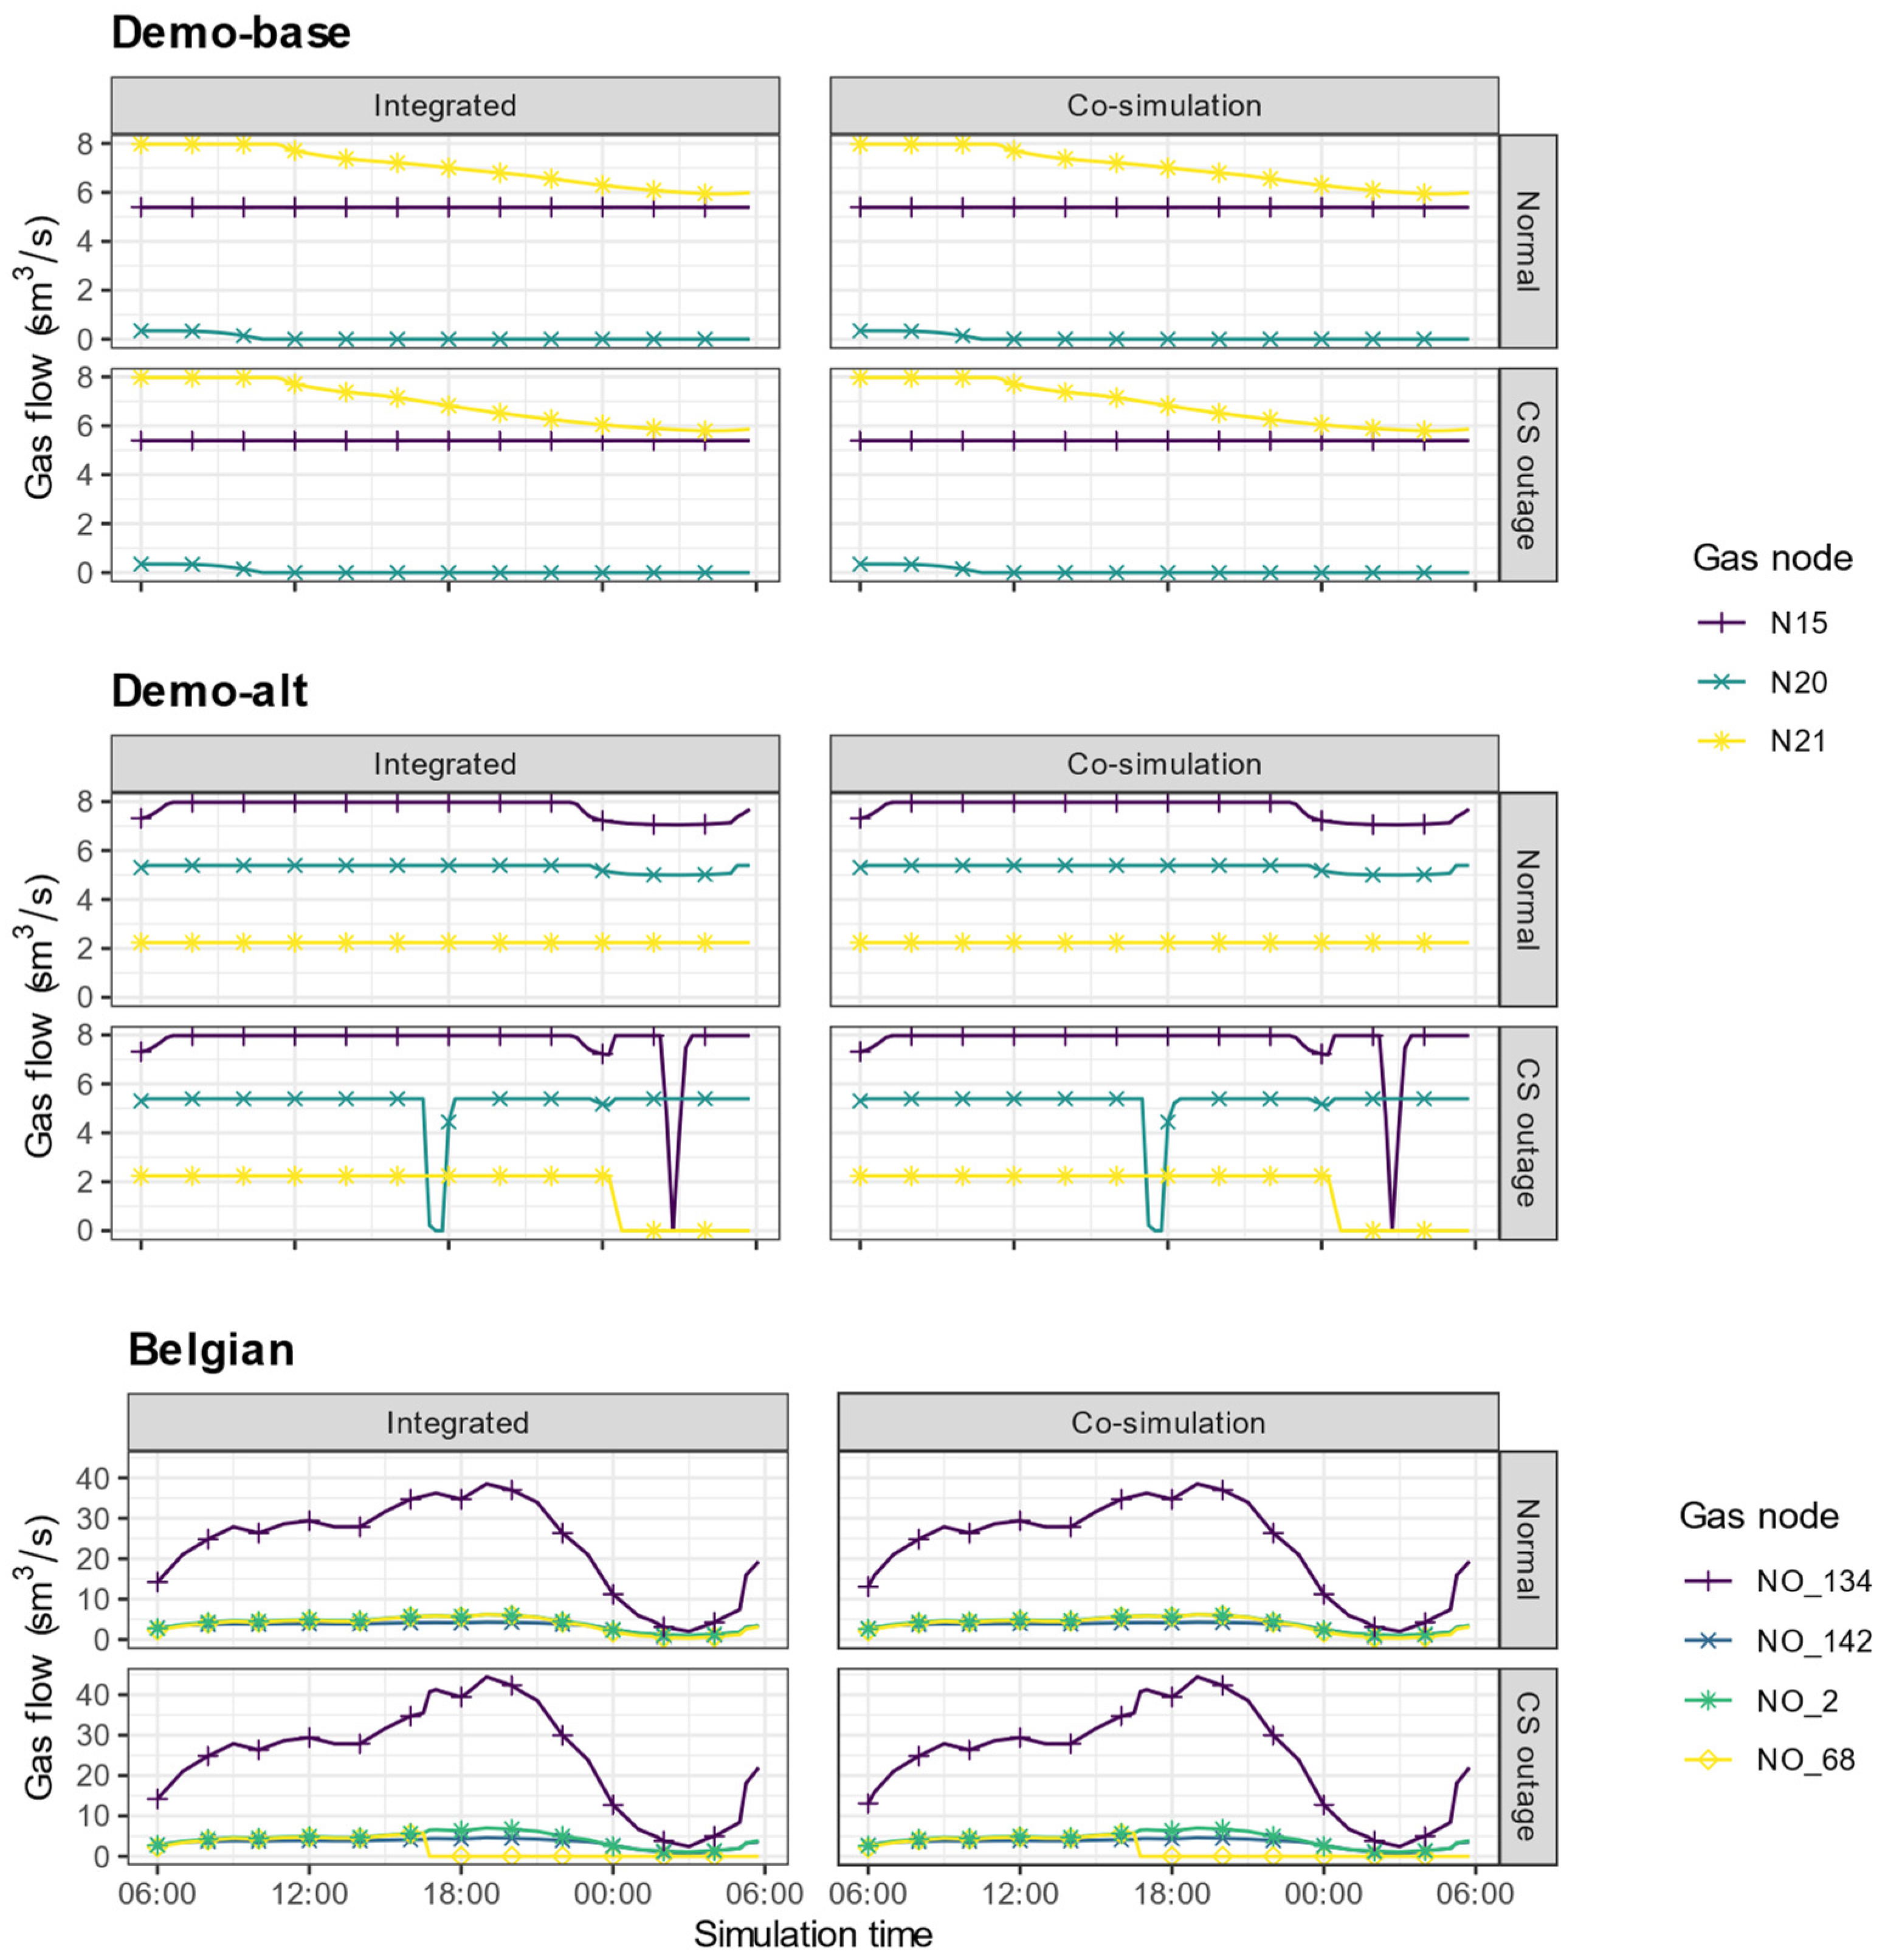
Figure 6.
Gas flow (sm3/s) at gas delivery nodes that are coupled to the power system for each network and disruption scenario. The maximum MAPE across all scenarios is 0.0015%.
The figures illustrate nearly identical behavior in the gas network operations across the coupled simulation and co-simulation cases. The co-simulation framework captures the dynamics in the pressure and gas flow for each of the three systems tested. Furthermore, changes in pressure and nodal deliveries due to the compressor disruption in each of the networks have consistent impacts across the nodes of each of the systems. For pressure, the maximum deviation between the integrated and co-simulation cases for any timestep across all scenarios is 1.8%, whereas the mean average percent error (MAPE) across all timesteps is lower than 0.012% for all scenarios. For gas flow, the maximum difference is close to 0.6%, and the largest MAPE is 0.0015%.
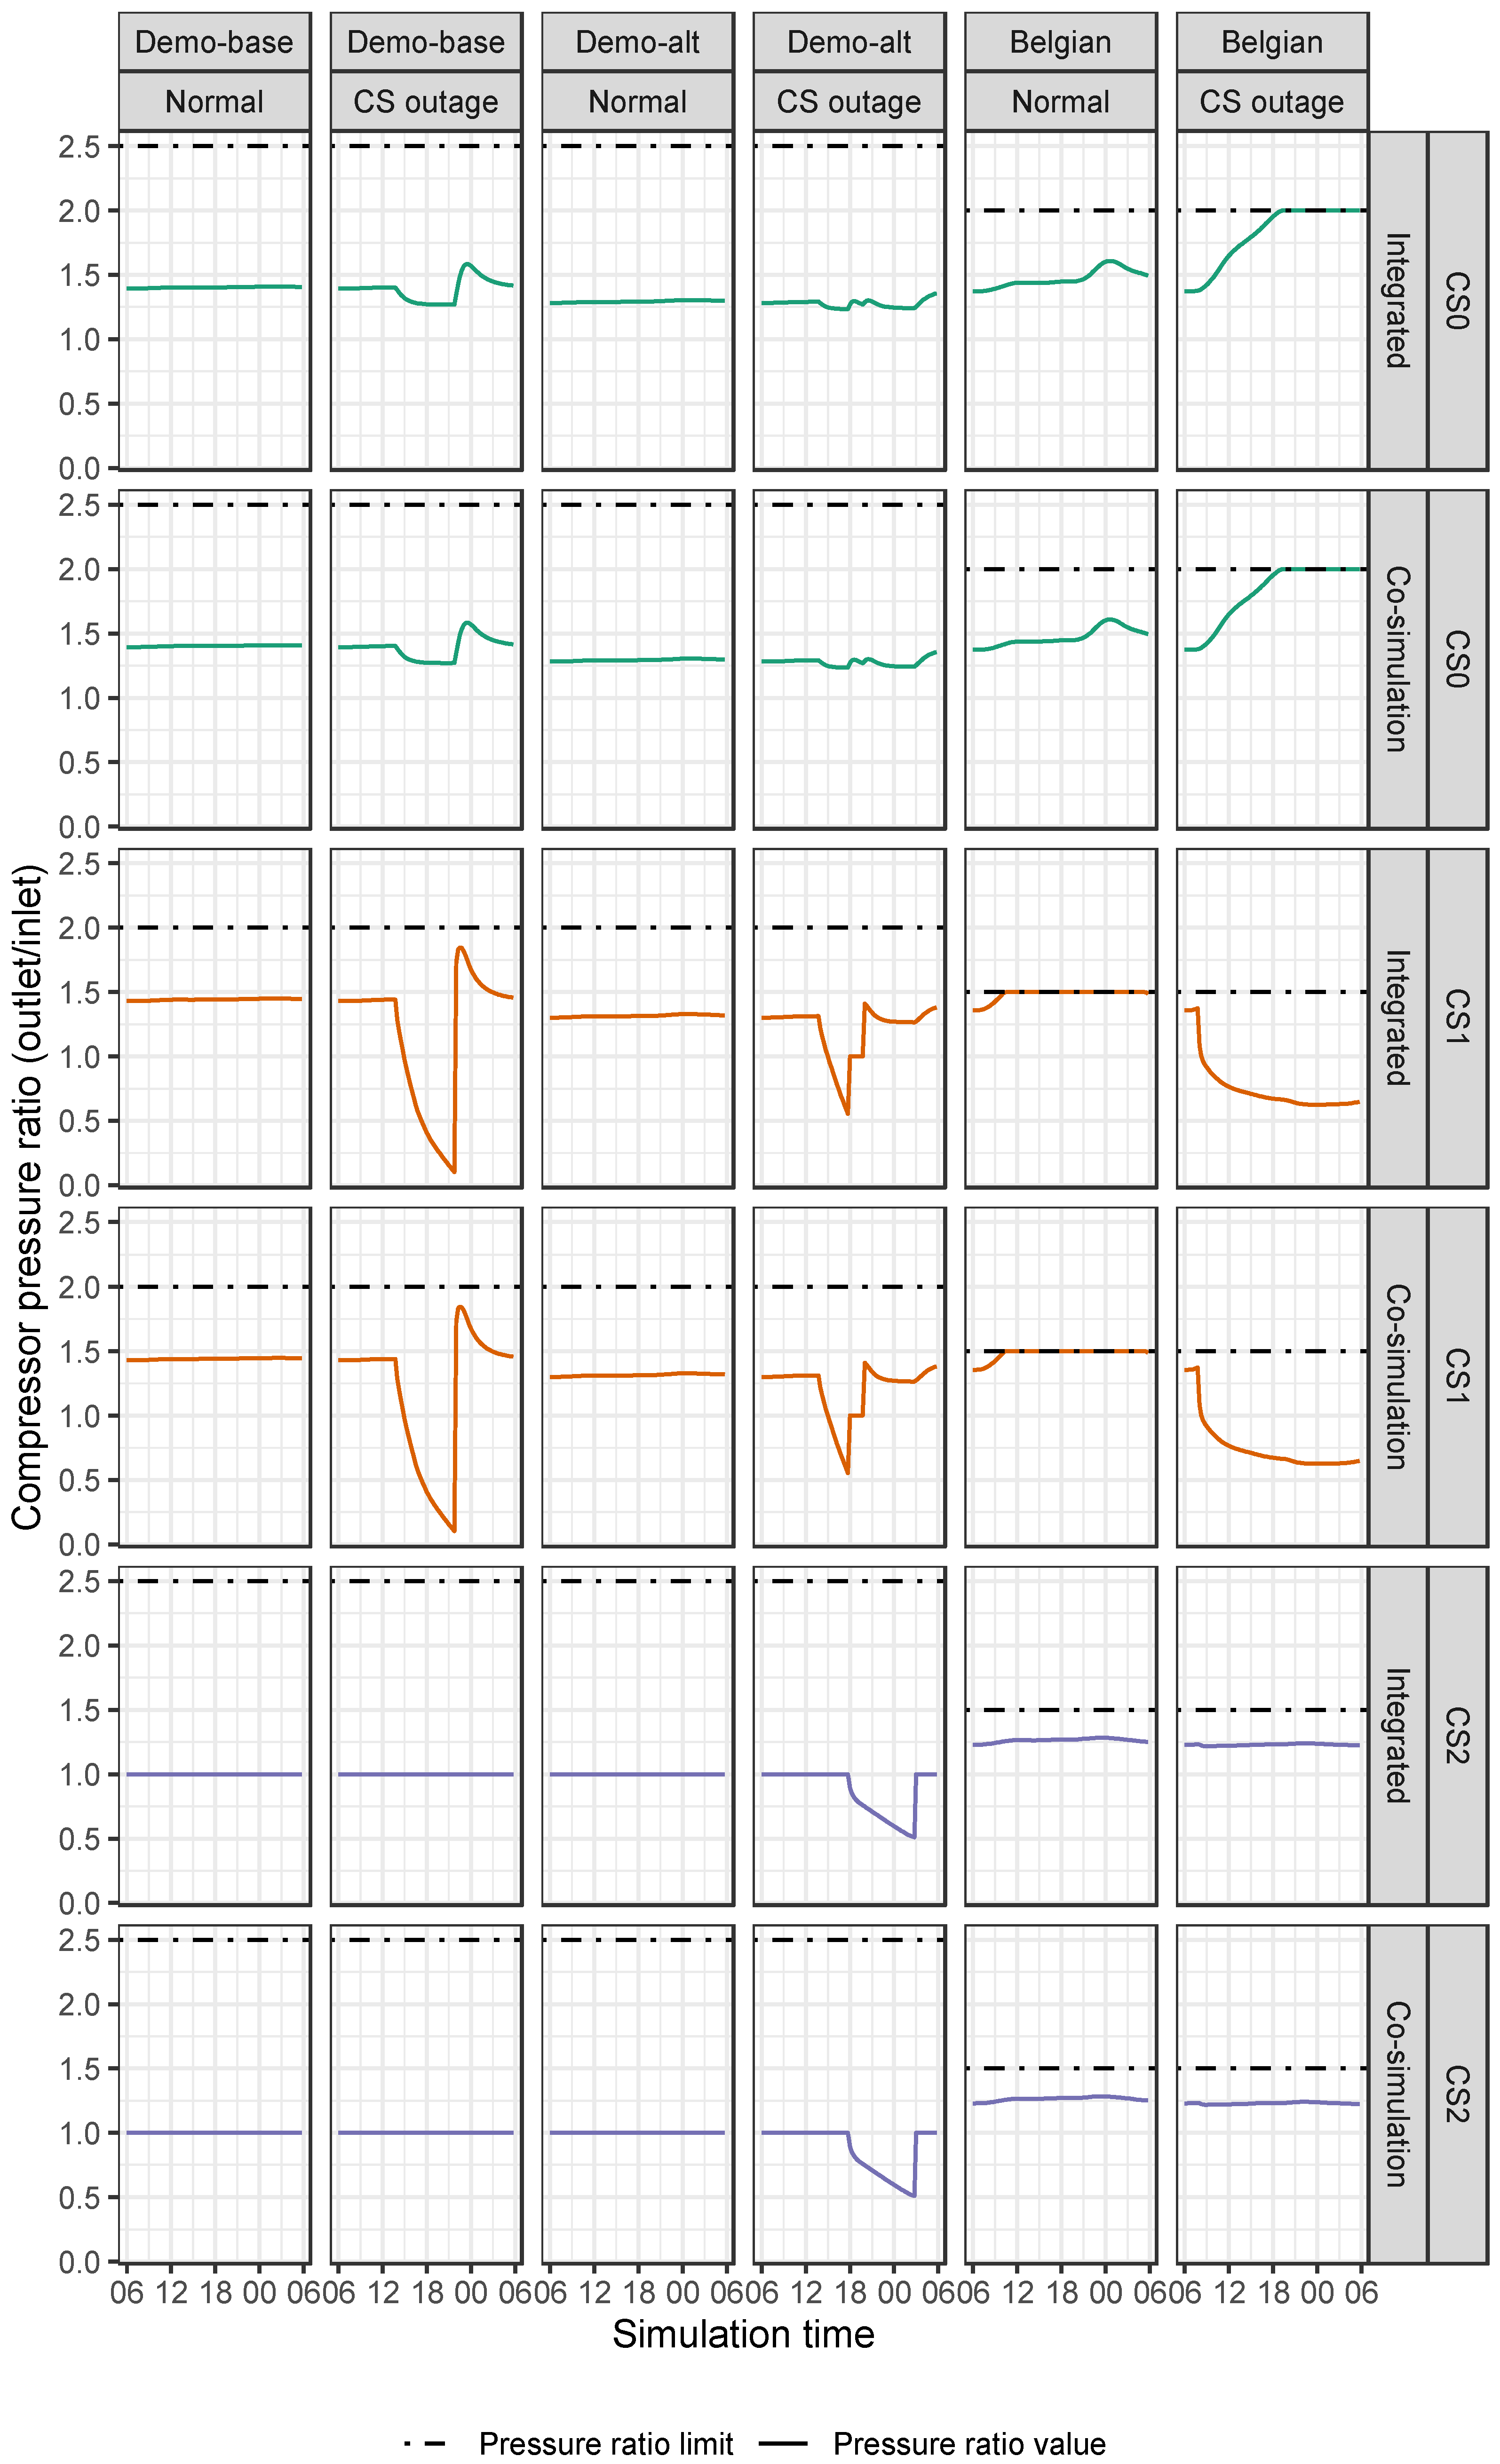
Representing a key component of gas network operations, compressor stations are the primary drivers for moving gas through the system and to the intended delivery points. Figure 7 provides an overview of the pressure ratio—the ratio of outlet pressure to inlet pressure—for each of the three compressor stations in each scenario. Two important insights are apparent from this plot. First, compression ratios from the co-simulation framework again align closely with those of the coupled simulation, indicating similarity in their solutions. The largest single percent error in any timestep is 0.2%, whereas the largest MAPE across each scenario is 0.011%.
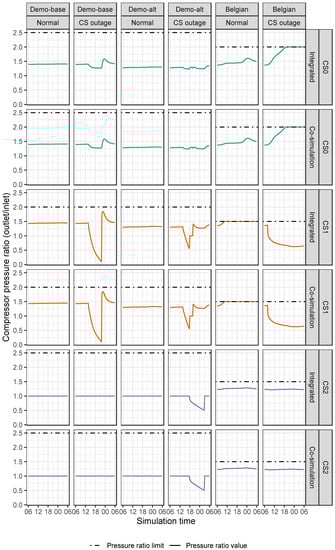
Figure 7.
Comparison of pressure ratios (outlet/inlet) of each compressor station in the integrated and co-simulation approaches (rows) for each network and scenario tested (columns). Black dashed lines indicate the maximum allowable pressure ratio for each compression station. The maximum MAPE across all scenarios is 0.011%.
Second, the plot illustrates how the compressor outage affects the system, with other responses across all compressors in the system to manage the disruption. In all cases, the compression ratio is bounded by the maximum allowable pressure ratio, which is binding for CS0 and CS1 in the Belgian network. Note that compressor outages (CS2 in the demo networks and CS2 in the Belgian network) do not necessarily mean the pressure ratio must be one; rather, they mean the compressor station is unable to provide power to alter the pressure of gas it receives.
3.2. Power System Results
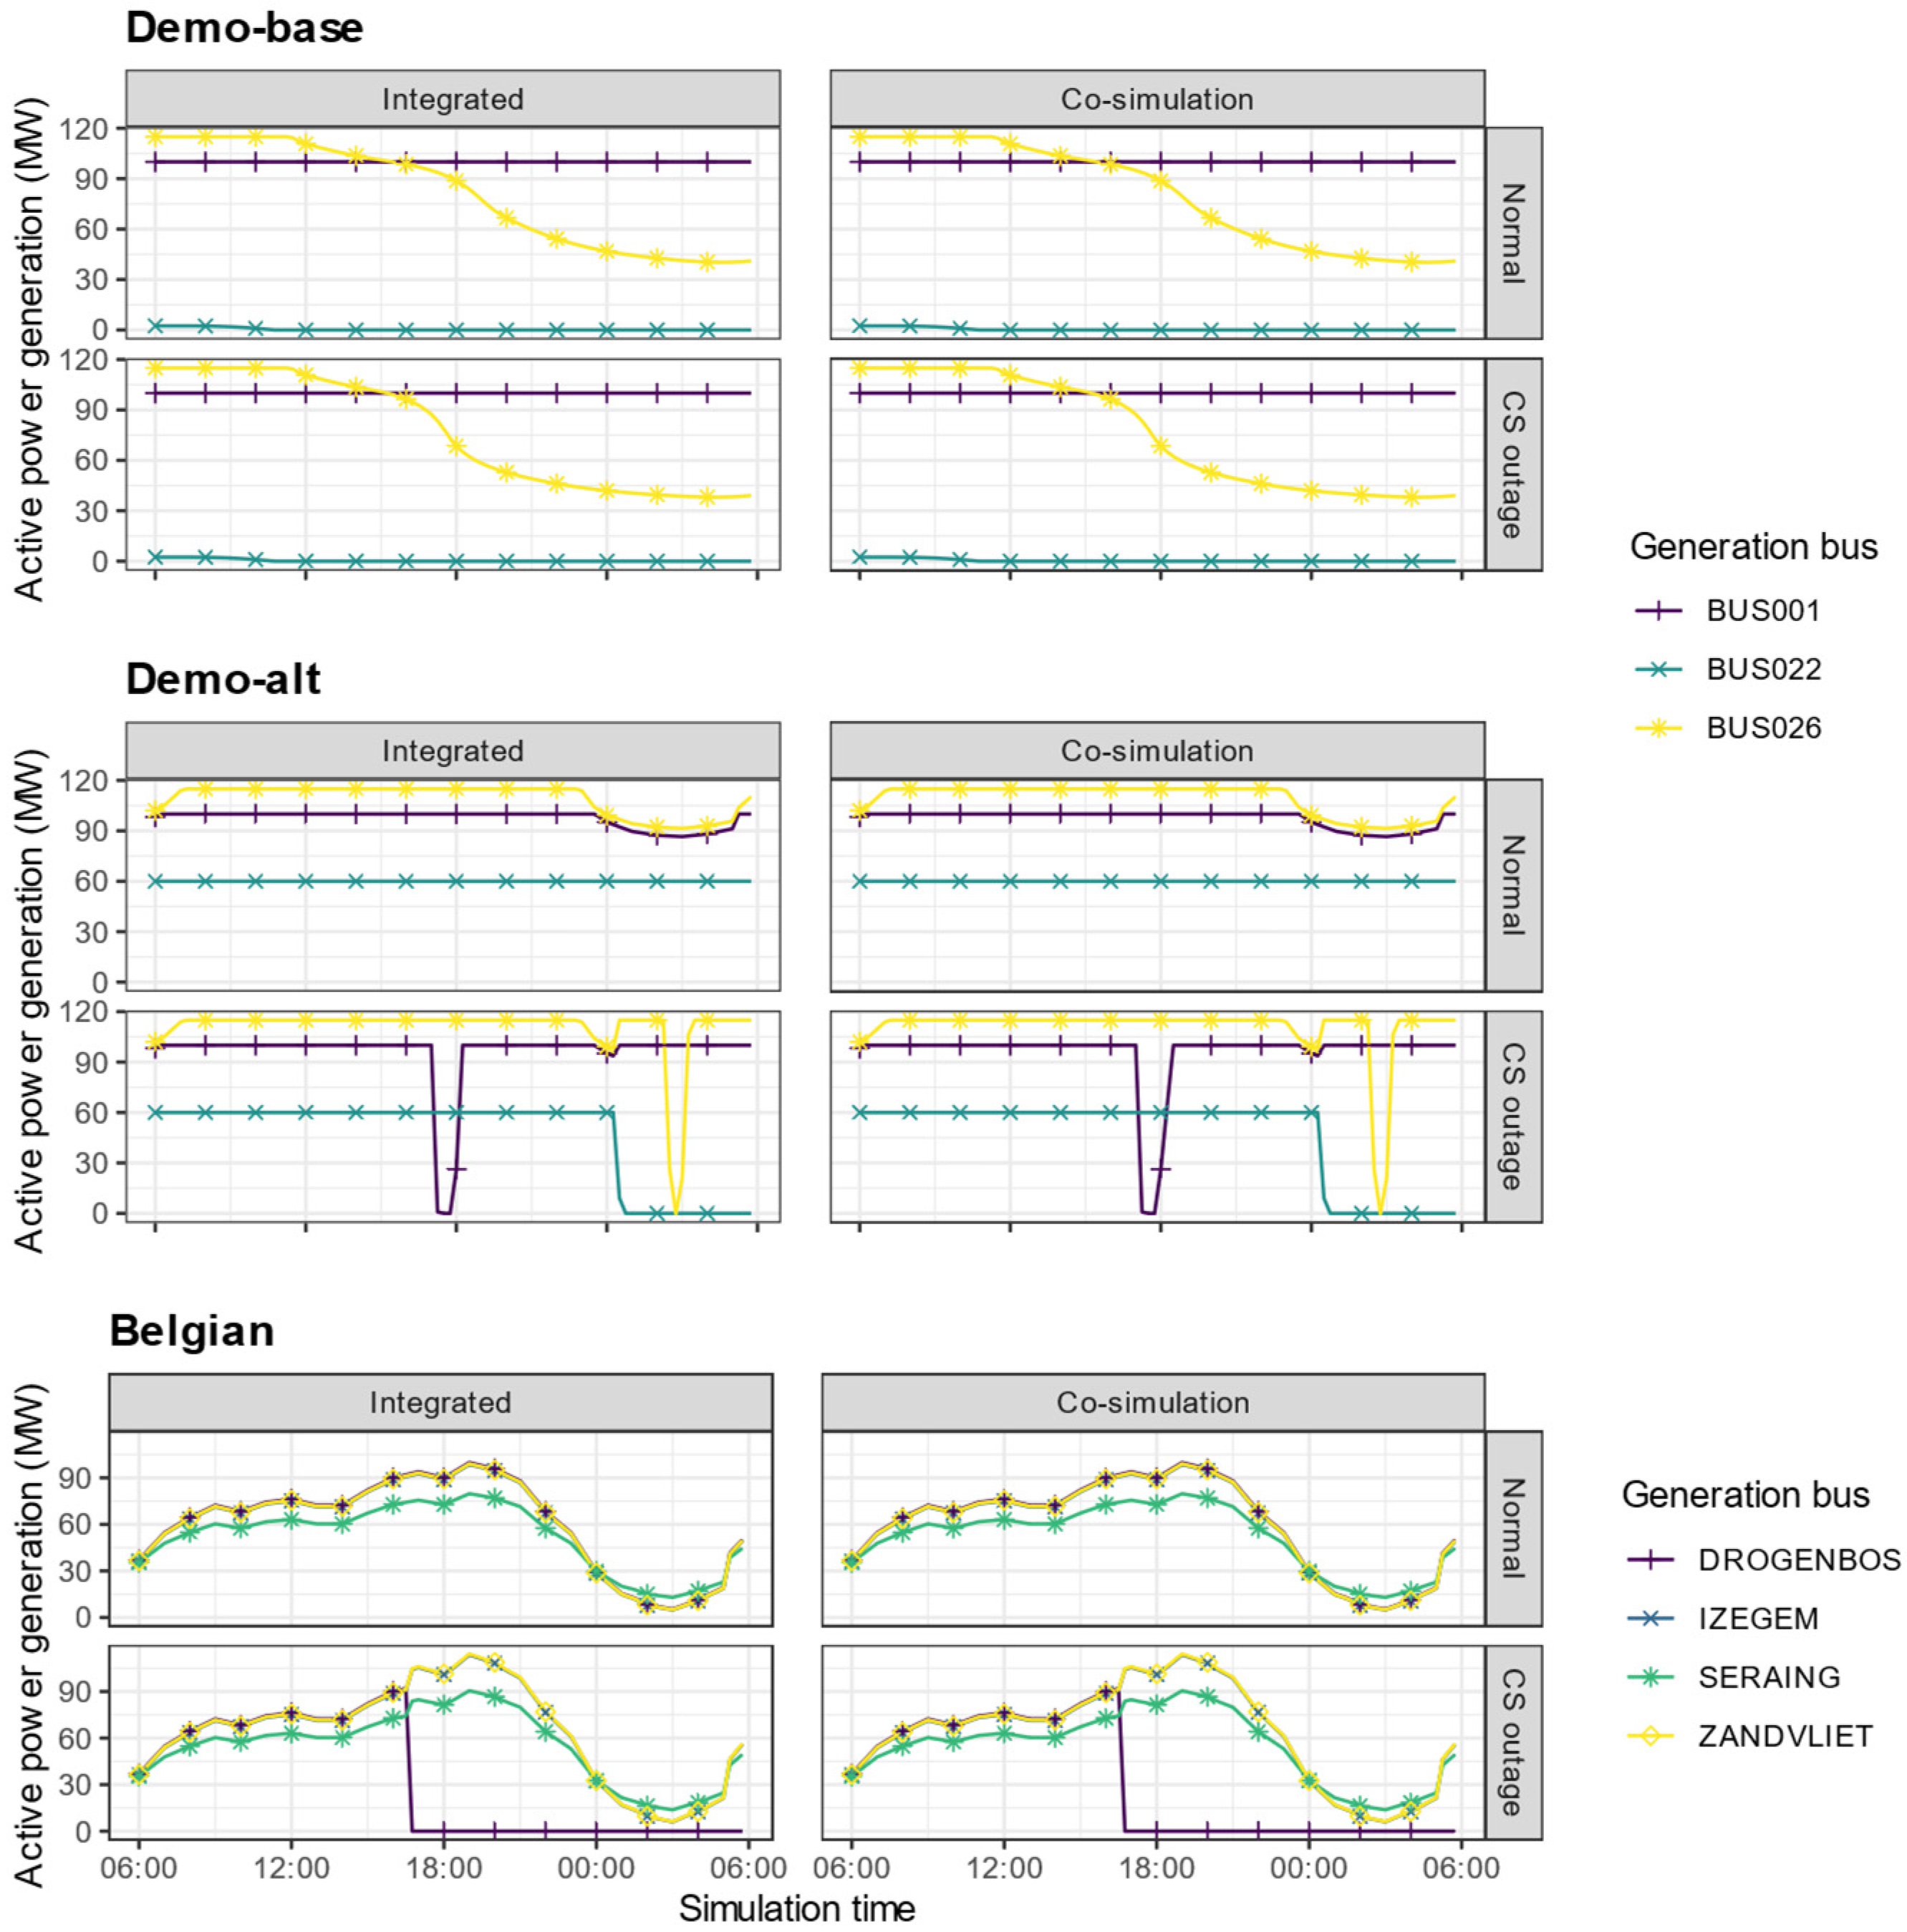
Figure 8 provides the active power generation (in MW) at each 15 min timestep of the simulation. As with the gas network results, we see that the co-simulation approach replicates the dispatch pattern at the coupled nodes in the system; results across non-coupled generators are also matched across the two approaches. Excluding timesteps with active power generation below 0.1 MW—which are removed to eliminate large percentage errors on small absolute values—the results are identical (i.e., MAPE = 0%) for all scenarios except the Demo-alt CS disruption case. In this last scenario, MAPE = 0% for all timesteps except one, when the deviation is 36% of the integrated solution. This occurs when the generator is re-dispatching in response to the outage; in this instance, the co-simulation approach takes an additional step to reduce the power output at the non-coupled generator BUS021, which increased output in both approaches after the outage limited output at BUS001. The two approaches are aligned in the subsequent timestep and beyond, suggesting that tighter convergence criteria on the co-simulation approach would mitigate the difference in this single timestep.
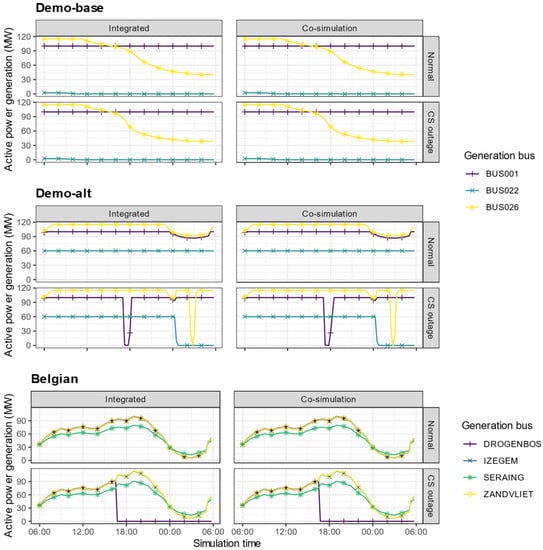
Figure 8.
Active power generation (MW) of all coupled generators in each network by scenario. The MAPE across all scenarios is 0%, except for the Demo-alt CS outage scenario, which is identical in all steps except the time period around 18:15, when the generator is responding to the outage (described further in the text).
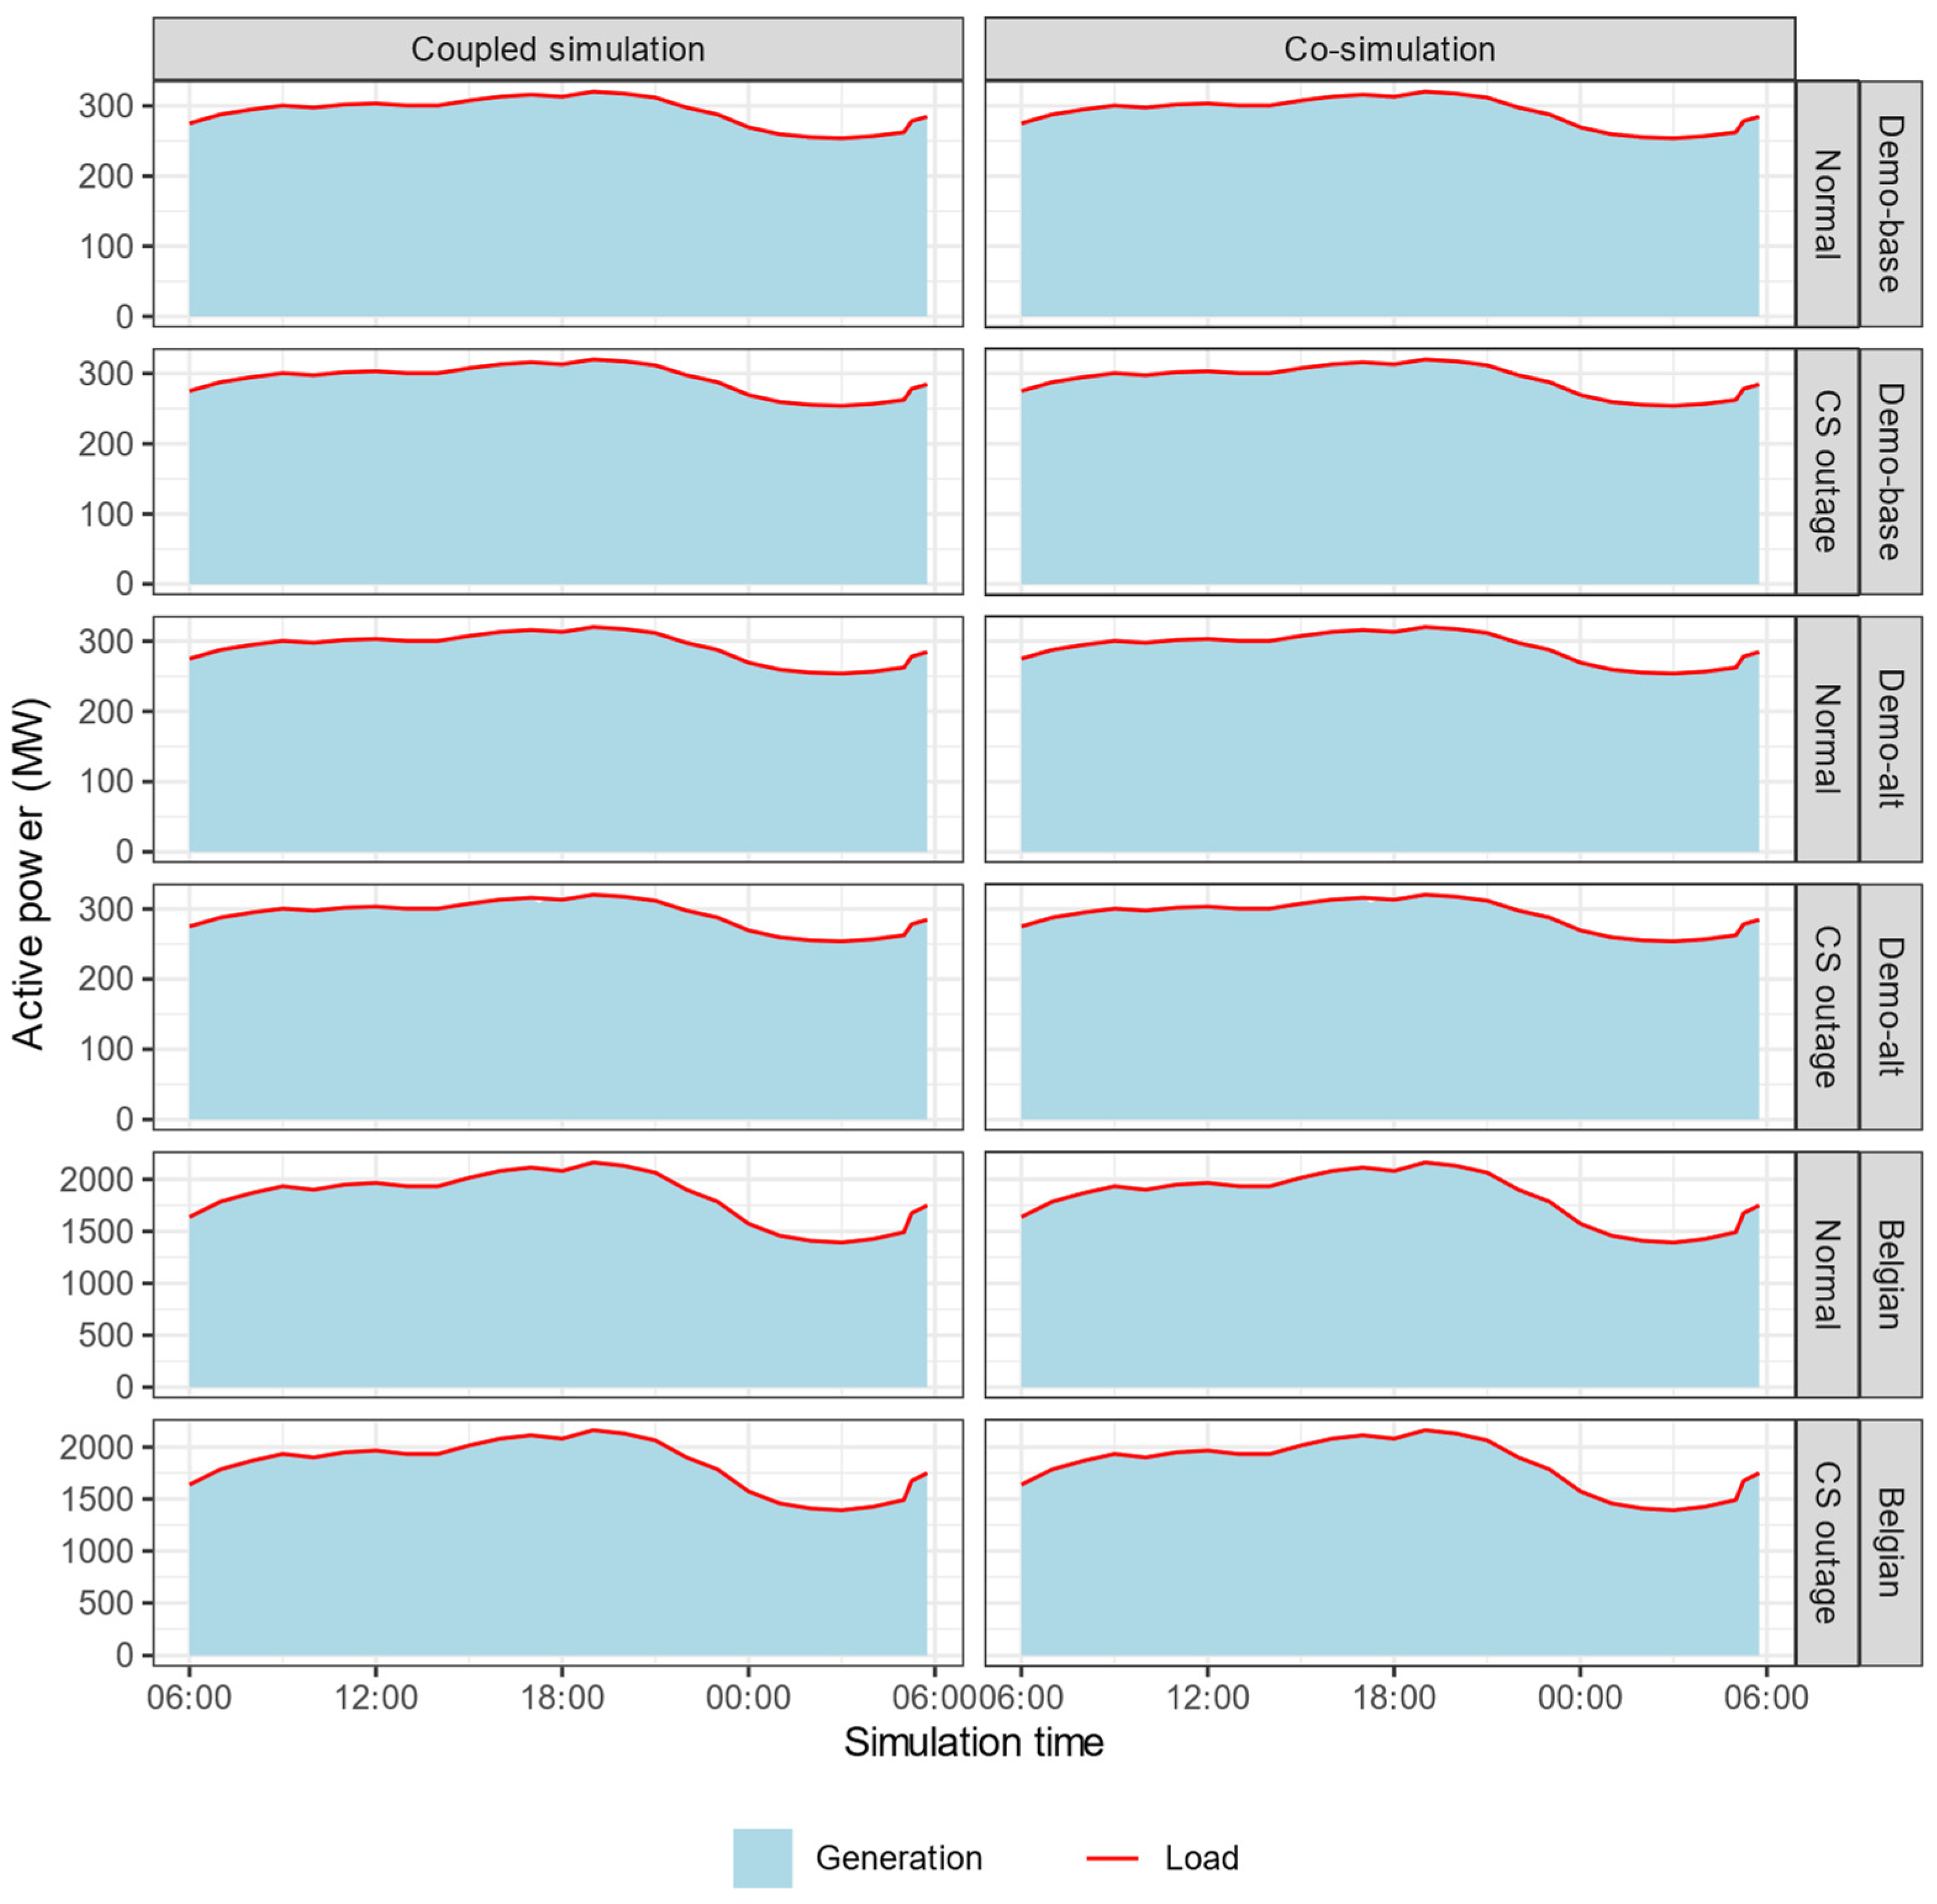
In addition to active power production at each generator, another consideration is the total generation on the system and whether the power supplied can meet demand. Figure 9 summarizes the total load requirement and power generation from both approaches across the scenarios. In all networks and scenarios, total generation is the same between the coupled simulation and co-simulation runs, with no unserved energy. This indicates that the co-simulation approach replicates the SAInt’s ability to solve dispatches for the system, even when perturbations are introduced into the system.
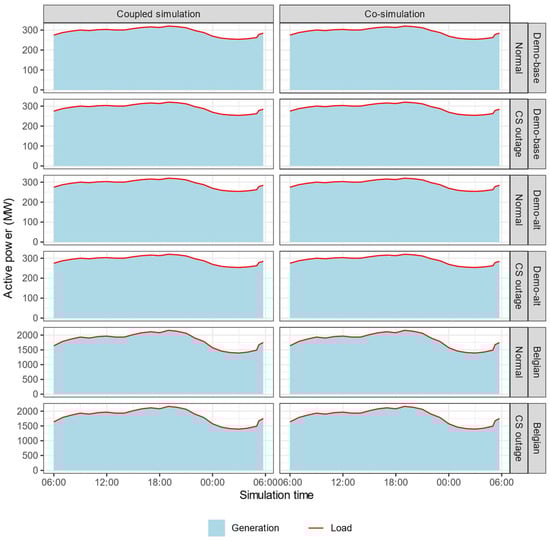
Figure 9.
Total load requirement and power generation (MW) for every 15 min timestep across the various combinations of networks and disruption scenarios. Note the difference in y-axis scales between the demo and Belgian cases. Load and power requirements are identical across the two approaches.
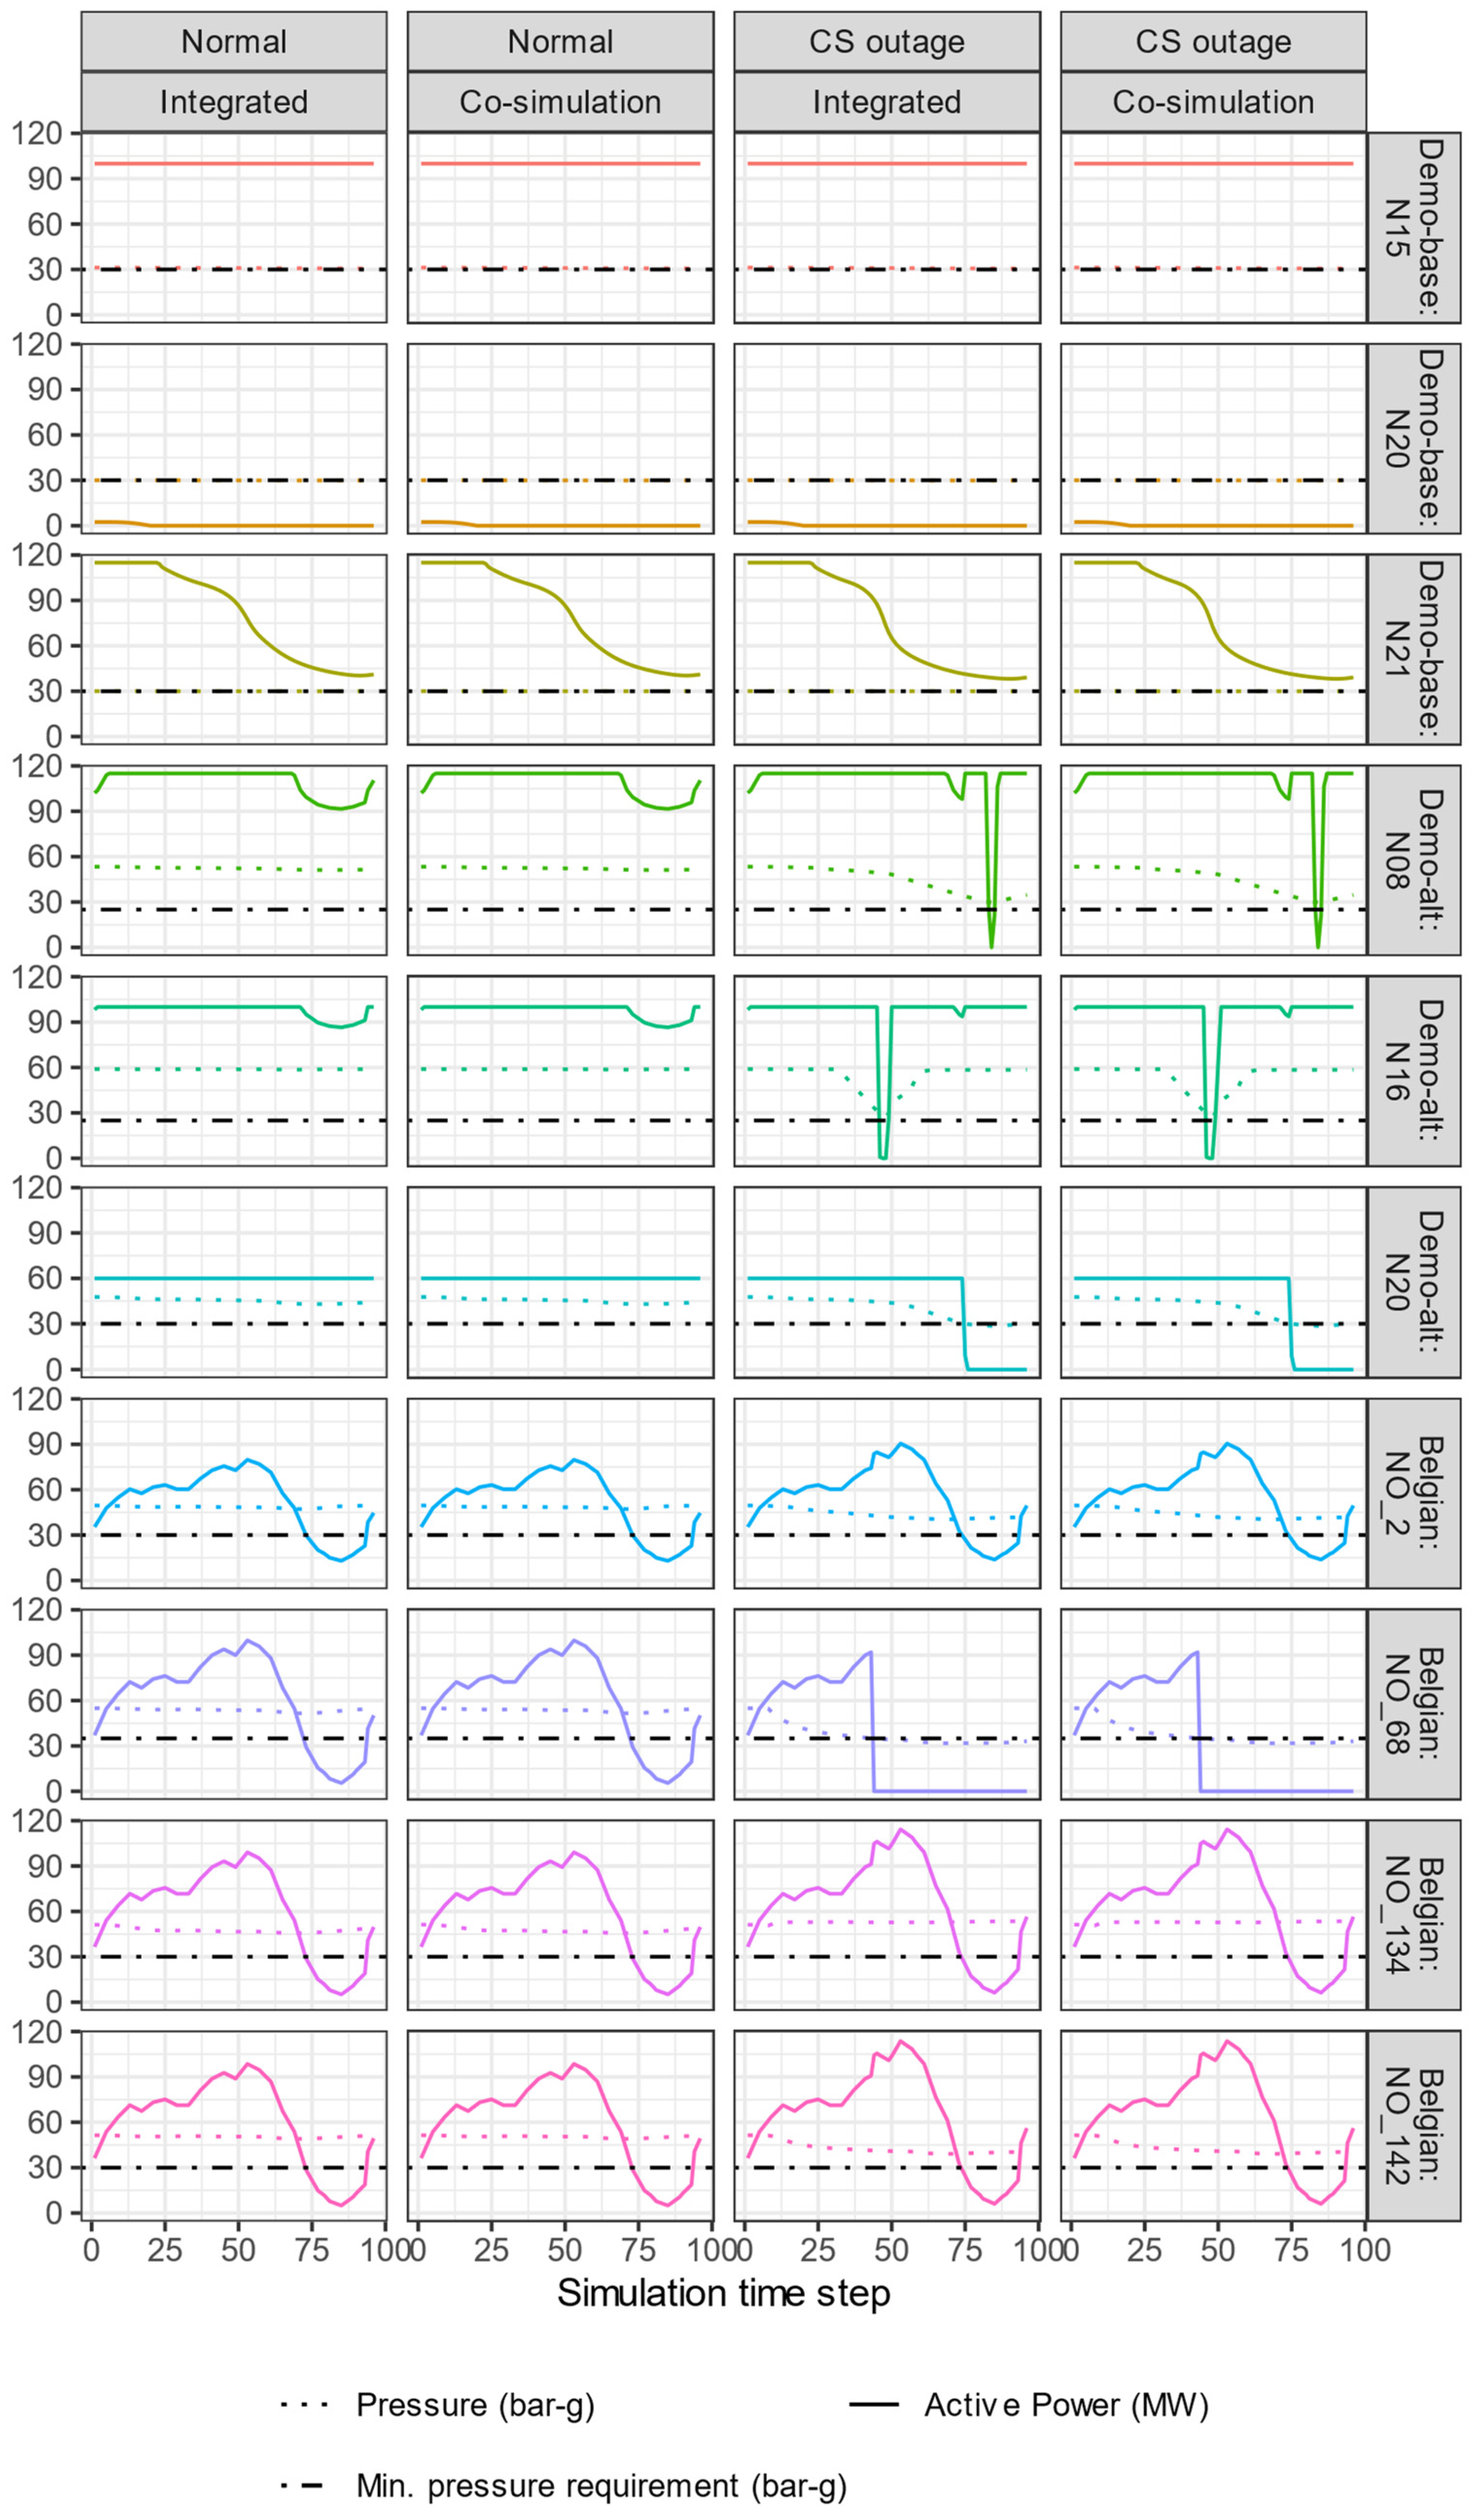
Of particular importance in benchmarking the co-simulation approach is to understand whether behavior at the coupling points—in this work, gas-fired power plants—is similar, and whether key operating behaviors, such as pressure constraint on generation, are performing as expected. Figure 10 provides the active power generation for all gas-fired generators that are coupled to the natural gas network, with the delivery pressure (bar-g) for the corresponding gas node. Gas-fired power plants typically have a minimum delivery pressure ranging from 25 to 30 bar-g; the minimum allowable pressure for each gas node is also presented.
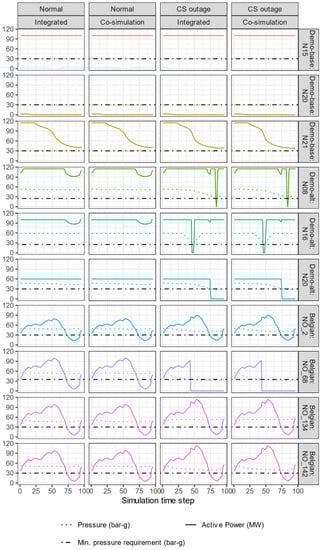
Figure 10.
Depiction of gas offtake pressure (bar-g) and active power generation (MW) for coupled nodes and gas-fired power plants of each network. Black dashed lines in the pressure panels indicate the minimum delivery pressure required at that node for the gas-fired power plant to operate.
The figure illustrates the close alignment between the co-simulation and integrated model. In addition, the delivery pressures respect their minimum requirements across most of the scenarios; for cases where gas pressure falls below the requirement, active power generation from the plant at that node falls to zero as expected. This indicates that the electric power network can adapt and respond to pressure constraints from the gas simulation, as passed on through the co-simulation framework via HELICS.
3.3. Co-Simulation Performance
Table 4 provides the performance results in terms of solve times for each scenario in the integrated and co-simulation approaches. For the scenarios tested, the co-simulation approach takes 3–4 times longer than the integrated approach. These results are expected, given that the co-simulation approach requires re-running each simulator several times in an iterative fashion until convergence is achieved. We note that the networks and scenarios tested in this validation study are relatively small, and that it may be the case that for larger, more complicated systems with more extensive interactions, solving the subproblems iteratively may indeed be more computationally tractable than solving a single integrated problem. Furthermore, solving the gas and grid components as co-simulated subproblems may allow for parallelization across different computing environments.
Table 4.
Summary of model solve time for both the integrated and co-simulation approaches.
Figure 11 presents the number of iterations by timestep for each combination of network and outage scenario tested. Although there are a few instances where the simulator took more than six iterations to converge, for most cases, the co-simulation achieved a result within two to three iterations. Future work should investigate the effect of the network topology and scenario on the number of iterations required, and whether instances arise where convergence is not achieved.
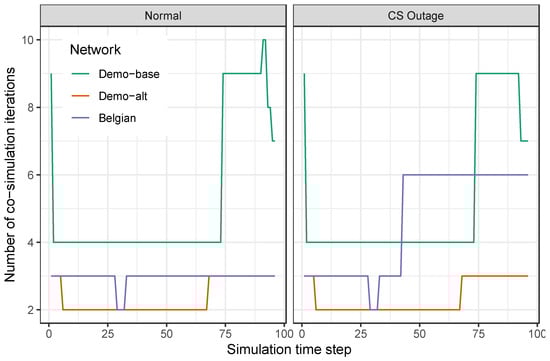
Figure 11.
Number of iterations by timestep for the co-simulation approach; results are shown for each combination of network and scenario tested.
4. Discussion
Integrated modeling of natural gas and electricity networks is crucial for capturing the dynamics between the two systems, which increasingly impact each other. Although directly coupling these sectors into a single, unified model that captures the operations of both systems can bridge the gap between these models, this approach can be time and computationally intensive and is not always feasible when working with existing simulation tools. Co-simulation can provide a useful alternative that captures the interactions between systems without some of the burdens of fully integrated models. Indeed, for some modeling applications, co-simulation with an interchange of messages and values may better represent the actual interactions that occur between these systems.
This paper presents two key advances related to co-simulation of power and gas networks. First, we introduce a new co-simulation framework for coupled gas–grid modeling. Built using the SAInt simulation software for modeling natural gas and bulk power system operations and employing the HELICS co-simulation platform, this framework provides a new tool for researchers who are interested in questions related to the interaction of these systems. As part of this work, we have made the framework itself open-source and provided a use-case to illustrate its functionality.
The second advance is to validate and benchmark results from the co-simulation framework against an integrated model. By exploiting the modularity of the SAInt software, we can evaluate how the co-simulation approach differs while holding other key variables fixed, such as simulation software, network topology, and scenario data. In performing this validation exercise, we provide the research community with additional confidence in the relevance and reasonableness of the co-simulation modeling approach.
Our findings indicate that the co-simulation approach can replicate the integrated model for a range of test networks and scenario profiles explored in this study. In all six cases, key results such as gas flow, pressure, power generation and dispatch, and compressor activity are closely aligned across the two approaches. These cases include not only distinct network configurations, but also instances where there is disruption to normal operations of the system, suggesting that the co-simulation approach is able to model outages or other non-standard events.
Although this work does not provide conclusive proof that co-simulation will always closely approximate coupled simulation, it does provide evidence of cases where the co-simulation approach can provide helpful research insights akin to those gained by an integrated model. It thus lends additional confidence to the co-simulation approach for future research applications, particularly in instances where tight coupling is not feasible or practical.
This work invites several future research efforts. One avenue for further investigation is the comparison of the co-simulation and integrated modeling approaches using other networks and scenarios, which would yield additional insight into the generalizability of these findings. Performing similar validation of the HELCIS co-simulation framework using other grid or gas modeling tools would also help explore potential differences based on the modeling simulator. The co-simulation capability built for SAInt and HELICS demonstrates that future researchers could also build co-simulations that use SAInt’s gas network module with a different power system tool; doing so may help expand the usefulness of existing tools and datasets for studying integrated power and gas systems, as well as allow for integrating unique tools that capture different system dynamics that are of interest for a particular research application.
This study focuses on one type of coupling between gas and power networks: the gas-fired power plant. Although this is one of the most critical coupling points between the two, it is not the only one; others include compressor stations, electrolyzers, underground gas storage, and LNG facilities. Future research should expand the co-simulation tool framework developed here to account for these other coupling points, and thus better capture the interactions between the two systems.
Having developed this co-simulation framework, a logical next step is to apply it to study relevant research questions related to how these systems interact. Of particular interest is studying times of grid or gas network stress, such as during extreme winter weather events, or to explore how gas network operations change with larger levels of renewable energy. A current challenge to this is obtaining the data needed to model both systems, particularly realistic gas pipeline network topology and operational information. Studies using data representative of real systems can likely provide deeper insight into how these systems interact, which can better inform policy and decision making in both sectors.
Author Contributions
Conceptualization and methods, B.S. and K.P.; software development, K.P.; validation and investigation, B.S. and K.P.; writing—original draft preparation, B.S.; writing—review and editing, B.S. and K.P.; visualization, B.S.; project administration, B.S. All authors have read and agreed to the published version of the manuscript.
Funding
Funding provided by the U.S. Department of Energy Office of Electricity and the U.S. Department of Energy Office of Energy Efficiency and Renewable Energy Solar Energy Technologies Office through the Grid Modernization Laboratory Consortium as part of the HELICS+ project.
Institutional Review Board Statement
Not applicable.
Informed Consent Statement
Not applicable.
Data Availability Statement
Code and the test networks used in this study are available at https://github.com/NREL/SAInt_HELICS_interface. Additional description of the use of the SAInt tool with HELICS for coupled modeling of natural gas and electricity networks can be found at https://www.encoord.com/CaseStudyHELICS.html. A demo version of the SAInt software is also available at no cost by contacting encoord at https://www.encoord.com.
Acknowledgments
The authors acknowledge the HELICS+ and encoord teams for their support in developing this work. We also thank Getnet Ayele, Bryan Palmintier, Nadia Panossian, and Jaquelin Cochran for their comments and suggestions on an early draft of this manuscript. This work was authored in part by the National Renewable Energy Laboratory, operated by Alliance for Sustainable Energy, LLC, for the U.S. Department of Energy (DOE) under Contract No. DE-AC36-08GO28308. The views expressed in the article do not necessarily represent the views of the DOE or the U.S. Government. The U.S. Government retains and the publisher, by accepting the article for publication, acknowledges that the U.S. Government retains a nonexclusive, paid-up, irrevocable, worldwide license to publish or reproduce the published form of this work, or allow others to do so, for U.S. Government purposes.
Conflicts of Interest
The authors declare no conflict of interest.
References
- U.S. Energy Information Administration (EIA). Annual Energy Outlook 2021: Table 8. Electricity Supply, Disposition, Prices, and Emissions. 2021. Available online: https://www.eia.gov/outlooks/aeo/ (accessed on 2 December 2021).
- International Energy Agency (IEA). IEA Data Browser: Electricity Generation by Source. 2021. Available online: https://www.iea.org/regions/europe (accessed on 2 December 2021).
- U.S. Energy Information Administration (EIA). Natural Gas Consumption by End Use. 2021. Available online: https://www.eia.gov/dnav/ng/ng_cons_sum_dcu_nus_a.htm (accessed on 30 May 2022).
- Chen, S.; Conejo, A.J.; Wei, Z. Gas-Power Coordination: From Day-Ahead Scheduling to Actual Operation. IEEE Trans. Power Syst. 2021, 8950, 1532–1542. [Google Scholar] [CrossRef]
- Zlotnik, A.; Roald, L.; Backhaus, S.; Chertkov, M.; Andersson, G. Coordinated Scheduling for Interdependent Electric Power and Natural Gas Infrastructures. IEEE Trans. Power Syst. 2017, 32, 600–610. [Google Scholar] [CrossRef]
- Zlotnik, A.V.; Rudkevich, A.M.; Carter, R.; Ruiz, P.A. Grid Architecture at the Gas-Electric Interface. 2017. Available online: https://gmlc.doe.gov/sites/default/files/resources/Gas-grid_architecture_published.pdf (accessed on 2 December 2021).
- North American Electric Reliability Corporation (NERC). Polar Vortex Review; North American Electric Reliability Corporation (NERC): Atlanta, GA, USA, 2014. [Google Scholar]
- Kemabonta, T. Grid Resilience analysis and planning of electric power systems: The case of the 2021 Texas electricity crises caused by winter storm Uri (#TexasFreeze). Electr. J. 2021, 34, 107044. [Google Scholar] [CrossRef]
- Li, T.; Eremia, M.; Shahidehpour, M. Interdependency of natural gas network and power system security. IEEE Trans. Power Syst. 2008, 23, 1817–1824. [Google Scholar] [CrossRef]
- Chiang, N.Y.; Zavala, V.M. Large-scale optimal control of interconnected natural gas and electrical transmission systems. Appl. Energy 2016, 168, 226–235. [Google Scholar] [CrossRef] [Green Version]
- Chaudry, M.; Jenkins, N.; Strbac, G. Multi-time period combined gas and electricity network optimisation. Electr. Power Syst. Res. 2008, 78, 1265–1279. [Google Scholar] [CrossRef]
- Chaudry, M.; Jenkins, N.; Qadrdan, M.; Wu, J. Combined gas and electricity network expansion planning. Appl. Energy 2014, 113, 1171–1187. [Google Scholar] [CrossRef]
- Craig, M.; Guerra, O.J.; Brancucci, C.; Pambour, K.A.; Hodge, B.M. Valuing intra-day coordination of electric power and natural gas system operations. Energy Policy 2020, 141, 111470. [Google Scholar] [CrossRef]
- Guerra, O.J.; Sergi, B.; Craig, M.; Pambour, K.A.; Brancucci, C.; Hodge, B.M. Coordinated operation of electricity and natural gas systems from day-ahead to real-time markets. J. Clean. Prod. 2021, 281, 124759. [Google Scholar] [CrossRef]
- Ziarmal, H.; Farag, H.E.; El-Taweel, N.A.; Abdelaziz, M. A Co-simulation Platform for Power and Gas Distribution Networks. In Proceedings of the 2017 IEEE 6th International Conference on Renewable Energy Research and Applications (ICRERA), San Diego, CA, USA, 5–8 November 2017; Volume 5, pp. 5–9. [Google Scholar]
- Pambour, K.A.; Sopgwi, R.T.; Hodge, B.M.; Brancucci, C. The value of day-ahead coordination of power and natural gas network operations. Energies 2018, 11, 1628. [Google Scholar] [CrossRef] [Green Version]
- Pambour, K.A.; Erdener, B.C.; Bolado-Lavin, R.; Dijkema, G.P.J. SAInt—A novel quasi-dynamic model for assessing security of supply in coupled gas and electricity transmission networks. Appl. Energy 2017, 203, 829–857. [Google Scholar] [CrossRef]
- Palmintier, B.; Krishnamurthy, D.; Top, P.; Smith, S.; Daily, J.; Fuller, J. Design of the HELICS High-Performance Transmission-Distribution-Communication-Market Co-Simulation Framework. In Proceedings of the Workshop on Modeling and Simulation of Cyber-Physical Energy Systems (MSCPES), Pittsburgh, PA, USA, 21 April 2017; pp. 2–7. [Google Scholar]
- Grid Modernization Lab Consortium. Hierarchical Engine for Large-scale Infrastructure Co-Simulation (HELICS). 2022. Available online: https://helics.org (accessed on 30 May 2022).
- de Wolf, D.; Smeers, Y. The gas transmission problem solved by an extension of the simplex algorithm. Manage. Sci. 2000, 46, 1454–1465. [Google Scholar] [CrossRef] [Green Version]
- Fluxys Belgium. Our Infrastructure: Transmission Network. Available online: https://www.fluxys.com/en/company/fluxys-belgium/infrastructure (accessed on 7 September 2021).
- Elia Group. “Our Infrastructure”. Available online: https://www.elia.be/en/infrastructure-and-projects/our-infrastructure (accessed on 7 September 2021).


Publisher’s Note: MDPI stays neutral with regard to jurisdictional claims in published maps and institutional affiliations. |
© 2022 by the authors. Licensee MDPI, Basel, Switzerland. This article is an open access article distributed under the terms and conditions of the Creative Commons Attribution (CC BY) license (https://creativecommons.org/licenses/by/4.0/).