Abstract
This study aimed to evaluate the bone volume change at donor sites in patients who received mandibular body bone block grafts using intensity-based automatic image registration. A retrospective study was conducted with 32 patients who received mandibular bone block grafts between 2017 and 2019 at the Pusan National University Dental Hospital. Cone-beam computed tomography (CBCT) images were obtained before surgery (T0), 1 day after surgery (T1), and 4 months after surgery (T2). Scattered artefacts were removed by manual segmentation. The T0 image was used as the reference image for registration of T1 and T2 images using intensity-based registration. A total of 32 donor sites were analyzed three-dimensionally. The volume and pixel value of the bones were measured and analyzed. The mean regenerated bone volume rate on follow-up images (T2) was 34.87% ± 17.11%. However, no statistically significant differences of regenerated bone volume were noted among the four areas of the donor site (upper anterior, upper posterior, lower anterior, and lower posterior). The mean pixel value rate of the follow-up images (T2) was 78.99% ± 16.9% compared with that of T1, which was statistically significant (p < 0.05). Intensity-based registration with histogram matching showed that newly generated bone is generally qualitatively and quantitatively poorer than the original bone, thus revealing the feasibility of pixel value to evaluate bone quality in CBCT images. Considering the bone mass recovered in this study, 4 months may not be sufficient for a second harvesting, and a longer period of follow-up is required.
1. Introduction
Sufficient bone volume is necessary for the successful placement of dental implants. However, bone volume is often lacking owing to dental trauma, tooth loss, or periodontal diseases. Several different techniques have been used to reconstruct alveolar defects in the atrophic maxilla and mandible [1,2]. Among these, autogenous bone grafts remain the gold standard on account of their osteoconductive, osteoinductive, and osteogenic properties [3,4]. The standard donor sites for free autogenous bone graft techniques are the chin or mandibular ramus, iliac crest, tibia, and calvaria. The advantages of intraoral mandibular harvest sites include easy access, low morbidity, short healing periods, minimal graft resorption, and maintenance of high bone density. Side-effects include possible postoperative sensory disturbances and discomfort [4,5]. There are several published studies on bone volume changes in recipient sites following mandibular bone block grafts; however, studies on changes in donor sites are scarce [6]. Some studies have described a second harvest from the mandibular ramus and symphysis [7,8]; nevertheless, the exact amount of bone regeneration that is possible and certain aspects of healing are not yet fully understood. Thus, there is a limitation with the current method of assessing bone volume. In the absence of a standardized method, studies have adopted a variety of methods for the assessment of bone changes. Dental panoramic radiographs are occasionally used to estimate the vertical dimension of the jawbones [9], while some studies have used MDCT (multidetector computed tomography) [10]. Mohlhenrich et al. [11] used a special software to reconstruct a three-dimensional (3D) model using cone-beam computed tomography (CBCT) and the estimated dimensions, whereas Diez et al. [6] and Arasawa et al. [12] used a 3D superposition technique.
Currently, CBCT is routinely performed in patients who require bone grafts in dentistry; therefore, it can be used for 3D analysis without exposing patients to extra radiation. Furthermore, 3D imaging can be performed without direct contact with the patient and can, therefore, be used to decrease the spread of COVID 19 infection [13]. However, CBCT images are typically acquired using a small number of X-ray projections and/or low beam intensities. This often leads to images with low contrast, low signal-to-noise ratio, and artefacts, thereby hampering the image registration process [14].
Thus far, the 3D evaluation of CBCT images requires cropping and performing calculations for multiple slices, which involves extensive manual work. To overcome these limitations, recent studies have integrated new techniques in CBCT image processing, one of which consists of analyzing the bone volume using intensity-based registration [15]. In addition, the authors attempted to assess bone quality by pixel value, which is controversial owing to the cone-beam geometry of CBCT [16]. The quantitative use of pixel values in CBCT is generally avoided because of the variability in pixel values. However, some studies have used histogram matching to perform quality analysis using pixel values [17,18]. The accuracy of these techniques has not been proven. Nevertheless, it is still worth attempting them to overcome the limitations of CBCT image processing by integrating new steps.
This study aimed to perform a 3D analysis of bone volume changes using intensity-based automatic registration and histogram matching. Furthermore, the gray value was assessed to evaluate the change in bone quality of donor sites in the mandible.
2. Materials and Methods
2.1. Sampling
Serial images of 32 patients who underwent CBCT three times for mandibular bone block grafts between 2017 and 2019 were retrospectively collected, which were available from our dental hospital. All surgeries were performed by two clinicians following the same surgical protocol. Of the 60 cases, 32 had clear CBCT images from all the three scans and were, thus, selected for further analysis. The CBCT images were obtained before surgery (T0), 1 day after surgery (T1), and 4 months after surgery (T2). The mean time between T1 and T2 was 4.6 ± 1.65 months. The CBCT images obtained 1 day after the surgery (T1) were used to evaluate the amount of harvested bone and determine whether the intraoperative fixation was adequate. All the patients were treated with intraoral mandibular body bone grafts because of severe alveolar bone loss in the expected implant placement site. Patients with serious health problems, such as uncontrolled diabetes mellitus or hypertension, and heavy smokers were excluded from the study. After performing a crestal incision and elevation of the mucoperiosteal flap, the mandibular body was exposed. Osteotomies were performed from the buccal aspect of the first and second mandibular molars, and blocks of the bone were harvested (Figure 1A–C). After placement of the mandibular bone blocks onto the defects, they were fixed using mini-screws. Hemostasis was performed for the donor sites without grafting, followed by primary wound closure (Figure 1D). CBCT images were obtained using PaX-i3D (Vatech Co., Hwaseong-si, South Korea) at 105–114 kVp and 5.6–6.5 mA with a 160 × 160 mm field of view and a 0.2 mm voxel size. The CBCT images were saved in DICOM file format using DICOM 3.0 software on a computer with Windows 10 operating system (Intel Core i7-4770, 32 Gigabyte). Figure 2 shows the flowchart of the subsequent image processing and analysis procedure.
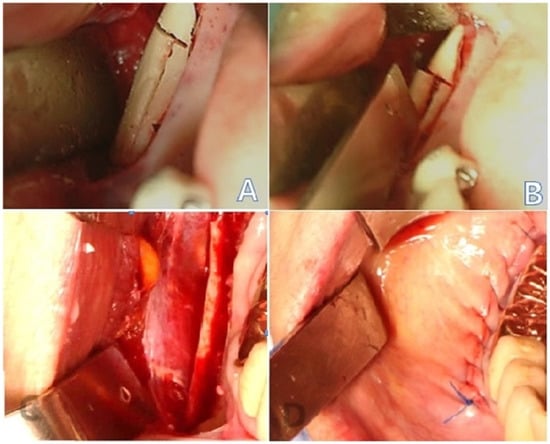
Figure 1.
Perioperative images: (A) osteotomy with a reciprocating saw and bur; (B) osteotomy performed to obtain a mandibular body block bone graft; (C) mandibular body block bone harvested; (D) primary closure achieved.
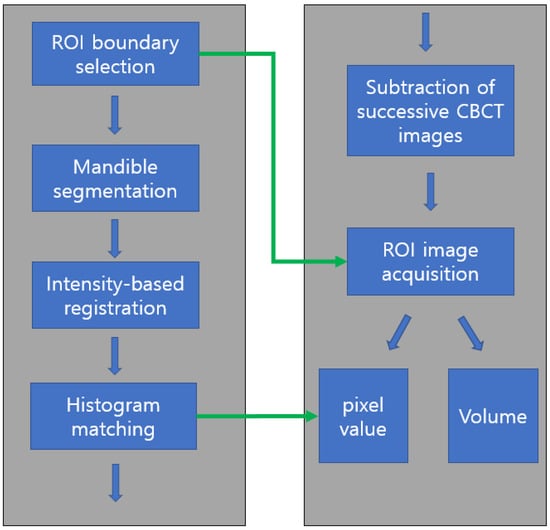
Figure 2.
Flowchart of image processing and analysis. After ROI boundary (graft harvesting area) determination and mandible segmentation, three successive CBCT images were superimposed using intensity-based registration followed by histogram matching for pixel value comparison. ROI images were obtained by subtraction of registered CBCT images from ROI boundary information. The volume and pixel value of ROI were calculated. ROI: region of interest; CBCT: cone-beam computed tomography.
2.2. Boundary Selection of Region of Interest and Mandible Segmentation
The three-dimensional boundary of the ROI (graft harvesting area) was determined by carefully comparing three CBCT images (T0, T1, and T2) simultaneously using a 3D Slicer (Brigham and Women’s Hospital, Harvard Medical School, Boston, MA, USA, Figure 3). The coordinates of the smallest cuboid containing the graft material were saved in the T0 image.
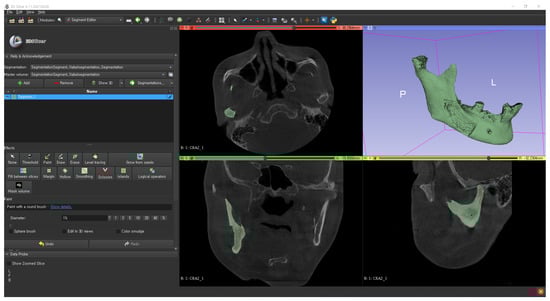
Figure 3.
Binarization threshold determination of the bone using the 3D Slicer.
An examiner binarized the mandible by carefully determining the threshold and manually segmented the mandible using a 3D slicer. Metal artefacts due to implants or dental crowns were removed by the same examiner using the erase or scissor function of 3D slicer for more reliable and reproducible image processing results.
2.3. Intensity-Based Registsration Using Segmented Mandible
We developed a homemade software using MATLAB 2022a (MathWorks, Natick, Massachusetts) for image processing and registration. Intensity-based registration using histogram-matched images replaced the inaccurate manual registration using several reference points (Figure 3) [19,20]. Therefore, 3D CBCT images were superimposed using intensity-based registration, which shows high accuracy [19,21] (Figure 4).
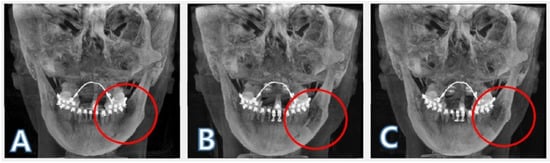
Figure 4.
Registered images. The bone images were registered using an intensity-based registration algorithm with T0 image as a reference. The red circle indicates the area from where the bone block was harvested: (A) before surgery (T0); (B) 1 day after surgery (T1); (C) 4 months after surgery (T2).
2.4. Histogram Matching for Pixel Value Comparison
The histograms of the two serial CBCT images were matched to the histogram of the T1 image for gray value analysis (Figure 5, Figure 6 and Figure 7). Histogram matching refers to the transformation of an image such that its histogram matches a specified histogram [22]. The probability of each pixel value was computed from the histogram. Each probability of the density function was mapped to its cumulative distribution function. The matching algorithm steps were repeated alternately until the best match was achieved. In this study, the histogram of T1 and T2 images was transformed to match the histogram of the T0 image, which was the reference. This method makes it possible to compare pixel values in the bone regions of successful CBCTs by matching the distribution of pixel values between CBCTs [17].
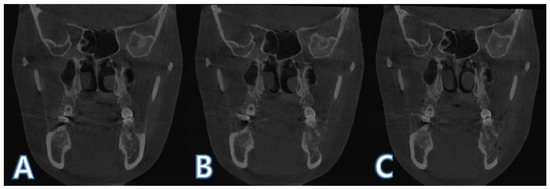
Figure 5.
Registered images before histogram matching: (A) before surgery (T0); (B) 1 day after surgery (T1); (C) 4 months after surgery (T2).
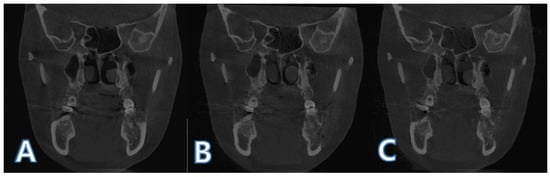
Figure 6.
Registered images after histogram matching: (A) before surgery (T0); (B) 1 day after surgery (T1); (C) 4 months after surgery (T2).
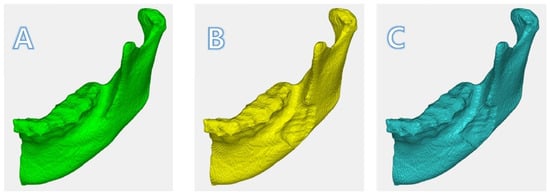
Figure 7.
Registered images in 3D: (A)T0; (B)T1; (C) T2. The depth of the surgical defect in T1 was diminished in T2.
2.5. ROI Image Acquisition and Boundary Separation
The difference of the binarized images (T2 − T1) were obtained. After registration (Figure 7), by extracting two successive images, other parts of the mandible were removed, leaving the main part only (Figure 8A). By leaving only the ROI area in the mandible (Figure 8B), minor fragments (but not the main part) were removed (Figure 8C). The main part was divided into four by bisecting each side to figure out the healing pattern. The donor site was divided into four parts (upper anterior, upper posterior, lower anterior, and lower posterior; Figure 8D) by bisecting each boundary, to identify the aspects of bone regeneration. Bisecting was performed at half the height of the top and bottom and the length of the front and back. The criterion for defining the upper, lower, anterior, and posterior sections was the natural head position at T0.
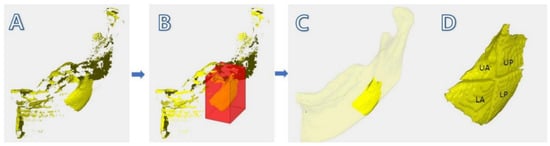
Figure 8.
Method of obtaining the image of the regenerated bone: (A) subtracted image of T2 − T1, where minor fragments are visible; (B) selecting the “region of interest”; (C) modified image, where minor fragments except the main part are removed by the examiner; (D) main part divided into four parts (UA: upper anterior, UP: upper posterior, LA: lower anterior, and LP: lower posterior).
2.6. ROI Volume and Mean Pixel Value Calculation
The 3D volume of the regenerated bone was calculated. The mean pixel level inside the defect was also calculated.
2.7. Statistical Analysis
Two-way analysis of variance (ANOVA) was used to compare the bone regeneration in the four parts of the defect. A paired t-test was used to compare the bone volume and pixel value changes (T1 and T2).
3. Results
Mandibular body block bone grafting was performed in 32 patients (18 men and 14 women) with a mean age of 53.72 ± 11.2 (range: 34–70) years. The mean time (time between T1 and T2) was 4.6 ± 1.65 months (Table 1). No complications, such as infection or inferior alveolar nerve damage, were noted during the healing process.

Table 1.
Patient demographic factors.
3.1. Bone Volume Change
The mean volume of defect at the donor site was 703.184 mm3, and the mean bone volume generated was 459.87 mm3. The bone volume of the donor site at T2 was significantly larger than that at T1. The mean regenerated bone volume rate of the follow-up images (T2) was 34.87% ± 17.11% (Table 2), ranging from 13% to 99%. The donor site was divided into four parts (upper anterior, upper posterior, lower anterior, and lower posterior) by two simple lines that bisect each boundary to determine whether bone regeneration differs according to the location. However, no statistically significant differences were observed among the four areas of the donor site.
Table 2.
Bone volume and pixel value changes.
3.2. Pixel Value Change
The mean regenerated pixel value rate of the follow-up images (T2) was 78.99% ± 16.9% (Table 2). Overall, the pixel value of T2 was significantly lower than that of T0 (Table 3). However, no statistically significant differences were observed among the four areas of the donor site.
Table 3.
Pixel value change.
4. Discussion
Since bone grafts are used to augment the atrophic maxilla and mandible, volumetric changes on the grafted sites are frequently of interest. Nevertheless, there are few studies on bone volume changes at donor sites [6]. Bone deposition after harvesting has been reported in several studies [7,23,24]. Pikos et al. [24] reported that complete bone deposition could be detected after 9 months. Likewise, Felice et al. [7] demonstrated the presence of a newly formed bone at the donor site after 8 months. However, these evaluations were performed using panoramic radiographs, which were inaccurate owing to their two-dimensional nature and image distortion. Schwartz-Arad et al. [8] also demonstrated bone formation in mandibular symphysis defects using helical computed tomography (CT). The study reported a second harvesting from the same area; nonetheless, the defect was grafted with bovine bone particles, and quantitative evaluations were not performed.
More recent studies have attempted to perform quantitative evaluations. Verdugo et al. [25] attempted to quantify the mandibular symphysis bone formation after bone block harvesting with CT evaluation at different time points. The initial period was 4–13 months after harvesting, whereas the final period was 24–72 months after harvesting. The bone repair rate was 63.8%. Measurements were obtained in two dimensions and were multiplied by the number of cuts. Diez et al. [6] also performed CT evaluations of the bone formation in the mandibular ramus 6 months after bone harvesting. The registration was based on a tomographic guide containing steel balls, and volumetric measurements were obtained from CT images. Subsequently, a bone deposition of 76.1% was observed. In this study, approximately half of the bone was observed to regenerate, which seemed appropriate considering the 4 month duration of the follow-up period. The bone repair rate of this study is expected to be higher with longer observation periods.
Bone defect healing is a complex process involving numerous cellular signaling pathways mediated by multiple factors, including hypoxia, inflammation, and mechanical loading [26]. Those factors trigger osteogenic cell proliferation, which is of great clinical interest in the regeneration of lost bone, particularly for body defects around dental elements and implants [27]. Currently, stem cells of different origins are proposed for more predictable regenerative procedures. Among those are pluripotent embryonic stem cells, undifferentiated multipotent mesenchymal stem cells, and induced pluripotent stem cells. More research is needed to utilize these stem cells for bone regeneration procedures in donor sites of mandibular bone block [28].
Currently, CBCT is widely used in dentistry, offering 3D data on jaw bones and teeth with relatively low radiation doses and costs. Although volumetric measurements were performed using CBCT images, there are several known limitations to this approach. For instance, accurate measurement using 3D analysis software is difficult owing to the varied degrees of ossification at the bone boundaries [29,30]. Moreover, the patient cannot be placed in the exact same position again for serial CBCT images. Therefore, the donor site images cannot be obtained by simple deduction of serial CBCT images. Lastly, reliable evaluation of the bone volume and quality is difficult to achieve owing to errors in the manual registration.
To overcome these difficulties, we attempted both a confinement of the ROI and an intensity-based registration technique. Each CBCT image has a large variation in pixel values caused by an increased amount of scattered radiation [31], which prevents accurate registration. By the segmentation of mandible, the ROI used for registration was confined, which can result in smaller registration error. The registration was conducted using an intensity-based algorithm, which has been used for various multimodal registrations and is reported to be clinically acceptable when registering two CBCT images with less than 0.5 mm registration error [32,33].
In this study, pixel value calculation was used to evaluate the quality of the newly generated bone, which is generally considered incorrect owing to the inaccuracy of CBCT images. Nonetheless, because this study implemented histogram matching, the images had to be transformed for the comparisons. The bone quality has been widely analyzed using the pixel value in microCT [34,35]. A positive correlation between the structural indices of CBCT and micro-CT has been reported in several studies [36,37]. In addition, several studies have compared CBCT pixel values with CT numbers using histogram matching [38]; however, few studies have compared CBCT with CBCT using histogram matching [17]. Analysis of bone quality is clinically important because bone volume alone is insufficient for the evaluation of the structural changes inside the donor site. The results of this study showed that the pixel value at T2 was significantly lower than that at T0 (p < 0.05). It can be interpreted that a newly generated bone has poorer quality in general than the original bone. The technique demonstrated in the present study has yet to be proven clinically. Notwithstanding, it is still worth attempting in dentistry. For example, the pixel value of the insertion site and insertion torque can be compared to set up the relation of pixel value and bone quality in CBCT images.
Two postoperative CBCT scans after a preoperative exam raise concerns about radiation protection, since there is no evidence that postoperative CBCT scans can be justified after bone graft. The postoperative CBCT scans in this study were taken for additional 3D information, which was crucial for treatment planning. In T1, CBCT was taken instead of panorama when evaluation of the initial fixation or of the nerve damage was required. In T2, CBCT was taken for three-dimensional evaluation of the implant placement site and for the production of surgical guide.
This study had some limitations. Firstly, several factors contributed to the results. The pre-existing quality of the donor sites differed among patients. Additionally, the size of the harvested bone was not strictly standardized. Although all surgeries were performed by two clinicians using the same protocol, the differences observed might be in part due to skill differences and patient allocation. Secondly, the bone healing time (time between T1 and T2) was variable. Setting the same time points is necessary to control variations; even so, there are limitations in clinical practice. Moreover, the follow-up period was shorter than that reported in previous studies [6,15]. Further studies with longer follow-up periods are needed to provide reliable evidence for the second harvest. Lastly, our results showed that the bone repair rate was 34.9% after 4 months. This result seems to be lower than that reported in previous studies [6,15]. One reason for this finding is the short follow-up period. With additional follow-up imaging (1 or 2 years of follow-up), a higher bone regeneration rate is expected.
Patients who undergo bone augmentation procedures often need more bone grafts in different areas as well. Therefore, this study could be useful in providing evidence of a second harvest from the same site. Considering the regeneration rate observed and the poorer bone quality, the results of this study are unsatisfactory in providing evidence for a second harvest. Nevertheless, a convenient and accurate method for decreasing human error was suggested in this study, which can lead to reliable results in future clinical studies. Further studies are needed to create the guidelines to standardize this technique to make it clinically applicable.
5. Conclusions
Intensity-based registration with histogram matching showed that newly generated bone is generally qualitatively and quantitatively poorer than the original bone, which reveals the feasibility of pixel value to evaluate bone quality in CBCT images. Considering the bone mass recovered in this study, 4 months was not a sufficient period for a second harvest. A longer follow-up period is needed. In addition, studies using more quantitative evaluation methods are necessary.
Author Contributions
S.K. contributed to the acquisition, analysis, and interpretation of data; J.-Y.L. and J.H. contributed to the conceptualization and design of the study, and to the analysis and interpretation of data; Y.K. and B.-H.C. contributed to the interpretation of the data and linguistic aspects of the manuscript. All authors have read and agreed to the published version of the manuscript.
Funding
This research received no external funding.
Institutional Review Board Statement
The study was conducted according to the guidelines of the Declaration of Helsinki and approved by the Institutional Review Board of Pusan National Dental Hospital (PNUDH-2022-005).
Informed Consent Statement
Patient consent was waived because of the retrospective nature of the study, and the analysis used anonymous clinical data.
Conflicts of Interest
The authors declare no conflict of interest.
References
- Cordaro, L.; Torsello, F.; Ribeiro, C.A.; Liberatore, M.; di Torresanto, V.M. Inlay–onlay grafting for three-dimensional reconstruction of the posterior atrophic maxilla with mandibular bone. Int. J. Oral Maxillofac. Surg. 2010, 39, 350–357. [Google Scholar] [CrossRef] [PubMed]
- Chiapasco, M.; Casentini, P.; Zaniboni, M. Bone augmentation procedures in implant dentistry. Int. J. Oral Maxillofac. Implant. 2009, 24, 237–259. [Google Scholar]
- Misch, C.M. Maxillary Autogenous Bone Grafting. Dent. Clin. N. Am. 2011, 55, 697–713. [Google Scholar] [CrossRef] [PubMed]
- Misch, C.M. Comparison of intraoral donor sites for onlay grafting prior to implant placement. Int. J. Oral Maxillofac. Implant. 1997, 12, 767–776. [Google Scholar]
- Jensen, J.; Sindet-Pedersen, S. Autogenous mandibular bone grafts and osseointegrated implants for reconstruction of the severely atrophied maxilla: A preliminary report. J. Oral Maxillofac. Surg. 1991, 49, 1277–1287. [Google Scholar] [CrossRef]
- Diez, G.F.; Fontao, F.N.; Bassi, A.P.; Gama, J.C.; Claudino, M. Tomographic follow-up of bone regeneration after bone block harvesting from the mandibular ramus. Int. J. Oral Maxillofac. Surg. 2014, 43, 335–340. [Google Scholar] [CrossRef]
- Felice, P.; Iezzi, G.; Lizio, G.; Piattelli, A.; Marchetti, C. Reconstruction of atrophied posterior mandible with inlay technique and mandibular ramus block graft for implant prosthetic rehabilitation. J. Oral Maxillofac. Surg. 2009, 67, 372–380. [Google Scholar] [CrossRef]
- Schwartz-Arad, D.; Levin, L. Symphysis revisited: Clinical and histologic evaluation of newly formed bone and reharvesting potential of previously used symphysial donor sites for onlay bone grafting. J. Periodontol. 2009, 80, 865–869. [Google Scholar] [CrossRef]
- Kim, Y.K.; Yun, P.Y.; Kim, S.G.; Kim, B.S.; Ong, J.L. Evaluation of sinus bone resorption and marginal bone loss after sinus bone grafting and implant placement. Oral Surg. Oral Med. Oral Pathol. Oral Radiol. Endodontol. 2009, 107, e21–e28. [Google Scholar] [CrossRef]
- Gorla, L.F.; Spin-Neto, R.; Boos, F.B.; Pereira Rdos, S.; Garcia-Junior, I.R.; Hochuli-Vieira, E. Use of autogenous bone and beta-tricalcium phosphate in maxillary sinus lifting: A prospective, randomized, volumetric computed tomography study. Int. J. Oral Maxillofac. Surg. 2015, 44, 1486–1491. [Google Scholar] [CrossRef]
- Mohlhenrich, S.C.; Heussen, N.; Ayoub, N.; Holzle, F.; Modabber, A. Three-dimensional evaluation of the different donor sites of the mandible for autologous bone grafts. Clin. Oral Investig. 2015, 19, 453–458. [Google Scholar] [CrossRef] [PubMed]
- Arasawa, M.; Oda, Y.; Kobayashi, T.; Uoshima, K.; Nishiyama, H.; Hoshina, H.; Saito, C. Evaluation of bone volume changes after sinus floor augmentation with autogenous bone grafts. Int. J. Oral Maxillofac. Surg. 2012, 41, 853–857. [Google Scholar] [CrossRef] [PubMed]
- Gherlone, E.; Polizzi, E.; Tete, G.; Cappare, P. Dentistry and Covid-19 pandemic: Operative indications post-lockdown. New Microbiol. 2021, 44, 1–11. [Google Scholar]
- Zachiu, C.; de Senneville, B.D.; Tijssen, R.H.N.; Kotte, A.; Houweling, A.C.; Kerkmeijer, L.G.W.; Lagendijk, J.J.W.; Moonen, C.T.W.; Ries, M. Non-rigid CT/CBCT to CBCT registration for online external beam radiotherapy guidance. Phys. Med. Biol. 2017, 63, 015027. [Google Scholar] [CrossRef] [PubMed]
- Park, S.; Plishker, W.; Quon, H.; Wong, J.; Shekhar, R.; Lee, J. Deformable registration of CT and cone-beam CT with local intensity matching. Phys. Med. Biol. 2017, 62, 927–947. [Google Scholar] [CrossRef] [PubMed]
- Pauwels, R.; Jacobs, R.; Singer, S.R.; Mupparapu, M. CBCT-based bone quality assessment: Are Hounsfield units applicable? Dentomaxillofac. Radiol. 2015, 44, 20140238. [Google Scholar] [CrossRef] [PubMed]
- Kwon, J.J.; Hwang, J.; Kim, Y.D.; Shin, S.H.; Cho, B.H.; Lee, J.Y. Automatic three-dimensional analysis of bone volume and quality change after maxillary sinus augmentation. Clin. Implant Dent. Relat. Res. 2019, 21, 1148–1155. [Google Scholar] [CrossRef] [PubMed]
- Kidar, H.S.; Azizi, H. Assessing the impact of choosing different deformable registration algorithms on cone-beam CT enhancement by histogram matching. Radiat. Oncol. 2018, 13, 217. [Google Scholar] [CrossRef]
- Hwang, J.J.; Kim, K.D.; Park, H.; Park, C.S.; Jeong, H.G. Factors influencing superimposition error of 3D cephalometric landmarks by plane orientation method using 4 reference points: 4 point superimposition error regression model. PLoS ONE 2014, 9, e110665. [Google Scholar] [CrossRef]
- Dot, G.; Rafflenbeul, F.; Salmon, B. Voxel-based superimposition of Cone Beam CT scans for orthodontic and craniofacial follow-up: Overview and clinical implementation. Int. Orthod. 2020, 18, 739–748. [Google Scholar] [CrossRef]
- Han, G.; Li, J.; Wang, S.; Wang, L.; Zhou, Y.; Liu, Y. A comparison of voxel- and surface-based cone-beam computed tomography mandibular superimposition in adult orthodontic patients. J. Int. Med. Res. 2021, 49, 300060520982708. [Google Scholar] [CrossRef]
- Gonalez, R.C.; Woods, R.E. Digital Image Processing, 3rd ed.; Prentice Hall: Hoboken, NJ, USA, 2008; Volume 3, p. 128. [Google Scholar]
- Raghoebar, G.M.; Meijndert, L.; Kalk, W.W.; Vissink, A. Morbidity of mandibular bone harvesting: A comparative study. Int. J. Oral Maxillofac. Implant. 2007, 22, 359–365. [Google Scholar]
- Pikos, M.A. Mandibular block autografts for alveolar ridge augmentation. Atlas Oral Maxillofac. Surg. Clin. N. Am. 2005, 13, 91–107. [Google Scholar] [CrossRef]
- Verdugo, F.; Simonian, K.; D’Addona, A.; Ponton, J.; Nowzari, H. Human bone repair after mandibular symphysis block harvesting: A clinical and tomographic study. J. Periodontol. 2010, 81, 702–709. [Google Scholar] [CrossRef] [PubMed]
- Yu, X.; Wan, Q.; Ye, X.; Cheng, Y.; Pathak, J.L.; Li, Z. Cellular hypoxia promotes osteogenic differentiation of mesenchymal stem cells and bone defect healing via STAT3 signaling. Cell. Mol. Biol. Lett. 2019, 24, 64. [Google Scholar] [CrossRef] [PubMed]
- Ballini, A.; Mastrangelo, F.; Gastaldi, G.; Tettamanti, L.; Bukvic, N.; Cantore, S.; Cocco, T.; Saini, R.; Desiate, A.; Gherlone, E.; et al. Osteogenic differentiation and gene expression of dental pulp stem cells under low-level laser irradiation: A good promise for tissue engineering. J. Boil. Regul. Homeost. Agents 2015, 29, 813–822. [Google Scholar]
- Tete, G.; D’Orto, B.; Nagni, M.; Agostinacchio, M.; Polizzi, E.; Agliardi, E. Role of induced pluripotent stem cells (IPSCS) in bone tissue regeneration in dentistry: A narrative review. J. Boil. Regul. Homeost. Agents 2020, 34, 1–10. [Google Scholar]
- Klein, G.G.; Curvello, V.P.; Dutra, R.A.; Simeao, S.P.; Santos, P.L.; Gulinelli, J.L.; Filho, H.N. Bone Volume Changes After Sinus Floor Augmentation with Heterogenous Graft. Int. J. Oral Maxillofac. Implant. 2016, 31, 665–671. [Google Scholar] [CrossRef]
- Kirmeier, R.; Payer, M.; Wehrschuetz, M.; Jakse, N.; Platzer, S.; Lorenzoni, M. Evaluation of three-dimensional changes after sinus floor augmentation with different grafting materials. Clin. Oral Implant. Res. 2008, 19, 366–372. [Google Scholar] [CrossRef]
- Kim, S.; Yoo, S.; Yin, F.F.; Samei, E.; Yoshizumi, T. Kilovoltage cone-beam CT: Comparative dose and image quality evaluations in partial and full-angle scan protocols. Med. Phys. 2010, 37, 3648–3659. [Google Scholar] [CrossRef]
- Du, J.; Tang, S.; Jiang, T.; Lu, Z. Intensity-based robust similarity for multimodal image registration. Int. J. Comput. Math. 2006, 83, 49–57. [Google Scholar] [CrossRef]
- ElShebiny, T.; Elbarnashawy, S.; Bennasir, E.; Nadim, M.A.; Palomo, J.M. Comparison of Two Software Programs in Voxel-Based Superimposition of CBCT Images. J. Clin. Orthod. 2019, 53, 662–668. [Google Scholar] [PubMed]
- Cengiz, I.F.; Oliveira, J.M.; Reis, R.L. Micro-CT—A digital 3D microstructural voyage into scaffolds: A systematic review of the reported methods and results. Biomater. Res. 2018, 22, 26. [Google Scholar] [CrossRef]
- Faot, F.; Chatterjee, M.; de Camargos, G.V.; Duyck, J.; Vandamme, K. Micro-CT analysis of the rodent jaw bone micro-architecture: A systematic review. Bone Rep. 2015, 2, 14–24. [Google Scholar] [CrossRef] [PubMed]
- Paniagua, B.; Ruellas, A.C.; Benavides, E.; Marron, S.; Woldford, L.; Cevidanes, L. Validation of CBCT for the computation of textural biomarkers. Proc. SPIE Int. Soc. Opt. Eng. 2015, 9417, 356–364. [Google Scholar] [CrossRef]
- Liang, X.; Zhang, Z.; Gu, J.; Wang, Z.; Vandenberghe, B.; Jacobs, R.; Yang, J.; Ma, G.; Ling, H.; Ma, X. Comparison of micro-CT and cone beam CT on the feasibility of assessing trabecular structures in mandibular condyle. Dentomaxillofac. Radiol. 2017, 46, 20160435. [Google Scholar] [CrossRef]
- Abe, T.; Tateoka, K.; Saito, Y.; Nakazawa, T.; Yano, M.; Nakata, K.; Someya, M.; Hori, M.; Sakata, K. Method for Converting Cone-Beam CT Values into Hounsfield Units for Radiation Treatment Planning. Int. J. Med. Phys. Clin. Eng. Radiat. Oncol. 2017, 6, 361–375. [Google Scholar] [CrossRef][Green Version]
Publisher’s Note: MDPI stays neutral with regard to jurisdictional claims in published maps and institutional affiliations. |
© 2022 by the authors. Licensee MDPI, Basel, Switzerland. This article is an open access article distributed under the terms and conditions of the Creative Commons Attribution (CC BY) license (https://creativecommons.org/licenses/by/4.0/).