
Fabrication of Nitrogen-Doped Reduced Graphene Oxide Modified Screen Printed Carbon Electrode (N-rGO/SPCE) as Hydrogen Peroxide Sensor


School of Materials Science and Engineering, Yeungnam University, Gyeongsan 38541, Korea
*
Author to whom correspondence should be addressed.
Nanomaterials 2022, 12(14), 2443; https://doi.org/10.3390/nano12142443
Submission received: 11 June 2022
/
Revised: 5 July 2022
/
Accepted: 14 July 2022
/
Published: 16 July 2022
(This article belongs to the Special Issue Nanomaterials for Printed Electronics and Bioelectronics)
Abstract
:In recent years, the electrochemical sensing approach has attracted electrochemists because of its excellent detection process, simplicity, high sensitivity, cost-effectiveness, and high selectivity. In this study, we prepared nitrogen doped reduced graphene oxide (N-rGO) and characterized it using various advanced techniques such as XRD, SEM, EDX, Raman, and XPS. Furthermore, we modified the active surface of a screen printed carbon electrode (SPCE) via the drop-casting of N-rGO. This modified electrode (N-rGO/SPCE) exhibited an excellent detection limit (LOD) of 0.83 µM with a decent sensitivity of 4.34 µAµM−1cm−2 for the detection of hydrogen peroxide (H2O2). In addition, N-rGO/SPCE also showed excellent selectivity, repeatability, and stability for the sensing of H2O2. Real sample investigations were also carried out that showed decent recovery.
1. Introduction
Hydrogen peroxide (H2O2) is a well-known by-product of various oxidase enzymes and is an oxidizing agent [1,2]. H2O2 plays a crucial role in the production of organic compounds, textiles, and is also used as bleaching agent in the food industries [3]. H2O2 may also control many biological processes such as immune cell activation, vascular remodeling, and root growth in living organisms [4]. Despite the extensive use of H2O2 in various fields, a high concentration of H2O2 may cause some diseases such as diabetes and Parkinson’s disease [5]. H2O2 may also cause skin or eye irritation, cancer, itching, and cardiovascular disease [6]. Thus, there is an immense interest and demand in developing a cost-effective, selective, highly sensitive, and stable H2O2 sensor [7,8,9,10]. In this connection, various conventional methods such as fluorescence, spectrophotometry, chromatography, and colorimetric methods have been used for the detection of H2O2 [11,12,13,14,15]. In the past few years, electrochemical methods have received huge interest because of their low cost, simple fabrication, high sensitivity, selectivity, and stability [16,17,18,19,20,21]. Previously, electrochemical methods have been widely used for the detection of hazardous/toxic compounds or biomolecules [22,23,24,25,26].
In this connection, nickel oxide (NiO)/carbon foam was applied as a H2O2 sensor by Liu et al. [20], which exhibited a limit of detection (LOD) of 0.013 µM. Ahmad et al. [2] reported MgO/SPE as a H2O2 sensor that demonstrated a LOD of 0.3 µM. Karuppiah et al. [27] utilized novel strategies and reported a LOD of 0.27 µM while Dang et al. [24] obtained a LOD of 1.2 µM. In other work, Uzunoglu et al. [28] developed a cerium dioxide (CeO2) modified electrode as a H2O2 sensor and reported a LOD of 2 µM. Graphene was also reported as a electrode modifier for the construction of a H2O2 sensor [29]. The fabricated sensor showed a LOD of 6.5 µM [29]. In other reports, an excellent LOD of 0.08 µM was obtained by Jiang et al. [30] and Chen et al. [31]. A new electrode material of zinc manganese oxide (ZnMn2O4) was also utilized as an electrode material by Li et al. [32], which showed a decent LOD of 0.13 µM. A hybrid composite of nickel cobalt sulfide and graphene (NiCo2S4/graphene) was also employed as an electrode modifier for the fabrication of a H2O2 sensor [33]. Thus, it can be understood that the electrochemical sensing ability of the developed H2O2 sensor can be affected by the physiochemical properties of the electrode materials. The previous literature also showed that electrode materials should have an excellent conductive nature as well as electro-catalytic properties [34,35,36,37].
Reduced graphene oxide (rGO) is a material of interest because of its excellent attributes such as high chemical stability, mechanical property, high surface area, electrical conductivity, and unique electronic properties [36]. rGO has a two-dimensional (2D) honeycomb lattice with single layer of carbon atoms [37,38,39]. Previously, rGO has been widely explored in various applications such as dye sensitized solar cells, electrochemical sensors, catalysis, batteries, supercapacitors, and perovskite solar cells. rGO has also been used to improve the electrical conductivity of poor semiconducting metal oxides [40,41]. In the last few years, the functionalization or modification of rGO has received extensive attention [42]. Previous reports have shown that the introduction of heteroatoms into the rGO matrix can cause defects, tune surface active sites, and tailor its band structure [43].
Herein, we prepared a nitrogen (N) doped rGO (N-rGO) using the hydrothermal method and a screen printed carbon electrode (SPCE) was modified with N-rGO as the electrode material for H2O2 sensing.
2. Materials and Methods
2.1. Chemicals and Reagents
Chemicals/reagents, solvents, and phosphate buffer solutions were purchased from Alfa Aesar, Merck, TCI, Fisher Scientific, and Sigma, Missouri, MO, USA.
2.2. Synthesis of N@rGO
Graphene oxide (GO) was prepared using a previous report [44]. To prepare the N-rGO, GO (50 mg) was added to 50 mL of distilled water (DW) and sonicated for 2 h. Furthermore, an appropriate amount of urea was added to the GO solution. Finally, this prepared aqueous solution of GO was poured into the Teflon-lined stainless steel autoclave cup (capacity 100 mL) and heated at 200 °C for 6 h in a vacuum furnace. The obtained precipitate was collected by centrifugation and washed with DW and ethanol several times to remove the residual impurities. Finally, the obtained powder was dried at 60 °C overnight and labeled as N-rGO.
2.3. Fabrication of N-rGO/SPCE
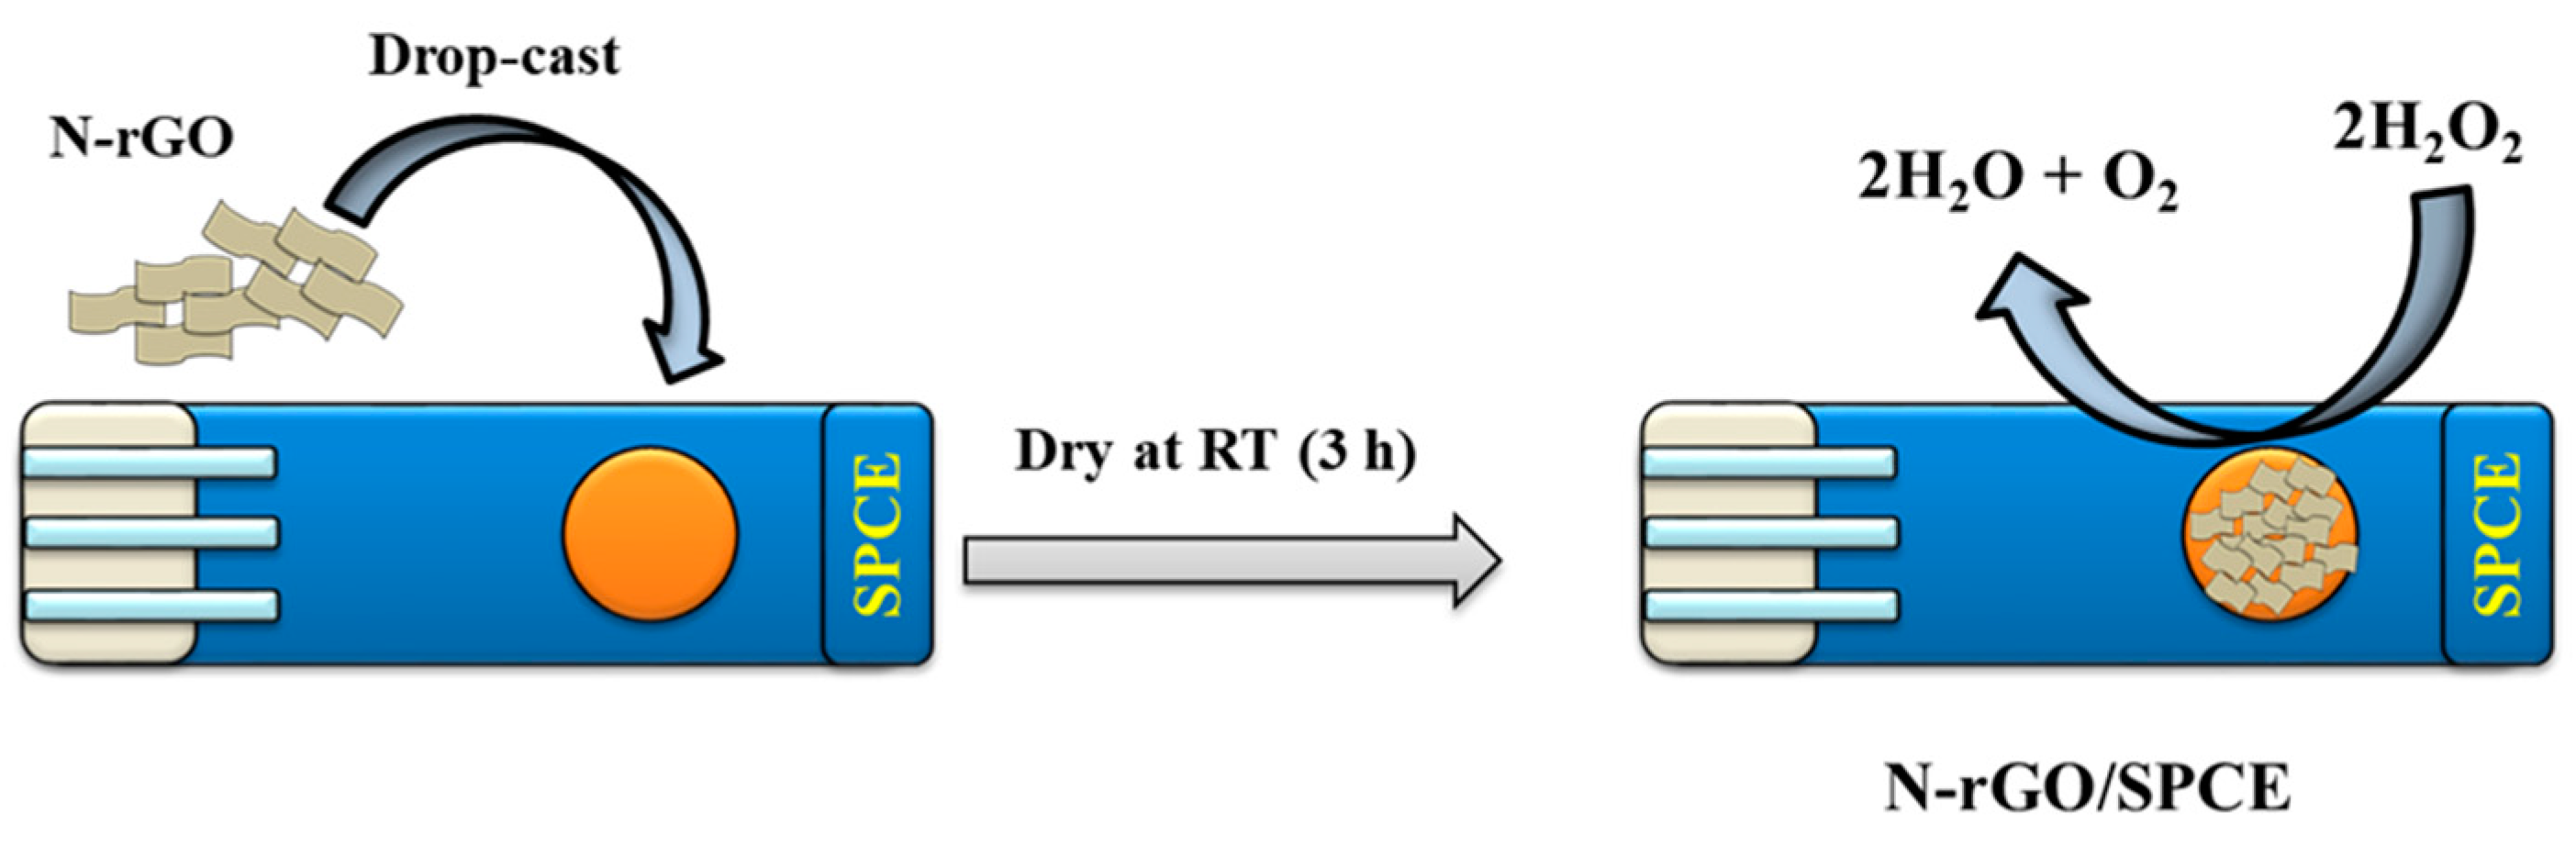
N-rGO (3 mg) was dispersed in 1.5 mL of DW and sonicated for 1 h. Furthermore, 7.5 µL of N-rGO was deposited on the active surface of SPCE to construct the H2O2 sensor.
The N-rGO modified SPCE (N-rGO/SPCE) was dried in air for 3 h at room temperature (RT). The modification of SPCE with N-rGO is illustrated in Scheme 1. The electrochemical sensing properties of N-rGO/SPCE were examined on a computer controlled three-electrode CH instrument using N-rGO/SPCE as the working electrode whereas a platinum electrode acted as the counter electrode. A silver/silver chloride (Ag/AgCl) electrode was used as the reference electrode.
3. Results
3.1. Physiochemical Characterization of N-rGO
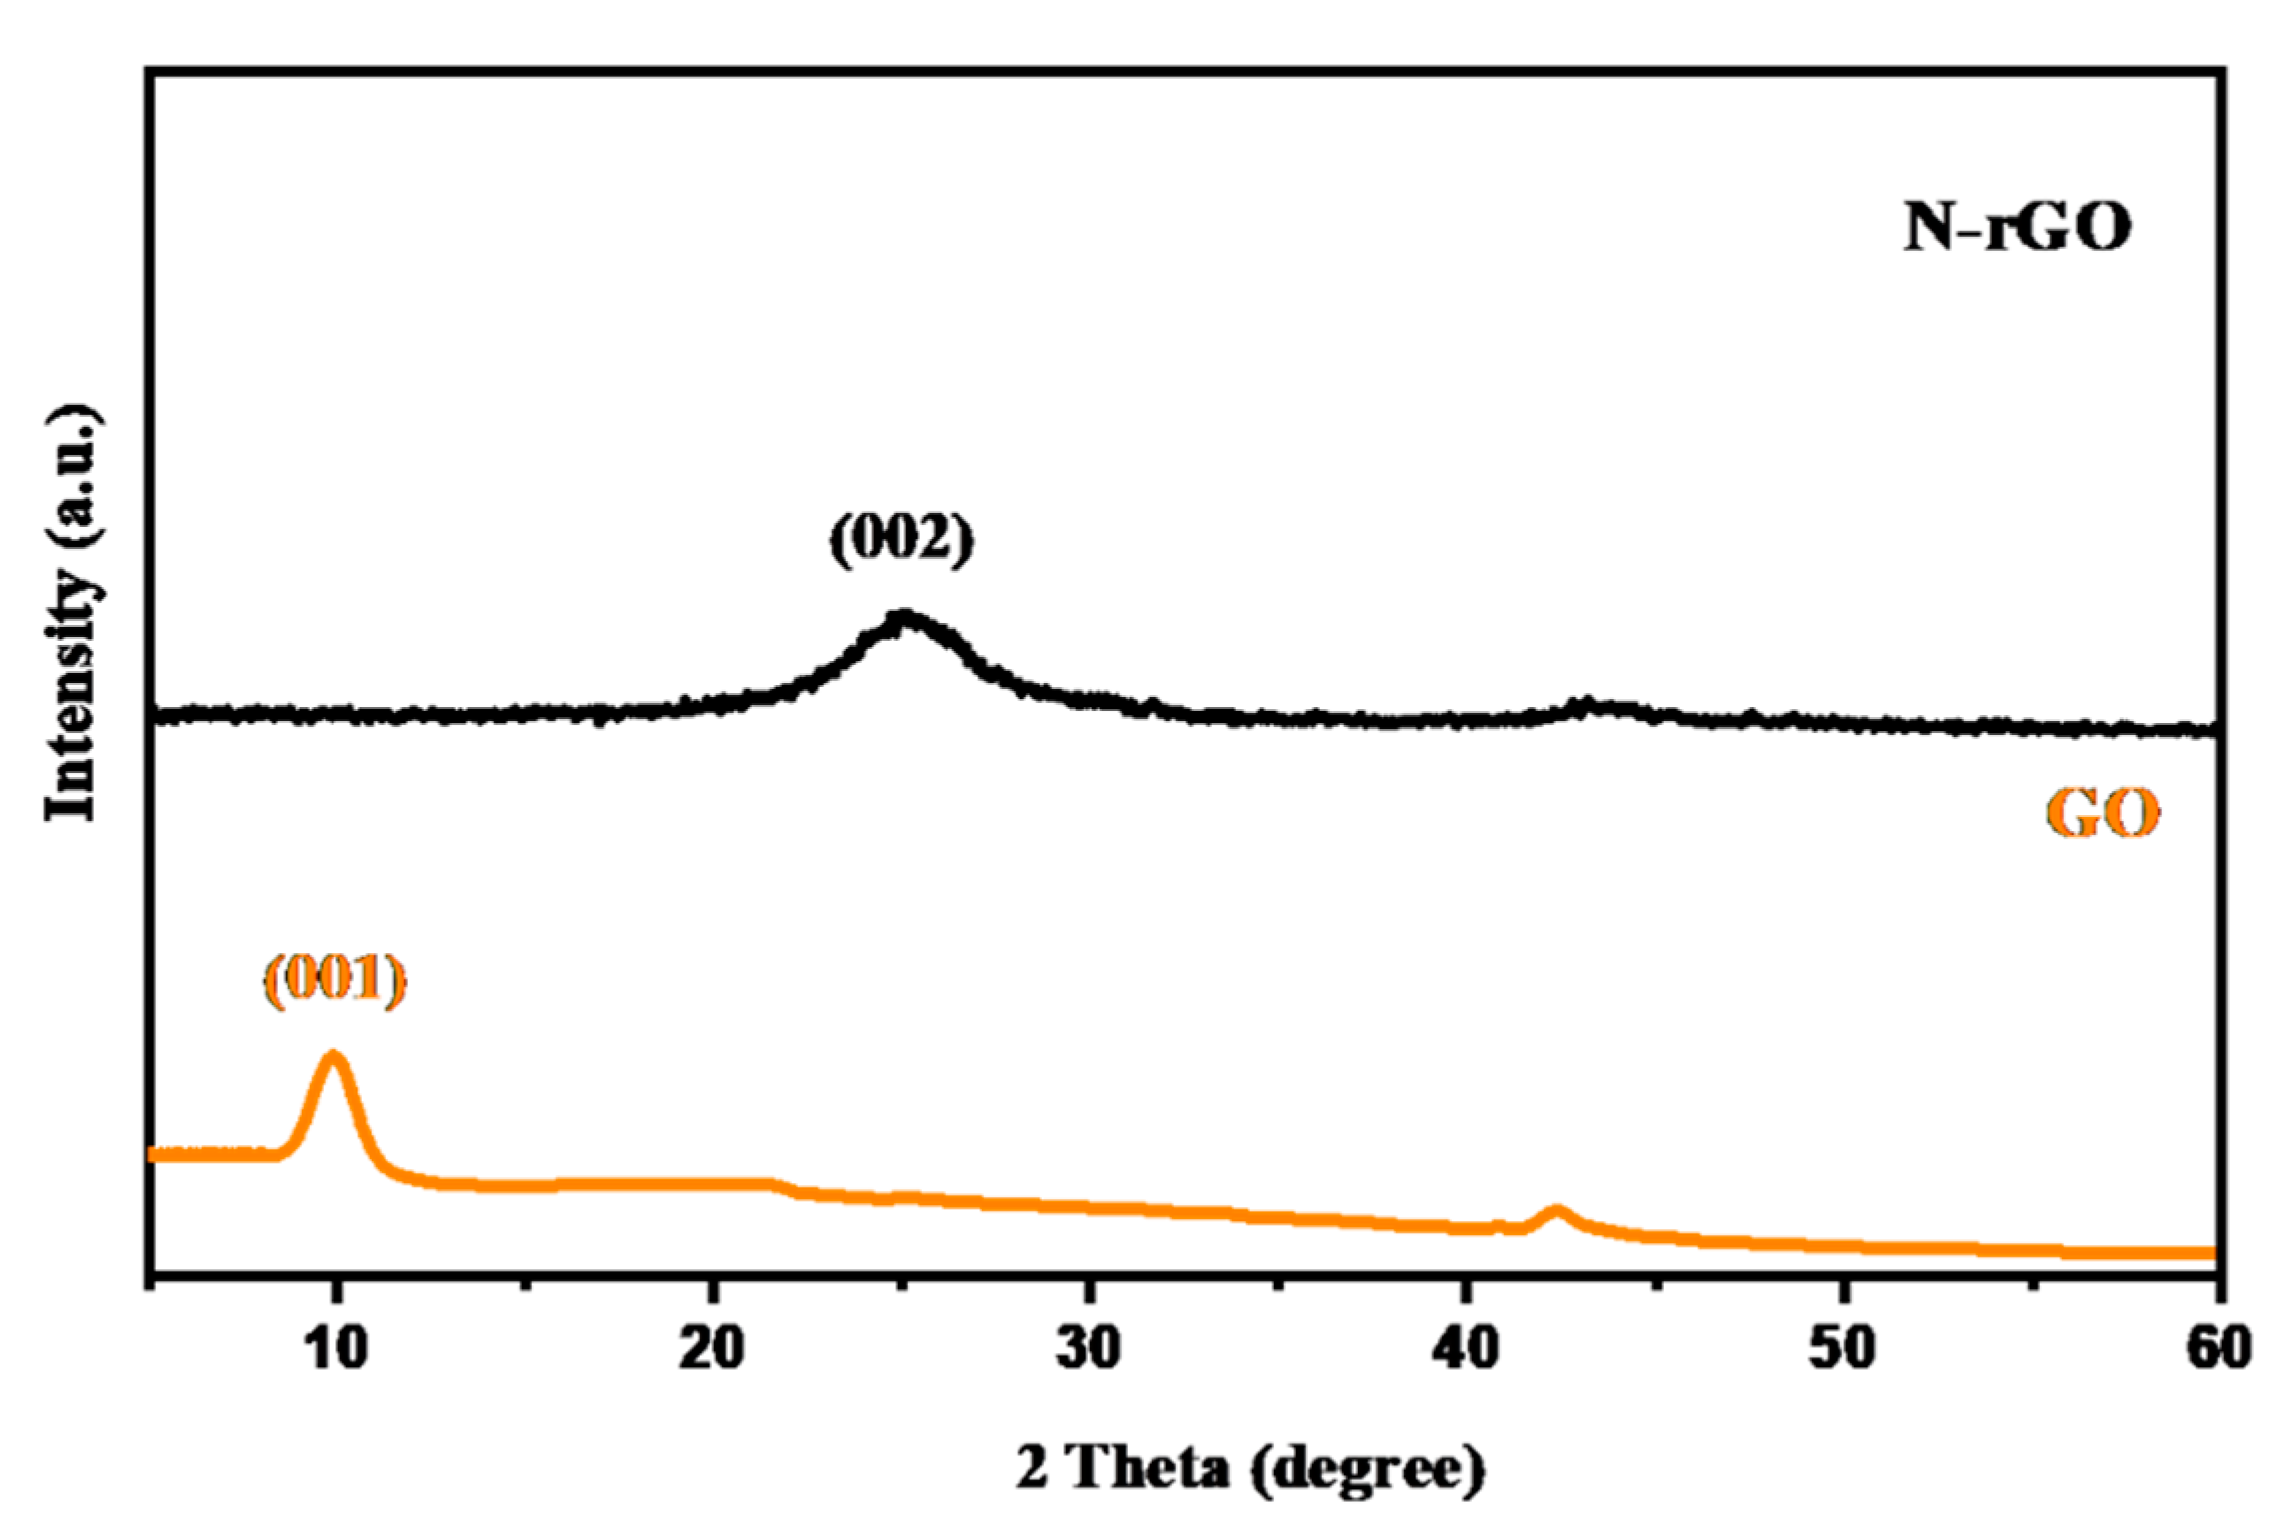
The powder X-ray diffraction (XRD) patterns of the GO and N-rGO were obtained on an X’pert Pro X-ray diffractometer. The recorded XRD pattern of the GO and N-rGO is displayed in Figure 1. The XRD pattern of GO showed a strong diffraction peak at ~10.1°, which can be assigned to the (001) diffraction plane of GO. In the case of N-rGO, a broad diffraction peak appeared at ~25.34°. This diffraction peak was attributed to the (002) diffraction plane and suggested the successful transformation of GO to N-rGO in the presence of urea (as N source). No other diffraction peak appeared in the XRD pattern of N-rGO, which suggests its phase purity. The obtained results are in well-agreement with previous studies [43].
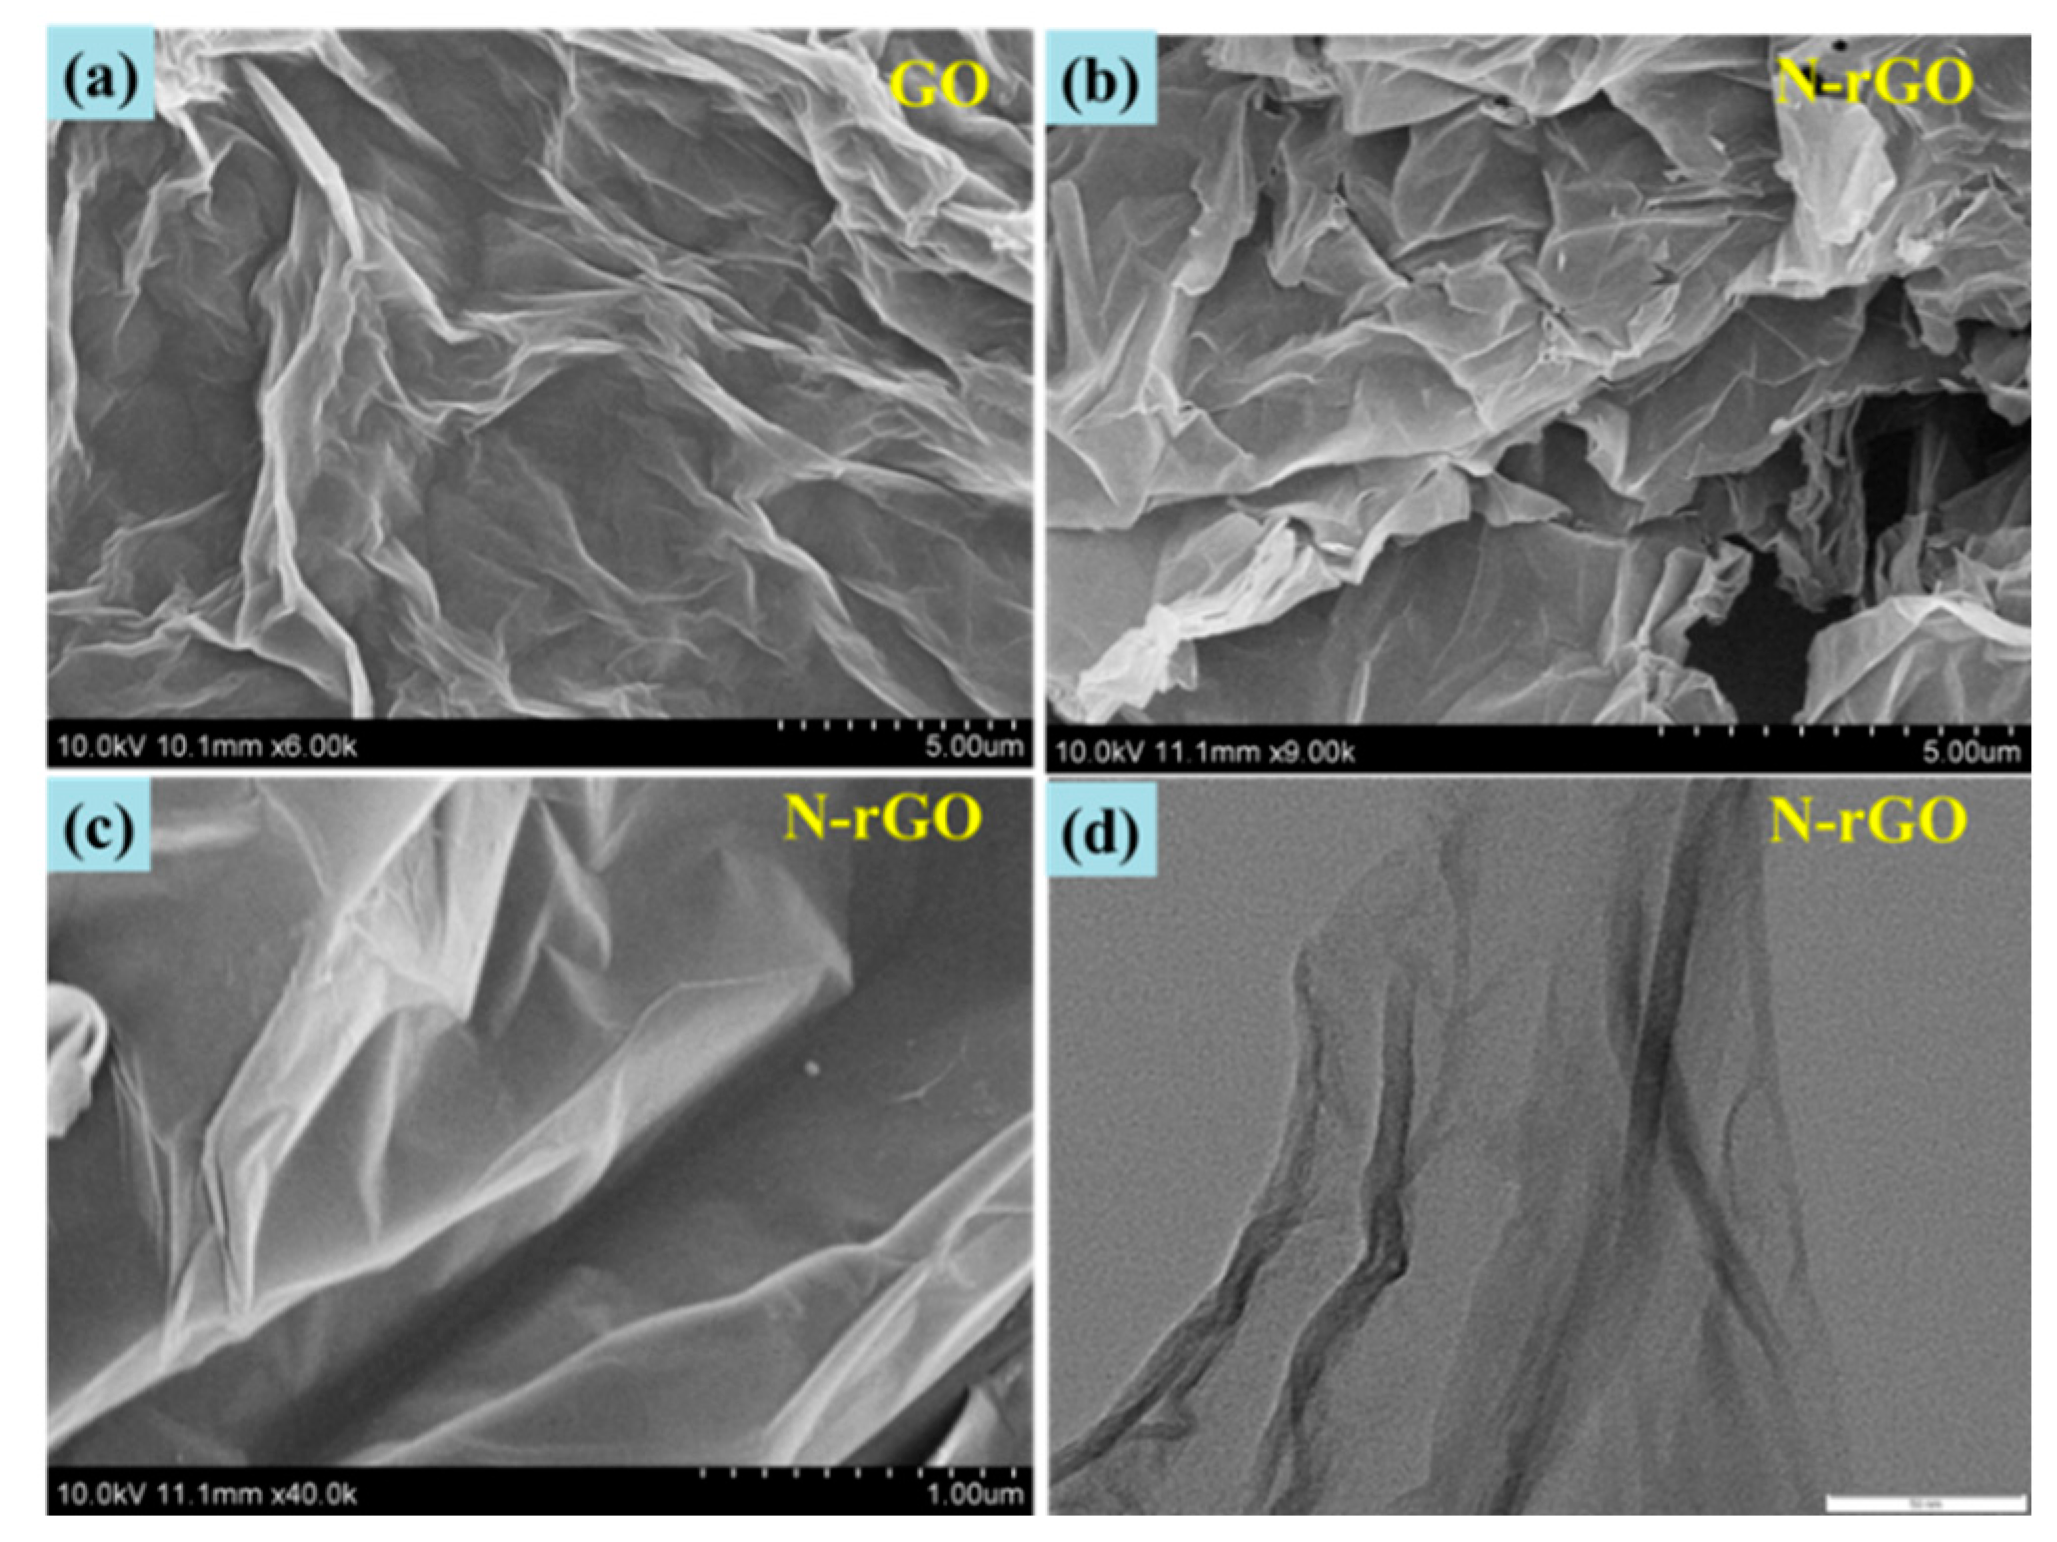
Scanning electron microscopy (SEM, Hitachi, S-4800) was further adopted to characterize the surface morphological properties of the GO and N-rGO.
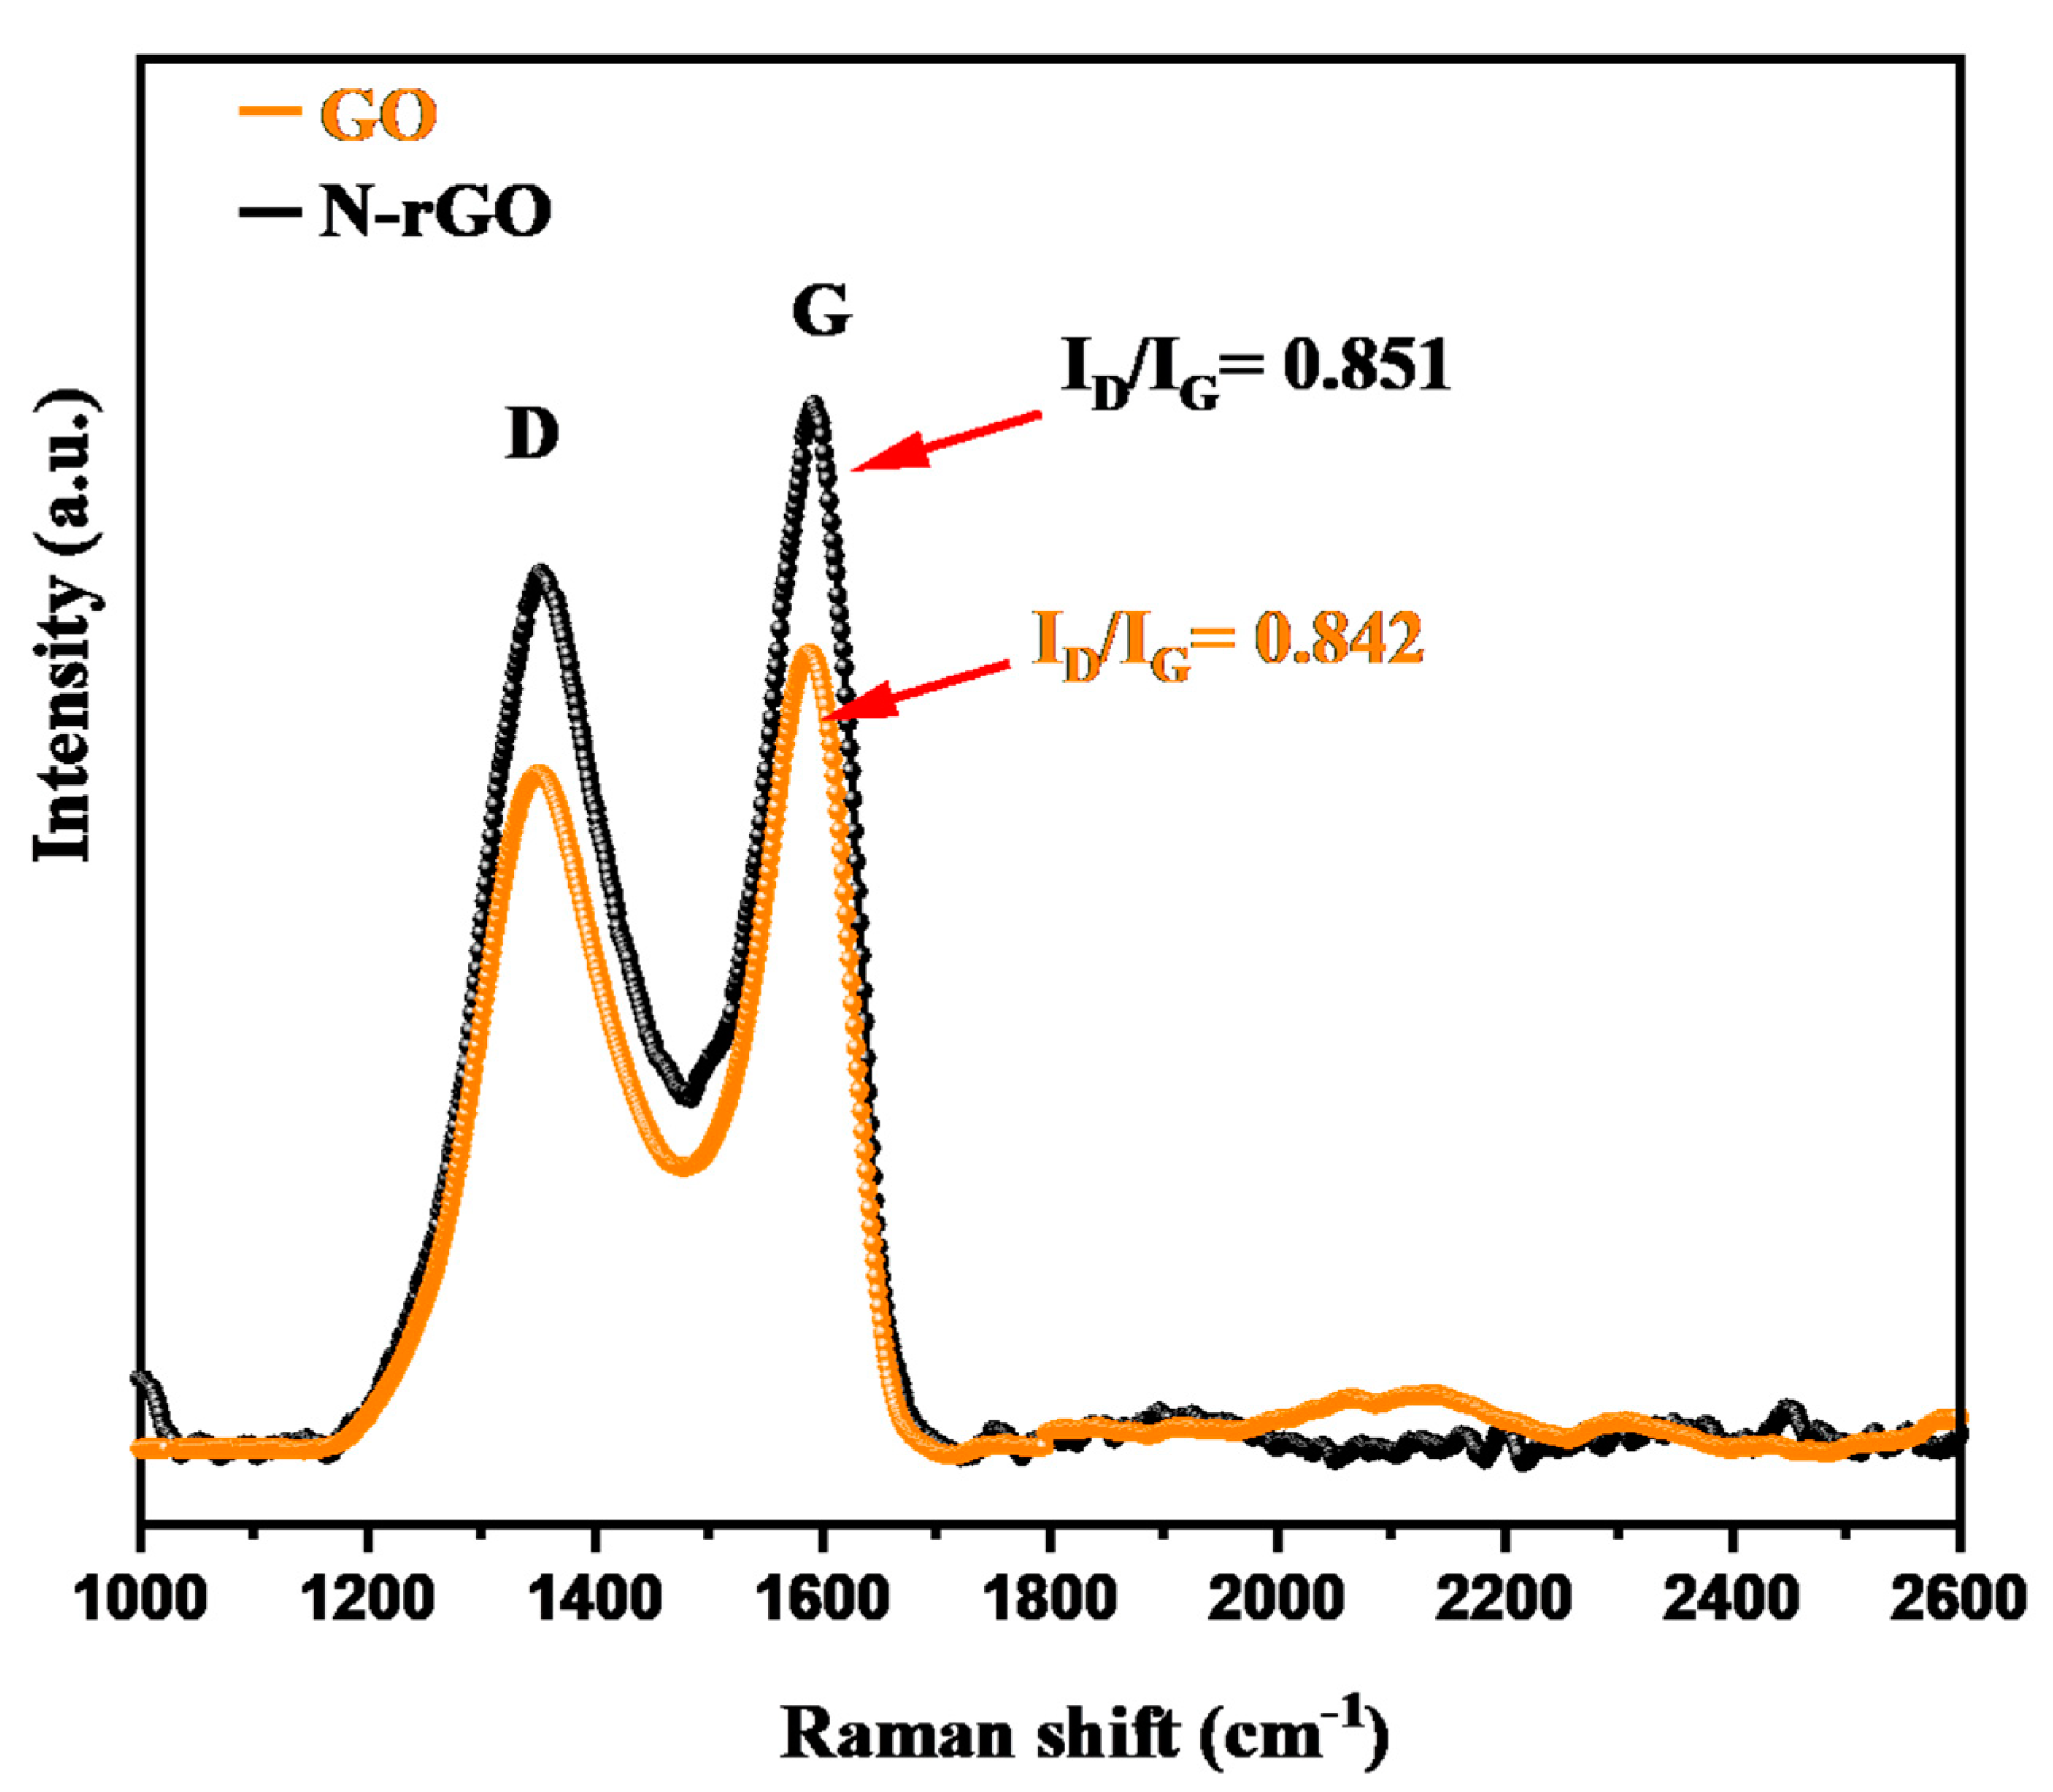
Figure 2a showed that prepared GO has a sheet-like surface morphology. In the case of N-rGO, a wrinkled sheet-like surface was observed (Figure 2b,c). The presence of the wrinkled sheet-like surface morphology of N-rGO may be due to the hydrothermal treatment. The obtained morphological characteristics of GO and N-rGO were well-matched with previous studies [42]. Figure 2d displays the transmission electron microscopic (TEM) image of N-rGO, which suggests that N-rGO consists of wrinkled sheet-like surface. The Raman spectroscopic investigation were performed on a Horiba scientific instrument and the recorded Raman data of the prepared GO and N-rGO are displayed in Figure 3. The Raman data of GO and N-rGO exhibited two-vibrational modes that can be assigned as D and G bands in the GO and N-rGO samples. The Raman study was consistent with previous studies [45,46]. The ID/IG ratio of the GO and N-rGO is presented in Figure 3. The observations suggest that the prepared N-rGO has a graphitic nature with low-defects.
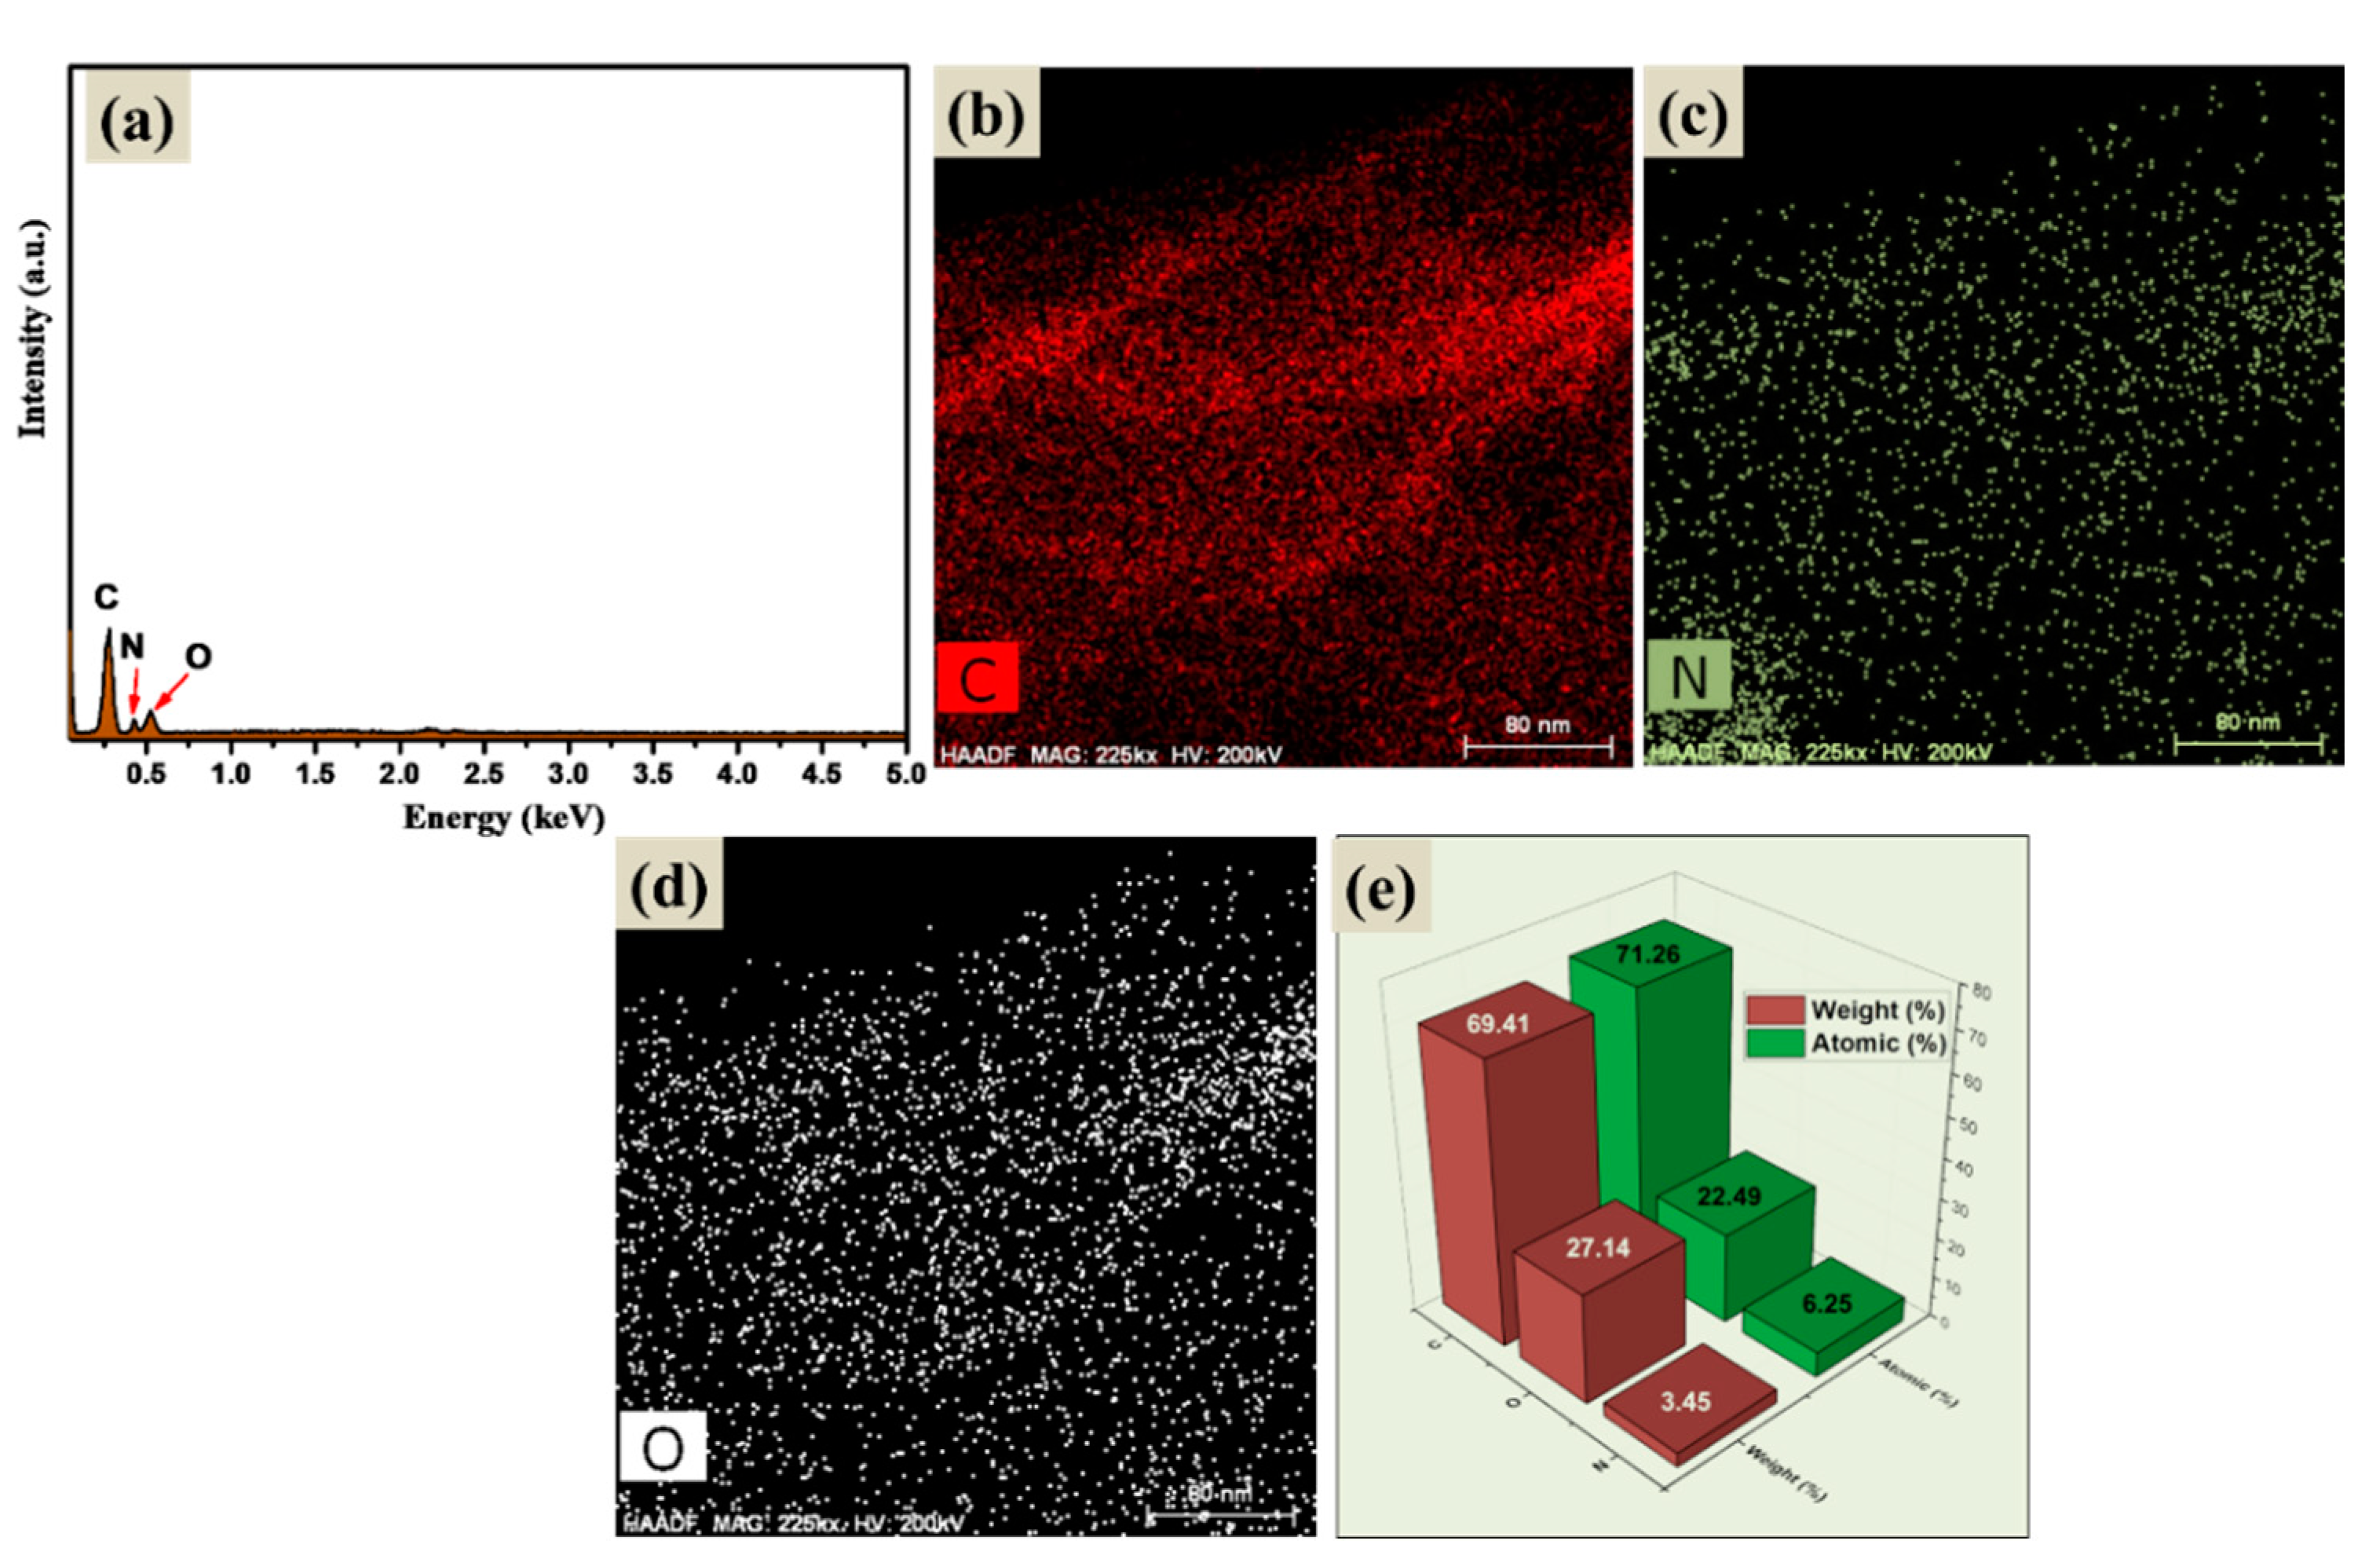
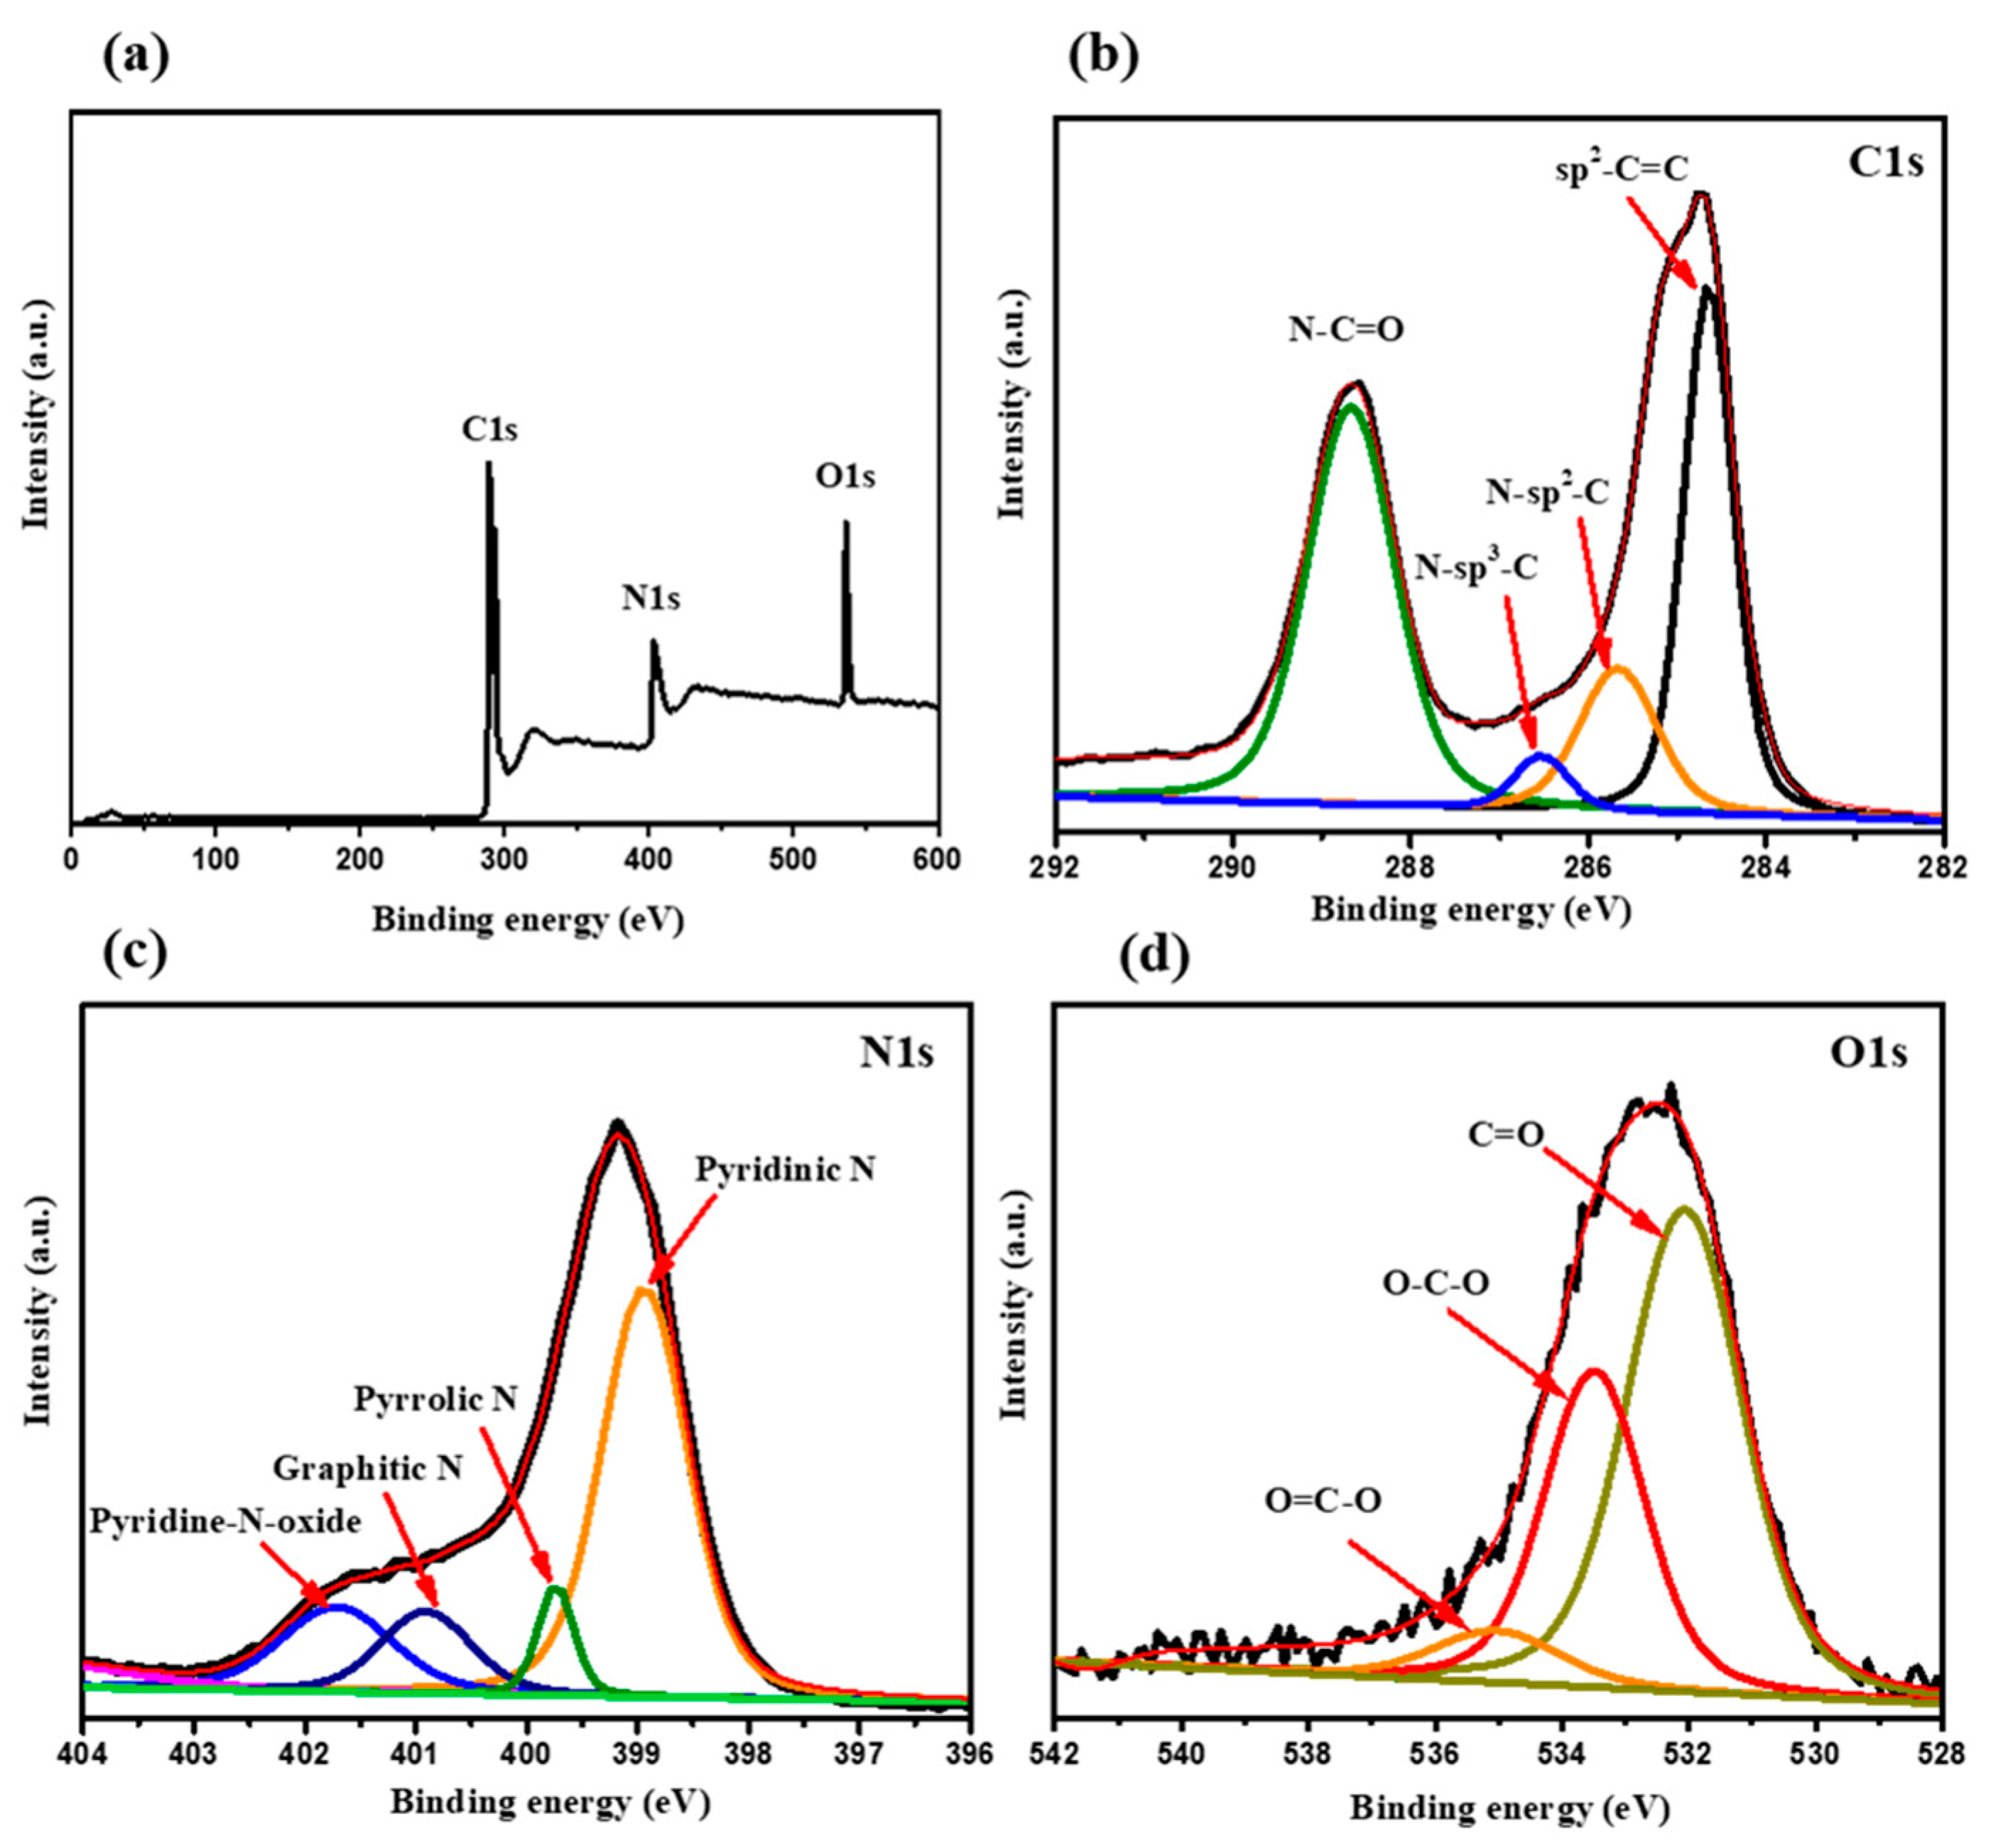
The presence of N in the N-rGO was confirmed by using energy-dispersive X-ray (EDX) spectroscopy. The EDX spectrum and EDX mapping images of the N, C, and O elements are displayed in Figure 4a–d. The elemental composition of N-rGO is provided in Figure 4e. The EDX spectrum confirmed the presence of N in the prepared N-rGO (Figure 4a). Subsequently, we used X-ray photoelectron spectroscopy (XPS, Thermo Scientific Instrument) to investigate the binding energy and oxidation states of the N, C and O elements in the N-rGO sample. Figure 5a depicts the XPS survey scan of N-rGO, which clearly shows the presence of the N, C, and O elements. The C1 scan of N-rGO is presented in Figure 5b, which shows four peaks. These peaks can be assigned to N-C=O, N-sp3-C, N-sp2-C, and sp2-C=C [47]. Figure 5c shows the N1s scan of N-rGO, which shows the presence of pyridinic N, pyrrolic N, graphitic N, and pyridine-N-oxide [47]. The reported literature suggests that pyridinic N can be more favorable for the enhancement of the electrochemical properties of N-rGO/GCE than pyrrolic N [47]. The obtained results confirmed the presence of N in the N-rGO sample and is consistent with previous study [47,48]. Figure 5d depicts the O1s scan of N-rGO, which indicates the presence of O=C-O, O-C-O, and C=O bonds [47]. The atomic weight percentage of C1s, N1s, and O1s elements were found to be 65.21%, 3.66%, and 31.13%, respectively, using the XPS method.
3.2. Electrochemical Performance of N-rGO/SPCE
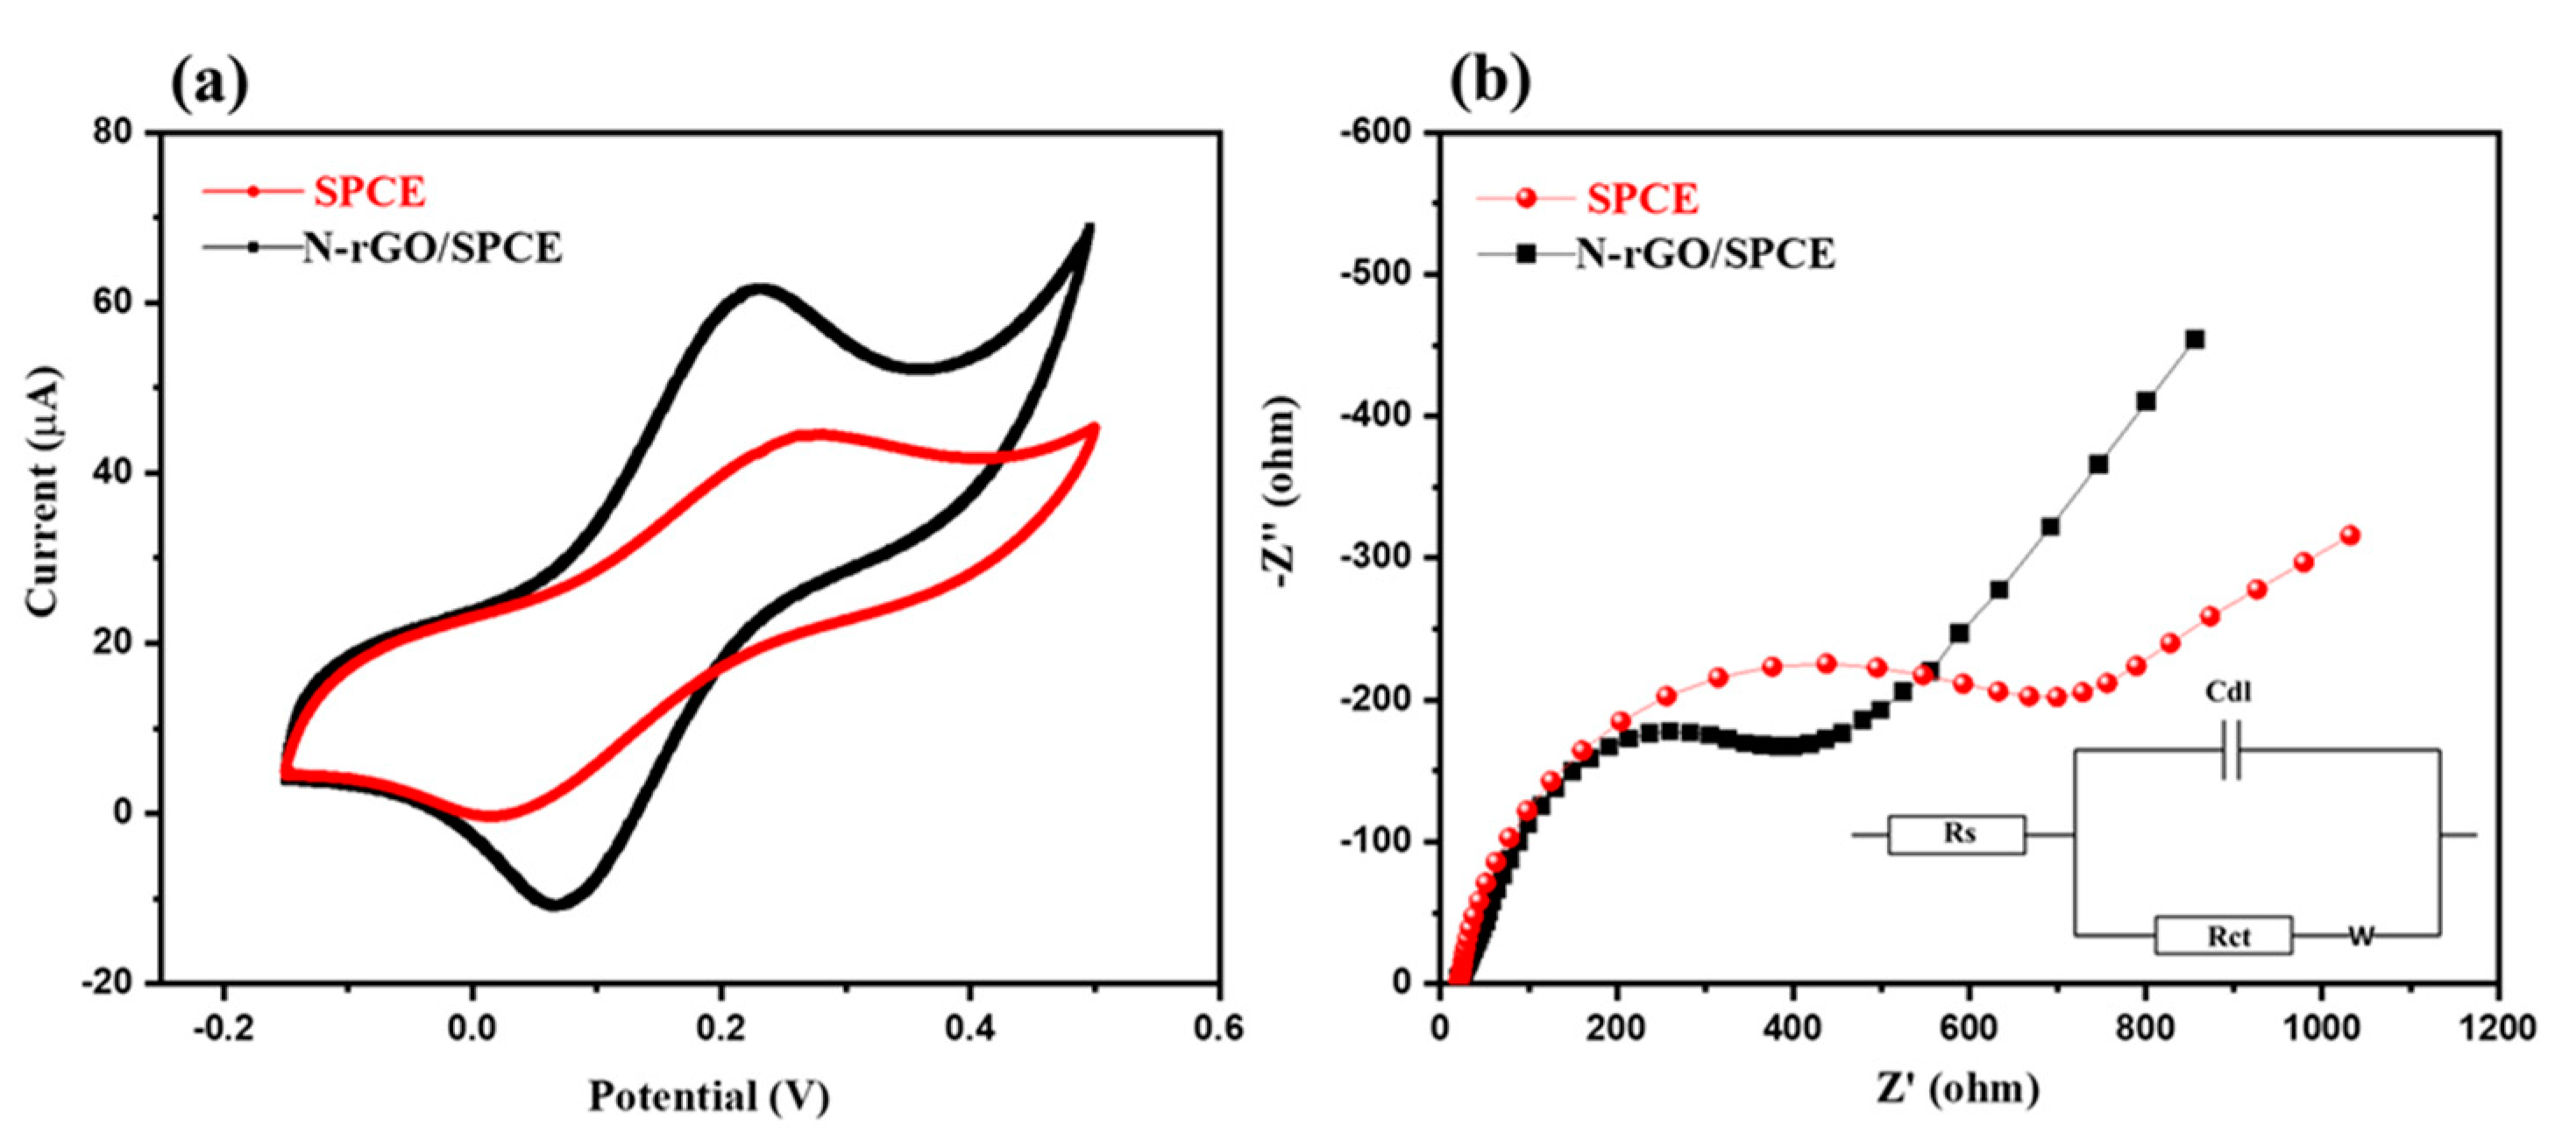
The electro-catalytic properties of the N-rGO/SPCE and bare SPCE were investigated in the K3[Fe(CN)6] and K4[Fe(CN)6] redox system. Figure 6a shows the cyclic voltammograms (CV) of the N-rGO/SPCE and bare SPCE in the presence of 3 mM K3[Fe(CN)6]/K4[Fe(CN)6] redox solution in 0.1 M PBS (pH = 7.0) at a scan rate of 50 mVs−1. Observations indicated that N-rGO/SPCE has a higher current response compared to the bare SPCE (Figure 6a). This higher electro-catalytic activity of N-rGO/SPCE may be attributed to the better electro-catalytic properties of the N-rGO. Furthermore, electrochemical impedance spectroscopy (EIS) was also used to examine the charge kinetics of the N-rGO/SPCE and bare SPCE. Figure 6b shows the Nyquist plot of the N-rGO/SPCE and bare SPCE in the 3 mM K3[Fe(CN)6]/K4[Fe(CN)6] redox solution in 0.1 M PBS (pH = 7.0). The fitted equivalent circuit is inserted in the inset of Figure 6b. The obtained data showed that the bare SPCE had a larger semi-circle with a high charge-transfer resistance (Rct) of 749.4 Ω. The N-rGO/SPCE showed a lower Rct value of 487.2 Ω with a relatively small semicircle (Figure 6b).
In addition, the EIS curves of the SPCE and N-rGO/SPCE showed a difference in the low-frequency region, which can be related to the diffusion process. From the obtained EIS data, it can be said that N-rGO/SPCE had a better electro-catalytic ability compared to the bare SPCE.
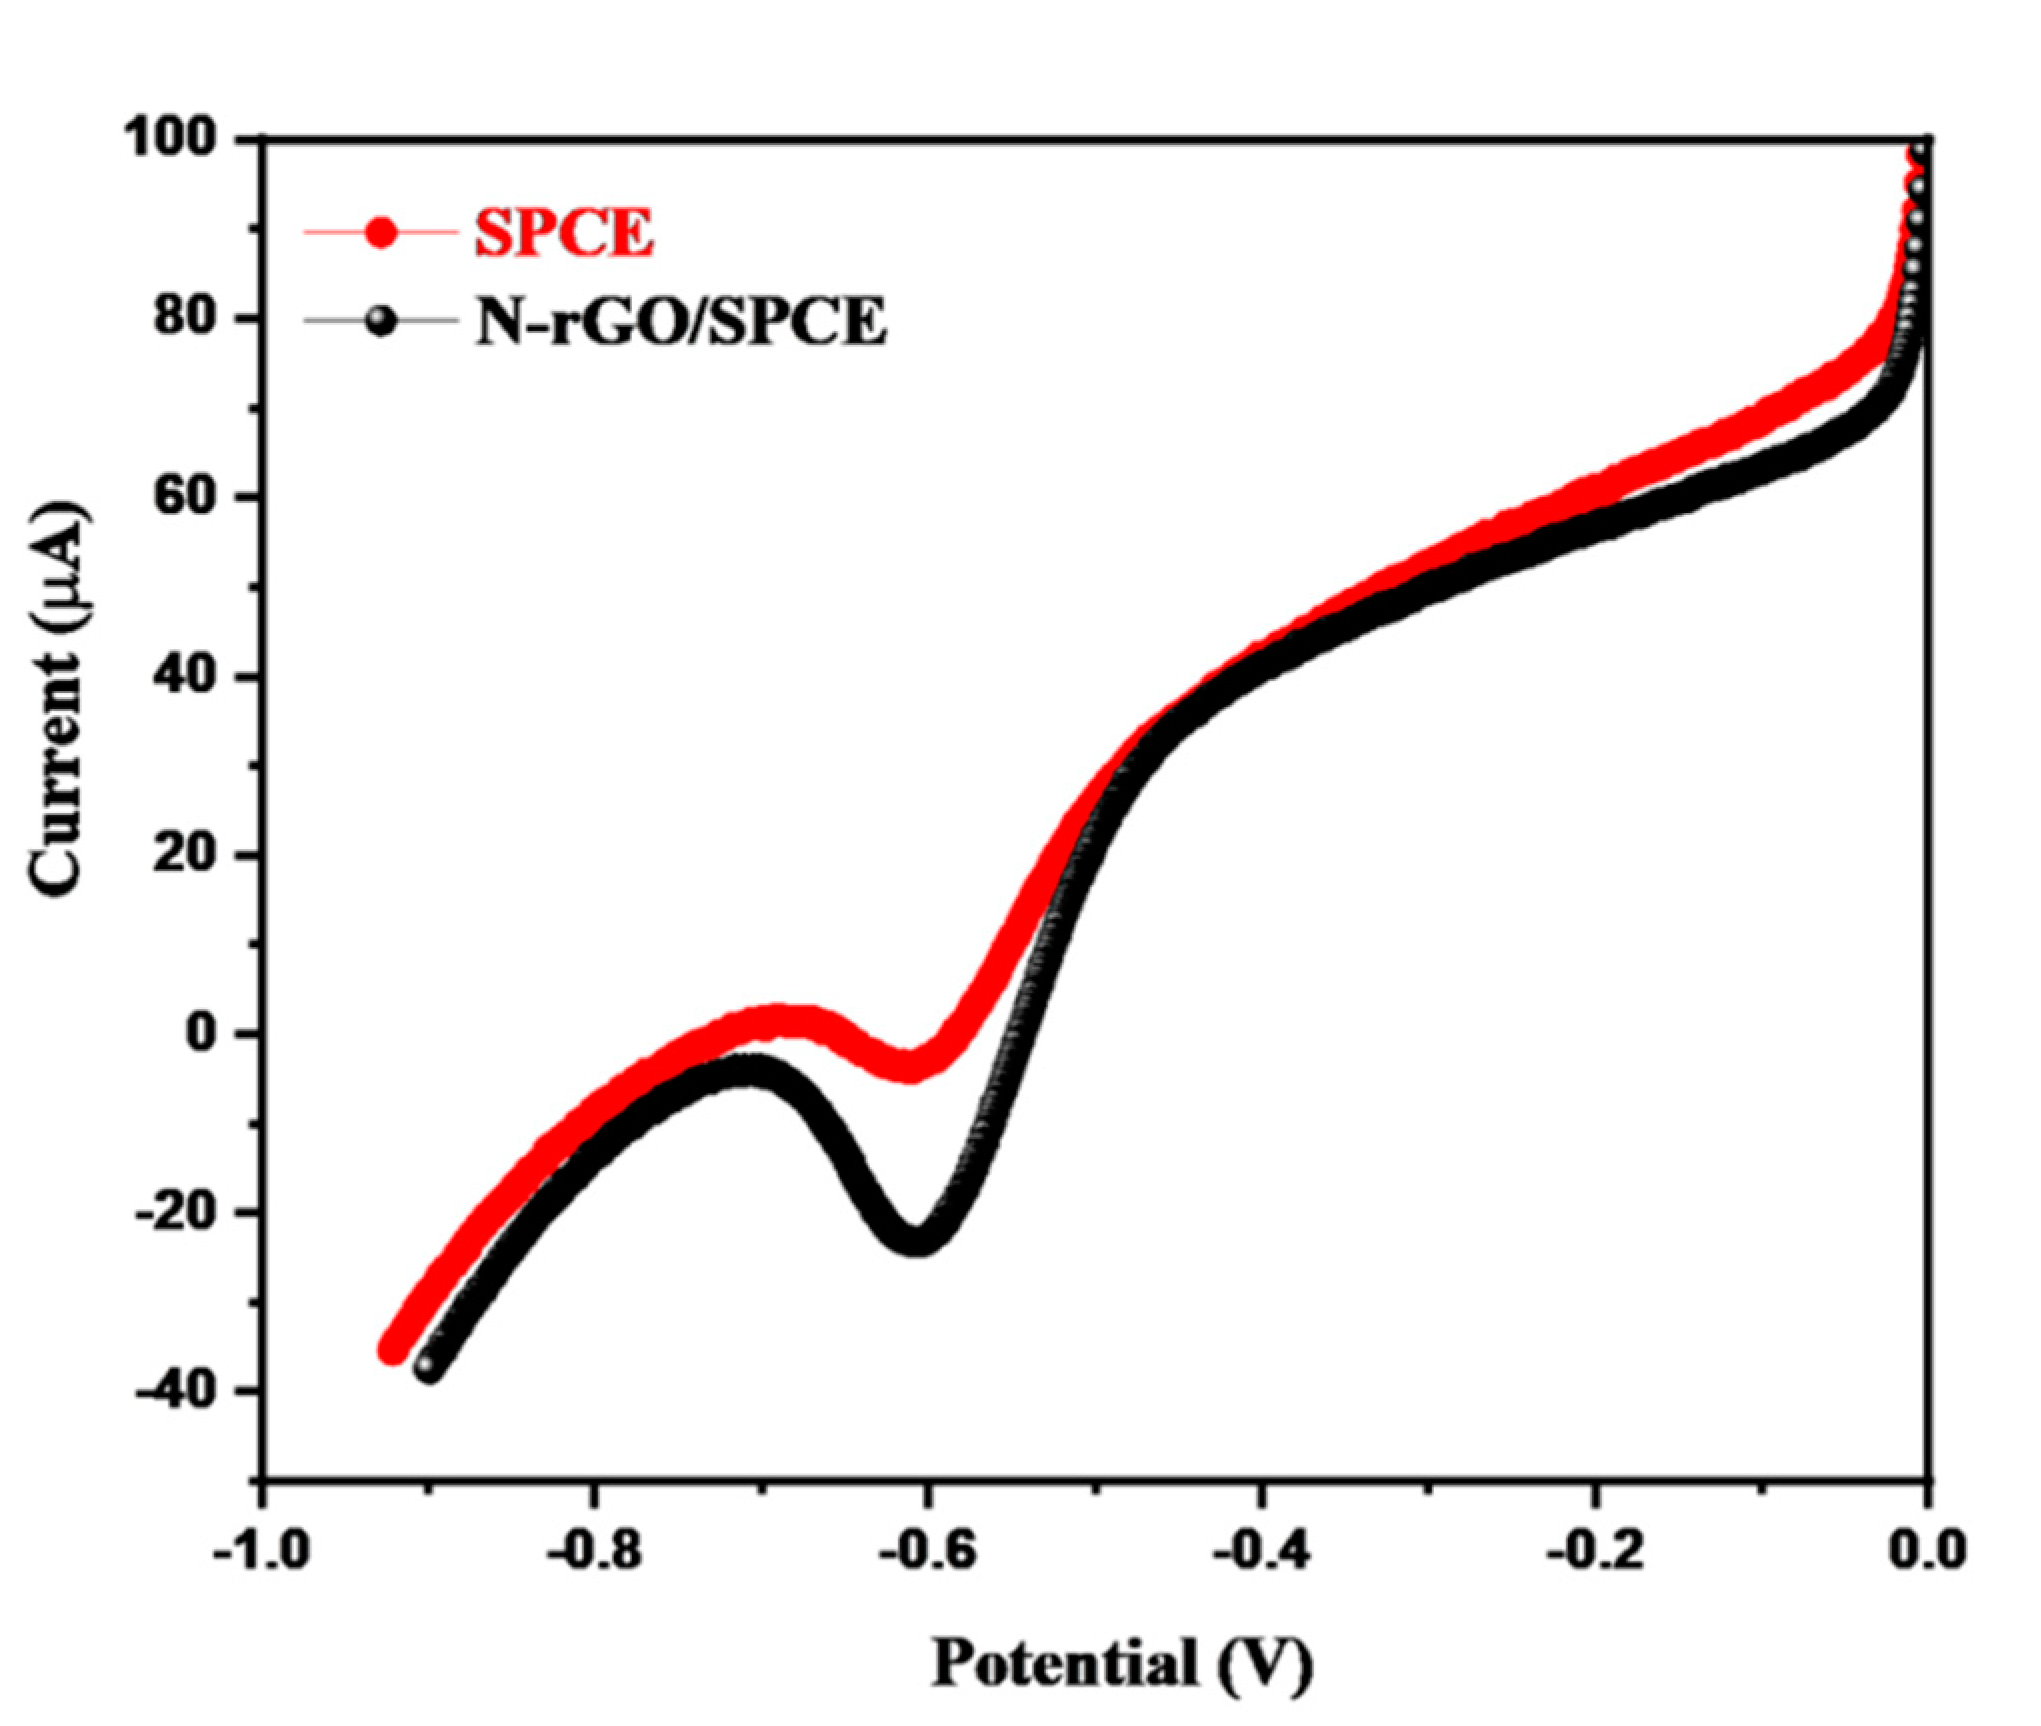
Furthermore, we investigated the electrochemical properties of the N-rGO/SPCE bare SPCE toward the detection of H2O2. Figure 7 shows the CV curves of the N-rGO/SPCE and bare SPCE in the presence of 0.01 mM H2O2 in 0.1 M PBS (pH 7.0, scan rate = 50 mVs−1). A poor current response was observed for the bare SPCE whereas an interesting and enhanced current response was obtained for N-rGO/SPCE toward the reduction of H2O2. This enhanced current response for the reduction of H2O2 was attributed to the excellent electro-catalytic features of N-rGO.
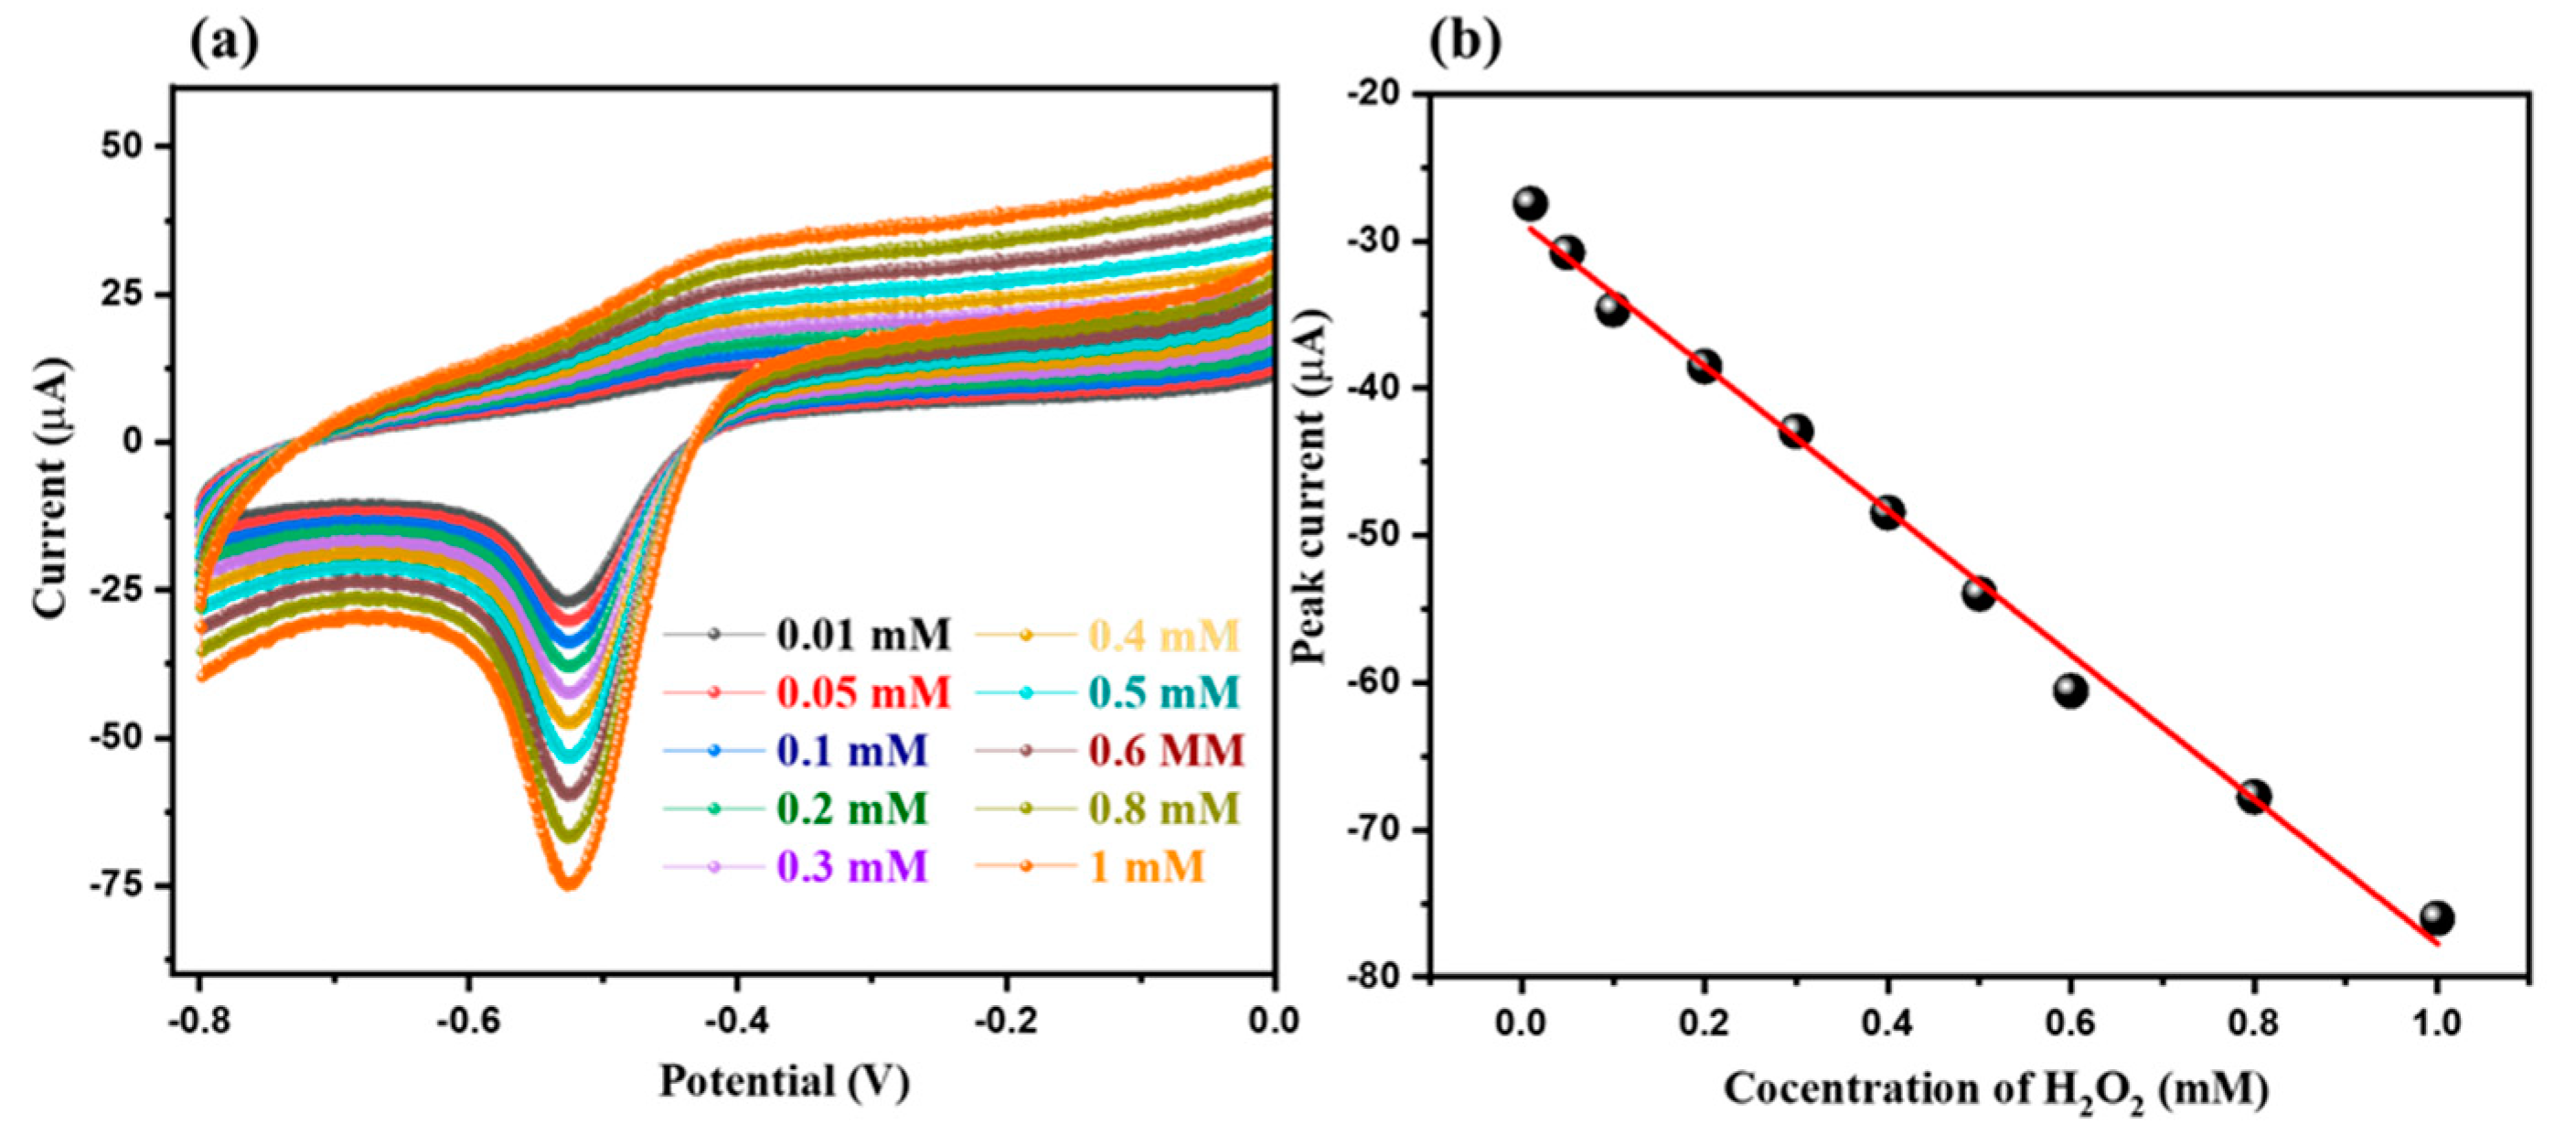
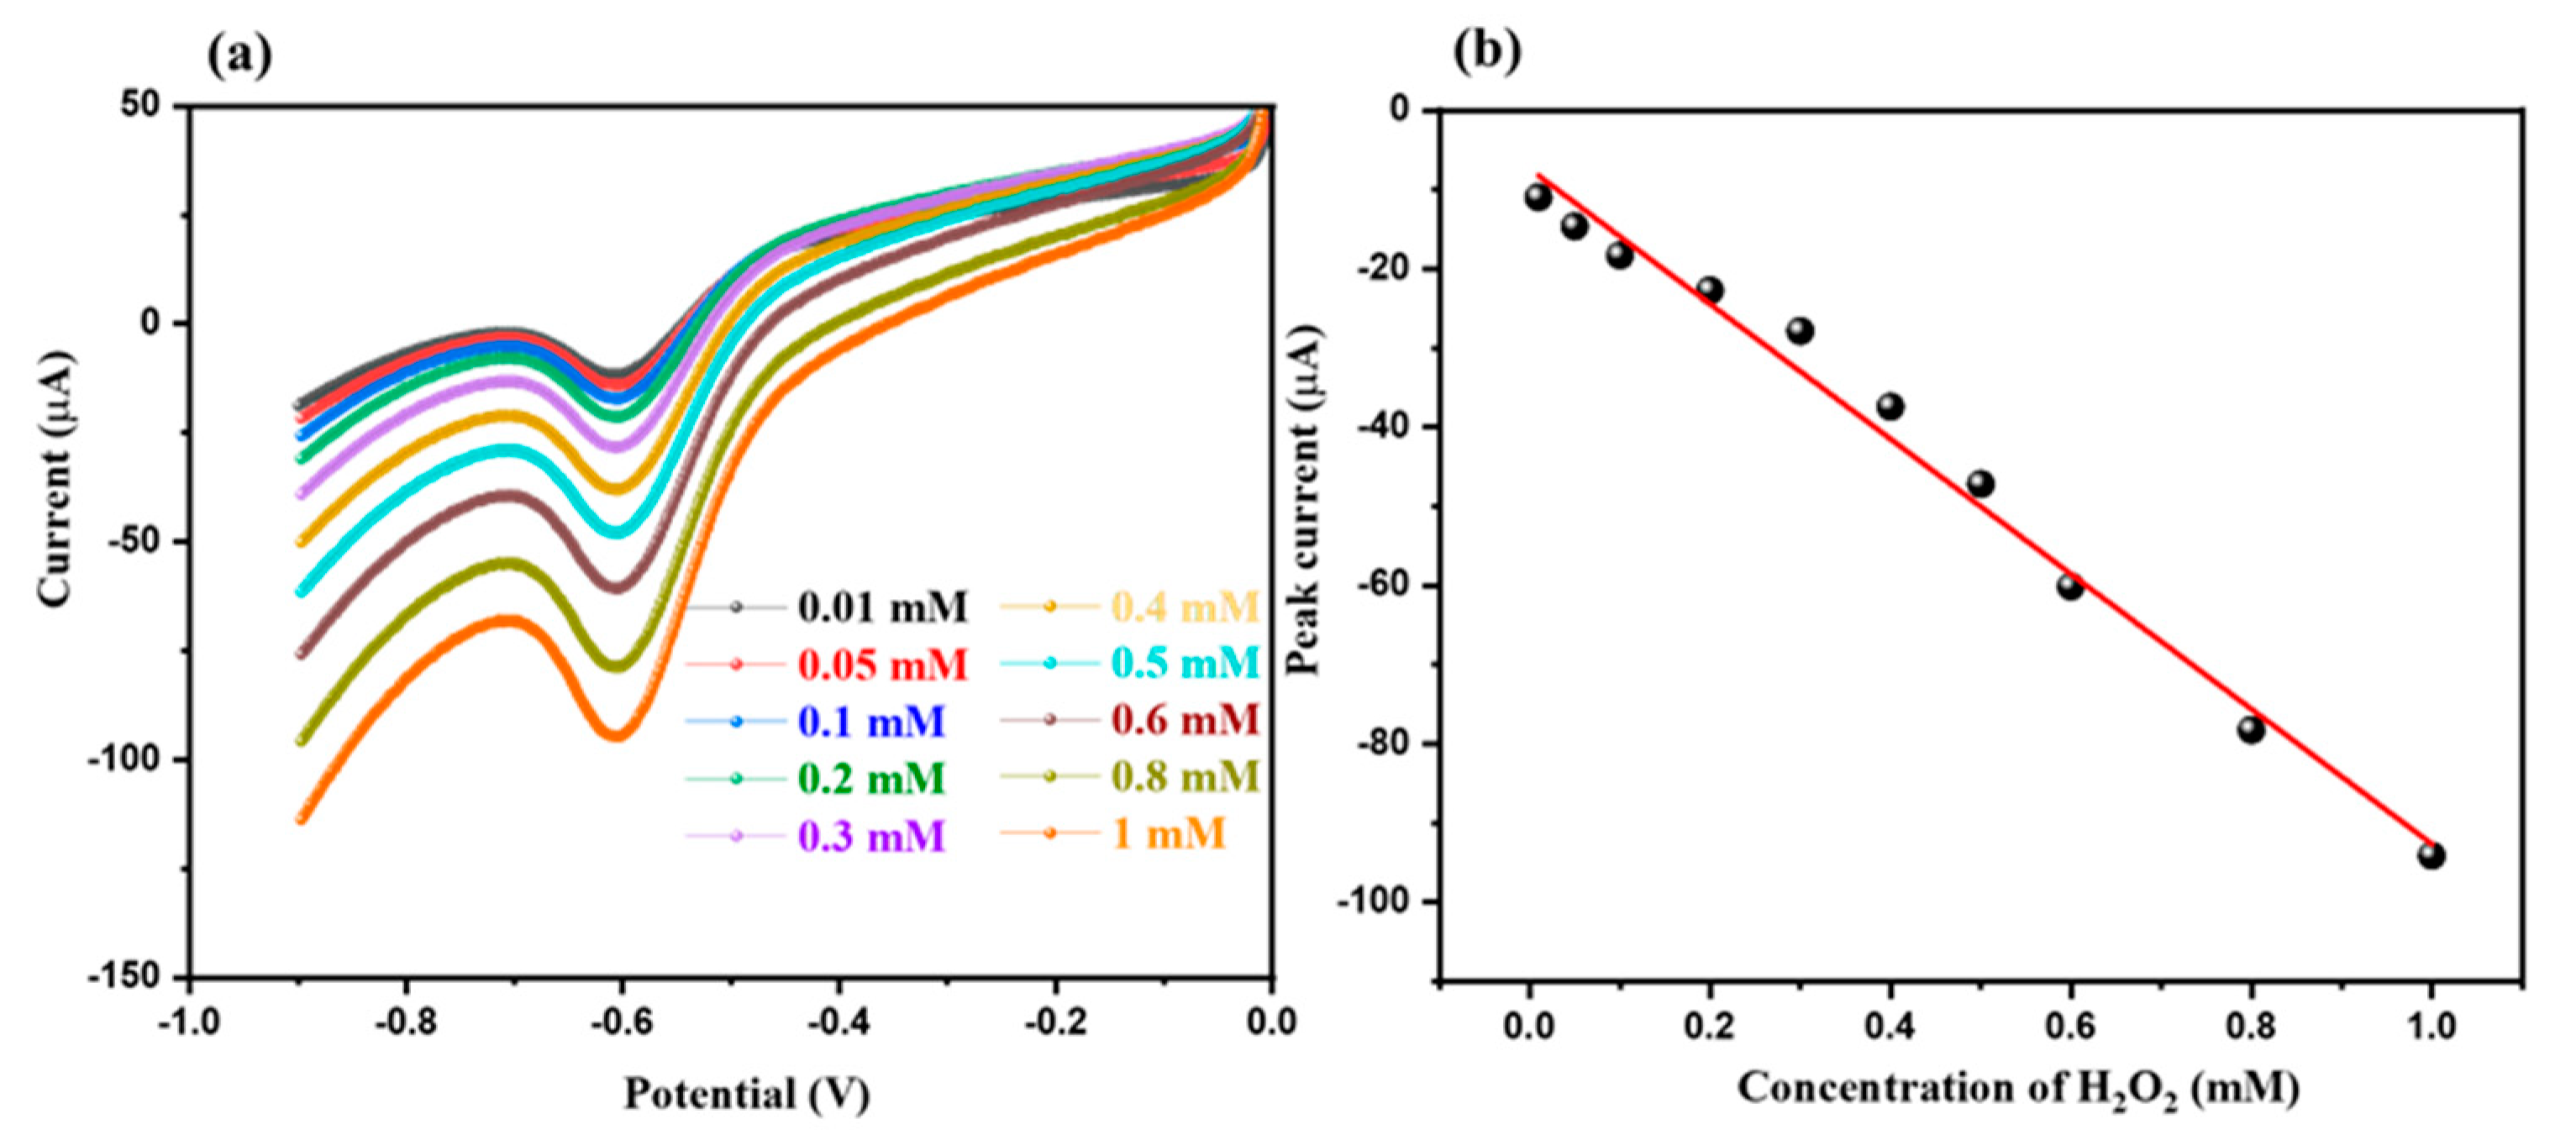
The effect of leading amount of N-rGO was also optimized and the obtained results are presented in Figure S1. The observations revealed that the highest current response was obtained for 7.5 µL N-rGO loaded SPCE (Figure S1). The pH of the solution may also influence the electrochemical performance of the N-RGO/SPCE. Hence, we recorded the CV graphs of the N-rGO/SPCE in the presence of 0.01 mM H2O2 in 0.1 M PBS with different pH (3.0, 5.0, 7.0, 9.0, and 11.0) at a scan rate of 50 mVs−1. The obtained results are depicted in Figure S2. Figure S2 revealed that N-rGO/SPCE had higher electro-catalytic properties in a PBS of pH 7.0. Thus, we used PBS of pH 7.0 for further electrochemical investigations. The influence of the various concentrations of H2O2 on the electrochemical performance of N-rGO/SPCE was also studied using CV. We obtained different CV curves of N-rGO/SPCE in the presence of different concentrations of H2O2 of 0.01 mM to 1 mM at the applied scan rate of 50 mVs−1. The recorded CV curves of N-rGO/SPCE in different concentrations of H2O2 are summarized in Figure 8a. The observations clearly showed that the reduction peak current responses increased with an increasing concentration of H2O2. This enhanced current response was found to be linear, as suggested by the calibration plot between the current response versus concentration of H2O2 (Figure 8b). The CV curves of the bare SPCE were also recorded in the presence of various concentrations (0.01 mM to 1 mM) of H2O2 at a scan rate of 50 mVs−1. The current response increased with the increasing concentration of H2O2 (Figure S3a), but the obtained current response was lower than that of N-rGO/SPCE. The calibration plot is presented in Figure S3b.
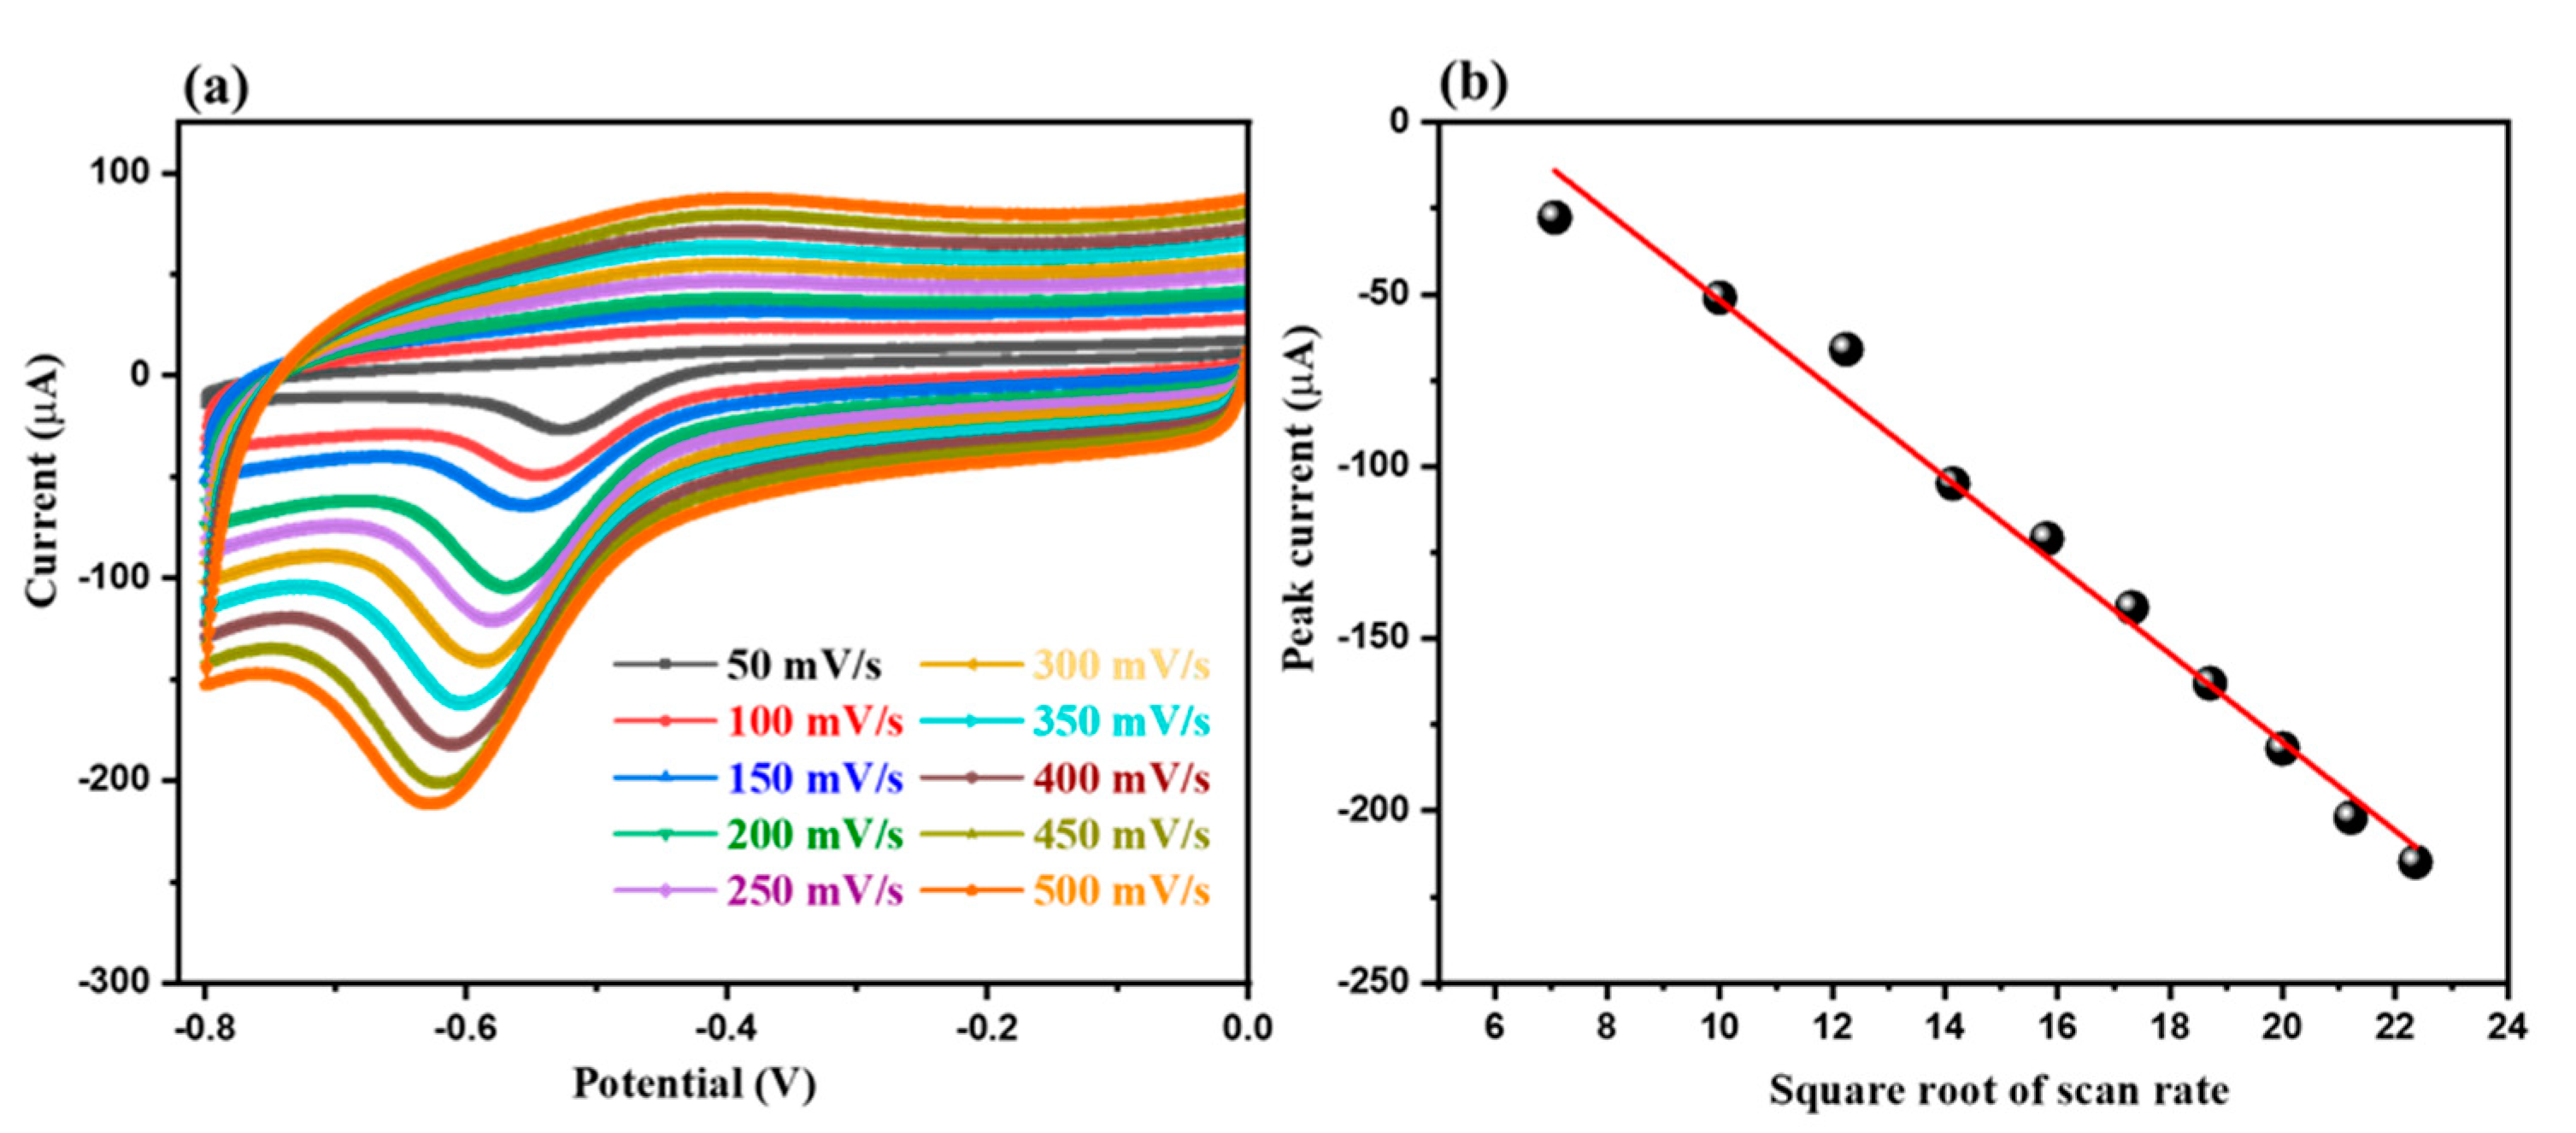
Furthermore, we also investigated the impact of different scan rates on the electro-catalytic properties of the N-rGO/SPCE toward the reduction of H2O2. Figure 9a shows the obtained CV curves of the N-rGO/SPCE in the presence of 0.01 mM at different applied scan rates of 50–500 mVs−1. We observed that the reduction peak current response for the reduction of H2O2 increased with an increasing scan rate of 50–500 mVs−1. We calibrated the reduction peak current responses with respect to the square root of the scan rate, and the calibration curve is depicted in Figure 9b. This calibration curve suggests that the reduction in peak current response linearly increases (Figure 9b). We also recorded the CV graphs of the bare SPCE in the presence of 0.01 mM H2O2 in 0.1 M PBS of pH 7.0 at different applied scan rates (50–500 mVs−1). The obtained CV results are presented in Figure S4a. The observations revealed that the current response increased with the increasing scan rate but the obtained current response was found to be less when compared to that of the N-rGO/SPCE. Moreover, the obtained current response was found to be nonlinear (Figure S4b).
In the past few years, the linear sweep voltammetry (LSV) method has been extensively used for the determination of various toxic, hazardous, or biomolecules. Thus, we also further adopted the LSV technique to detect the H2O2. Figure 10 shows the LSV curves of the N-rGO/SPCE and bare SPCE in the presence of 0.01 mM H2O2 in 0.1 M PBS (pH 7.0, scan rate = 50 mVs−1). The LSV results showed that the bare SPCE has poor electro-catalytic activity compared to the N-rGO/SPCE for the reduction of H2O2 (Figure 10). This improvement in the reduction peak current response for the reduction of H2O2 was attributed to the presence of the excellent electro-catalytic properties in N-rGO.
Similar to the CV results, we also studied the influence of various concentrations of H2O2 on the electrochemical performance of the fabricated N-rGO/SPCE using the LSV method. The recorded LSV curves of the N-rGO/SPCE in the presence of various concentrations of H2O2 (0.01 mM to 1 mM) at the applied scan rate of 50 mVs−1 are displayed in Figure 11a. This study showed that the reduction peak current response increased with an increasing concentration of H2O2. The calibration plot between the reduction peak current responses versus concentrations of H2O2 is plotted in Figure 11b, which shows that the current response linearly increased. Figure 11b shows the acceptable linear-regression value of −83.583x − 7.7861 and the correlation-coefficient (R2) value of 0.979.
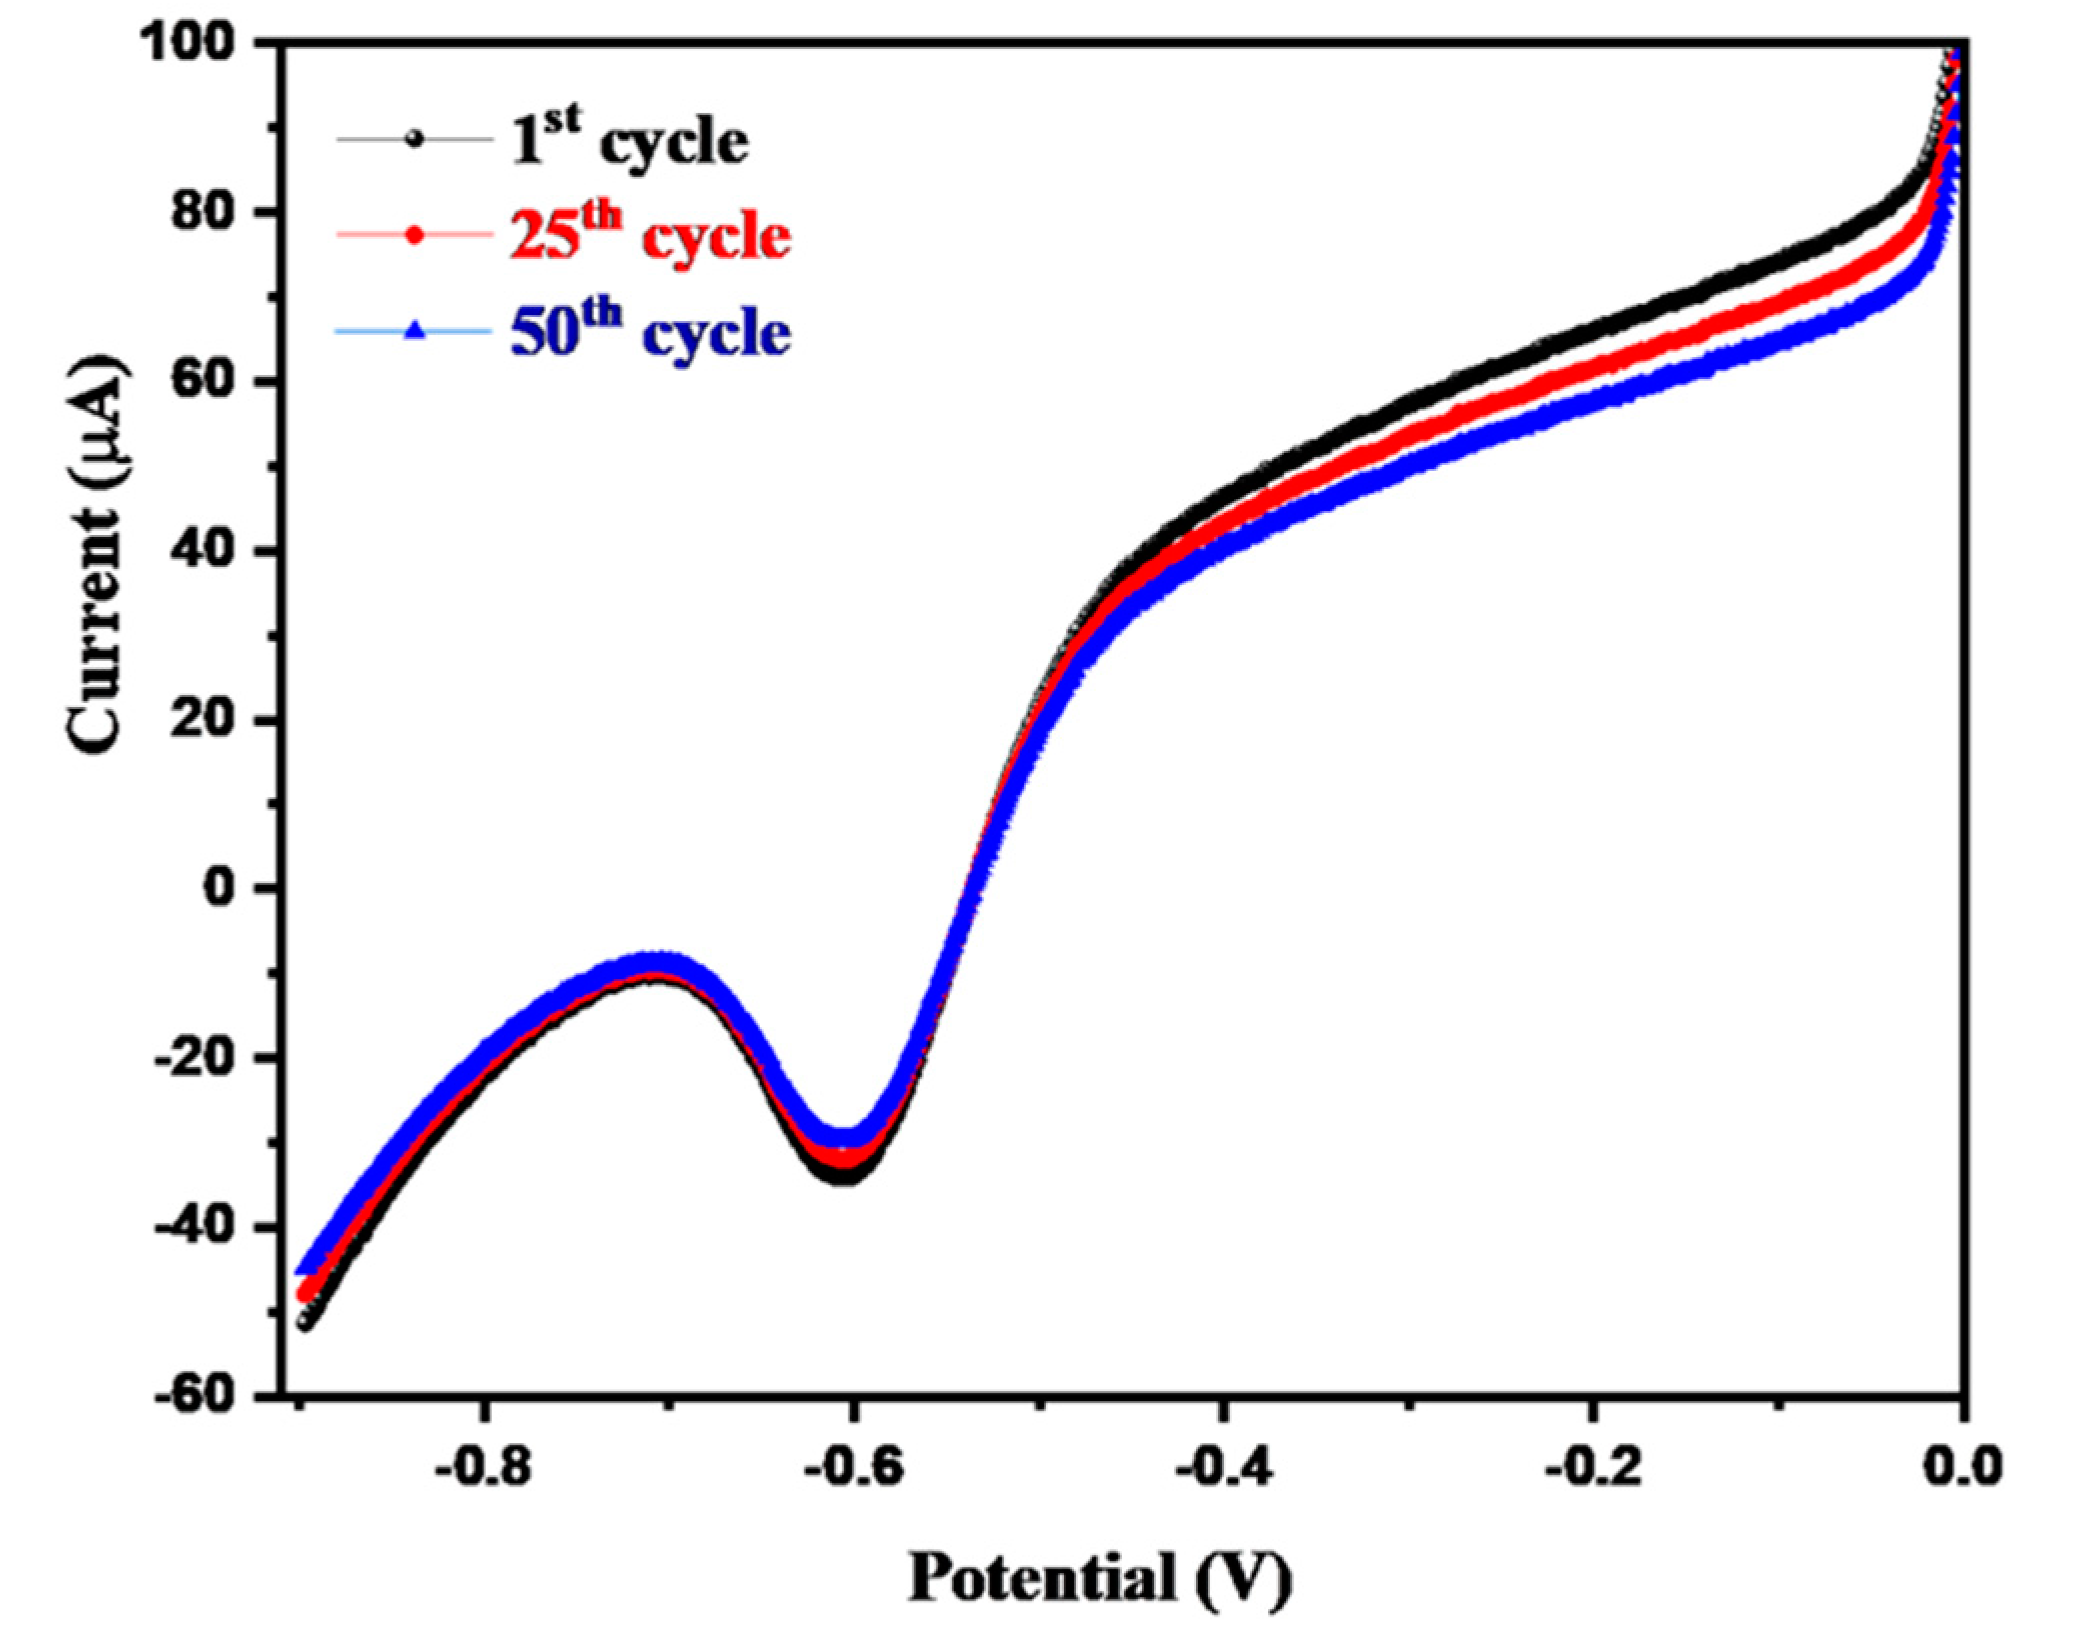
Furthermore, we also recorded 50 consecutive LSV curves of N-rGO/SPCE in the presence of 0.05 mM H2O2 at the applied scan rate of 50 mVs−1. The 1st, 25th, and 50th LSV curves of the N-rGO/SPCE are presented in Figure 12.
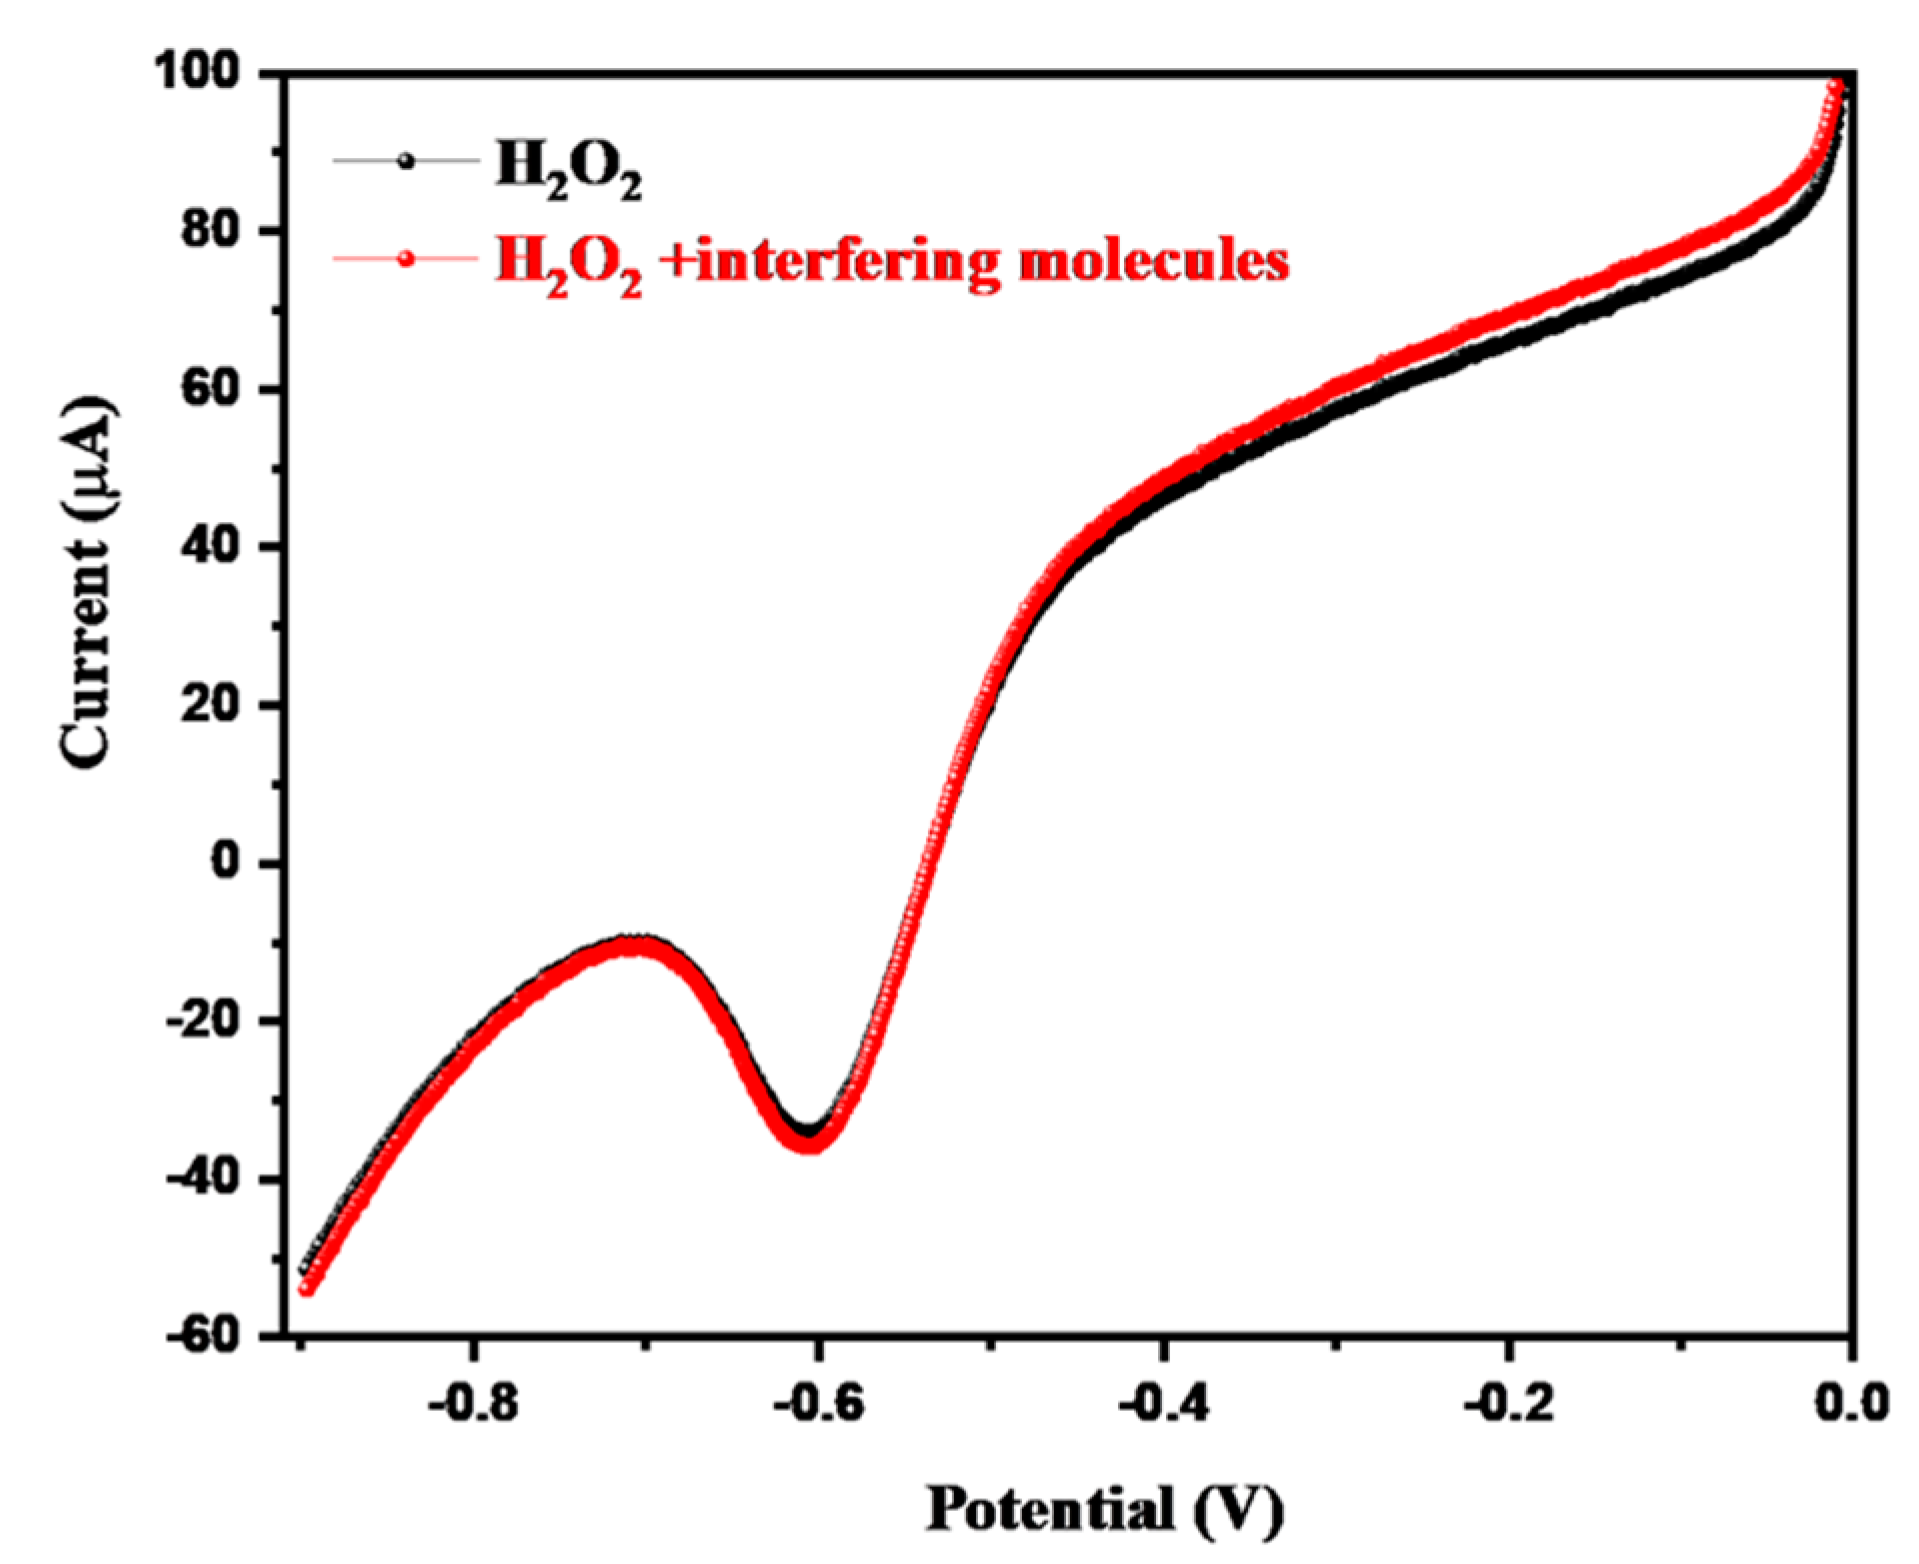
The obtained LSV curves showed an insignificant variation in the reduction peak current response up to the 50th cycle. This suggested excellent cyclic stability and repeatability up to 50 cycles. The selectivity of the electrochemical sensors is the most important feature for practical purposes. In this connection, we investigated the selectivity of the fabricated N-rGO/SPCE in the absence and presence of various interfering molecules (glucose, chlorophenol, hydrazine, uric acid, urea, dopamine, ascorbic acid, and nitrophenol) in 0.05 mM H2O2 (conditions: 0.1 M PBS, pH = 7.0, scan rate = 50 mVs−1) using the LSV method. Figure 13 shows the LSV curves of N-rGO/SPCE in the absence (black) and presence (red) of various interfering molecules (glucose, chlorophenol, hydrazine, uric acid, urea, dopamine, ascorbic acid, and nitrophenol) in 0.05 mM H2O2. An insignificant change was observed in the presence of various interfering molecules, which suggested the excellent selective nature of the N-rGO/SPCE toward the sensing of H2O2. We also checked the selectivity test using bare SPCE under similar conditions and the obtained results are presented in Figure S5. The observations showed that bare SPCE is not suitable for the selective detection of H2O2 (Figure S5). During the detection process, H2O2 reduces and releases H2O and O2. The probable mechanism for the reduction of H2O2 is illustrated in Scheme 1 [22].
Furthermore, we also employed chronoamperometry to detect H2O2 using N-rGO/SPCE. The obtained results are presented in Figure S6a. The obtained results showed that the amperometric signal (in terms of current response) increased with each spike of H2O2 (Figure S6a). This increased current response was found to be linear, as confirmed by the calibration plot between the current response and the concentration of H2O2 (Figure S6b). Figure S6b shows the acceptable linear-regression value of −0.0894x + 0.18 and correlation-coefficient (R2) value of 0.998.
The selectivity test was also carried out using chronoamperometry. Figure S7 shows that the current response increased with the addition of H2O2, but the addition of interfering molecules did not affect the performance of the N-rGO/SPCE. Therefore, it can be understood that N-rGO/SPCE has good selectivity toward the detection of H2O2.
The electrochemical performance of the fabricated sensors can be evaluated in terms of the sensitivity and limit of detection (LOD). In this regard, we calculated the LOD and sensitivity of the N-rGO/SPCE for the sensing of H2O2 using Equations (1) and (2), which are given below [22]:
LOD = 3.3 (σ/S)
Sensitivity = S/area of the working electrode
(In Equation (1), σ = standard-error whereas and S = slope).
The calculated sensitivity and LOD of the N-rGO/SPCE toward the sensing of H2O2 using the CV and LSV methods are presented in Table 1. The obtained results are comparable with previous reports as listed in Table 1 [49,50,51,52,53,54,55,56,57,58,59,60,61,62].
In previous years, various electrode materials have been explored for the construction of H2O2 sensors. In this connection, Zhao et al. [49] fabricated a graphene/silver (Ag) electrode and reported a LOD of 2.8 µM. Du et al. [50] reported platinum (Pt)/polyaniline (PANI)/rGO as a H2O2 sensor that exhibited a LOD of 1.1 µM. In 2021, Promsuwan et al. [51] developed a H2O2 sensor using a palladium (Pd)/PANI/carbon microsphere (CMF) electrode that showed an excellent LOD of 0.70 µM. Yin et al. [52] used a copper gallate spinel (CuGa2O4) modified GCE as a H2O2 sensor and obtained a LOD of 5 µM. Bohlooli et al. [53] developed a manganese oxide (MnOx)/carbon nanowall based non-enzymatic H2O2 sensor whereas Xiao et al. [54] developed a H2O2 sensor and reported on MnO2-carbon nanofibers (CNF)/GCE as the H2O2 sensor. In other work, copper bismuth oxide was prepared on a fluorine doped tin oxide (FTO) substrate and used as a H2O2 sensor, which exhibited a LOD of 380 µM [55]. A hybrid composite of molybdenum disulfide (MoS2) and rGO was also explored for H2O2 sensing applications by Yang et al. [56]. AuNP-Prussian blue (PB)-graphene oxide (GO) was used as a H2O2 sensor by Liu et al. [57] while CuNP-rGO was applied as a H2O2 sensor by Nia et al. [58]. Mutyala et al. [58] prepared electrochemically reduced graphene oxide (ERGO) using the electrodeposition approach and fabricated a H2O2 sensor that showed a LOD of 0.7 µM. Woo et al. [60] and Liu et al. [61] also reported a H2O2 sensor using graphene/MWCNT and Ag/rGO as the electrode modifier, respectively. Karimi et al. [62] reported the facile synthesis of a rGO/iron oxide (Fe2O3) composite for the construction of H2O2 sensor. Our obtained results are comparable with previous reports in terms of the LOD (Table 1).
4. Conclusions
Finally, it can be summarized that N-rGO was prepared using the hydrothermal method. The formation of N-rGO was authenticated by the XRD method whereas the phase purity of the N-rGO was checked by the XPS technique. The presence of N in the N-rGO sample was confirmed by the EDX and XPS techniques. Furthermore, a screen printed carbon electrode (SPCE) was fabricated using N-rGO as the electrode modifier. This fabricated N-rGO/SPCE was applied as the working electrode for the sensing of H2O2. The obtained electrochemical results for N-rGO/SPCE exhibited an excellent detection limit and decent sensitivity. N-rGO/SPCE also showed good cyclic stability, repeatability, and selectivity for the detection of H2O2. We hope that N-rGO/SPCE can be explored for practical applications because of its low cost, stability, selectivity, and high performance.
Supplementary Materials
The following supporting information can be downloaded at: https://www.mdpi.com/article/10.3390/nano12142443/s1, Figure S1: Effect of loading amount of N-rGO on SPCE surface in presence of 0.01 mM H2O2 in 0.1 M PBS of pH 7.0 at scan rate of 50 mVs−1. Figure S2: CV curves of the N-rGO/SPCE in presence of 0.01 mM H2O2 in 0.1 M PBS of different pH (3,5,7,9, and 11) at scan rate of 50 mVs−1. Figure S3: CV curves (a) of SPCE in presence of different concentration of H2O2 (0.01, 0.05, 0.1, 0.2, 0.3, 0.4, 0.5, 0.6, 0.8, and 1.0 mM) in 0.1 M PBS of pH 7.0 at scan rate of 50 mVs−1 and corresponding linear calibration plot (b) between peak current response versus concentration of H2O2. Figure S4: CV curves (a) of SPCE in presence 0.01 mM H2O2 in 0.1 M PBS of pH 7.0 at different applied scan rates (50-500 mVs−1) and corresponding linear calibration plot (b) between peak current response versus square root of scan rate. Figure S5: LSV curves of SPCE in absence (black) and presence (red) of interfering molecules (glucose, chlorophenol, hydrazine, uric acid, urea, dopamine, ascorbic acid, and nitro-phenol) in 0.05 mM H2O2 in 0.1 M PBS of pH 7.0 at scan rate of 50 mVs−1. Figure S6: Chronoamperometry curve (a) of N-rGO/SPCE in presence of different concentration of H2O2. Calibration curve (b) between current response versus concentration of H2O2. Figure S7: Selectivity test of N-rGO/SPCE towards H2O2 determination in presence of various interfering molecules.
Author Contributions
Conceptualization, methodology, writing—original draft preparation, formal analysis, investigation, data curation, K.A.; Conceptualization, methodology, validation, resources, writing—review and editing, supervision, project administration, funding acquisition, H.K. All authors have read and agreed to the published version of the manuscript.
Funding
This work was supported by the National Research Foundation of Korea (NRF) grant funded by the Korea government (MSIT) (No. 2019R1A5A8080290).
Data Availability Statement
Not applicable.
Acknowledgments
This study was supported by the Korea Innovation Foundation (INNOPOLIS) [grant number 2020-DD-UP-0278], the National Research Foundation of Korea (NRF) grant funded by the Korean government (MSIT) NRF-2022R1A2C1005585), and (No. 2019R1A5A8080290), Korea.
Conflicts of Interest
The authors declare no conflict of interest.
References
- Borah, N.; Boruah, P.K.; Kalita, A.J.; Guha, A.K.; Das, M.R.; Tamuly, C. A novel method for the rapid sensing of H2O2 using a colorimetric AuNP probe and its DFT study. Anal. Methods 2021, 13, 2055–2065. [Google Scholar] [CrossRef] [PubMed]
- Ahmad, K.; Mobin, S.M. Synthesis of MgO microstructures for Congo red dye adsorption and peroxide sensing applications. J Environ. Chem. Eng. 2019, 7, 103347. [Google Scholar] [CrossRef]
- Singh, P.; Shukla, S.K. A structurally aligned nickel oxide encapsulated polypyrrole nanocomposite for hydrogen peroxide sensing. Dalton Trans. 2020, 49, 8744–8754. [Google Scholar] [CrossRef] [PubMed]
- Hu, Y.; Hojamberdiev, M.; Geng, D. Recent advances in enzyme-free electrochemical hydrogen peroxide sensors based on carbon hybrid nanocomposites. J. Mater. Chem. C 2021, 9, 6970–6990. [Google Scholar] [CrossRef]
- Ahmad, K.; Kim, H. Design and preparation of g-C3N4/rGO modified screen printed electrode for hydrogen peroxide sensing application. Synth. Met. 2022, 286, 117047. [Google Scholar] [CrossRef]
- Szatrowski, T.P.; Nathan, C.F. Production of Large Amounts of Hydrogen Peroxide by Human Tumor Cells. Cancer Res. 1991, 51, 794–798. [Google Scholar]
- Yorek, M.A. The Role of Oxidative Stress in Diabetic Vascular and Neural Disease. Free Radic. Res. 2003, 37, 471–480. [Google Scholar] [CrossRef]
- Jenner, P.; Dexter, D.T.; Sian, J.; Schapira, A.H.V.; Marsden, C.D. Oxidative stress as a cause of nigral cell death in Parkinson's disease and incidental Lewy body disease. Ann. Neurol. 1992, 32, S82–S87. [Google Scholar] [CrossRef]
- Liu, H.; Ding, Y.; Yang, B.; Liu, Z.; Liu, Q.; Zhang, Z. Colorimetric and ultrasensitive detection of H2O2 based on Au/Co3O4-CeOx nanocomposites with enhanced peroxidase-like performance. Sens. Actuators B 2018, 271, 336–345. [Google Scholar] [CrossRef]
- Tiwari, J.N.; Vij, V.; Kemp, K.C.; Kim, K.S. Engineered Carbon-Nanomaterial-Based Electrochemical Sensors for Biomolecules. ACS Nano 2016, 10, 46–80. [Google Scholar] [CrossRef] [Green Version]
- Pinkernell, U.; Effkemann, S.; Karst, U. Simultaneous HPLC Determination of Peroxyacetic Acid and Hydrogen Peroxide. Anal. Chem. 1997, 69, 3623–3627. [Google Scholar] [CrossRef] [PubMed]
- Klassen, N.V.; Marchington, D.; McGowan, H.C.E. H2O2 Determination by the I3-Method and by KMnO4 Titration. Anal. Chem. 1994, 66, 2921–2925. [Google Scholar] [CrossRef]
- Gubitz, G.; Zoonen, P.V.; Gooijer, C.; Velthorst, N.H. Immobilized fluorophores in dynamic chemiluminescence detection of hydrogen peroxide. Anal. Chem. 1985, 57, 2071–2074. [Google Scholar] [CrossRef]
- Nogueira, R.F.P.; Oliveira, M.C.; Paterlini, W.C. Simple and fast spectrophotometric determination of H2O2 in photo-Fenton reactions using metavanadate. Talanta 2005, 66, 86–91. [Google Scholar] [CrossRef]
- Oh, W.-K.; Jeong, Y.S.; Kim, S.; Jang, J. Fluorescent Polymer Nanoparticle for Selective Sensing of Intracellular Hydrogen Peroxide. ACS Nano 2012, 6, 8516–8524. [Google Scholar] [CrossRef]
- Ahmad, K.; Mohammad, A.; Mobin, S.M. Hydrothermally grown α-MnO2 nanorods as highly efficient low cost counter-electrode material for dye-sensitized solar cells and electrochemical sensing applications. Electrochim. Acta 2017, 252, 549–557. [Google Scholar] [CrossRef]
- Ahmad, K.; Kim, H. Design and fabrication of WO3/SPE for dopamine sensing application. Mater. Chem. Phys. 2022, 287, 126298. [Google Scholar] [CrossRef]
- Isailović, J.; Vidović, K.; Hočevar, S.B. Simple electrochemical sensors for highly sensitive detection of gaseous hydrogen peroxide using polyacrylic-acid-based sensing membrane. Sens. Actuators B Chem. 2022, 352, 131053. [Google Scholar] [CrossRef]
- Ahmad, K.; Kumar, P.; Mobin, S.M. Hydrothermally grown SnO2 flowers as efficient electrode modifier for simultaneous detection of catechol and hydroquinone. J. Electrochem. Soc. 2019, 166, B1577–B1584. [Google Scholar] [CrossRef]
- Liu, M.; An, M.; Xu, J.; Liu, T.; Wang, L.; Liu, Y.; Zhang, J. Three-dimensional carbon foam supported NiO nanosheets as non-enzymatic electrochemical H2O2 sensors. Appl. Surf. Sci. 2021, 542, 148699. [Google Scholar] [CrossRef]
- Ahmad, K.; Mobin, S.M. High surface area 3D-MgO flowers as the modifier for the working electrode for efficient detection of 4-chlorophenol. Nanoscale Adv. 2019, 1, 719–727. [Google Scholar] [CrossRef] [Green Version]
- Mohammad, A.; Khan, M.E.; Yoon, T.; Cho, M.H. Na,O-co-doped-graphitic-carbon nitride (Na,O-g-C3N4) for nonenzymatic electrochemical sensing of hydrogen peroxide. Appl. Surf. Sci. 2020, 525, 146353. [Google Scholar] [CrossRef]
- Ahmad, K.; Kim, H. Hydrothermally synthesized MoSe2/rGO composite as electrode modifier for the construction of non-enzymatic urea sensor. Mater. Chem. Phys. 2022, 286, 126206. [Google Scholar] [CrossRef]
- Dang, W.; Sun, Y.; Jiao, L.; Xu, H.; Lin, M. AuNPs-NH2/Cu-MOF modified glassy carbon electrode as enzyme-free electrochemical sensor detecting H2O2. J. Electroanal. Chem. 2020, 856, 113592. [Google Scholar] [CrossRef]
- Ahmad, K.; Khan, M.Q.; Khan, R.A.; Kim, H. Benign approach for the synthesis of ZnO hexagonal plates for electrochemical sensing of l-tryptophan. Mater. Chem. Phys. 2022, 287, 126297. [Google Scholar] [CrossRef]
- Ahmad, K.; Kim, H. Synthesis of MoS2/WO3 hybrid composite for hydrazine sensing applications. Mater. Sci. Semicond. Process. 2022, 148, 106803. [Google Scholar] [CrossRef]
- Karuppiah, C.; Venkatesh, K.; Arunachalam, P.; Ramaraj, S.K.; Al-Mayouf, A.M.; Yang, C.-C. Optimization of S-dopant on N, S co-doped graphene/CNT-Fe3C nanocomposite electrode for non-enzymatic H2O2 sensor. Mater. Lett. 2021, 285, 129001. [Google Scholar] [CrossRef]
- Uzunoglu, A.; Ipekci, H.H. The use of CeO2-modified Pt/C catalyst inks for the construction of high-performance enzyme-free H2O2 sensors. J. Electroanal. Chem. 2019, 848, 113302. [Google Scholar] [CrossRef]
- Patella, P.; Buscetta, M.; Vincenzo, S.D.; Ferraro, M.; Aiello, G.; Sunseri, C.; Pace, E.; Inguanta, R.; Cipollina, C. Electrochemical sensor based on rGO/Au nanoparticles for monitoring H2O2 released by human macrophages. Sens. Actuators B Chem. 2021, 327, 128901. [Google Scholar] [CrossRef]
- Jiang, L.; Zhao, Y.; Zhao, P.; Zhou, S.; Ji, Z.; Huo, D.; Zhong, D.; Hou, C. Electrochemical sensor based on reduced graphene oxide supported dumbbell-shaped CuCo2O4 for real-time monitoring of H2O2 released from cells. Microchem. J. 2021, 160, 105521. [Google Scholar] [CrossRef]
- Chen, X.; Gao, J.; Zhao, G.; Wu, C. In situ growth of FeOOH nanoparticles on physically-exfoliated graphene nanosheets as high performance H2O2 electrochemical sensor. Sens. Actuators B Chem. 2020, 313, 128038. [Google Scholar] [CrossRef]
- Li, Y.; Tang, L.; Deng, D.; Ye, J.; Wu, Z.; Wang, J. Liqiang Luo, A novel non-enzymatic H2O2 sensor using ZnMn2O4 microspheres modified glassy carbon electrode. Colloids Surf. B Biointerfaces 2019, 179, 293–298. [Google Scholar] [CrossRef] [PubMed]
- Wang, M.; Ma, J.; Guan, X.; Peng, W.; Fan, X.; Zhang, G.; Zhang, F.; Li, Y. A novel H2O2 electrochemical sensor based on NiCo2S4 functionalized reduced graphene oxide. J. Alloys Compd. 2019, 784, 827–833. [Google Scholar] [CrossRef]
- Xiao, F.; Li, H.; Yan, X.; Yan, L.; Zhang, X.; Wang, M.; Qian, C.; Wang, Y. Graphitic carbon nitride/graphene oxide(g-C3N4/GO) nanocomposites covalently linked with ferrocene containing dendrimer for ultrasensitive detection of pesticide. Anal. Chim. Acta 2020, 1103, 84–96. [Google Scholar] [CrossRef]
- Atta, N.F.; Gawad, S.A.A.; Galal, A.; Razik, A.A.; El-Gohary, A.R.M. Efficient electrochemical sensor for determination of H2O2 in human serum based on nano iron-nickel alloy/carbon nanotubes/ionic liquid crystal composite. J. Electroanal. Chem. 2021, 881, 114953. [Google Scholar] [CrossRef]
- Song, J.; Feng, S.; Zhu, C.; Lee, J.-I.; Fu, S.; Dong, P.; Song, M.-K.; Lin, Y. Tuning the structure and composition of graphite-phase polymeric carbon nitride/reduced graphene oxide composites towards enhanced lithium-sulfur batteries performance. Electrochim. Acta 2017, 248, 541–546. [Google Scholar] [CrossRef]
- Zhao, Z.; Sun, Y.; Li, P.; Zhang, W.; Lian, K.; Hu, J.; Chen, Y. Preparation and characterization of AuNPs/CNTs-ErGO electrochemical sensors for highly sensitive detection of hydrazine. Talanta 2016, 158, 283–291. [Google Scholar] [CrossRef] [Green Version]
- Zhang, W.; Huang, H.; Li, F.; Deng, K.; Wang, X. Palladium nanoparticles supported on graphitic carbon nitride-modified reduced graphene oxide as highly efficient catalysts for formic acid and methanol electrooxidation. J. Mater. Chem. A 2014, 2, 19084–19094. [Google Scholar] [CrossRef]
- Fu, Y.; Zhu, J.; Hu, C.; Wu, X.; Wang, X. Covalently coupled hybrid of graphitic carbon nitride with reduced graphene oxide as a superior performance lithium-ion battery anode. Nanoscale 2014, 6, 12555–12564. [Google Scholar] [CrossRef]
- Hang, T.; Xiao, S.; Yang, C.; Li, X.; Guo, C.; He, G.; Li, B.; Yang, C.; Chen, H.; Liu, F.; et al. Hierarchical graphene/nanorods-based H2O2 electrochemical sensor with self-cleaning and anti-biofouling properties. Sens. Actuators B Chem. 2019, 289, 15–23. [Google Scholar] [CrossRef]
- Ahmad, K.; Mohammad, A.; Mathur, P.; Mobin, S.M. Preparation of SrTiO3 perovskite decorated rGO and electrochemical detection of nitroaromatics. Electrochim. Acta 2016, 215, 435–446. [Google Scholar] [CrossRef]
- Zhang, H.; Liu, S. Electrochemical sensors based on nitrogen-doped reduced graphene oxide for the simultaneous detection of ascorbic acid, dopamine and uric acid. J. Alloys Compd. 2020, 842, 155873. [Google Scholar] [CrossRef]
- Wiench, P.; González, Z.; Menéndez, R.; Grzyb, B.; Gryglewicz, G. Beneficial impact of oxygen on the electrochemical performance of dopamine sensors based on N-doped reduced graphene oxides. Sens. Actuators B Chem. 2018, 257, 143–153. [Google Scholar] [CrossRef]
- Ahmad, K.; Kim, H. Enhanced stability of MAPbI3 based perovskite solar cells. Mater. Lett. 2022, 318, 132187. [Google Scholar] [CrossRef]
- Park, H.-Y.; Singh, K.P.; Yang, D.-S.; Yu, J.-S. Simple approach to advanced binder-free nitrogen doped graphene electrode for lithium batteries. RSC Adv. 2015, 5, 3881–3887. [Google Scholar] [CrossRef]
- Li, J.; Li, X.; Zhao, P.; Lei, D.Y.; Li, W.; Bai, J.; Ren, Z.; Xu, X. Searching for magnetism in pyrrolic N-doped graphene synthesized via hydrothermal reaction. Carbon 2015, 84, 460–468. [Google Scholar] [CrossRef]
- Ou, J.; Zhang, Y.; Chen, L.; Zhao, Q.; Meng, Y.; Guo, Y.; Xiao, D. Nitrogen-rich porous carbon derived from biomass as a high performance anode material for lithium ion batteries. J. Mater. Chem. A 2015, 3, 6534–6541. [Google Scholar] [CrossRef]
- Ariharan, A.; Viswanathan, B.; Nandhakumar, V. Heteroatom Doped Multi-Layered Graphene Material for Hydrogen Storage Application. Graphene 2016, 5, 39–50. [Google Scholar] [CrossRef] [Green Version]
- Zhao, G.; Wang, F.; Zhang, Y.; Sui, Y.; Liu, P.; Zhang, Z.; Xu, C.; Yang, C. High-performance hydrogen peroxide micro-sensors based on laser-induced fabrication of graphene@Ag electrodes. Appl. Surf. Sci. 2021, 565, 150565. [Google Scholar] [CrossRef]
- Du, X.; Chen, Y.; Dong, W.; Han, B.; Liu, M.; Chen, Q.; Zhou, J. A nanocomposite-based electrochemical sensor for non-enzymatic detection of hydrogen peroxide. Oncotarget 2017, 8, 13039–13047. [Google Scholar] [CrossRef] [Green Version]
- Promsuwan, K.; Soleh, A.; Saisahas, K.; Saichanapan, J.; Thiangchanya, A.; Phonchai, A.; Limbut, W. Micro-colloidal catalyst of palladium nanoparticles on polyaniline-coated carbon microspheres for a non-enzymatic hydrogen peroxide sensor. Microchem. J. 2021, 171, 106785. [Google Scholar] [CrossRef]
- Yin, H.; Shi, Y.; Dong, Y.P.; Chu, X.F. Synthesis of spinel-type CuGa2O4 nanoparticles as a sensitive non-enzymatic electrochemical sensor for hydrogen peroxide and glucose detection. J. Electroanal. Chem. 2021, 885, 115100. [Google Scholar] [CrossRef]
- Bohlooli, F.; Yamatogi, A.; Mori, S. Manganese oxides/carbon nanowall nanocomposite electrode as an efficient non-enzymatic electrochemical sensor for hydrogen peroxide. Sens. Bio-Sens. Res. 2021, 31, 100392. [Google Scholar] [CrossRef]
- Xiao, X.; Song, Y.; Liu, H.; Xie, M.; Hou, H.; Wang, L.; Li, Z. Electrospun carbon nanofibers with manganese dioxide nanoparticles for nonenzymatic hydrogen peroxide sensing. J. Mater. Sci. 2013, 48, 4843–4850. [Google Scholar] [CrossRef]
- Sinha, G.N.; Subramanyam, P.; Sivaramakrishna, V.; Subrahmanyam, C. Electrodeposited copper bismuth oxide as a low-cost, non-enzymatic electrochemical sensor for sensitive detection of uric acid and hydrogen peroxide. Inorg. Chem. Commun. 2021, 129, 108627. [Google Scholar] [CrossRef]
- Yang, H.; Zhou, J.; Bao, J.; Ma, Y.; Zhou, J.; Shen, C.; Luo, H.; Yang, M.; Hou, C.; Huo, D. A simple hydrothermal one-step synthesis of 3D-MoS2/rGO for the construction of sensitive enzyme-free hydrogen peroxide sensor. Microchem. J. 2021, 162, 105746. [Google Scholar] [CrossRef]
- Liu, X.; Zhang, X.; Zheng, J. One-pot fabrication of AuNPs-Prussian blue-Graphene oxide hybrid nanomaterials for non-enzymatic hydrogen peroxide electrochemical detection. Microchem. J. 2021, 160, 105595. [Google Scholar] [CrossRef]
- Nia, P.M.; Woi, P.M.; Alias, Y. Facile one-step electrochemical deposition of copper nanoparticles and reduced graphene oxide as nonenzymatic hydrogen peroxide sensor. Appl. Surf. Sci. 2017, 413, 56–65. [Google Scholar]
- Mutyala, S.; Mathiyarasu, J. A reagentless non-enzymatic hydrogen peroxide sensor presented using electrochemically reduced graphene oxide modified glassy carbon electrode. Mater. Sci. Eng. C 2016, 69, 398–406. [Google Scholar] [CrossRef]
- Woo, S.; Kim, Y.R.; Chung, T.D.; Piao, Y.; Kim, H. Synthesis of a graphene carbon nanotube composite and its electrochemical sensing of hydrogen peroxide. Electrochim. Acta 2012, 59, 509–523. [Google Scholar] [CrossRef]
- Liu, S.; Tian, J.Q.; Wang, L.; Zhang, Y.W.; Sun, X.P. Stable aqueous dispersion of graphene nanosheets: Noncovalent functionalization by a polymeric reducing agent and their subsequent decoration with Ag nanoparticles for enzymeless hydrogen peroxide detection. Macromolecules 2010, 43, 10078–10083. [Google Scholar] [CrossRef]
- Karimi, M.A.; Banifatemeh, F.; Mehrjardi, A.H.; Tavallali, H.; Eshaghia, Z.; Rad, G.D. A novel rapid synthesis of Fe2O3/graphene nanocomposite using ferrate(VI) and its application as a new kind of nanocomposite modified electrode as electrochemical sensor. Mater. Res. Bull. 2015, 70, 856–864. [Google Scholar] [CrossRef]
Scheme 1.
The schematic illustration for the fabrication of N-rGO/SPCE for the H2O2 sensor.

Figure 1.
The XRD pattern of GO and N-rGO.

Figure 2.
The SEM image of the GO (a) and N-rGO (b,c). The TEM image of N-rGO (d).

Figure 3.
The Raman spectra of GO and N-rGO.

Figure 4.
The EDX spectrum (a), EDX mapping images (b–d), and elemental composition (e) of N-rGO.

Figure 5.
The XPS survey scan (a), C1s (b), N1s (c), and O1s (d) scan of N-rGO.

Figure 6.
CV (a) and Nyquist (b) curves of SPCE (red) and N-rGO/SPCE (black) in the 3.0 mM K3 [Fe(CN)6] and K4[Fe(CN)6] redox solution in 0.1 M KCl. Inset of (b) shows the fitted equivalent circuit.
Figure 6.
CV (a) and Nyquist (b) curves of SPCE (red) and N-rGO/SPCE (black) in the 3.0 mM K3 [Fe(CN)6] and K4[Fe(CN)6] redox solution in 0.1 M KCl. Inset of (b) shows the fitted equivalent circuit.

Figure 7.
The CV curves of SPCE (red) and N-rGO/SPCE (black) in the presence of 0.01 mM H2O2 in 0.1 M PBS of pH 7.0 at a scan rate of 50 mVs−1.
Figure 7.
The CV curves of SPCE (red) and N-rGO/SPCE (black) in the presence of 0.01 mM H2O2 in 0.1 M PBS of pH 7.0 at a scan rate of 50 mVs−1.
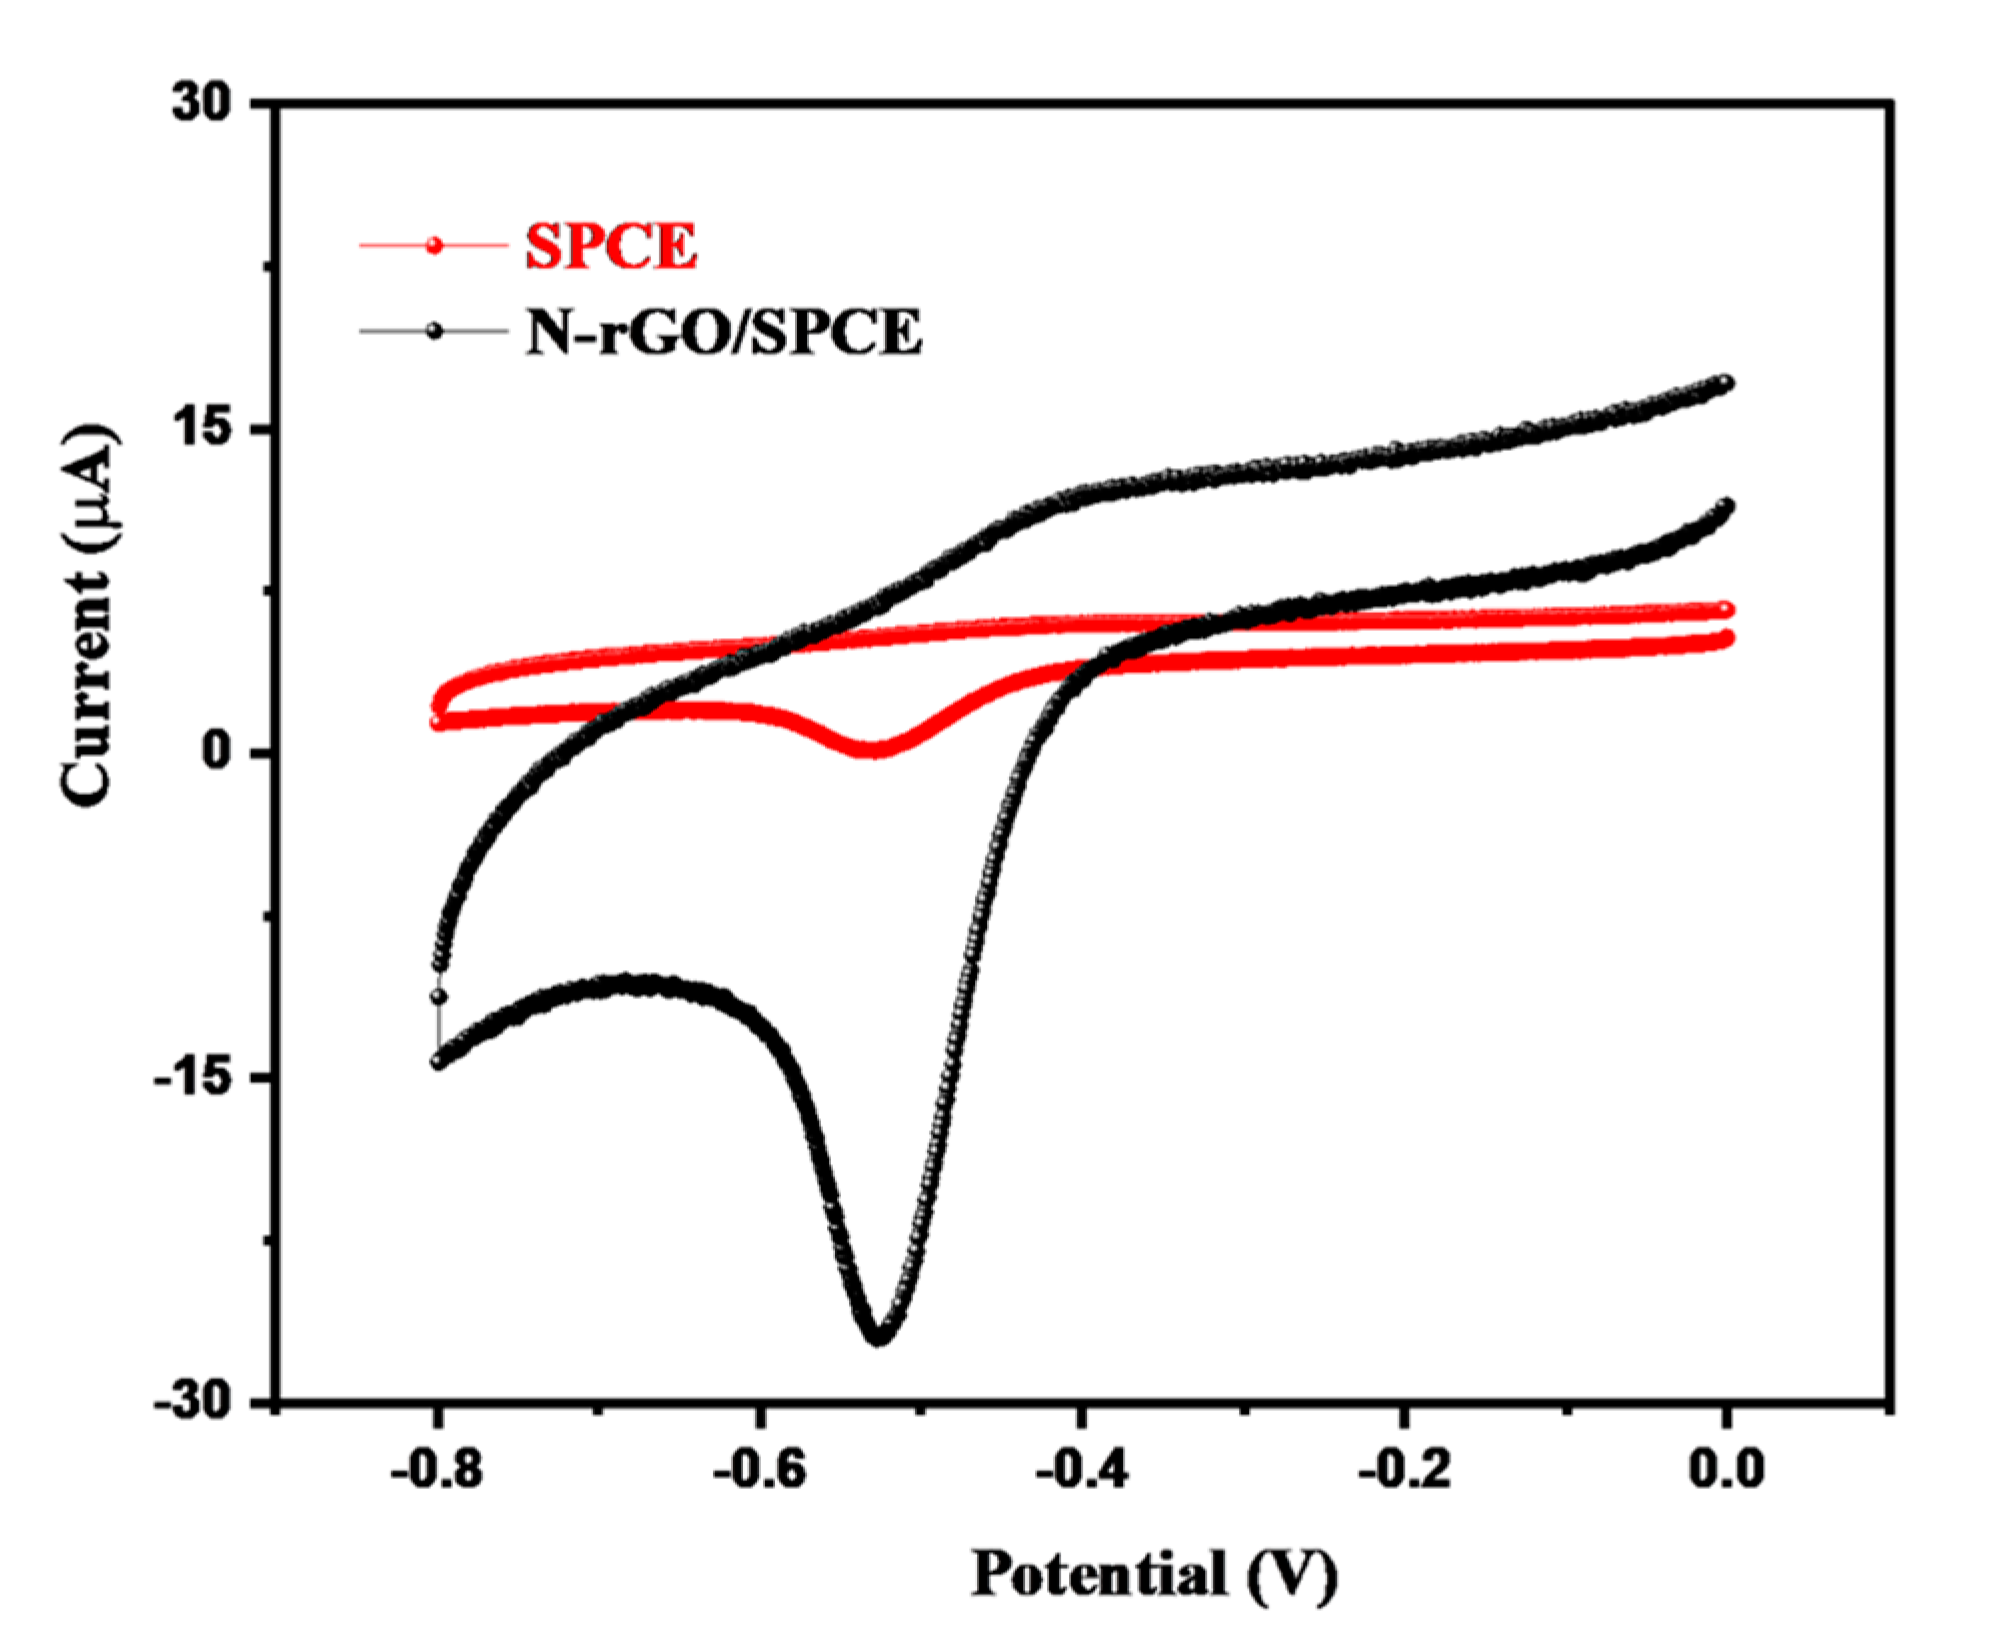
Figure 8.
The CV curves (a) of N-rGO/SPCE in the presence of different concentrations of H2O2 (0.01, 0.05, 0.1, 0.2, 0.3, 0.4, 0.5, 0.6, 0.8, and 1.0 mM) in 0.1 M PBS of pH 7.0 at a scan rate of 50 mVs−1 and the corresponding linear calibration plot (b) between the peak current response versus the concentration of H2O2.

Figure 9.
The CV curves (a) of N-rGO/SPCE in the presence 0.01 mM H2O2 in 0.1 M PBS of pH 7.0 at different applied scan rates (50–500 mVs−1) and the corresponding linear calibration plot (b) between the peak current response versus the square root of the scan rate.
Figure 9.
The CV curves (a) of N-rGO/SPCE in the presence 0.01 mM H2O2 in 0.1 M PBS of pH 7.0 at different applied scan rates (50–500 mVs−1) and the corresponding linear calibration plot (b) between the peak current response versus the square root of the scan rate.

Figure 10.
The LSV curves of SPCE (red) and N-rGO/SPCE (black) in the presence of 0.01 mM H2O2 in 0.1 M PBS of pH 7.0 at a scan rate of 50 mVs−1.
Figure 10.
The LSV curves of SPCE (red) and N-rGO/SPCE (black) in the presence of 0.01 mM H2O2 in 0.1 M PBS of pH 7.0 at a scan rate of 50 mVs−1.

Figure 11.
The LSV curves (a) of N-rGO/SPCE in the presence of different concentrations of H2O2 (0.01, 0.05, 0.1, 0.2, 0.3, 0.4, 0.5, 0.6, 0.8, and 1.0 mM) in 0.1 M PBS of pH 7.0 at a scan rate of 50 mVs−1 and the corresponding linear calibration plot (b) between the peak current response versus the concentration of H2O2.

Figure 12.
The LSV curves (1st, 25th, and 50th cycle) of N-rGO/SPCE in the presence of 0.05 mM H2O2 in 0.1 M PBS of pH 7.0 at a scan rate of mVs−1.
Figure 12.
The LSV curves (1st, 25th, and 50th cycle) of N-rGO/SPCE in the presence of 0.05 mM H2O2 in 0.1 M PBS of pH 7.0 at a scan rate of mVs−1.

Figure 13.
The LSV curves of N-rGO/SPCE in the absence (black) and presence (red) of interfering molecules (glucose, chlorophenol, hydrazine, uric acid, urea, dopamine, ascorbic acid, and nitrophenol) in 0.05 mM H2O2 in 0.1 M PBS of pH 7.0 at a scan rate of 50 mVs−1.
Figure 13.
The LSV curves of N-rGO/SPCE in the absence (black) and presence (red) of interfering molecules (glucose, chlorophenol, hydrazine, uric acid, urea, dopamine, ascorbic acid, and nitrophenol) in 0.05 mM H2O2 in 0.1 M PBS of pH 7.0 at a scan rate of 50 mVs−1.


Table 1.
The comparisons of the LOD and sensitivity with previous reports.
| Electrode Material | LOD (µM) | Sensitivity | Working Electrode Area | References |
|---|---|---|---|---|
| Graphene@Ag | 2.8 | 28.6 µM mM−1 cm−2 | 5 mm | [49] |
| Pt-PANI/rGO | 1.1 | 257 μA mM−1 cm−2 | - | [50] |
| Pd/PANI/(CMF) | 0.70 | 234 μA mM−1 cm−2 | - | [51] |
| CuGa2O4/GCE | 5 | - | 3 mm | [52] |
| MnOx/carbon nanowall | 0.55 | 698 μA mM−1 cm−2 | 10 mm | [53] |
| MnO2-CNF/GCE | 1.1 | 71 μA mM−1 cm−2 | 3 mm | [54] |
| CuBi2O4/FTO | 380 | 280 μA mM−1 cm−2 | 0.5 cm2 | [55] |
| MoS2/rGO | 0.19 | 3 mm | [56] | |
| AuNPs-PB-GO | 1.3 | 7.6 μA mM− 1 cm−2 | - | [57] |
| CuNP-rGO | 600 | - | - | [58] |
| ERGO/GC | 0.7 | - | - | [59] |
| Graphene/MWCNT | 9.4 | - | 3 mm | [60] |
| Ag/rGO | 28 | - | - | [61] |
| rGO/Fe2O3 | 6 | - | 2 mm | [62] |
| N-rGO/SPCE | 0.83 | 4.34 µA µM−1 cm−2 | 3 mm | This study |
Publisher’s Note: MDPI stays neutral with regard to jurisdictional claims in published maps and institutional affiliations. |
© 2022 by the authors. Licensee MDPI, Basel, Switzerland. This article is an open access article distributed under the terms and conditions of the Creative Commons Attribution (CC BY) license (https://creativecommons.org/licenses/by/4.0/).
Share and Cite
MDPI and ACS Style
Ahmad, K.; Kim, H. Fabrication of Nitrogen-Doped Reduced Graphene Oxide Modified Screen Printed Carbon Electrode (N-rGO/SPCE) as Hydrogen Peroxide Sensor. Nanomaterials 2022, 12, 2443. https://doi.org/10.3390/nano12142443
AMA Style
Ahmad K, Kim H. Fabrication of Nitrogen-Doped Reduced Graphene Oxide Modified Screen Printed Carbon Electrode (N-rGO/SPCE) as Hydrogen Peroxide Sensor. Nanomaterials. 2022; 12(14):2443. https://doi.org/10.3390/nano12142443
Chicago/Turabian StyleAhmad, Khursheed, and Haekyoung Kim. 2022. "Fabrication of Nitrogen-Doped Reduced Graphene Oxide Modified Screen Printed Carbon Electrode (N-rGO/SPCE) as Hydrogen Peroxide Sensor" Nanomaterials 12, no. 14: 2443. https://doi.org/10.3390/nano12142443
Note that from the first issue of 2016, this journal uses article numbers instead of page numbers. See further details here.