
Improvement of the Grid-Tied Solar-Wind System with a Storage Battery for the Self-Consumption of a Local Object


1
Department of Computer Engineering and Electromechanics, Institute of Engineering and Information Technologies, Kyiv National University of Technologies and Design, Nemyrovycha-Danchenka Street, 2, 01011 Kyiv, Ukraine
2
Department of Electric Power Engineering, Faculty of Electrical Engineering and Informatics, Technical University of Kosice, Letná 9, 042 00 Košice, Slovakia
*
Author to whom correspondence should be addressed.
Energies 2022, 15(14), 5114; https://doi.org/10.3390/en15145114
Submission received: 12 June 2022
/
Revised: 9 July 2022
/
Accepted: 11 July 2022
/
Published: 13 July 2022
Abstract
:This work aimed to improve how the equipment of a grid-tied solar-wind system used the installed power of the storage battery while reducing the cost of electricity consumed by a local object from the grid. A method for calculating the parameters for a given load schedule is proposed, along with the value of the reduction in electricity consumption. Values for the power generation of a wind generator and photovoltaic battery are based on archival data. The possible power ratio of the wind generator and the photovoltaic battery is 1:8.33. The formation of the state of charge of the battery involves: a calculation of its value for the morning peak according to the forecast for the next day; adjustable discharge in the evening with full or partial compensation for the load consumption according to the forecast for the next day; a night charge with a given current value. At a one-tariff plan, one battery discharge cycle per day is used. A night charge from the grid is not used. With a two-tariff plan and the use of a night battery charge from the grid, one discharge cycle is used in the spring-summer-autumn period. The simulation confirms the possibility of reducing electricity costs by 2.9 times in winter, which corresponds to the set value, alongside a complete elimination of costs in summer.
1. Introduction
Uneven generation of renewable energy sources (RES) creates problems for the consumer and the energy system as a whole. This necessitates a change in approaches to the use of RES, in particular, concerning the localization of consumption at the generation point. The use of combined installations is quite effective, where RES mutually complement each other. There may be no wind for much of the year. Then, there may be little sun in winter, but at the same time, in winter, the wind speed may increase. A photovoltaic battery (PV) is cheap, but a wind generator (WG) has a higher coefficient of installed power. Aside from considering these different options, a separate issue is the use of energy storage devices. Usually, these are rechargeable storage batteries (SB) for the redistribution of energy in the system. For small local objects (LO) serving various purposes in the domestic and industrial sectors, the effectiveness of such a power supply system is determined by the cost of electricity consumption. When connected to the distribution grid (DG), this is largely determined by the reduction in the cost of consuming electricity from the DG. This raises the question of how to correctly determine the parameters of the system for maximum cost reduction with effective energy management.
In Section 2, a review of the literature sources is carried out. The problem is stated, setting out the need to implement a PV-WG system with SB for self-consumption of LO with an improvement of the installed RES power use. The aim and main objectives of the article are described. In Section 3, the research methods behind our development of the proposed grid-tied PV-WG with SB for self-consumption of LO are explained. In Section 4, the structure of the PV-WG system and basic load schedule are put forward. We carried also present the findings of our analysis of RES generation based on archival data and discuss the operation modes of the system. In Section 5, a description of our modeling of the energy processes in the daily cycle, and the results of that modeling, are presented. In Section 6, we discuss the results of this study on the improvement of a PV-WG system with a battery for self-consumption. Section 7 summarizes the main results of the research.
2. Literature Review and Problem Statement
Issues surrounding the effective use of PV-WG systems, including those concerning the self-consumption of LO, have recently been given great attention. A review of hybrid structures with RES and optimization techniques, including evolution algorithms, was presented in [1]. Publications on the optimization of technical and economic indicators of PV-WG systems are widespread. The use of a genetic algorithm was described in [2]. Usually, optimization is carried out for a specific installation location. This confirms the importance of taking into account local factors, for example, in [3] for India and in [4] for the UK. At the same time, optimization is directed at the determination of the PV and WG parameters that facilitate proportional generation. For example, the researchers achieved WG power PW = 12 kW and PV power PPV = 39.2 kW, with the maximum load power during the daytime PL = 12 kW, in [5]. In article [6], the researchers then presented dependencies PPV(t) and PW(t) that opened up the possibility of equalizing the total energy of RES generation during the day. Most works considered the use of electricity generation to power the DG. This helps to reduce the costs of energy consumed from the grid and makes it easier to solve the issue of how to balance powers in the system.
When using a PV and WG of comparable power, the system becomes vulnerable to the weather conditions. In the absence of wind, which often occurs in many locations, the generation of electricity is sharply reduced. On the other hand, when using a PV-WG system only to meet your own needs and with a low night load of the LO, it is tricky to ensure the energy balance is upheld at night.
Circuit solutions for PV-WG systems with SB can be achieved using standard converters for WG and PV, with SB at the connection to a common coupling point (PCC). The option with a common grid inverter [2] is preferred. The use of multifunctional grid inverters, which provide a power factor in PCC close to 1, is promising. Many publications have been devoted to applying such inverters to a photovoltaic system. A control structure for a photovoltaic system using a multifunctional grid inverter was given in [7]. Great attention has been paid to the increase in the quality of electrical energy when a multifunctional grid inverter is used. The technical solution of a single-phase inverter was presented in [8]. An improvement of the inverter characteristics, with fuzzy logic used, was then described in [9]. The use of fuzzy logic for a three-phase multifunctional inverter with an unbalanced load was shown in [10]. In a case with an unbalanced load of LO, the use of a four-wire circuit for a three-phase multifunctional inverter was considered in [11]. Furthermore, a solution that connected the neutral output of the grid with the middle pin of the DC link of an inverter was presented in [12]. A similar solution with a few PVs connected to the inverter was shown in [13]. Such grid inverter solutions have allowed researchers to equalize the consumption over grid phases.
When addressing the issue of how to ensure a balance of power in the system, there is also a certain contradiction—using MPPT controllers for PV and WG. At the same time, a load dump [2] may be required to reset the excess energy. The solution seems preferable for PV, for use when switching from the maximum power mode to PV generation power control [7]. A PV generation control function may be provided by serial hybrid inverters [14] for photovoltaic systems.
Lately, significant attention has been paid to the issue of the use of forecasts of RES generation [15]. Possibilities for the management of the system with SB using a short-term generation forecast in combination with multi-zone tariffication were presented in [16]. In [17], planned electricity generation for the grid using a PV forecast was described. It is now possible to obtain a forecast for a specific coordinate of an object’s placement in the public domain. PV generation forecast data and hourly wind speeds were presented in [18]. Today, an open web service for predicting solar power generation in smart homes [19] ensures there is a regular data supply.
A low wind speed (3–5 m/s) is typical for Kyiv and central regions of Ukraine (data on wind speeds were obtained from open web resources [20,21]). Under these conditions, effective use of WG involves additional costs for masts, etc. Now on the market is a WG with a vertical axis for use in the domestic sector at a rated wind speed of 3–7 m/s and power up to 8 kW. Such a WG can be used as an auxiliary at consumption powers of LO up to 100 kW.
Rational parameters for a PV-WG system with SB may be efficiently determined using archival data on RES generation for specific conditions. Data exist on the power of PV generation and wind speeds for a given coordinate of an object location provided [22]. Information on the average monthly PV generation is available, too. However, data on the average generation of RES per day are not sufficient. In the future, we need to collect data on the RES generation at set time intervals according to the load schedule of LO.
An effective way to reduce the cost of electricity consumed from the grid is the rational use of tariffed pricing [23]. In [24], the influence of widespread use of energy storage systems on the management of peak demand in the UK was shown. Implementing the management of a PV-WG system with SB using different pricing tariffs has a number of benefits in terms of forming a charge schedule of SB. This is relevant to the charge at night and the compensation for the LO consumption during peak hours [16]. A process for determining the sizes of SB for a PV grid-tied system based on minimal operating costs was described in [25]. A comparative analysis of hybrid models of renewable energy-based rural electrification systems with different power storage backup systems, namely the solid-state battery and flow battery arrangement, in terms of system sizing, techno-economic performance and environmental stability, was presented in [26].
Experimental studies of PV-WG systems’ efficiency, including their energy management, require a lot of time and money. An effective tool, in this case, is mathematical modeling. Usually, this concerns the modeling of electromagnetic processes in the system. Modeling of a hybrid energy storage system for residential grid-tied solar microgrid systems was described in [27]. Models for researching the processes in different systems with RES are widely available in MATLAB. Modeling energy processes in the daily cycle, using real archival generation data, looks promising for assessing the indicators of a PV-WG system [16]. This involves the formalization of processes in the system in different modes of operation.
When using a PV-WG system for self-consumption of LO, the approach of using WG as an auxiliary source of low power looks promising. The main role is performed by PV, providing a large share of energy even in the absence of wind. The installed PV power is overestimated for effective use of a PV system in wintertime and cloudy weather. The use of an auxiliary wind generator is oriented based on a decrease in the installed PV power at more full use of its energy. At the same time, the area for PV placement and maintenance costs are also reduced. The following issues require additional study: how to set up a photovoltaic system with an auxiliary WG for a given reduction of electricity consumption from the grid; use the forecast and various tariff plans to pay for electricity; preliminarily assess the effectiveness through modeling.
In that context, this article aimed to improve a PV-WG system with SB connected to the grid for self-consumption of LO through improved use of the installed RES power to reduce the cost of the electricity consumed from the grid.
The main objectives of the research were as follows:
- to calculate the average monthly values of the energy generated by PV and WG at time intervals of the day, using archived data for the LO location point;
- to develop a technique for calculating the installed power of the equipment for the LO load schedule in question with a given reduction in electricity consumption from the grid;
- to formulate principles for the implementation of a schedule for the SB charge degree, accounting for the forecasted RES generation with one or two electricity payment tariffs;
- to perform simulation modeling of energy processes in the system for the daily cycle of work, with an assessment of the degree of reduction in costs for electricity consumed from the grid.
3. Materials and Methods
This study on ways to improve a PV-WG system with batteries for self-consumption of LO was carried out by analyzing electrical circuits and processing statistical data on the generation of PV and WG for a given location of an object. The technique for calculating the parameters was based on the use of a given load schedule and the aim of reducing electricity consumption. The load schedule of an object with predominantly daytime loading, with peak loads in the morning and evening and a decreased load at night, was considered. The analysis of energy processes in the system “grid—PV-WG system with SB—load of LO” was performed for a daily cycle. The transient processes and higher harmonics in energy converters were not taken into account. Energy losses were accounted for through efficiency. SB properties were set according to the manufacturer’s specifications. Renewable energy generation was estimated based on the average monthly values for given time intervals during the day. The data were obtained by processing archival data for five to six years for the location of the object. The control system for the converter unit of the photovoltaic system was based on a classical two-circuit structure with voltage stabilization in the DC link. The modeling of energy processes was carried out using the proven MATLAB Simulink software package, using real archival RES generation schedules. Days were selected when the PV generation by time interval was close to the average monthly value. The model was based on analytical expressions for steady-state operating modes, which corresponded to generally accepted and proven calculation methods. When changing the operating modes of the system during the day, the corresponding calculated variables were used.
4. Research Results on Improving the Grid-Tied PV-WG System with a Battery
4.1. Structure of PV-WG System
The structure of the PV-WG system (Figure 1) was developed according to known principles [4] using a multifunctional grid inverter VSI. RES and SB were connected via the appropriate AC/DC and DC/DC voltage converters to the DC bus at the VSI output. The DC/DC2 converter for SB had bilateral conductivity. A load dump could connect to the DC bus for an emergency energy reset. For the WG converter, we used a standard controller with maximum power point tracking (MPPT), which was managed independently of the main control system. For PV, operation was possible in the MPPT mode or with the regulation of generation power [13]. The operating mode of PV and SB was set by the control system with three voltage controllers. They maintained a constant voltage value Ud of the DC bus and formed the reference for the corresponding current [7]: VCIPV—PV current IPV, VCIB—SB current IB, VCIg—current Ig in PCC. Depending on the mode, the value of one of the currents was adjusted [7], while the rest were fixed.
4.2. Analysis of RES Generation Based on Archival Data: The Accepted Load Schedule
A household or small non-household LO with a single-shift mode of operation was considered in the presence of peak loads in the morning and evening time. As an option, we accepted the LO load schedule [17] when using PV with installed power PPVR = 1 kW and peak load PL = 200 W. The average values for the maximum load power PL at different times (Kyiv time) are presented in Table 1.
For a LO with predominantly daytime consumption, when the night load is small and generation for the grid is excluded, it is advisable to use WG as an auxiliary source of energy of low power. For Slovakia and central Ukraine, where the wind speed is low, as a basic option, the use of Vertical WG (manufacturer—VaultTec, Zaporizhzhia, Ukraine) should be considered [28].
In Table 2, data for the calculation of the average monthly values of the daily generation of energy for specified time intervals for PV (WPVAVD—per day, WPV23, WPV34, WPV45) and WG (WWAVD—per day, WW56, WW62, WW24) are given. Data from the archive [22] for Kyiv (latitude (decimal degrees): 50.27, longitude (decimal degrees): 30.31) were used for a PV power of 1 kW over five years and WG (1.8 kW, 3 m/s) over six years. For comparison, Table 2 also shows the PV generation values WPVAVDK for Košice (latitude (decimal degrees): 48.717, longitude (decimal degrees): 21.2530), which is close to Kyiv, with a slight increase in PV generation in winter relative to Kyiv.
The calculation of the system parameters differs depending on the tariffing of payment for electricity consumed from the DG.
4.3. Implementation Variant for One-Tariff Plan
In this case, the SB night charge is used only to accumulate excess energy generated by WG, which is not used for consumption. The state of SB charge (SOC) or Q* = 100 Q/QR, where Q = ∫(IB·dt) and QR is the rated capacity (in Ah). The process of accumulation of surplus energy of RES in the daytime period with transfer to the load in the evening is taken into account in reducing the consumption from the DG. Then, the SB energy balance cycle per day assumes a night charge (interval (t6, t2)) from Q*6 to Q*2 (where: ΔQ*62 = Q*6 − Q*2) followed by a day’s discharge on a load from Q*2 to Q*6. The energy balance for the night period is as follows
where Wg62—energy consumed from the grid; WW62—energy generated by WG; WL62—energy consumed by the load; ΔWB62 = (0.01·WB·(Q*2 − Q*6))/ηC·ηB—energy per SB charge; WB = UB·CB—SB energy capacity; UB—SB voltage; CB—SB capacity (Ah); ηC—converter efficiency; ηB—SB efficiency.
During the day, the battery gives energy to the load ΔWB26 = 0.01·WB·(Q*6 − Q*2)/ηC·ηB.
Consider the winter period, when the daily PV generation is small. Accept that all the energy generated by RES is used for the consumption of LO. Then, the energy consumed by the load per day WL = (ΔWB26 + WPV26·ηC + WW26·ηC + Wg26) + (Wg62 + WW62·ηC + WPV62·ηC + ΔWB62).
The energy consumed from the grid Wg = WL + WR62·ηC + ΔWB26 − ΔWB62, where WR = WPV + WW is the total energy generated by RES.
The energy consumed by the load per day is
In winter—WL = 3080 Wh; in summer—WL = 3140 Wh.
With one tariff, it is possible to follow directly from cost to energy, reducing the cost of the payment for electricity per day
The energy generated by RES may be calculated to achieve an acceptable value of kE
The value of the total PV and WG generation is as follows
where mP—coefficient of PV power recalculation relative to the installed PV power of 1 kW; m—coefficient of WG power recalculation for the value used in Table 1 (1.8 kW).
Since generation for the grid is not used, it is necessary to ensure a balance of energy at night (interval (t6, t2)) WW62·ηC/m + mP·WPV62·ηC + Wg62 = WL62 + WB62.
The maximum WG generation power is PWMAX = 1.1·PWR, and WW62MAX = PWMAX·(t2 − t6). In this case, the value of WW62MAX exceeds the load consumption and there is no consumption from the grid, i.e., Wg62 = 0. We neglect the small PV generation in the morning hours, and then we get the condition
The estimated values of the average WG monthly generation WW62AV are significantly lower than WW62MAX. In the period of spring-summer-autumn, as the PV generation in the daytime is sufficiently high, it is possible to avoid a night charge on the SB. Then, we can assume that the WG energy compensates for the consumption of the LO load, and m = WW62·ηC/WL62. The maximum WW62AV during this period is in June (Table 2), when the value corresponds to m = 25.
We will determine the SB energy capacity WB by excluding electricity consumption from the grid during the evening peak (t5, t6), which is possible due to the SB charge at a high generation of RES during the day
The minimum average monthly value of WG energy in the evening peak WW56 = 5245 Wh, with a duration of 4 h, is in September. Accepting a value of DOD ≤ 80%, the maximum value is ΔQ*56 = 80%. In accordance with (7), we get WB = 835 Wh. We accept with some margin the value WB = 896 Wh, which corresponds, for example, to CB = 35 Ah at UB = 25.6 V.
As such, the produced value of m = 25 corresponds to condition (6).
During the calculations, we operate with the average monthly values of RES generation. However, there may be a case when wind is absent or its speed is below the minimum for WG, which is mainly likely to occur in the spring-summer-autumn period. We proceed on the basis that, in this case, the value of kE should not be lower than in winter with an average monthly generation. For December, the monthly averages are WPV = 1000 Wh and WW/m = 1517 Wh. We will determine the value ΔQ*26 in (4) based on the possible value at PWMAX and the power load at night.
For the spring-summer-autumn period, we accept WPVAVD = 3800 Wh (according to Table 2, for April and September, the WPVAVD values are 3830 and 3850 Wh). The calculated mP and kE values are given in Table 3. We get identical values (kE = 2.63) during the year when mP = 0.555. For winter, an increase in mP does not produce a significant increase in kE. It can be accepted that mP = 0.6, which allows us to get kE = 2.73 in December, and kE = 3 in the period of spring-autumn (with WPV = 3800 Wh and no wind).
As a result, for the accepted load schedule at PL = 200 W, we get an installed PV power PPVR = 600 W (1.67 times lower than accepted in [17] with a value of 1 kW) and WG power PWR = 72 W. In a real installation, we have, for example, at PL = 5 kW—PPVR = 15 kW, PWR = 1.8 kW and WB = 22.4 kWh.
Formation of SB SOC(t) dependence is carried out for one cycle of discharge at the evening peak of load. A night charge from the grid is not used and battery discharge during the morning peak hours is allowed only when WR23·ηC > WL23. Discharge of SB to compensate for load consumption is possible only after t4, when PV generation decreases. Charging of SB on the interval (t6, t2) is carried out provided that PR·ηC > PL (Pg = 0) is maintained and, in general, Q*2 ≥ Q*6. At PR·ηC ≤ PL value IB = 0, there is a consumption of the energy missing for the LO load from the grid. Value Q*6 sets DOD ≤ 80% (Q*6 ≥ 20%). We set increment Q* on the interval (t2, t4) according to the RES generation forecast data
In a similar way, the value ΔQ*62 is determined. Only ΔQ* > 0 is accounted for. The calculation does not take into account that at certain intervals of time, PR·ηC < PL and SB charging is not carried out; besides that, at other intervals, the charge will be higher than expected. The calculation is made according to the forecast for the next day (+1) at time t4. This makes it possible to reconcile the value Q*6 = Q*2R(+1) − ΔQ*62(+1) with the value Q*2R(+1) = (Q*4 − ΔQ*24(+1)) ≥ 20% (Q*4 = 95%). This ensures a low degree of battery discharge (DOD6) with low RES generation, which contributes to an increase in the battery life.
Setting the discharge schedule of SB in the evening (after t4) is done to identify the required value Q*6, if the current value Q*t > Q*6. This provides for the possibility of full or partial compensation for energy consumed by the load due to SB discharge. In accordance with the generation forecast, current (measured) values PPVt, PWt and Q*t and the load schedule, the degree of discharge was calculated from the current point in time t to t6
If ΔQ*t,6 ≤ (Q*t − Q*6), which corresponds to a moment in time tR, full compensation for the LO consumption is carried out at reference ig = 0. In a condition where Q* ≤ Q*6 discharge stops, if tR ≥ t5 and the discharge has not started, partial compensation is carried out by reference to the discharge current of SB I1Bt = (0.01·CB·(Q*t − Q*6))/(t6 − t) until Q* ≤ Q*6 is reached.
4.4. Formation of Storage Battery SOC(t) Dependency in Two-Tariff Plan Case and Use of Night Battery Charge from the Grid
Consider an implementation option with a cheaper night tariff or a more expensive peak tariff. In this case, the cost of electricity consumed from the grid is reduced by discouraging consumption during peak hours. To make this work, SB charging at night is introduced, using the SB energy during the peak hours in the morning.
The formation of SB SOC(t) dependency assumes: a calculation of the specified Q*2R value according to the forecast for the next day; ensuring that the SB charge runs to Q*2R; formation of a graph of the SB discharge in the evening. For the interval (t3, t4), SB discharge is excluded.
The Q*2R value is calculated from the condition Q*4 ≥ 95% when the degree of SB discharge is limited at the end of the morning peak Q*3MIN, for example, Q*3MIN ≥ (40 ÷ 50)% at Q*6 ≥ 20%. The purpose of the restriction is to reduce the number of deep discharge cycles of SB. Here, ΔQ*24 is determined by (8).
If ΔQ*24 ≤ 0, there is not enough energy from RES; on the interval (t3, t4), consumption from the grid takes place and the Q*2R value is accepted as close to 100%. At PR·ηC < PL SB, the charge current is set to I1B = 0.1·CB.
At ΔQ*24 > 0, there is no consumption from the grid. If ΔQ*23 < 0 (defined similarly to ΔQ*24), the SB is discharged; then, the Q*2R value should correspond to a condition where Q*2R ≥ (Q*4 − ΔQ*24) and Q*2R ≥ (Q*3MIN + |ΔQ*23|). If ΔQ*23 ≥ 0 (SB is charged), it should correspond to a condition where Q*2R ≥ (Q*4 − ΔQ*24) and Q*2R ≥ 20%.
With the selected value m, the RES energy at night is not enough to provide an SB charge and LO load functioning even at the maximum generation PWMAX. At night, electricity from the grid will be consumed. However, the situation should be excluded when PR·ηC > PL and the SB is charged and cannot accept excess energy. According to the charging characteristic for the lithium-ion battery [29], this is the case when Q* ≥ Q*d = (90–92)%. Implementation of the charging process is made possible by controlling the SB charge current using the appropriate controller [7]:
- If Q*2R ≤ Q*d, the charge current does not depend on the state of charge. We refer the current at forecast intervals, for example, Δt = 1 h − I1B = (0.01·CB·(Q*2R − Q*t))/(t − t2). At the initial point in time t = t6, the current value t, Q*t and reference of the current I1B are then used;
- When the RES generation is high and a night charge is not required (Q*2R ≈ Q*6) or the charge is negligible, and value [(WW62 + WPV62)·ηC − WL62] > 0, that value of the SB charge current is
- If Q*2R > Q*d, the battery is charged in two stages: up to 90%, followed by charging at a current value according to the charging characteristic up to Q*2 ≤ 95%, when IB ≥ (0.09–0.1)·CB. In the case of maximum generation of WG (wind gust) and reduction of the load to 0, the value that can be obtained is I1B = PWMAX·ηC/UB ≤ 0.083CB.
The formation of the SB discharge schedule in the evening (after t4) is similar to the option discussed above for one tariff with full compensation for consumption.
4.5. System Operation Modes
The main expressions for implementation in the condition of one tariff are given in Table 4 for appropriate time intervals. On the selected intervals, one of the controllers is used. For example, on the interval (t6, t2), at PR·ηC ≤ PL, VCIg is active, which sets the value of the amplitude of the current in PCC I1gm ≥ 0 and ensures the balance of power in the system. At the same time, there is consumption of missing energy from the grid Pg = (PR·ηC − PL) ≤ 0 for LO load, and the IB value is 0. Charging SB is possible only in the case of PR·ηC ≥ PL, then it is set to I1gm = 0 and VCB is active, which sets the current IB. Switching controllers is carried out as follows. With an increasing PR value, I1gm decreases to 0, which further leads to an increase in voltage Ud, and when it reaches the threshold value, VCIB is turned on. Reverse switching at a decreasing PR is carried out according to the condition IB = 0 and with a reduction in Ud below the threshold value. The presence of two conditions excludes the influence of transition processes. The modes of operation and the main expressions for implementation in the two-tariff condition are given in Table 5.
5. Modeling the Energy Processes in the Daily Cycle
To assess the effectiveness of the proposed solutions, we modeled energy processes in the system at the level of active power. Modeling was carried out for the daily cycle of work (Table 4 and Table 5) using MATLAB Simulink. Transient processes were not taken into account when changing operating modes. Losses from converters and SB were taken into account using efficiency [16,17]. The RES were set using archival data [20] selecting days when the PV generation was close to the average monthly value (Table 2).
Load power PL(t), PV generation PPVM(t) (PPVM corresponds to the maximum power mode) and PW(t) were set in tabular form. To set the intervals of work (Table 4 and Table 5), variables were entered—t62, t61, t12, t23, t35, t56, t71—that took a value of 1 at the appropriate time interval. Variables fR and hR set the SB discharge time in the evening, with full fR and partial hR compensation for consumption from the grid, respectively. They were determined according to precalculated values WR26 and WL26 in the process of modeling, using the function RS-trigger and intermediate variable tR
where , ,
Variables were also introduced
The actual current value of PV generation power PPVF(t), taking into account the regulation, was
The power consumed from the grid with a one-tariff plan was
Then, the power consumed from the grid with a two-tariff plan was
The SB current with a one-tariff plan was
Then, the SB current with a two-tariff plan was
where
The SB model was fulfilled in accordance with the catalog characteristics of the manufacturer [29]: charge characteristics IB(Q*)C, UB(Q*)C at IB ≥ 0 and discharge UB(Q*)R at IB < 0. In this case, the charge current was
where the value Q was determined by SB current , Q0 was the initial value, I1B = IBηB, if IB > 0 (SB charge) and I1B = IB/ηB, if IB < 0 (SB discharge).
The model included a module for estimating the cost of electricity consumed from the grid. The use of one and two tariffs was considered: day Td = 1 and night Tn = 0.5. The coefficient of cost reduction used [16,17] kE = W*LS/W*gS, where W*LS was the relative cost of the total electricity consumed at a load of LO per day, and W*gS was the relative cost of electricity consumed by LO from the grid
To implement the MATLAB model, the approaches given in [16,17] were used. The model was made based on expressions (11)–(23). PV and WG generation schedules were set for days selected from the archive [22], when the PV generation by time intervals was close to the average monthly values at m = 25, mP = 0.6 and mP = 0.67.
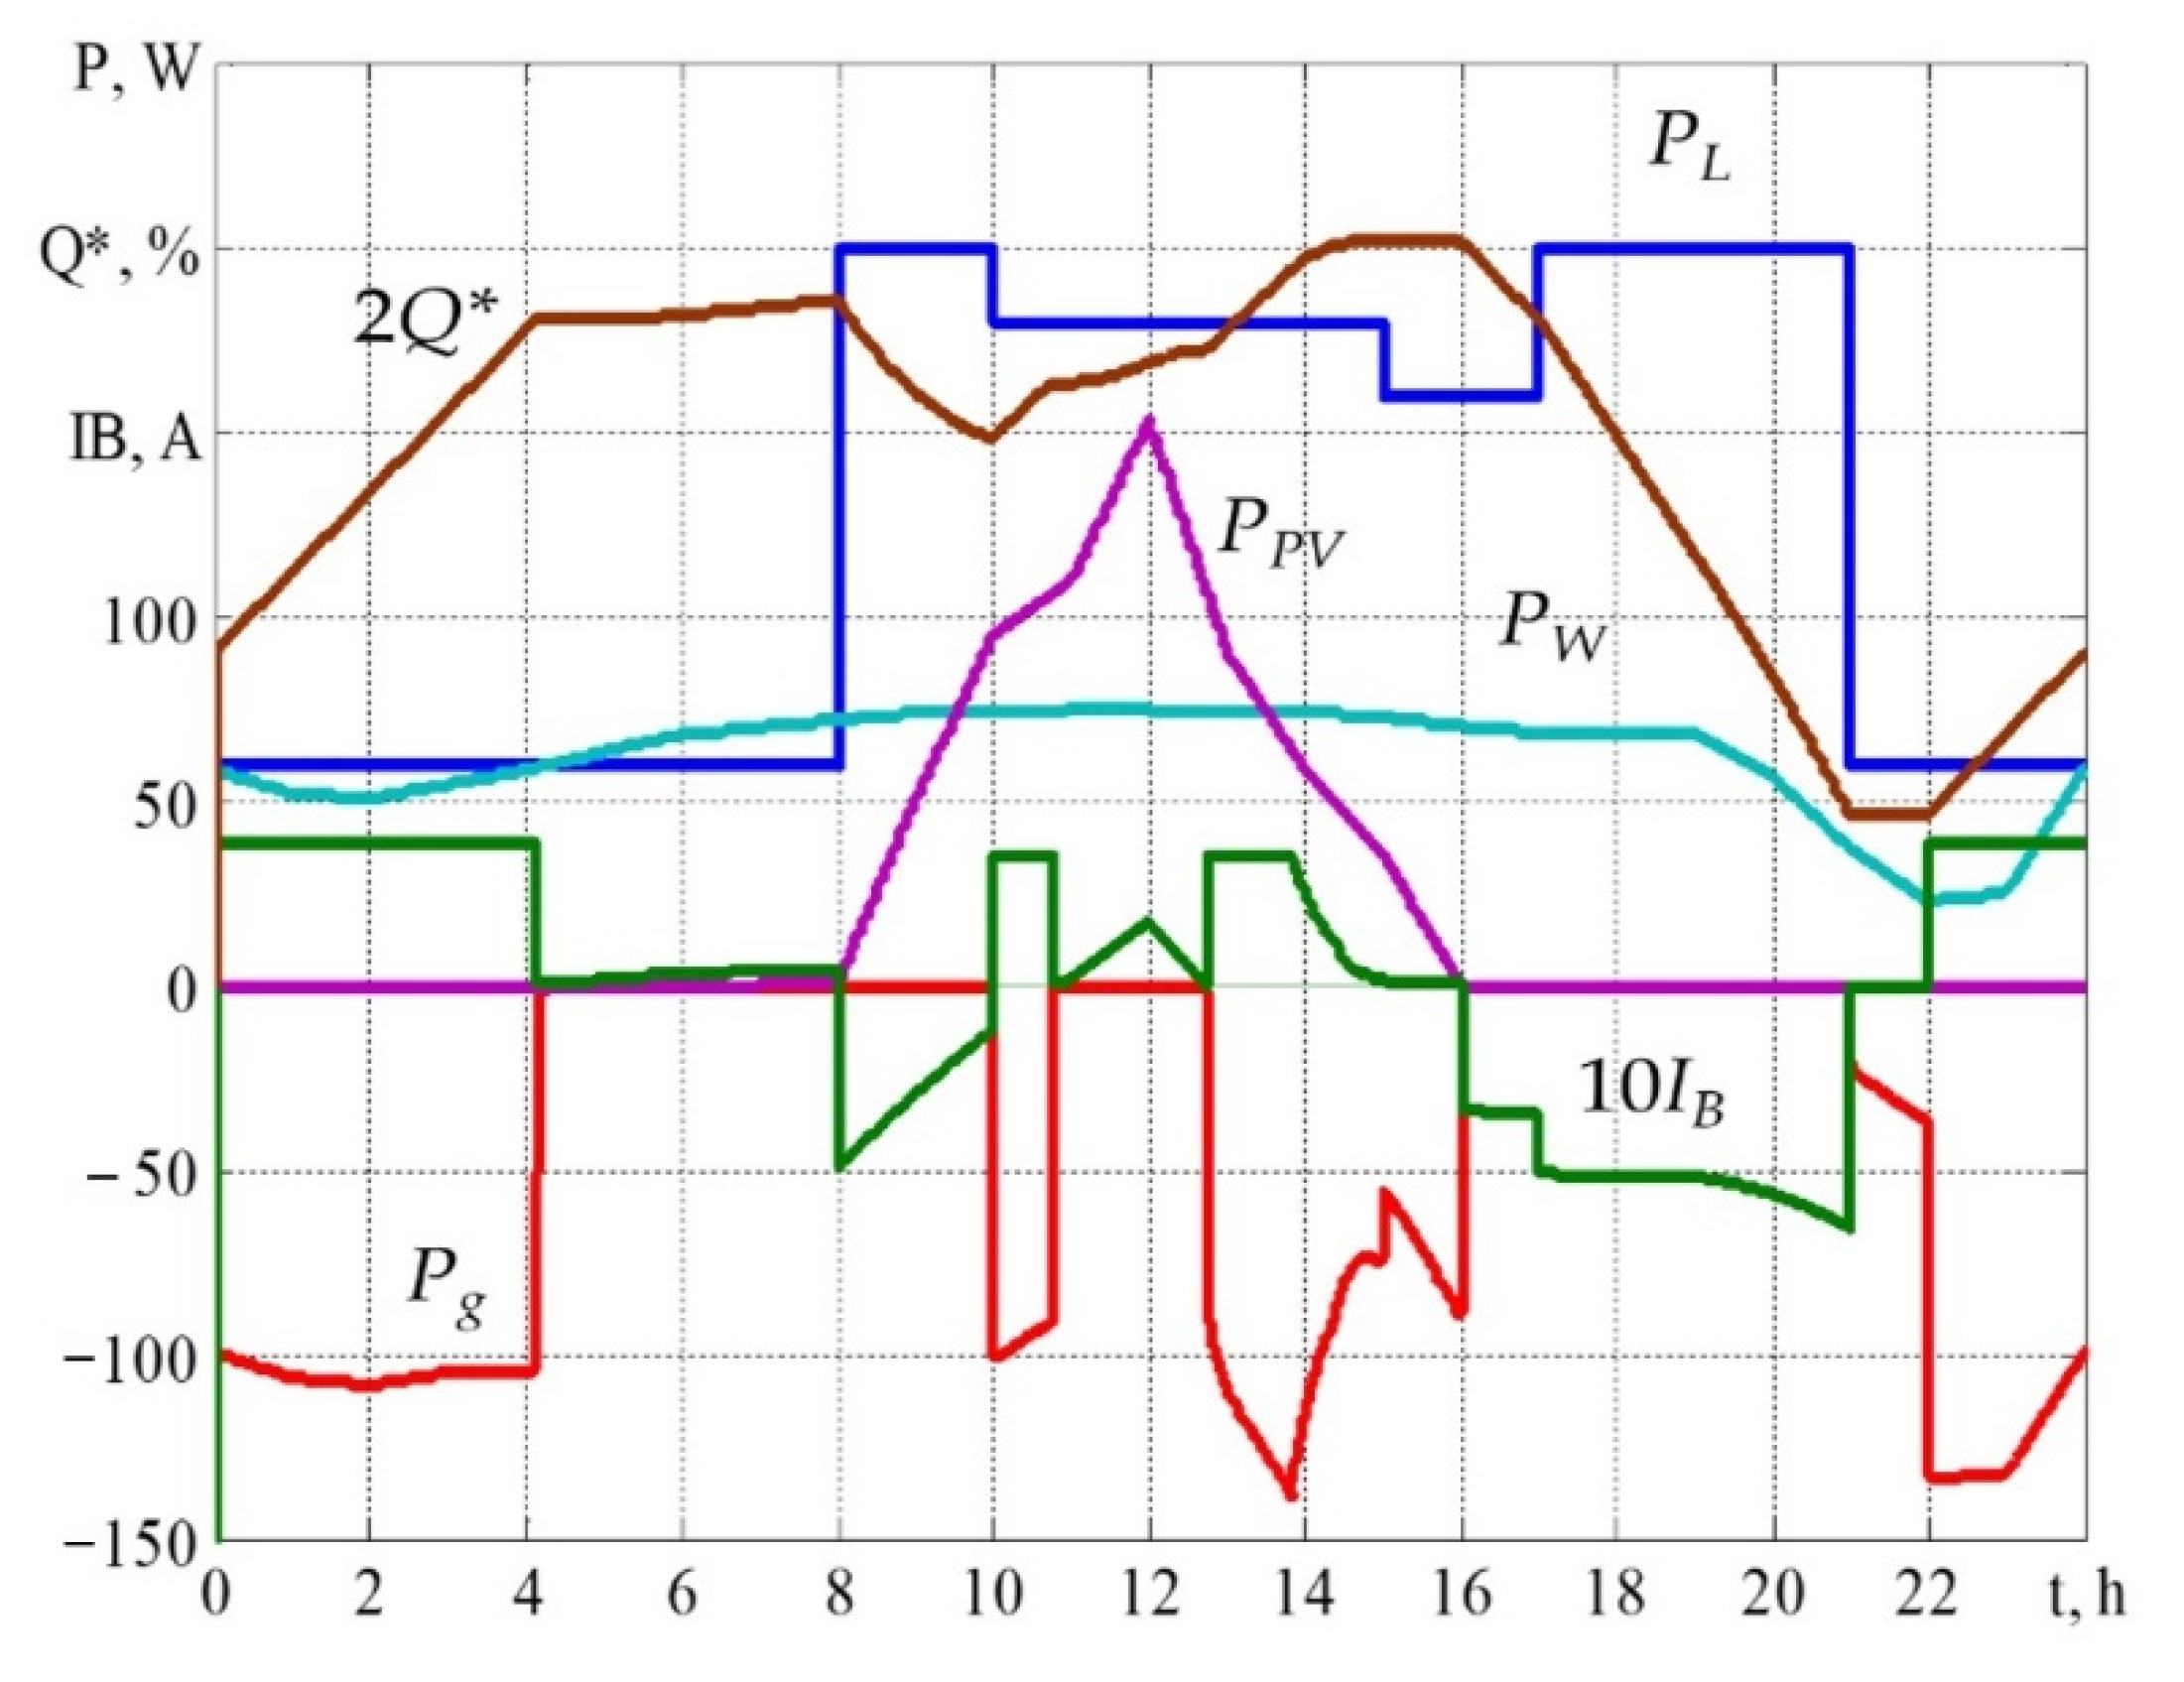
Oscillograms—PL, PPV, PW, Pg, Q*, IB—for a December day (6 December 2014) with PV generation corresponding to the monthly average are presented in Figure 2 for the option of using the night charge of the battery from the grid. In this case, the SB charge with the consumption of the missing energy from the grid is carried out up to Q*1 = 90% with a serving tool to Q*2 = 93% due to excess WG energy. Since the WG generation in the evening is quite considerable, the SB discharge to compensate for energy consumption from the grid begins before the evening peak at 16.00. The values are as follows: Q*6 = 23%, kE = 2.745 and at the night rate kEn = 3.43.
Oscillograms for a February day (2 February 2014) with PV generation corresponding to the monthly average are presented in Figure 3a for the option of using the night charge of SB from the grid, and in Figure 3b, without night tariff. For one tariff (Figure 3b), kE1 = 9.275. When using a night charge, three tariff options were considered: one rate kE1 = 9.275; daily and peak tariffs TP = 1.5, kEP = 9.125; day and night tariffs Tn = 0.5, kEn = 11. The application of the peak tariff was not effective. Therefore, the use of the night tariff was considered.
In Figure 4a, oscillograms for a cloudy July day at WPV = 1320 Wh (27 July 2015) without a night SB charge from the grid are presented. The values are as follows: Q*00 = 60%, Q*MAX = 94.32% and kE1 = 2.796. In Figure 4b, oscillograms are then shown for a July day (4 July 2013) with PV generation corresponding to the monthly average value. In this case, the implementation with one or two tariffs is the same. A night SB charge from the grid is not used Q*2 = Q*6 = 20% (kE = 10.52, kEn = 12.56); instead, SB discharge is used to compensate for energy consumption by the grid before the evening peak at 19.00. There is some underutilization of PV energy with a decrease in generation relative to the maximum power mode PPVM.
The simulation results for the selected days with PV generation corresponding to the monthly average value during the year are given in Table 6. Options with one or two tariffs for values mP = 0.6 and mP = 0.67 (ΔQ*MAX = Q*MAX, Q*0 (Q*0—value at the time 00.00) are considered.
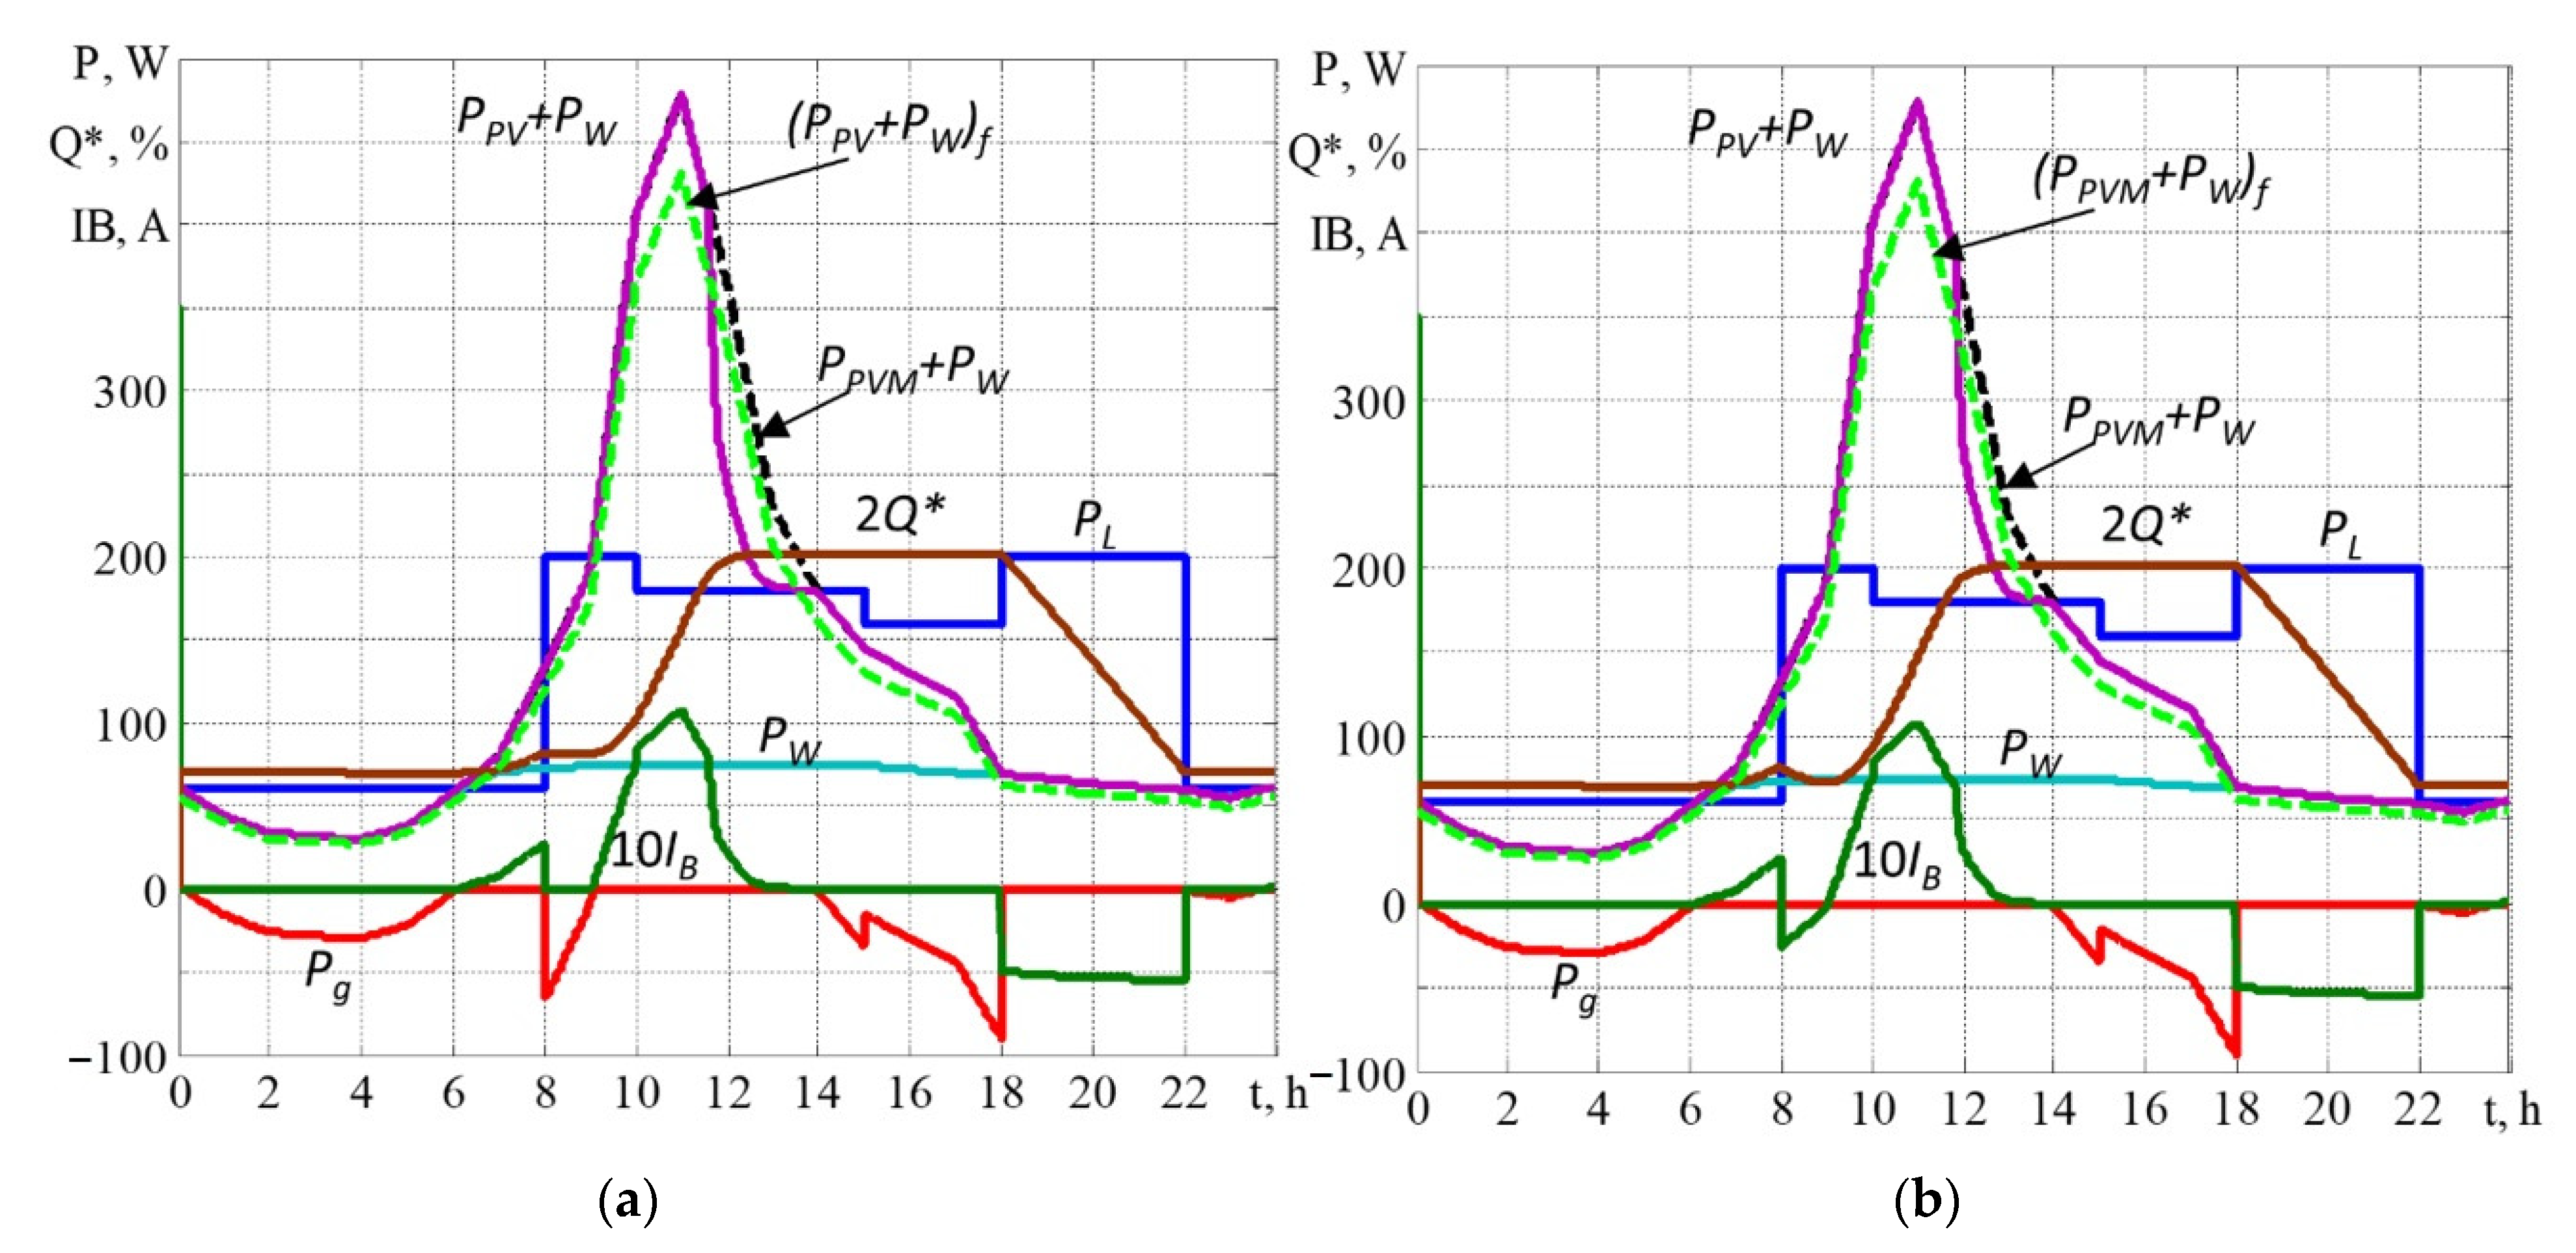
For the variant without the use of a nighttime battery charge from the grid, a situation when there is a discrepancy between the RES generation forecast (PPVM + PW)f and the actual generation values (PPVM + PW) is considered. The problem is when there is a value of Q*2R ≈ 20% and (PPVM + PW)f < (PPVM + PW). In this case, the calculated value of Q*2R will be overestimated. This will lead to a decrease in the use of RES energy for consumption. So, for a March day at (PPVM + PW)f = 0.9(PPVM + PW), there is a value where Q*2R = 35% (Figure 5a). At the same time, there is the value where kE = 10.24.
Partial compensation is possible when the discharge of SB is used in the hours of the morning peak load (Figure 5b). At the same time, there is the value where kE = 11.68. That is to say, it is possible to use a discharge during the hours of the morning peak according to the value of the actual generation of RES. With an overestimated forecast where Q*2R = 20%, the system works via the actual generation of RES.
6. Discussion
Improving the use of the installed capacity of the equipment of a grid-tied PV-WG system with a storage battery, while reducing the cost of electricity consumed by the LO from the grid, is possible through:
- use of WG at the average wind speed for the location of the LO as an auxiliary source of energy of low power. At the same time, WG increases the value of the total generation of RES in winter to a value that provides the desired reduction in consumption from the grid. This value is close to spring and autumn periods in the absence of wind;
- calculation of the installed power of the equipment for the accepted LO load schedule, with the desired reduction in electricity consumption from the grid, based on the monthly average values of the energy generated by PV and WG. The values are determined by time intervals per day using archival data for the LO location point;
- formation of a state of charge SOC(t) according to the short-term forecast of RES energy generation, taking into account the tariffication of payment for electricity and with a focus on minimizing the nighttime charge, as well as using only one deep discharge cycle per day.
The exception of storage battery discharge during morning peak hours at high PV generation in the spring-summer-autumn period helps to reduce the number of battery charge cycles and increase its service life.
This research is a development of works [16,17] that considered increasing the efficiency of hybrid photovoltaic systems with batteries designed to meet the needs of local objects. This was achieved by reducing the cost of electricity consumed from the grid when using the PV generation forecast. The general problem is the need for a significant overestimation of the PV power in relation to the load power of the LO, which is necessary for use in conditions of low PV generation. As a result, even with medium PV generation, there is a significant underutilization of PV energy, along with a need to regulate the PV generation.
A feature of the proposed solutions is the use of auxiliary WG, which raises the value of the total generation of renewable energy sources in the winter to a level that provides a desired value to reduce consumption from the grid. Calculation of the equipment parameters is based on the use of average monthly values of the energy generated by renewable energy sources at time intervals per day, using archival data for the LO location point. The graph of the battery charge degree is focused on minimizing the night charge and using one cycle of deep discharge.
Yet, there are certain limitations regarding the use of this work’s results:
- the object is accepted with the main load in the daytime in the presence of peak loads in the morning and evening hours when it is possible to charge the battery at night within the limit on consumption from the grid. The average value of the load power at intervals is close to the accepted schedule;
- the assessment of a possible reduction in the cost of paying for electricity during the year was somewhat simplified. During the simulation, the days were considered when the PV generation corresponded to the monthly average values for the set time intervals, paired with the actual WG generation for the selected days;
- implementation of the control system implies an “open” structure of the relevant regulatory channels;
- the simulation assumed that the graph of the power generated by PV corresponded to the forecast and did not change during the day.
Future development of this work should encompass:
- automation of the calculation of data for the average monthly generation of renewable energy sources;
- a study of the possibilities for correcting deviations in the values of the actual generation of renewable energy sources relative to the forecasted data, and possible changes to the current forecast during the day;
- improvement of the principles for the implementation of the control system.
7. Conclusions
We carried out calculations of the average monthly PV and WG generation by time intervals according to the load schedule for the coordinates of the LO placement (Kyiv) using archival data for five and six years. The obtained data were the basis for our proposed method for calculating the PV-WG system with a battery for self-consumption of LO with a given load schedule and a coefficient of reducing the cost of electricity consumed from the grid kE. Boundary conditions of the absence of PV or WG generation were taken into account. This allowed us to achieve a reduction in the installed power of RES. For accepted values, the ratio PPVR:PWR:PL = 3:0.36:1 was possible. For comparison, the ratio in [5] was PPVR:PWR:PL = 3.27:1:1.
Principles of implementation with the use of one tariff or two (with a night tariff) were proposed. With one tariff, the night charge of the SB from the grid was not used; only one cycle of deep discharge of the SB in the evening peak was used. Deep SB discharge was minimal according to the RES generation and was no more than 50% in winter. This helped us to increase the SB service life. In the option with a night tariff, there was only one cycle of discharge of tSB at a high generation of RES. SB charge at night was carried out in the mode of reference of the current, which helped to ensure the balance of powers in the system without energy generation for the grid or the use of a load dump. With both options, there was reduced consumption from the grid during the hours of peak demand, until full exclusion was achieved.
The results of modeling showed the potential for reducing the energy costs of consumption from the grid from 2.8 times (winter) until a complete exclusion (summer) with one tariff. This corresponded to the desired cost reduction value with the adopted LO load schedule. When there is a night tariff of 0.5, the possibilities of cost reduction are great, and on some days, when WG generation is low (June), the chances are even higher (up to 90%). The system is critical when there is a deviation from the forecasted data (on the downside) and when the generation is on the average monthly level for the spring-autumn period. This leads to a reduction in RES energy use. A degree of correction is possible when controlling the process of battery discharge according to the actual generation of RES.
The results obtained for specific conditions demonstrate the possibility of using the photovoltaic system with an auxiliary WG for LO. The proposed solutions can be used both in the design of new systems for LO and in the modernization of existing photovoltaic systems.
Author Contributions
Conceptualization, O.S., I.S. and M.K.; methodology, O.S., I.S. and M.K.; validation, D.M. and I.S.; formal analysis, I.S. and D.M.; investigation, O.S., I.S. and D.M.; resources, I.S. and D.M.; data curation, O.S. and I.S.; writing—original draft preparation, O.S. and I.S.; writing—review and editing, M.K.; visualization, I.S. and D.M.; supervision, M.K. All authors have read and agreed to the published version of the manuscript.
Funding
This work was supported by the Slovak Research and Development Agency under the contracts APVV-19-0576, APVV-21-0312 and SK-UA-21-0024.
Institutional Review Board Statement
Not applicable.
Informed Consent Statement
Not applicable.
Data Availability Statement
Not applicable.
Acknowledgments
This publication was issued thanks to support from the Ministry of Education and Science of Ukraine through the joint Ukrainian-Slovak R&D project “Energy management improvement of hybrid photovoltaic systems of local objects with storage batteries” (0122U002588) run between Kyiv National University of Technologies and Design (Ukraine) and the Technical University of Košice (Slovakia).
Conflicts of Interest
The authors declare no conflict of interest. The funders had no role in the design of the study; in the collection, analyses, or interpretation of data; in the writing of the manuscript, or in the decision to publish the results.
Nomenclature
| PV | Photovoltaic battery |
| WG | Wind generator |
| RES | Renewable energy sources |
| SB | Storage battery |
| LO | Local object |
| DG | Distribution grid |
| PCC | Point of common coupling |
| MPPT | Maximum power point tracking |
| PPV | PV power generation (W) |
| PW | Power generation of the wind generator (W) |
| PL | Load power (W) |
| Pg | Power consumption from the grid (W) |
| PPVR | Rate (installed) power of photovoltaic battery (W) |
| PWR | Rate (installed) power of wind generator (W) |
| Ud | DC link voltage (V) |
| UB | Battery voltage (V) |
| Ug | Grid voltage (V) |
| IB | Current of battery (A) |
| Ig | Current at point of common coupling with the grid (A) |
| IPV | Current of photovoltaic battery (A) |
| WPV | Energy generation of photovoltaic battery (Wh) |
| WW | Energy generation of wind generator (Wh) |
| WR | Total energy generation of photovoltaic battery and wind generator (Wh) |
| WB | Battery energy capacity (Wh) |
| Wg | Energy consumption from the grid (Wh) |
| WL | Load energy consumption (Wh) |
| WPVAVD | Average value of energy, generated by photovoltaic battery per day (Wh) |
| WWA VD | Average value of energy, generated by wind generator per day (Wh) |
| CB or QR | Capacity of battery or rated state of charge (Ah) |
| Q* | Battery state of charge (%) |
| Q*d | Battery state of charge when switching to constant voltage charge mode (%) |
| ηC | Overall efficiency of converter and inverter (p.u.) |
| ηB | Battery efficiency (p.u.) |
| mP | Coefficient of recalculation of photovoltaic battery power (p.u.) |
| m | Coefficient of recalculation of wind power (p.u.) |
| kE | Cost reduction factor for the energy consumed from the grid (p.u.) |
| t, t1, t2… t7 | Time points for load schedule [h] |
| Td | Day tariff rate (p.u.) |
| Tn | Night tariff rate (p.u.) |
References
- Kartite, J.; Cherkaoui, M. Study of the different structures of hybrid systems in renewable energies: A review. Energy Procedia 2019, 157, 323–330. [Google Scholar] [CrossRef]
- Ramoji, S.K.; Rath, B.B.; Kumar, D.V. Optimum Design of a Hybrid PV/Wind Energy System Using Genetic Algorithm (GA). IOSR J. Eng. 2014, 4, 38–48. [Google Scholar] [CrossRef]
- Kumar, N.M.; Chopra, S.S.; Chand, A.A.; Elavarasan, R.M.; Shafiullah, G.M. Hybrid Renewable Energy Microgrid for a Residential Community: A Techno-Economic and Environmental Perspective in the Context of the SDG7. Sustainability 2020, 12, 3944. [Google Scholar] [CrossRef]
- Kamjoo, A.; Maheri, A.; Putrus, G.A.; Dizqah, A.M. Optimal Sizing of Grid-Connected Hybrid Wind-PV Systems with Battery Bank Storage. In Proceedings of the World Renewable Energy Forum, WREF 2012, Including World Renewable Energy Congress XII and Colorado Renewable Energy Society (CRES), Denver, CO, USA, 13–17 May 2012; pp. 2492–2499. [Google Scholar]
- Menniti, D.; Pinnarelli, A.; Sorrentino, N. A Method to Improve Microgrid Reliability by Optimal Sizing PV/Wind Plants and Storage Systems. In Proceedings of CIRED 2009—The 20th International Conference and Exhibition on Electricity Distribution—Part 2, Prague, Czech Republic, 8–11 June 2009; p. 1. [Google Scholar] [CrossRef] [Green Version]
- Yang, B.; Guo, Y.; Xiao, X.; Tian, P. Bi-level Capacity Planning of Wind-PV-Battery Hybrid Generation System Considering Return on Investment. Energies 2020, 13, 3046. [Google Scholar] [CrossRef]
- Shavolkin, O.; Shvedchykova, I. Improvement of the Multifunctional Converter of the Photoelectric System with a Storage Battery for a Local Object with Connection to a Grid. In Proceedings of the 2020 IEEE KhPI Week on Advanced Technology, KhPIWeek 2020, Kharkiv, Ukraine, 5–10 October 2020; pp. 287–292. [Google Scholar] [CrossRef]
- Shavelkin, A.; Jasim, J.M.J.; Shvedchykova, I. Improvement of the current control loop of the single-phase multifunctional grid-tied inverter of photovoltaic system. East. Eur. J. Enterp. Technol. 2019, 6, 14–22. [Google Scholar] [CrossRef]
- Belaidi, R.; Haddouche, A. A multi-function grid-connected PV system based on fuzzy logic controller for power quality improvement. Przeg. Elektr. 2017, 93, 118–122. [Google Scholar] [CrossRef] [Green Version]
- Vigneysh, T.; Kumarappan, N. Grid interconnection of renewable energy sources using multifunctional grid-interactive converters: A fuzzy logic based approach. Electr. Power Syst. Res. 2017, 151, 359–368. [Google Scholar] [CrossRef]
- Lliuyacc, R.; Mauricio, J.M.; Gomez-Exposito, A.; Savaghebi, M.; Guerrero, J.M. Grid-forming VSC control in four-wire systems with unbalanced nonlinear loads. Electr. Power Syst. Res. 2017, 152, 249–256. [Google Scholar] [CrossRef] [Green Version]
- Shavolkin, O.; Shvedchykova, I.; Kravchenko, O. Three-Phase Grid Inverter for Combined Electric Power System with a Photovoltaic Solar Battery. In Proceedings of the 2019 IEEE International Conference on Modern Electrical and Energy Systems, MEES 2019, Kremenchuk, Ukraine, 23–25 September 2019; pp. 318–321. [Google Scholar] [CrossRef]
- Shavolkin, O.; Shvedchykova, I. Improvement of the Three-Phase Multifunctional Converter of the Photoelectric System with a Storage Battery for a Local Object with Connection to a Grid. In Proceedings of the 25th IEEE International Conference on Problems of Automated Electric Drive. Theory and Practice, PAEP 2020, Kremenchuk, Ukraine, 21–25 September 2020; p. 9240789. [Google Scholar] [CrossRef]
- Conext, S.W. Hybrid Inverter. Available online: https://www.se.com/ww/en/product-range-presentation/61645-conext-sw/ (accessed on 1 May 2022).
- Zsiborács, H.; Pintér, G.; Vincze, A.; Birkner, Z.; Baranyai, N.H. Grid balancing challenges illustrated by two European examples: Interactions of electric grids, photovoltaic power generation, energy storage and power generation forecasting. Energy Rep. 2021, 7, 3805–3818. [Google Scholar] [CrossRef]
- Shavelkin, A.A.; Gerlici, J.; Shvedchykova, I.O.; Kravchenko, K.; Kruhliak, H.V. Management of power consumption in a photovoltaic system with a storage battery connected to the network with multi-zone electricity pricing to supply the local facility own needs. Electr. Eng. Electromech. 2021, 2, 36–42. [Google Scholar] [CrossRef]
- Shavolkin, O.; Shvedchykova, I.; Demishonkova, S.; Pavlenko, V. Increasing the efficiency of hybrid photoelectric system equipped with a storage battery to meet the needs of local object with generation of electricity into grid. Przeg. Elektr. 2021, 97, 144–149. [Google Scholar] [CrossRef]
- Forecast.Solar. Available online: https://forecast.solar/ (accessed on 1 May 2022).
- Iyengar, S.; Sharma, N.; Irwin, D.; Shenoy, P.; Ramamritham, K. SolarCast—An Open Web Service for Predicting Solar Power Generation in Smart Homes. In Proceedings of the 1st ACM Conference on Embedded Systems for Energy-Efficient Buildings, BuildSys 2014, Memphis, TN, USA, 3–6 November 2014; pp. 174–175. [Google Scholar] [CrossRef]
- Central Geophysical Observatory Named after Boris Sreznevsky. Available online: http://cgo-sreznevskyi.kyiv.ua/index.php?lang=en&fn=k_klimat&f=kyiv (accessed on 1 July 2022).
- Vetrogenerator. Available online: http://vetrogenerator.com.ua/base/map/12-karta-vetrov-ukrainy.html (accessed on 1 July 2022).
- Photovoltaic Geographical Information System. Available online: https://re.jrc.ec.europa.eu/pvg_tools/en/tools.html#SA (accessed on 1 May 2022).
- Nicolson, M.L.; Fell, M.J.; Huebner, G.M. Consumer demand for time of use electricity tariffs: A systematized review of the empirical evidence. Renew. Sustain. Energy Rev. 2018, 97, 276–289. [Google Scholar] [CrossRef]
- Davis, M.J.M.; Hiralal, P. Batteries as a Service: A New Look at Electricity Peak Demand Management for Houses in the UK. Procedia Eng. 2016, 145, 1448–1455. [Google Scholar] [CrossRef]
- Badawy, M.O.; Cingoz, F.; Sozer, Y. Battery Storage Sizing for a Grid Tied PV System Based on Operating Cost Minimization. In Proceedings of the ECCE 2016—IEEE Energy Conversion Congress and Exposition, Milwaukee, WI, USA, 18–22 September 2016; p. 7854896. [Google Scholar] [CrossRef]
- Krishnamoorthy, M.; Periyanayagam, A.D.V.R.; Santhan Kumar, C.; Praveen Kumar, B.; Srinivasan, S.; Kathiravan, P. Optimal Sizing, Selection, and Techno-Economic Analysis of Battery Storage for PV/BG-based Hybrid Rural Electrification System. IETE J. Res. 2020, 1–16. [Google Scholar] [CrossRef]
- Traore, A.; Taylor, A.; Zohdy, M.; Peng, F. Modeling and Simulation of a Hybrid Energy Storage System for Residential Grid-Tied Solar Microgrid Systems. J. Power Energy Eng. 2017, 5, 28–39. [Google Scholar] [CrossRef] [Green Version]
- VaultTec. Vertical WG. Available online: https://vaulttec.org.ua/p559274110-vertikalnyj-vetrogenerator-kvt.html (accessed on 1 May 2022).
- Data Sheet. Lithium Iron Phosphate Battery (LiFePO4) 12.8V 150Ah. Available online: https://www.eco-greenenergy.com/wp-content/uploads/2021/12/EGE-LiFePO4-Battery-12.8V150Ahd.pdf (accessed on 1 May 2022).
Figure 1.
Structure of PV-WG system.
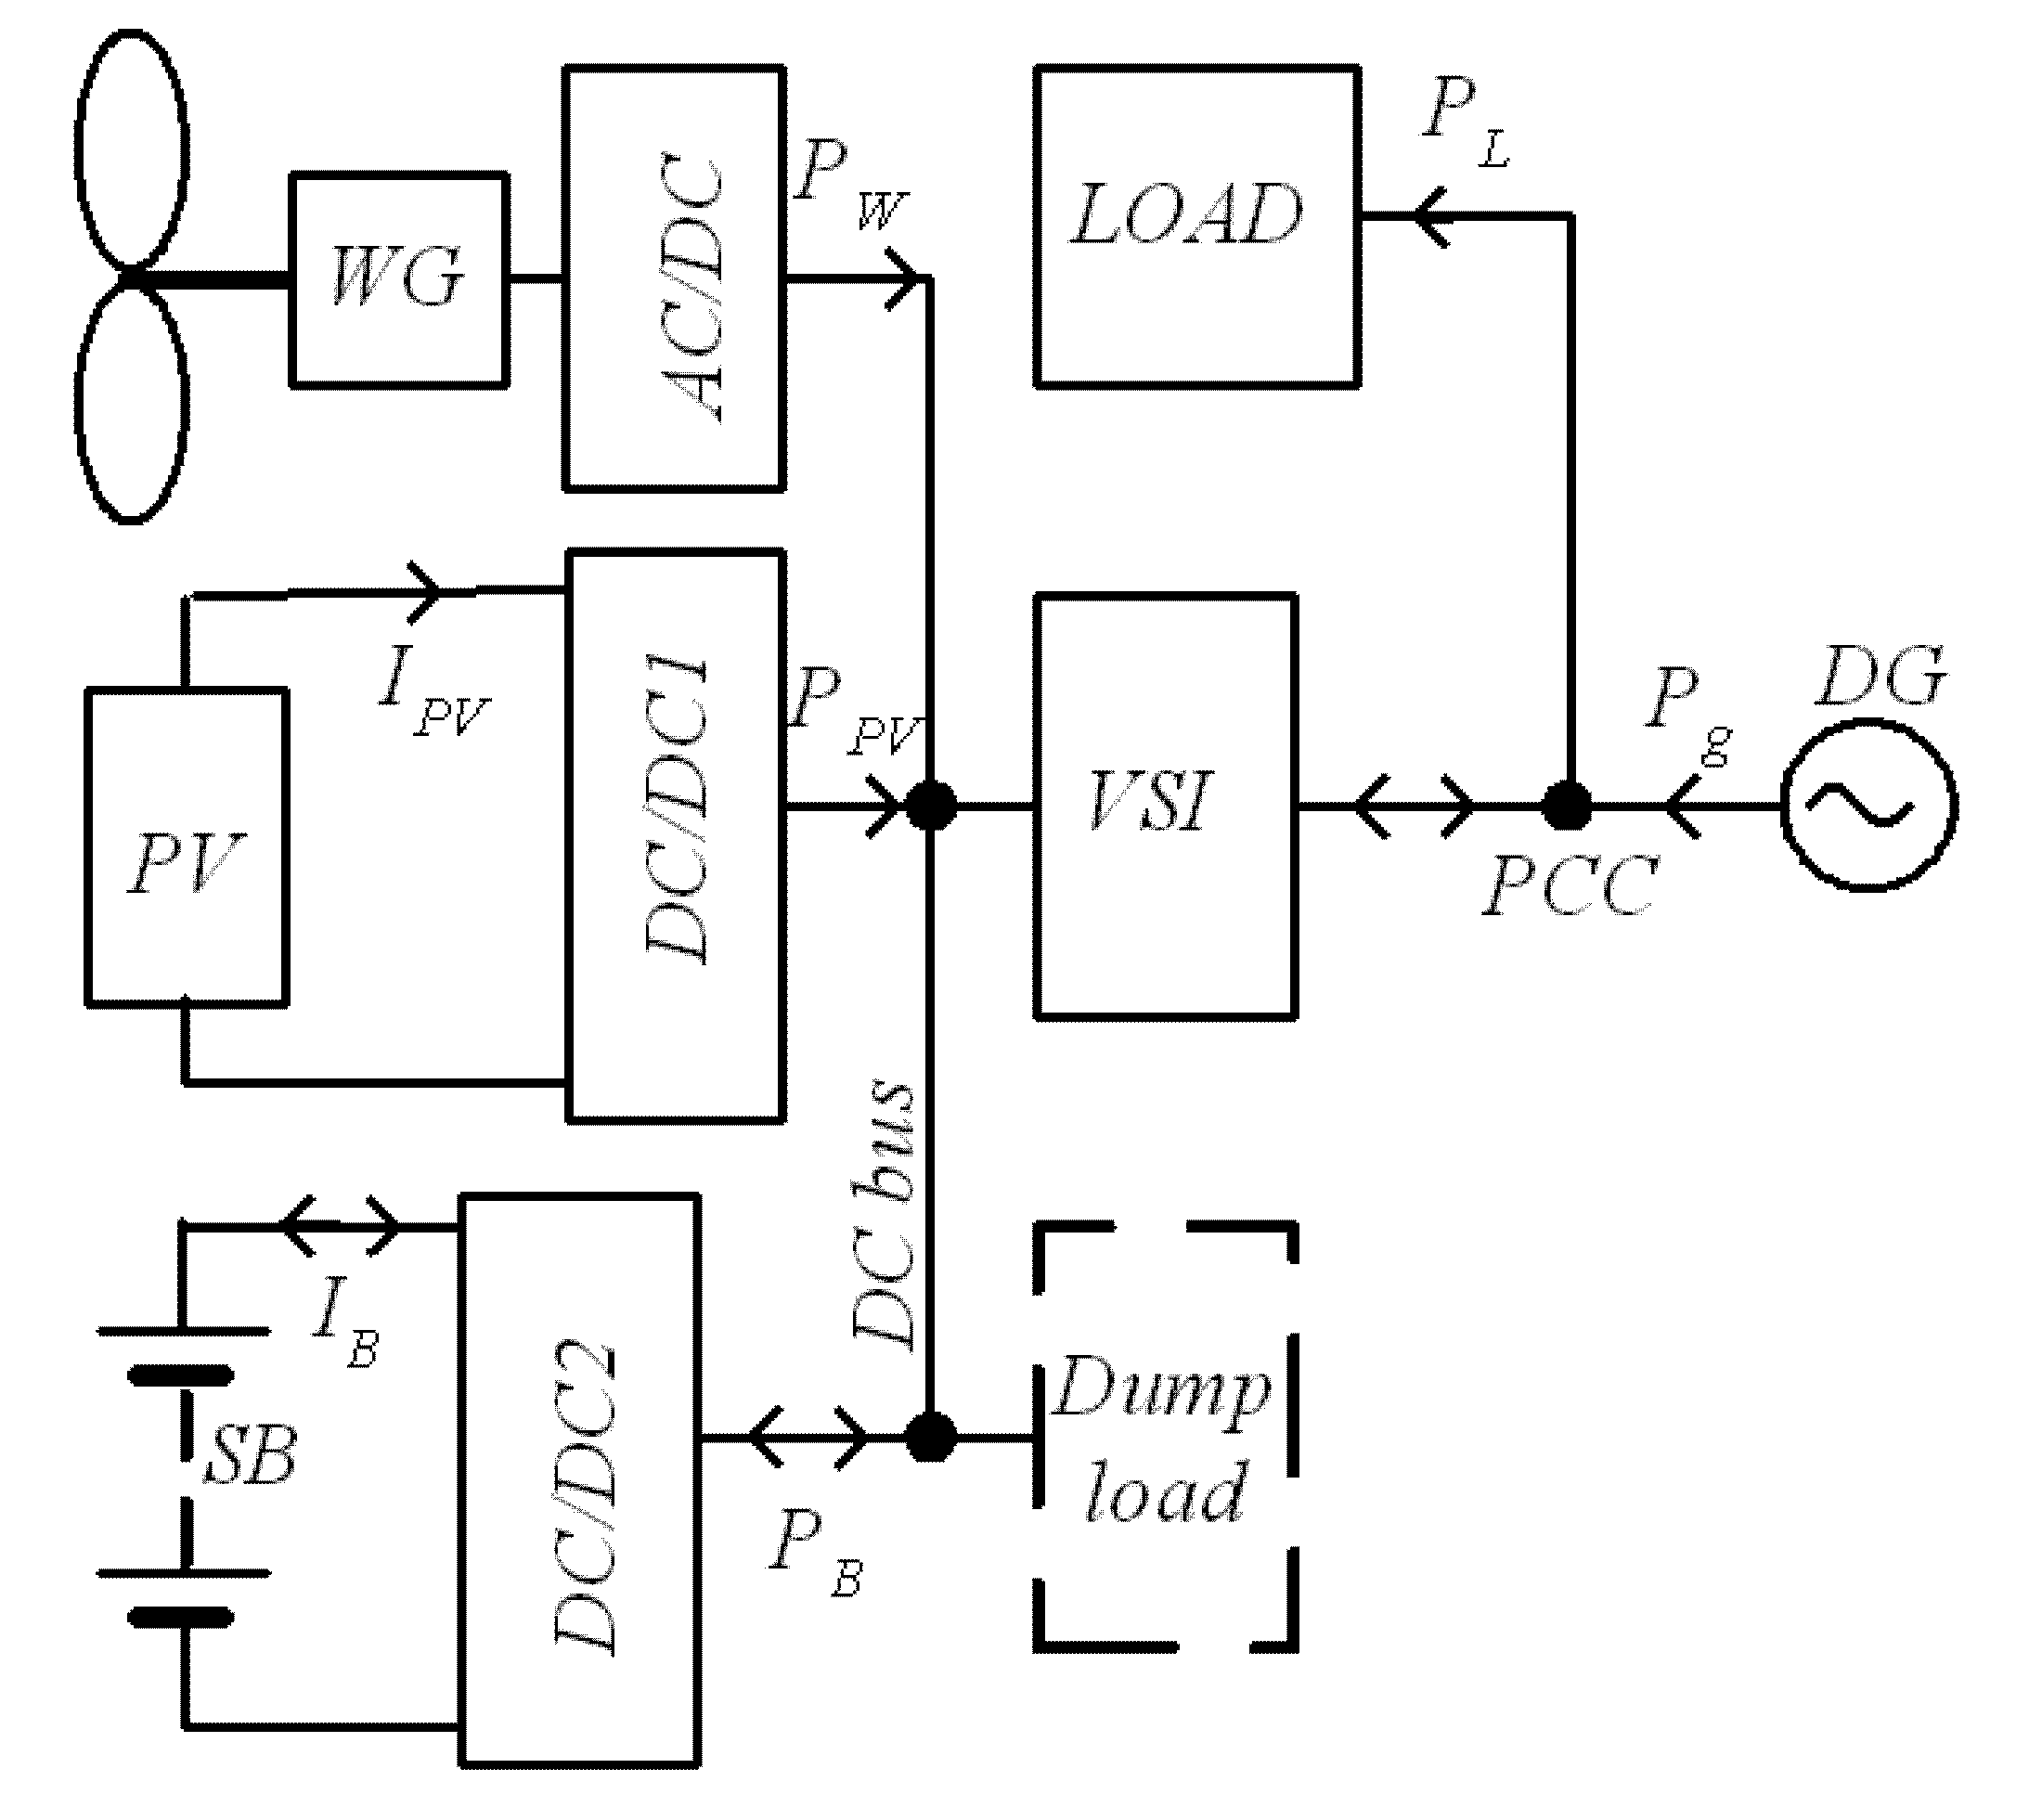
Figure 2.
Oscillograms for December day.

Figure 3.
Oscillograms for February day: (a) Using the night SB charge. (b) Without the night SB charge from the grid.
Figure 3.
Oscillograms for February day: (a) Using the night SB charge. (b) Without the night SB charge from the grid.
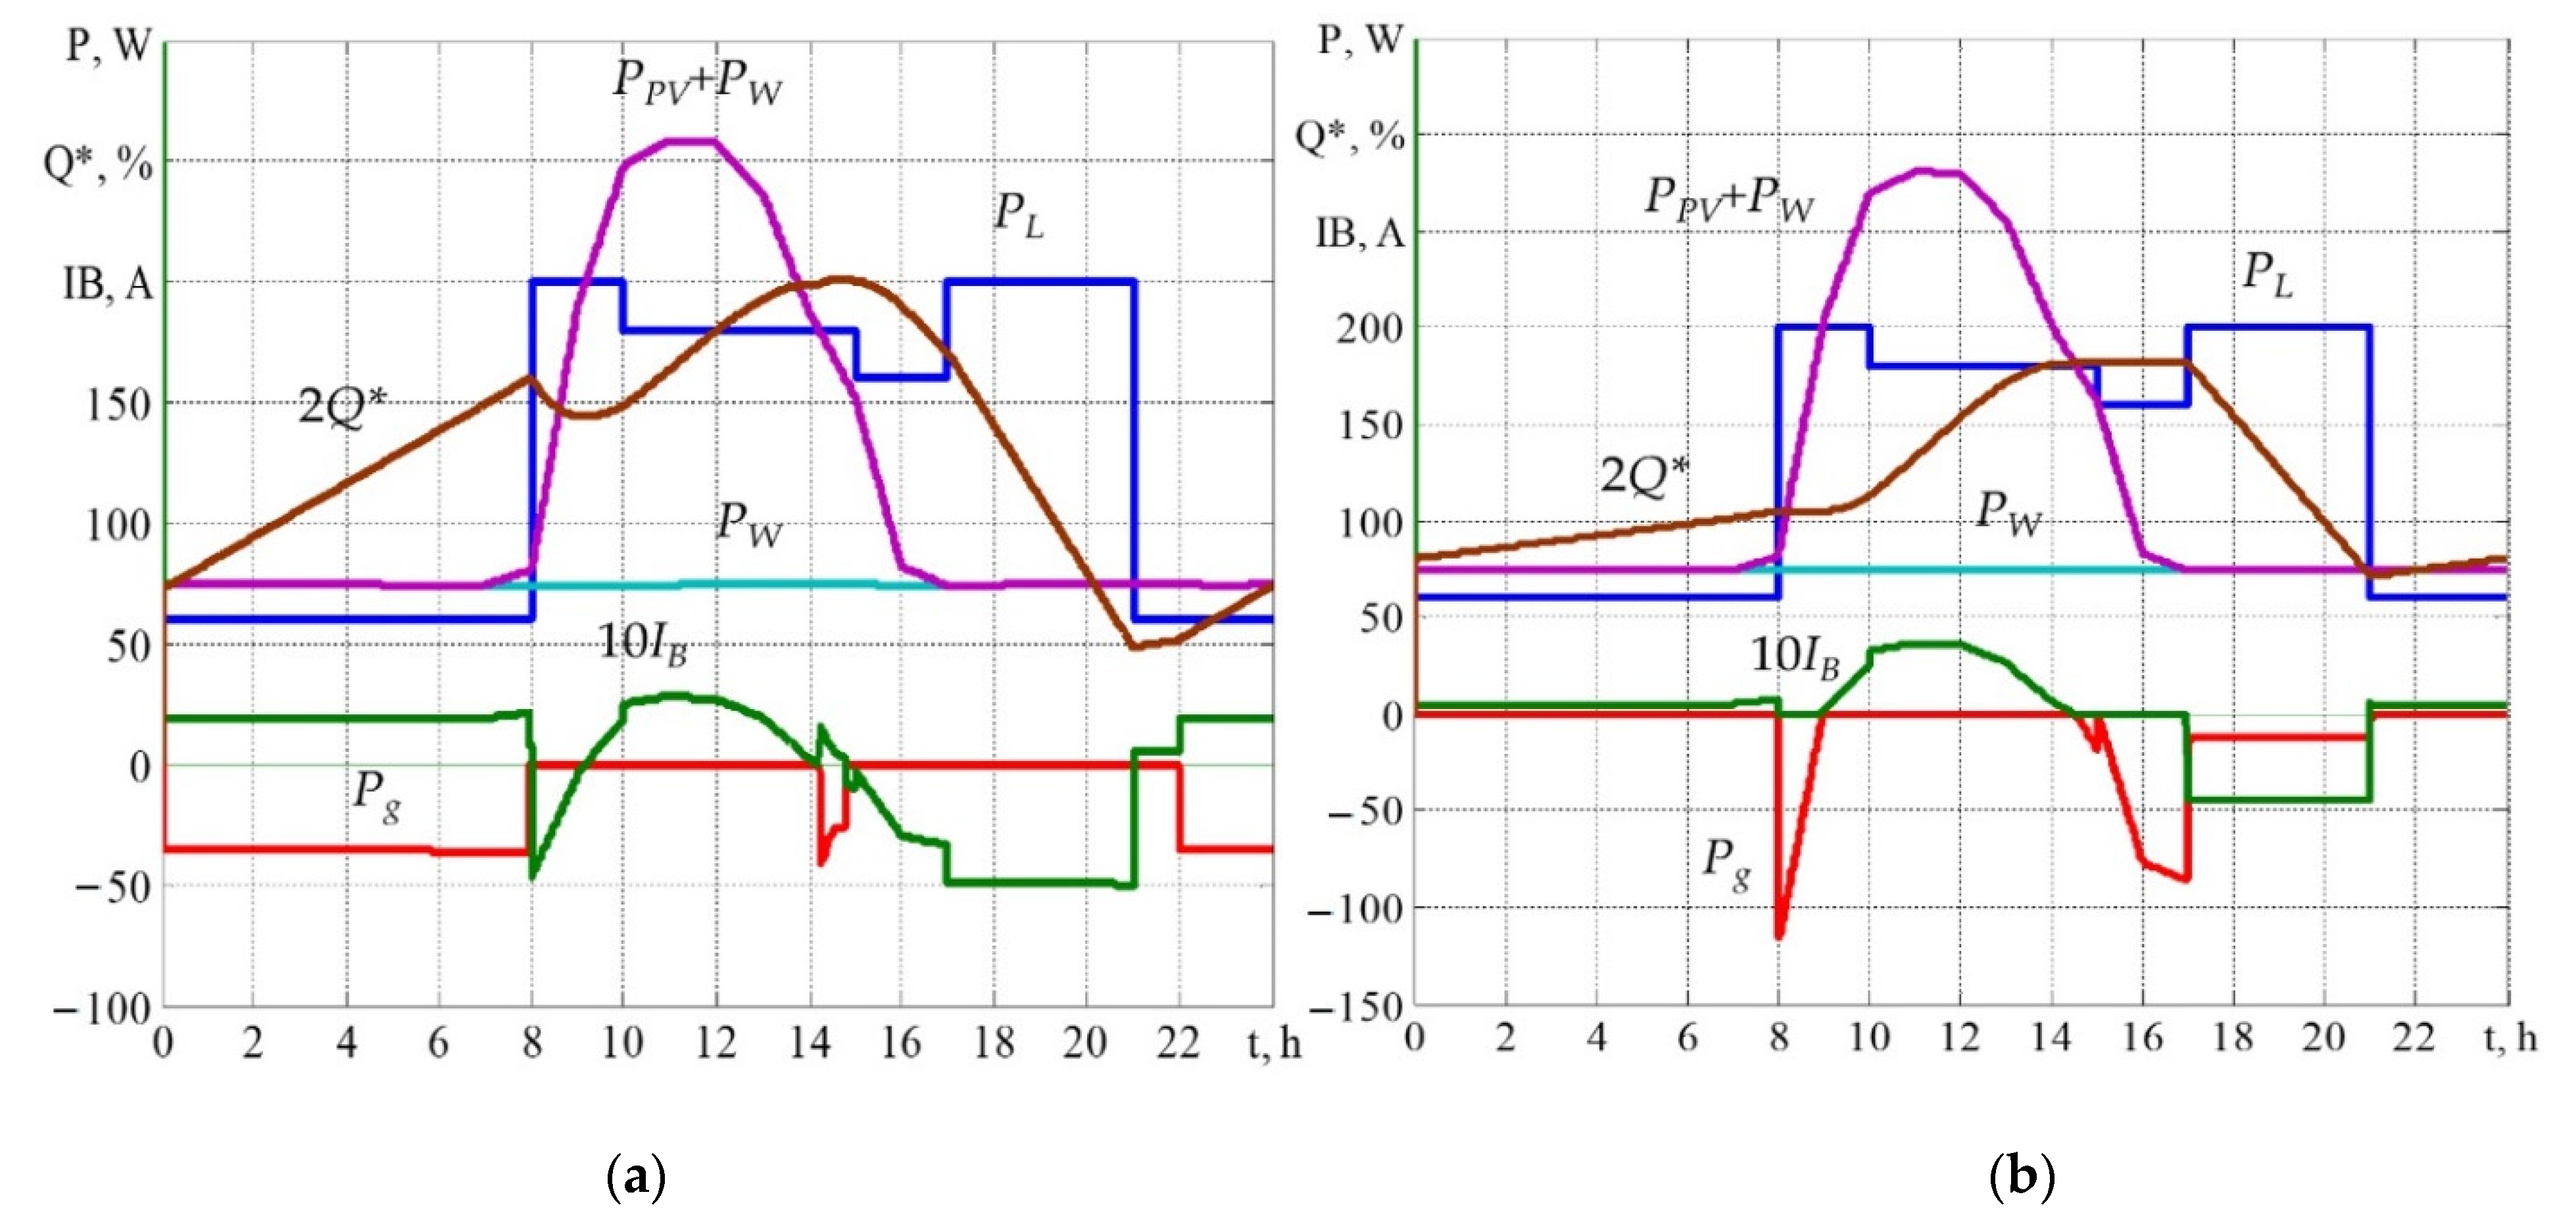
Figure 4.
Oscillograms for July day: (a) Cloudy day. (b) Day with PV generation corresponding to the monthly average value.
Figure 4.
Oscillograms for July day: (a) Cloudy day. (b) Day with PV generation corresponding to the monthly average value.
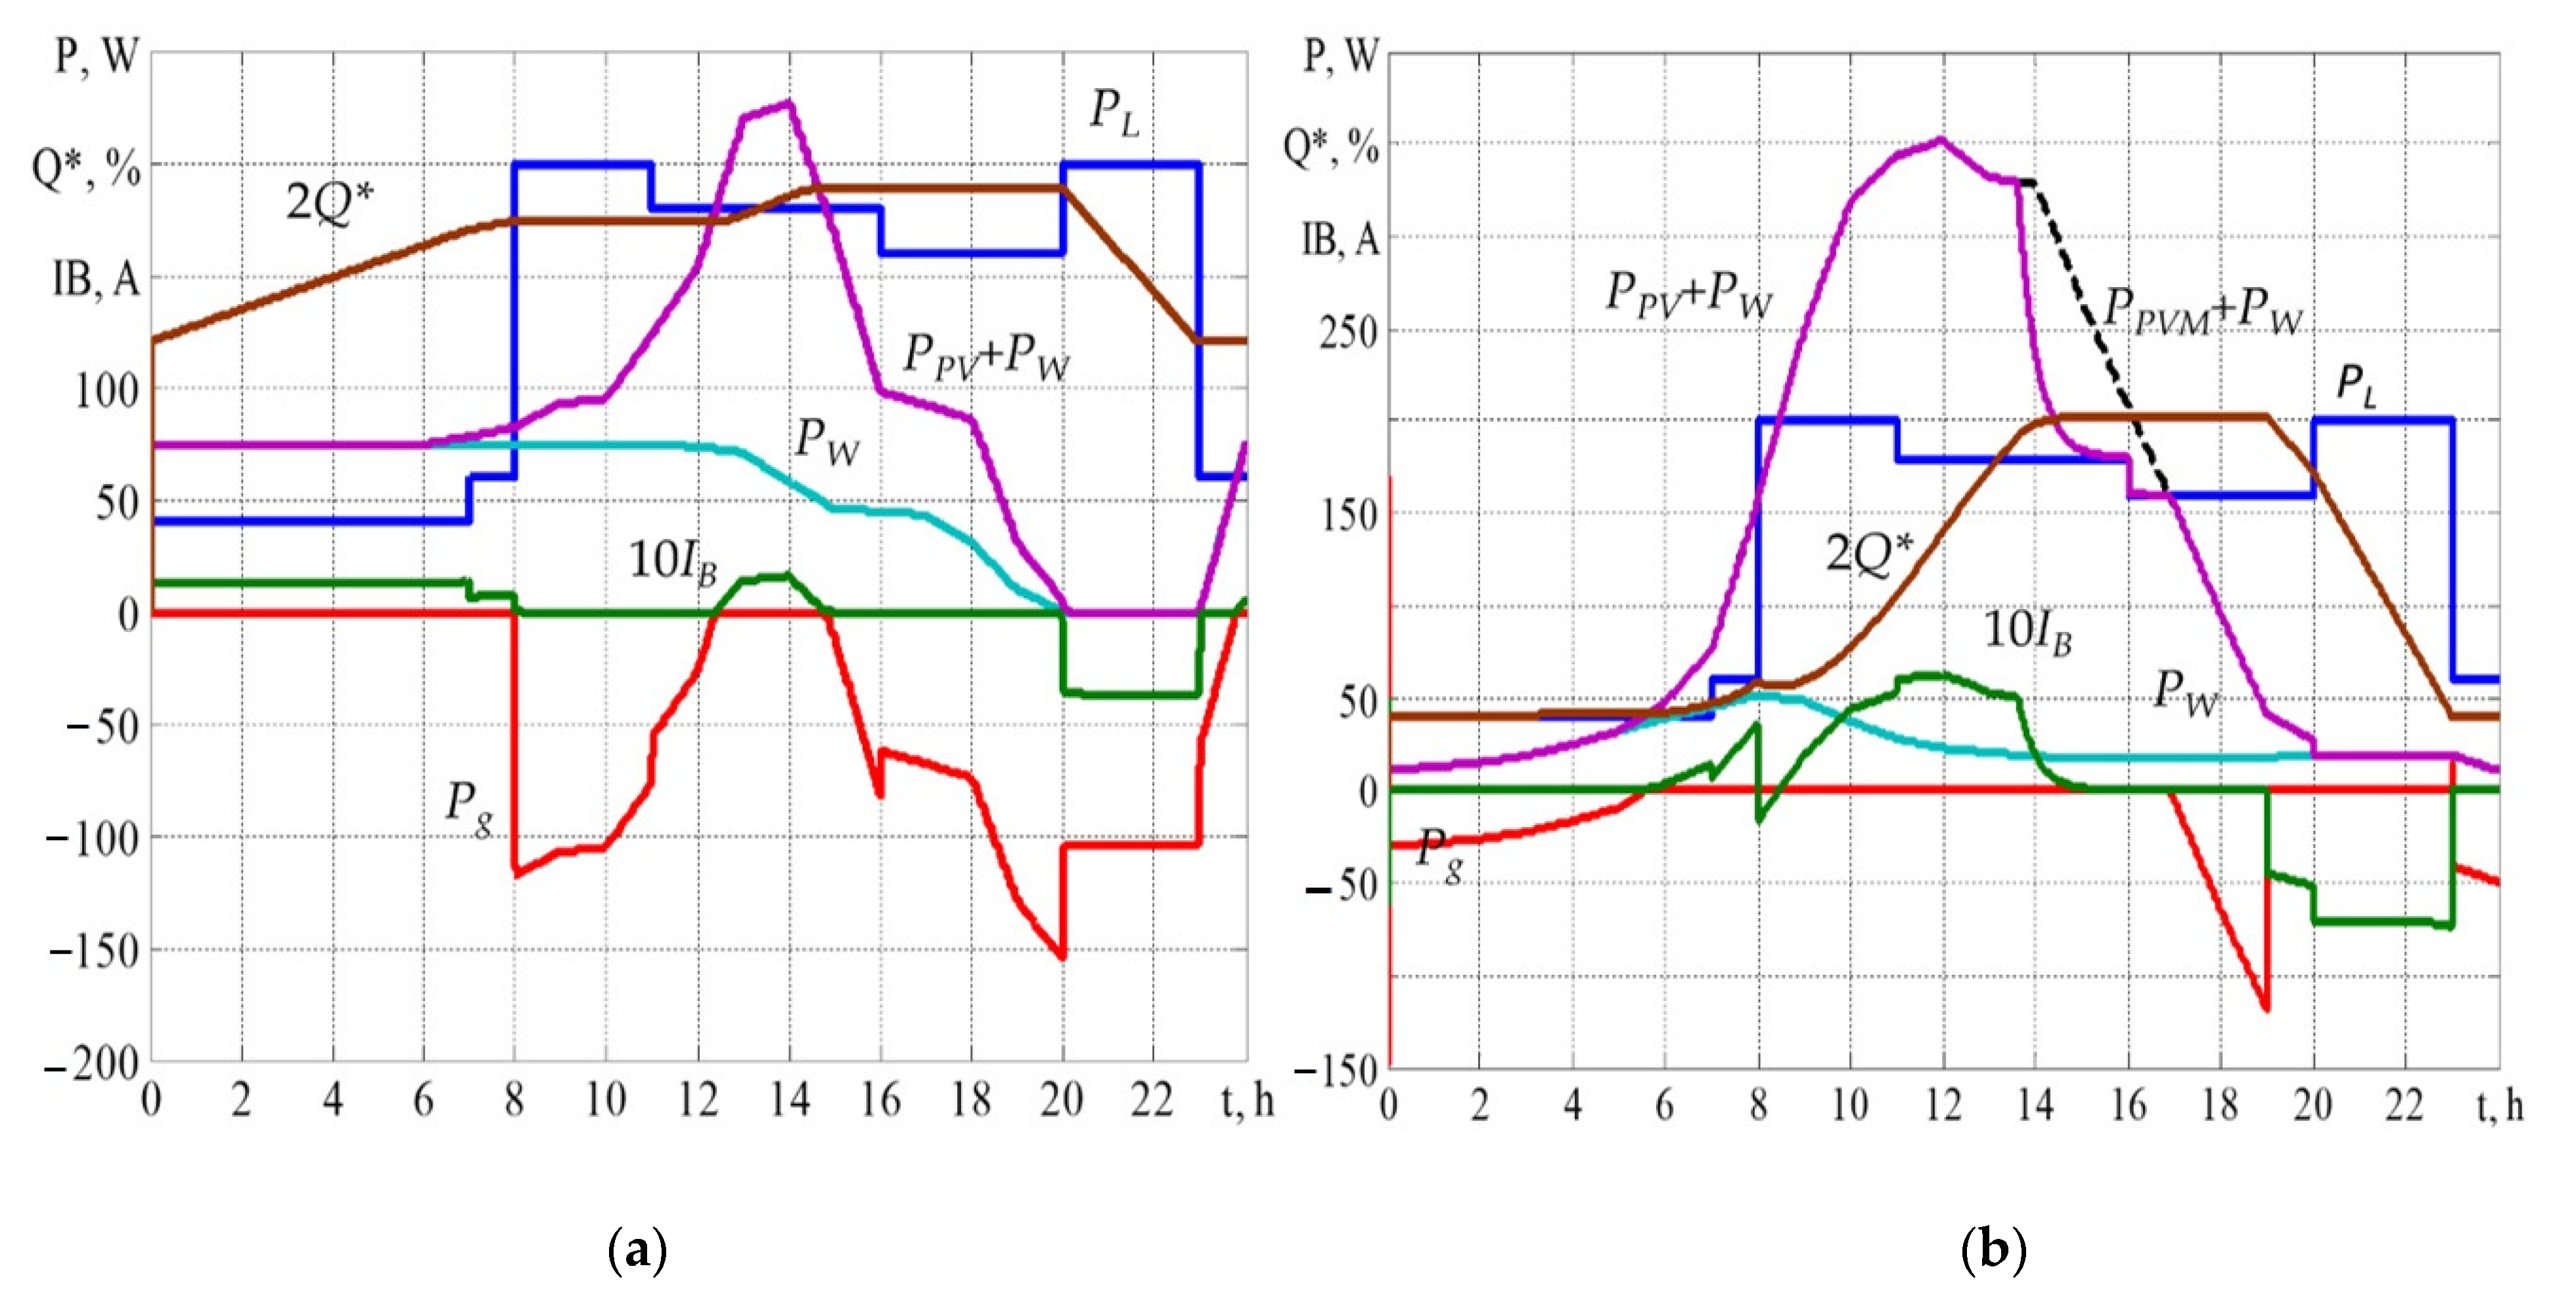
Figure 5.
Oscillograms for March day when the forecasted RES generation is 10% lower than the actual generation: (a) no SB discharge in the morning peak; (b) SB discharge in the morning peak.
Figure 5.
Oscillograms for March day when the forecasted RES generation is 10% lower than the actual generation: (a) no SB discharge in the morning peak; (b) SB discharge in the morning peak.

Table 1.
Load schedule.
| Interval | (t1, t2) | (t2, t3) | (t3, t4) | (t4, t5) | (t5, t6) | (t6, t7) | (t7, t1) |
|---|---|---|---|---|---|---|---|
| Months | Load Power PL | ||||||
| May, June, July, August (t1 = 7.00, t2 = 8.00, t3 = 11.00, t4 = 16.00, t5 = 20.00, t6 = 23.00, t7 = 24.00) | PL12 = 0.3PL | PL23 = PL | PL34 = 0.9PL | PL45 = 0.8PL | PL56 = PL | PL67 = 0.3PL | PL71 = 0.2PL |
| November, December, January, February (t1 = 6.00, t2 = 8.00, t3 = 10.00, t4 = 15.00, t5 = 17.00, t6 = 21.00, t7 = 23.00) | PL12 = 0.3PL | PL23 = PL | PL34 = 0.9PL | PL45 = 0.8PL | PL56 = PL | PL67 = 0.3PL | PL71 = 0.3PL |
| March, April, September, October (t1 = 6.00, t2 = 8.00, t3 = 10.00, t4 = 15.00, t5 = 18.00, t6 = 22.00, t7 = 23.00) | PL12 = 0.3PL | PL23 = PL | PL34 = 0.9PL | PL45 = 0.8PL | PL56 = PL | PL67 = 0.3PL | PL71 = 0.3PL |
Table 2.
Average PV and WG generation by month.
| Month | Jan. | Feb. | Mar. | Apr. | May | Jun. | Jul. | Aug. | Sep. | Oct. | Nov. | Dec. |
|---|---|---|---|---|---|---|---|---|---|---|---|---|
| WPVAVDK, kWh | 1.34 | 2.12 | 3.47 | 4.171 | 0.98 | 1.81 | 2.83 | 3.83 | 4.26 | 4.48 | 4.37 | 1.14 |
| WPVAVD, kWh | 0.98 | 1.81 | 2.83 | 3.83 | 4.26 | 4.48 | 4.37 | 4.16 | 3.52 | 2.49 | 0.96 | 1.03 |
| WPV23, kWh | 0.166 | 0.31 | 0.55 | 0.52 | 1.15 | 1.17 | 1.13 | 1.08 | 0.56 | 0.33 | 0.22 | 0.21 |
| WPV34, kWh | 0.78 | 1.31 | 1.84 | 2.38 | 2.43 | 2.27 | 2.5 | 2.45 | 2.27 | 1.74 | 0.69 | 0.8 |
| WPV45, kWh | 0.038 | 0.16 | 0.32 | 0.84 | 0.53 | 0.63 | 0.61 | 0.53 | 0.72 | 0.39 | 0.03 | 0.021 |
| WWAVD, kWh | 37.51 | 35.72 | 38.531 | 33.485 | 29.789 | 32 | 29.8 | 28.429 | 32.97 | 31.897 | 34.122 | 37.93 |
| WW56, kWh | 6.33 | 5.88 | 6.32 | 5.53 | 3.3 | 3.35 | 3.29 | 3.17 | 5.245 | 5.3 | 5.5 | 6.32 |
| WW62, kWh | 17 | 16.3 | 15.55 | 13.3 | 10.05 | 10.1 | 9.7 | 9.5 | 12.9 | 12.6 | 14.9 | 17.1 |
| WW24, kWh | 9.4 | 9.06 | 11.75 | 10.2 | 11.15 | 12.34 | 11.37 | 10.45 | 10.56 | 9.86 | 9.24 | 9.67 |
Table 3.
Dependence of coefficient of electricity cost reduction kE on the coefficient of PV power recalculation mp.
Table 3.
Dependence of coefficient of electricity cost reduction kE on the coefficient of PV power recalculation mp.
| Coefficient | Calculated Values, p.u. | ||||
|---|---|---|---|---|---|
| mp | 0.555 | 0.598 | 0.63 | 0.67 | 0.716 |
| kE (December) | 2.63 | 2.73 | 2.808 | 2.9 | 3 |
| kE (Spring-Autumn) | 2.63 | 3 | 3.4 | 4 | 5.09 |
Table 4.
Operation modes of the system with a one-tariff plan.
| Interval Variable | (t6, t2), t62 | (t2, tR), t2R | tR < t5, (tR, t6), fR | tR ≥ t5, (t5, t6), hR | |
|---|---|---|---|---|---|
| Pg | If PR·ηC > PL, I1gm = 0, Pg = 0 | If PR·ηC > PL, I1gm = 0, Pg = 0 | If PR·ηC > PL, I1gm = 0, Pg = 0 | I1gm = 0, Pg = 0 | |
| If PR·ηC ≤ PL, VCIg → I1gm ≥ 0, Pg = (PRηC − PL) ≤ 0 | If PR·ηC ≤ PL, VCIg → I1gm ≥ 0, Pg = (PRηC − PL) ≤ 0 | If PR·ηC ≤ PL, VCIg → I1gm ≥ 0, Pg = (PRηC − PL) ≤ 0 | |||
| Reference I1PV | MPPT PPV = PPVM | MPPT PPV = PPVM | VCIPV →I1PV →PPVF, PPVFηC + PWηC = PL + PB | MPPT PPV = PPVM | MPPT PPV = PPVM |
| MPPT PPV = PPVM | |||||
| Reference I1B | IB= IB(Q*) | VCIB → I1B, IB = PL/UB | I1B= PB/UB | ||
| IB = 0 | IB = 0 | IB = 0 | |||
| SOC | Q*6→ Q*2 | Q* ≤ Q*d | Q* > Q*d | Q* → Q*6 | Q* → Q*6 |
Table 5.
Operation modes of the system with a two-tariff plan.
| Interval Variable | (t1, t2), t62 | (t2, t3), t23 | (t3, tR), t3R | (tR, t6), t56 | |
|---|---|---|---|---|---|
| Pg | Pg≤ 0, Pg = (PRηC − PB − PL) | I1gm = 0, Pg = 0 | If PRηC ≥ PL, I1gm = 0, Pg = 0 | If PRηC ≥ PL, I1gm = 0, Pg = 0 | I1gm = 0, Pg = 0 |
| If PRηC < PL, VCIg → I1gm, ≥ 0, Pg = PPVηC − PL − PB ≤ 0 | If PRηC < PL, VCIg → I1gm ≥ 0, Pg = PPVηC − PL − PB ≤ 0 | ||||
| Reference I1PV | MPPT PPV = PPVM | MPPT PPV = PPVM | MPPT PPV = PPVM | VCIPV →I1PV → PPVF PPVFηC + PWηC = PL + PB | MPPT PPV = PPVM |
| MPPT PPV = PPVM | |||||
| Reference I1B | VCIB → I1B ≥ 0, if Q* ≤ Q*d, IB = IBREF if Q* > Q*d, IB ≤ IB(Q*) | IB = IB(Q*) | VCIB → I1B IB = PL/UB | ||
| I1B = 0.1CB | I1B = 0.1CB, IB = IB(Q*) | ||||
| SOC | Q*6→ Q*2 | Q*2→ Q*3 | Q* ≤ Q*d | Q* > Q*d | Q* → Q*6 |
Table 6.
Results of simulation throughout the year.
| Indicator | Jan. | Feb. | Mar. | Apr. | May | Jun. | Jul. | Aug. | Sep. | Oct. | Nov. | Dec. |
|---|---|---|---|---|---|---|---|---|---|---|---|---|
| One tariff, without a night charge from the grid, mP = 0.67 (+ consumption from the grid is practically absent) | ||||||||||||
| ΔQ*MAX, % | 17.03 | 50.8 | 80 | 80 | 60 | 80 | 80 | 80 | 80 | 80 | 12.6 | 9.32 |
| kE1 | 3.904 | 13.49 | 15.39 | 32.14 | + | 14.77 | 11.31 | 40.54 | 4.34 | 8.164 | 3.8 | 3.132 |
| One tariff, without a night charge from the grid, mP = 0.6 | ||||||||||||
| ΔQ*MAX, % | 12.1 | 40.8 | 69 | 80 | 80 | 80 | 80 | 80 | 71 | 78.5 | 12.3 | 6.72 |
| kE1 | 3.637 | 9.275 | 9.67 | 26.48 | + | 14.16 | 10.36 | 32.86 | 3.807 | 7.356 | 3.53 | 2.93 |
| Night charge, two tariffs, mP = 0.6 | ||||||||||||
| kE1 | 3.2 | 7.637 | 9.811 | 26.8 | + | 16.28 | 10.52 | + | 3.706 | 7.66 | 3.149 | 2.745 |
| kEn | 3.678 | 11 | 13.24 | 27.23 | + | 27.49 | 12.56 | + | 4.716 | 7.276 | 3.505 | 3,43 |
| Night charge, two tariffs, mP = 0.67 | ||||||||||||
| kE1 | 3.393 | 11.9 | 15.39 | 32.3 | + | 16.37 | 11.25 | + | 4.447 | 8.164 | 3.321 | 2.918 |
| kEn | 3.933 | 16 | 20.64 | 33.4 | + | 27.73 | 13.65 | + | 5.483 | 7.764 | 3.736 | 3.64 |
Publisher’s Note: MDPI stays neutral with regard to jurisdictional claims in published maps and institutional affiliations. |
© 2022 by the authors. Licensee MDPI, Basel, Switzerland. This article is an open access article distributed under the terms and conditions of the Creative Commons Attribution (CC BY) license (https://creativecommons.org/licenses/by/4.0/).
Share and Cite
MDPI and ACS Style
Shavolkin, O.; Shvedchykova, I.; Kolcun, M.; Medved’, D. Improvement of the Grid-Tied Solar-Wind System with a Storage Battery for the Self-Consumption of a Local Object. Energies 2022, 15, 5114. https://doi.org/10.3390/en15145114
AMA Style
Shavolkin O, Shvedchykova I, Kolcun M, Medved’ D. Improvement of the Grid-Tied Solar-Wind System with a Storage Battery for the Self-Consumption of a Local Object. Energies. 2022; 15(14):5114. https://doi.org/10.3390/en15145114
Chicago/Turabian StyleShavolkin, Olexandr, Iryna Shvedchykova, Michal Kolcun, and Dušan Medved’. 2022. "Improvement of the Grid-Tied Solar-Wind System with a Storage Battery for the Self-Consumption of a Local Object" Energies 15, no. 14: 5114. https://doi.org/10.3390/en15145114
Note that from the first issue of 2016, this journal uses article numbers instead of page numbers. See further details here.