Abstract
Many dyeing and finishing factories generally use old-fashioned dyeing machines. A key issue when using these machines is that the dyeing tank cannot detect entanglement problems, which may result in a lower dyeing quality. In this paper, imbalanced data with ensemble machine learning, such as Extreme Gradient Boosting (XGBoost) and random forest (RF), are integrated to predict the possible states of a dyeing machine, including normal operation, entanglement warning, and entanglement occurrence. To verify the results obtained using the proposed method, we worked with industry−academia collaborators. We collected 1,750,977 pieces of data from 1848 batches. The results obtained from the analysis show that after employing the Borderline synthetic minority oversampling technique and the Tomek link to deal with the data imbalance, combined with the model established by XGBoost, the prediction accuracy of the normal operation states, entanglement warning, and entanglement occurrence were 100%, 94%, and 96%, respectively. Finally, the proposed entanglement detection system was connected with the factory’s central control system using a web application programming interface and machine real-time operational parameter data. Thus, a real-time tangle anomaly warning and monitoring system was developed for the actual operating conditions.
1. Introduction
The various stages in the traditional textile industry are fiber manufacturing, spinning, weaving, and dyeing and finishing. The dyeing and finishing is the most environmental-resource-consuming stage. It is also the most important stage for enhancing the quality of textile products. Many functional clothes are added with special features through dyeing and finishing processes. As the demand for functional clothing and accessories has been steadily growing, the dyeing and finishing quality is crucial for maintaining the competitiveness of the dyeing and finishing industry [1]. In the past, research conducted on dyeing and finishing primarily focused on poor product quality or environmental issues [2,3,4]. The abnormal operation of dyeing machines and the operating conditions have received less attention in the literature. In this study, an early warning mechanism is established using data and warning records of a dyeing machine during the dyeing and finishing process. This mechanism can help with optimizing the dyeing and finishing quality of products and reducing the operational and water costs.
In most cases, small and medium-sized enterprises have been using dyeing machines for more than 20 years. These machines do not have sensors to detect the operating state of the dye vats. Therefore, most operating problems occurring during the dyeing process cannot be detected immediately. The dye vat entanglement is a critical situation, which may occur during the dyeing and finishing process, particularly during the high-temperature dyeing stage. When an entanglement occurs, the cloth is coiled inside the vat body, thereby jamming the machine. To overcome this problem, dyeing and finishing factories employ on-site personnel to conduct visual inspections. By visually inspecting the vat state and using real-time operating information, such as cycle time and machine temperature, a human operator can determine whether an entanglement has occurred using their own experience. In such a case, the operator opens the dye vat to manually disentangle the cloth. However, this method cannot solve the entanglement problem quickly, resulting in low-quality products and financial loss.
In this study, the data associated with the real-time operating state of dyeing machines are collected through the installed Internet of Things module. The operating state is stored in the LogValueFloat database. Then, using the obtained parameter values, we collaborate with the factory’s senior engineers to establish the parameter value ranges during which an entanglement occurs, and we then mark the location of the entanglement. Thus, a system for entanglement warning and an application programming interface (API) for real-time detection and early warning can be developed.
2. Literature Review
Controlling the dyeing quality is a key factor in the dyeing and finishing industry in order to remain competitive. Various types of failures may occur during the dyeing and finishing process. Therefore, detecting the causes of failure and undertaking corrective measures to effectively reduce the occurrence of these problems is crucial [5]. During the dyeing and finishing stage, the cloth is dyed after repeated contact with the dye in the dye vat. The temperature, pH value, and ratio of chemical auxiliaries need to be controlled. Thus, the dye can be repeatedly absorbed through the cloth cycle, and the final product can be dyed completely with an even color. Dyeing is an irreversible process. Therefore, it is impossible to restore a heavily dyed product to a lightly dyed state, indicating that the coloring stage of dyeing and finishing is crucial. Quality issues in dyeing and finishing include batch-to-batch shade variation, dimensional stability, piling, dye spotting, uneven dyeing, and creases. Besides chemical auxiliaries and processing, uneven dyeing can also be caused by improper dyeing cycles. The temperature, nozzle pressure, and ring dye speed can cause creases, and the entanglement during the operating phase of the dye vat can lead to uneven dyeing and creases [6,7].
Ensemble machine learning is capable of achieving better learning results by combining multiple learners. Different learning algorithms achieve different prediction accuracies in a specific application. Therefore, multiple learners can be used to complement each other to enhance the learning effects [8]. The most representative ensemble learning algorithms are bagging, boosting, and stacking.
Some investigations on intelligent early warning systems in machine equipment have been reported in the literature. The random forest algorithm has a high degree of accuracy for classification and a good prediction power. There have been numerous applications of this technology, including failure detection and predictive maintenance [9,10]. Quiroz et al. extracted 13 signals as features and used the random forest method to detect the failure of the motor rotor chain breakage with 98.8% classification accuracy. Their results can be applied to industrial monitoring and fault diagnosis and can assist factories in developing preventive maintenance programs [11]. Guo Zhi-en et al., presented prediction results for key equipment in the petrochemical process. Using machine operation records and sensor data from unexpected shutdowns, they manually marked and categorized the time before a shutdown occurs into three stages and modeled different classifiers based on these stages. Studies have shown that ensemble learning bagged trees can achieve 99% accuracy [12]. Zhang et al. proposed a novel robust ensemble model that integrates extreme learning with multi-activation functions to develop robust and accurate energy analysis models. The simulation results indicate that the proposed model is highly accurate and stable [13]. Using artificial neural networks, Göksu developed an optimal predictive maintenance strategy for ship main engines [14]. Their study found that one method of maximizing the operational capacity is to adopt a systematic and proper maintenance policy, which increases effectiveness and efficiency by reducing downtime. Wen and Guo conducted a model comparison using system optimization, Xtreme gradient boosting (XGBoost), random forest, and support vector machine algorithms. Their results indicated that XGBoost is capable of monitoring a ship’s main engine system quickly and accurately, thus reducing the maintenance and operating cost and improving the availability rate [15]. The researchers pointed out that the integrated learning algorithm achieves better results regarding machine failure and early warnings [16,17].
3. Methodology
In this study, dyeing and finishing factories were systematically monitored. It was found that the types of products produced are largely limited to a certain product type. Therefore, the possibility of entanglement occurring due to problems in the cloth or cloth capacity is low. After discussing the data acquired from the machine operation process with the engineers, we found that the machine operation record curve indicates an obvious change when an entanglement occurs. Therefore, in this study, the data acquired from the machine operation process will be used to develop an early warning system for entanglement prediction.
In addition, past research shows that most of the detection data related to machine failures exhibit imbalances, which affect the performance of the classifier training model. In this study, a five-stage procedure for establishing an entanglement warning model is proposed. Initially, the entanglement position is manually marked. Next, the data imbalance is processed. Subsequently, an ensemble model is established and evaluated. Finally, a Web API for the developed model is connected to the factory’s central control system. In this way, the system can provide immediate feedback on the operating state of the machines. If an entanglement occurs, the production line personnel can eliminate the problem immediately. The flowchart of the proposed process is shown in Figure 1. The following sections presents a detailed description of the proposed solution and research results in accordance with the process structure outlined in Figure 1.
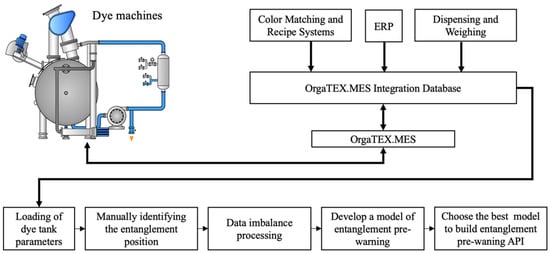
Figure 1.
Flowchart of the proposed to detect entanglement problem.
3.1. Description of Data and Marking of Entanglement Problems
The data used in this study are those sent back by a manufacturer’s dyeing machine sensor to the LogValueFloat database every 30 s through the OrgaTEX system. These data contained 12 variables, including cycle time, temperature, and water volume. Currently, as there is no entanglement sensor to record the exact time of entanglement, we used the temperature and running cycle curves contained in the operation records of each batch and consulted with the factory’s senior engineers to manually mark the time point at which an entanglement occurred.
The senior engineers determined whether an entanglement has occurred based on the time interval during which the temperature and cycle time change simultaneously. As shown in Figure 2, the curve graphs for the set and actual temperature changes are plotted based on the three run cycle times recorded. The engineer’s detection logic is to mark an abnormality when there is a large difference between the set temperature and the actual temperature of the dye cylinder operation. Figure 2a shows an entanglement anomaly recorded by an engineer by drawing a machine operation record curve by hand, where the black area circled is the location of the entanglement abnormality. Figure 2b shows the result of adding the cycle range (orange line) to the entanglement state using operating records.
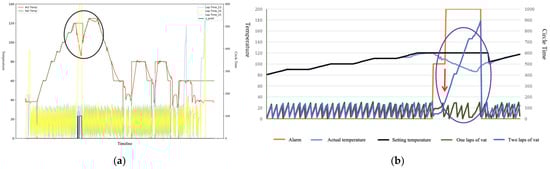
Figure 2.
Timeline changes in the temperature and cycle time. (a) Entanglement anomalies on the curve by hand drawing; (b) result of adding the cycle range to the entanglement state.
The entanglement position marked by purple circles in Figure 2b indicates that the dyeing vat exhibits a significant increase in cycle time for the two laps of vat, corresponding to a simultaneous decrease in the actual temperature and set temperature (red arrows in the Figure 2b). The obvious increase in the cycle time indicates that an entanglement has occurred.
This increase is due to the cloth head magnet’s inability to circulate normally. In addition, the temperature drops significantly, meaning that the dye vat was opened to manually eliminate the entanglement. This caused a drop in the vat’s internal pressure and temperature.
3.2. Data Imbalance
During the operation of a complete batch of dye vats, there is a relatively low probability of entanglement occurring and causing data imbalance. Imbalanced data are affected by overlapping categories, which affect the classifier’s ability to clearly define the grouping boundaries, resulting in overfitting [18]. In this study, the synthetic minority oversampling technique (SMOTE), the borderline SMOTE, and the Tomek link method were all used to deal with the data imbalance.
SMOTE deals with data imbalance by generating similar synthetic samples from a small number of samples. The method finds the k nearest neighbors of . Initially, a neighbor is randomly selected among k neighbors to generate a new sample, and the difference () between and is calculated. A random number η in the range of 0–1 is generated, and then a new sample is generated. In SMOTE, it is not considered whether the generated samples lie at the classification boundary or not. As a result, a misjudgment during the classifier training may occur. Borderline SMOTE solves this problem. It uses the SMOTE method to generate samples from border samples by performing classification into a few categories. The Tomek link removes the positive samples adjacent to the negative samples, so that the samples adjacent to the positive samples are all positive samples.
In this study, four techniques were used to handle the data imbalance, namely, SMOTE, borderline SMOTE, SMOTE + Tomek link, and borderline SMOTE + Tomek link.
3.3. Ensemble Learning Algorithms
Two machine-learning techniques involving random forest (RF) and eXtreme gradient boosting (XGBoost) were utilized in this study. Boosting is similar to bagging. Boosting integrates multiple complementary weak learners into a powerful, comprehensive learner using ensemble learning. The ensemble model is trained on resampled data, and the final prediction is determined by voting for a majority or by calculating an average. RF and XGBoost were developed using gradient tree Boosting supervised learning, as well as classification and regression tree (CART) learning.
The RF method has demonstrated a promising performance as a general-purpose regression method. Combining several randomized decision trees and averaging their predictions, the RF approach has demonstrated an excellent performance in datasets with an extensive number of variables and observations. The algorithm is also flexible enough to be implemented to large-scale tasks, it can be easily adapted to diverse ad hoc learning problems, and it returns measures of variable importance [19,20,21]. Random forest is a machine-learning algorithm that integrates bagging techniques. The advantage of this method is that it can handle high-dimensional data and generate highly accurate classifiers with a fast training time. Random forest algorithms construct classification trees from separate subsets of k samples selected by bootstrapping from the original dataset. Then, based on the objective function, a binary decision tree is used to determine the best partition between two node categories and to maximize information gain. Each of the k subsets is modeled using k decision trees. Finally, the predictions of all of the decision trees are used as complex decisions or averages to calculate the final prediction results.
XGBoost combines multiple decision trees generated by CART into ensemble learning using gradient tree boosting [22,23,24]. It then calculates whether the leaf node generates gains after and before splitting to determine whether its nodes are split, and it adjusts the depth of the tree structure using hyperparameter settings. When a tree is generated, pruning is performed to avoid overfitting. The spanning tree in the m + 1 round learns the true value, and its residual difference from the model-predicted value in the previous round corrects the prediction result to approach the true value. XGBoost exhibits high flexibility because of its variety of parameters that can be set. In addition to the CART-based classifier, it employs a linear classifier. In the traditional gradient-boosted decision tree (GBDT) algorithm, only first-order derivative information can be used [25]. In XGBoost, the second-order Taylor expansion of the cost function is performed to obtain multiple parameter first-order and second-order settings. The normal term and the L2 square sum of the output scores of child nodes can be used to control the complexity of the model, including the number of leaf nodes in the tree. As a result, the model variation can be effectively reduced, the model can be simplified, and overfitting can be avoided. Therefore, XGBoost is better than the traditional GBDT algorithm. Compared with the traditional GBDT algorithm in scikit-learn on the same dataset, XGBoost runs 10 times faster [26].
Shrinkage multiplies the weight of each leaf node by the reduction weight during each iteration. Its purpose is similar to the learning rate of the gradient descent method. Shrinkage reduces the interaction between trees using reduction so that the subsequent spanning tree has a larger effect on model optimization. The eta parameter in XGBoost is set by shrinkage. After each iteration, the weight of the child node is multiplied by the shrinkage rate to reduce the interaction between trees. In this way, the result obtained from the previous training tree is prevented from affecting the next tree. Regarding the pruning parameters of the training tree, the splitting stops when the tree splitting is negative; actually, this is a greedy algorithm. XGBoost splits to the maximum depth set by the parameters and then performs the pruning step. Once the node value is found to be negative, this node is removed.
3.4. Model Evaluation
In this study, the indicators obtained (including accuracy, precision, and recall) using the confusion matrix were used to evaluate the classification model. The confusion matrix comprised true-positive, true-negative, false-positive, and false-negative values [27]. The indicators used in this study are defined as follows:
- Accuracy: the model accuracy as a whole is the ratio of the number of samples with normal and abnormal results predicted by the model to the total number of samples.
- Precision: precision is the ratio of the number of correctly predicted failures to the total number of predicted failures when the model is classified. The higher the precision, the lower is the rate of misjudgment.
- Recall: recall is the ratio of the number of negative values predicted by the model to the number of actual negative values.
- F1-score: this is a weighted harmonic average of the precision and recall. It takes into account the impact of precision and recall on the model. The higher the F1-score, the more ideal is the experimental method.
To evaluate the rigor of the prediction model, the F1-score indicator is adopted to evaluate the model.
3.5. Connecting the Information System
In the past, the software packages used and integrated into factory environments were developed using programming languages such as C++, C#, or JavaScript. Recently, Python has emerged as a popular choice for developing machine-learning models. However, in practice, these models cannot be connected directly to traditional systems. In this study, an API is used as a communication means with the developed model. The system architecture is shown in Figure 3. Through API, the central control system displays the rotational status of the dyeing tank operation based on the developed early warning model. The results are then forwarded to the central control center and broadcast to the appropriate personnel.
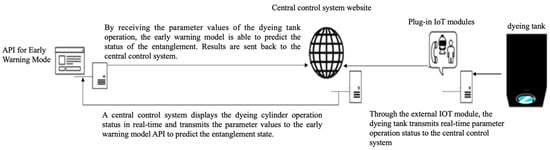
Figure 3.
Schematic diagram of the information string connection.
Although it is possible to perform signal input and prediction return for different programs through WebAPI, it is still necessary to install Python-related packages on the computer before the model can be used online. Therefore, in this study, the PyInstaller package of Python was used for packaging, and the Python environment and the package were used to create a Windows executable file. The factory only needed to open the executable file to enable the API of the early warning model. This could greatly reduce the environment construction complexity in connecting the Python model with the traditional system.
3.6. Implementation Steps of the Study
We present the following steps to be performed step by step based on the methodology proposed in this study.
- Step 1: Dyeing tank parameters are loaded from the Orga TEX.MES integration database.
- Step 2: A senior engineer will mark the position of the entanglement according to the provided graph (e.g., Figure 2a).
- Step 3: Applied SMOTE, boundary SMOTE, and Tomek linkage methods to deal with data imbalance.
- Step 4: Split the data into 70% training samples and 30% test samples.
- Step 5: Apply RF and XGBoost to develop a pre-warning mode of entanglement.
- Step 6: Using the confusion matrix of the model results, calculate the F1-score to evaluate the model and select the most appropriate entanglement, pre-warning model.
- Step 7: Convert the best model obtained from the python program to API and connect it to the system.
4. Analysis and Result
In this study, the manufacturing execution system (MES) system captured the machine operation data of the dyeing and finishing plant for a period of two months. After preprocessing the preliminary data, 16,387 records of 12 batches of entanglement problems were retained. The data required to establish the model included data obtained from the 12 machines (these data were recorded by dyeing machine sensors). In addition, one result of manually marking the state of entanglement was used. The data obtained from the 12 machines (namely, actual temperature (Value01), set temperature (Value02), reserve tank temperature (Value03), main tank water level (Value04), T.1 set liters (Value06), T.2 set liters (Value07), IWS value (%) (Value08), reserve tank set liters (Value12), in the time of the first vat cycle (Value13), the time of second vat cycle (Value14), and the time of three vat cycle (Value15), and pH value (Value19)) were used as the warning mode input variables.
The manual marking of the entanglement state was performed using a graph, which was drawn according to the actual temperature (Value01), the set temperature (Value02), the time of the first vat cycle (Value13), the time of second vat cycle (Value14), and the time of three vat cycle (Value15). A senior engineer in the factory determined the entanglement state based on this graph. The results are shown in Figure 4; the green area indicates the location of the entanglement state.
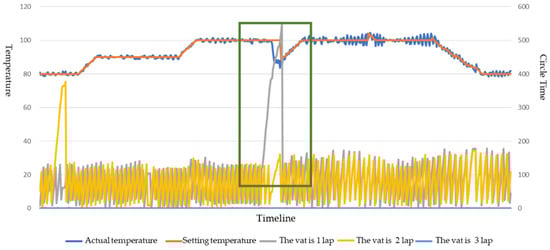
Figure 4.
Entangled state markers on the variable curves.
The entanglement state can be 0, 1, or 2, indicating normal operation, entanglement warning, and entanglement occurrence, respectively. Among them, there are 15,863 states of 0, 116 states of 1, and 408 states of 2. Table 1 shows the results of manually marking the entanglement state.

Table 1.
Results of dye tank runs and the corresponding marker entanglement.
Next, imbalanced data processing was performed. Four imbalanced data processing techniques (SMOTE, borderline SMOTE, SMOTE + Tomek link, and borderline SMOTE + Tomek link) were used. To deal with the data imbalance, the data were processed using two methods. In the first method, the original data were processed using imbalanced data processing techniques. Then, the model evaluation was performed using 70% of the data for training and 30% for testing. In the second method, the original data were first divided into 70% training data and 30% testing data. Then, imbalanced data processing was performed on the training data, and model evaluation and comparison were applied to the test data. According to the relevant research literature, the imbalanced processing of multi-category datasets can achieve a higher efficiency by generating the samples three times for a few categories. Therefore, the samples were generated three times and were used as entanglement data for a few categories.
XGBoost mode was used to build the model and the experimental design techniques and find the corresponding model parameters. The set values for base_score, booster, colsample_bylevel, colsample_bynode, colsample_bytree, eval_metric, gamma, learning_rate, max_delta_step, max_depth, min_child_weight, n_estimators, num_class, objective, and reg_alpha. reg_lambda were 0.5, gbtree, 1, 1, 1, mlogloss, 0, 0.3, 0, 6, 1, 100, 3, multi:softprob, 0, and 1, respectively. From the 12 machine data variables, a prediction model for the entanglement state was established. Initially, the variables were filtered using training data and XGBoost. Figure 5 shows the relationship between ranking the characteristics by F-score to identify the most critical factors. In this study, F-score was used as an indicator for selecting the feature variables. Generally, the larger the F-score of a feature variable, the greater its value for classification. According to Figure 5, the first five key variables were the actual temperature (Value01), the temperature of the preliminary vat (Value03), the time of the first vat cycle (Value13), the time of the second vat cycle (Value14), and the IWS value (%) (Value08). As some dyeing machines did not perform the third vat cycle time (Value15), this vat cycle ranked lower in importance.
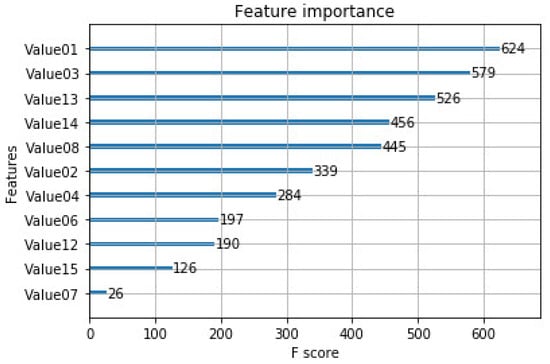
Figure 5.
Ranking diagram of the feature importance of key variables.
We compared the two data processing methods (original data and 70% training data for imbalanced data processing) and the five imbalanced data techniques (no handling, SMOTE, borderline SMOTE, SMOTE + Tomek link, and borderline SMOTE + Tomek link). The random forest (RF) and XGBoost models were trained and tested, and the F1-score of the classification results was used as the comparison basis (Table 2).
Table 2.
F1-score results for various combinations of imbalance techniques and algorithms.
Without performing imbalanced data processing on the original data, the F1-score of XGBoost’s prediction of entanglement warning was 74%, which is higher than the 51% of the RF method. In this study, the classification results show that RF and XGBoost achieved high accuracy rates (100% and 96%, respectively, in the normal operation state prediction, and 100% and 97%, respectively, in the entanglement state prediction). These results indicate that XGBoost exhibited a good prediction performance for imbalanced data. A comparison of the four data-imbalance processing techniques indicates that the F1-score of XGBoost in the early warning stage was more than 90%. The results obtained for another model, where imbalanced data techniques were first used on the training data, indicated that the F1-score of the early warning stage of the two machine-learning models was significantly improved using borderline SMOTE. Among the models, XGBoost produced better results. After adding the two data imbalance methods to Tomek link to delete the boundary samples, the original dataset was processed for data imbalance. After combining borderline SMOTE with Tomek link for imbalanced data processing, the trained XGBoost model provided an improvement; the F1-score was as high as 94%. In contrast, the early warning classification F1 score of the RF method reached 92%, which also showed a good classification performance.
The analysis results showed that if the original dataset was processed for data imbalance before model training was performed, the obtained model evaluation results could be improved. This is consistent with the previously reported results. Therefore, in practical applications, borderline SMOTE + Tomek link techniques can be used to deal with the imbalance of the original data. Then, the model can be constructed using XGBoost. Finally, an API was used to connect the entanglement detection mode with the real-time central control system in a factory to expand the system’s entanglement warning function.
5. Conclusions
The system proposed in this study can be used to establish an instant entanglement detection mode in dyeing machines that are not equipped with entanglement warnings. Initially, the factory’s senior engineers manually mark the parameter value ranges during which an entanglement occurs on a graph representing the machine temperature and running cycle. Then, imbalanced data and the ensemble machine-learning model are integrated, and the data obtained from 12 machines are used as input variables to establish the entanglement warning mode. The three possible states of a dyeing machine are normal operation, entanglement warning, and entanglement occurrence. After processing and combining the imbalanced data, it was found that when using the borderline SMOTE technique combined with Tomek link on the original dataset and then combined with the model established by XGBoost, a high prediction accuracy can be achieved. The classification accuracy of normal operation, entanglement warning, and entanglement occurrence were 100%, 94%, and 96%, respectively.
These results were imported and verified under actual operating conditions by cooperating with our partner manufacturers. The tangle anomaly warning model developed using Python was encapsulated into the factory’s central control system. Therefore, it can be directly executed in the Windows operating system without installing additional Python-related packages. Figure 6 shows the Web API startup screen after executing the executable file. The model plk file is used to detect the entanglement and to return the prediction result to the central control system.
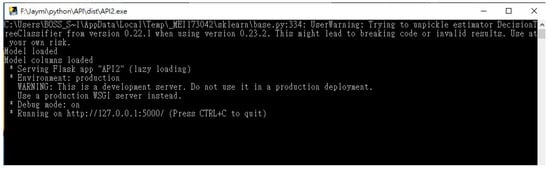
Figure 6.
Schematic diagram of the Web API startup screen after executing the executable file.
The personnel in charge can log into the system through a computer, tablet, or mobile and observe the light signal to determine whether an entanglement has occurred, as predicted by the system, instead of performing the old-fashioned on-site visual inspection. The developed entanglement warning system is depicted in Figure 7. Figure 7a shows a screenshot of the central control system. The central control system records the operating and real-time running states of the machines and sends over the data to the early warning model API for entanglement prediction. In the upper right corner, the prediction result is displayed as a light signal (Figure 7b). A green light signal indicates that the machine is in the normal operation state, an orange light signal indicates that an entanglement might occur, and a red light signal indicates that an entanglement has actually occurred. The proposed warning system was successfully installed in a manufacturer’s factory, and was used under actual operating conditions. The manufacturer stated that the proposed system could eliminate abnormal dyeing caused by entanglement problems and it could greatly improve product quality and production efficiency. A practical contribution of this study is the development and application of a method and system for detecting entanglement in dyeing tank equipment and by upgrade to smart manufacturing.
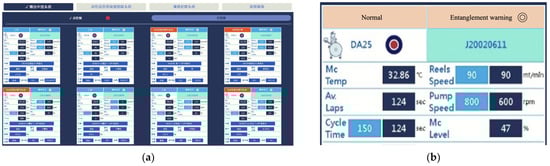
Figure 7.
This study developed an entanglement warning system. (a) Central controlling system screen; (b) warning screen of entanglement problem detection.
Author Contributions
Conceptualization, C.-C.W. and Y.-H.L.; methodology, C.-C.W. and Y.-H.L.; validation, C.-C.W. and Y.-H.L.; formal analysis, C.-C.W. and Y.-H.L.; data curation, Y.-H.L.; writing—original draft preparation, C.-C.W. and Y.-H.L., writing—review and editing, C.-C.W. All authors have read and agreed to the published version of the manuscript.
Funding
This research was financially supported by the Ministry of Science and Technology (MOST) of Taiwan (108-2622-E-131-003-CC3).
Institutional Review Board Statement
Not applicable.
Informed Consent Statement
Not applicable.
Data Availability Statement
Not applicable.
Conflicts of Interest
The authors declare no conflict of interest.
References
- Kumar, P.S.; Joshiba, G.J. Sustainability in Dyeing and Finishing. In Sustainability in the Textile and Apparel Industries; Springer: Cham, Switzerland, 2020; pp. 165–177. [Google Scholar]
- Chen, H.; Yu, X.; Wang, X.; He, Y.; Zhang, C.; Xue, G.; Liu, Z.; Lao, H.; Song, H.; Chen, W.; et al. Dyeing and finishing wastewater treatment in China: State of the art and perspective. J. Clean. Prod. 2021, 326, 129353. [Google Scholar] [CrossRef]
- Lu, X.; Liu, L.; Liu, R.; Chen, J. Textile wastewater reuse as an alternative water source for dyeing and finishing processes: A case study. Desalination 2010, 258, 229–232. [Google Scholar] [CrossRef]
- Boonkanit, P.; Charoenkid, N. Expert System Software for Production Planning and Quality Control in Bleaching Dyeing and Finishing Process of Textiles Industry. Appl. Mech. Mater. 2016, 848, 259–262. [Google Scholar] [CrossRef]
- Islam, M.M.; Mahmud, S. Study on different types of dyeing faults, causes and remedies of knit fabrics. Int. J. Eng. Technol. 2015, 15, 6–15. [Google Scholar]
- Islam, S.; Chowdhury, S.; Akter, S. The Experiential Analysis of Woven Fabric for Reproduction. J. Text. Sci. Technol. 2018, 4, 18. [Google Scholar] [CrossRef] [Green Version]
- Kabir, S.M.M.; Zakaria, M. Effect of machine parameters on knit fabric specifications. DUET J. 2012, 1, 12–16. [Google Scholar]
- Lu, C.J.; Lee, T.S.; Wang, C.C.; Chen, W.J. Improving Sports Outcome Prediction Process Using Integrating Adaptive Weighted Features and Machine Learning Techniques. Processes 2021, 9, 1563. [Google Scholar] [CrossRef]
- Qi, Y.; Klein-Seetharaman, J.; Bar-Joseph, Z. Random forest similarity for protein-protein interaction prediction from multiple sources. Biocomputing 2005, 10, 531–542. [Google Scholar]
- Strobl, C.; Boulesteix, A.-L.; Zeileis, A.; Hothorn, T. Bias in random forest variable importance measures: Illustrations, sources and a solution. BMC Bioinform. 2007, 8, 25. [Google Scholar] [CrossRef] [Green Version]
- Quiroz, J.C.; Mariun, N.; Mehrjou, M.R.; Izadi, M.; Misron, N.; Radzi, M.A.M. Fault detection of broken rotor bar in LS-PMSM using random forests. Measurement 2018, 116, 273–280. [Google Scholar] [CrossRef]
- Zhien, G.; Yulin, S.; Changcheng, C.; Chunming, Z.; Zhenshan, G.; Shixi, X.; Shengfu, L. An integrated intelligent predictive maintenance system for critical equipment in petrochemical industry. Labor Occup. Saf. Health Res. Q. 2018, 26, 141–150. [Google Scholar]
- Zhang, X.-H.; Zhu, Q.-X.; He, Y.-L.; Xu, Y. A novel robust ensemble model integrated extreme learning machine with multi-activation functions for energy modeling and analysis: Application to petrochemical industry. Energy 2018, 162, 593–602. [Google Scholar] [CrossRef]
- Göksu, B.; Erginer, K.E. Prediction of Ship Main Engine Failures by Artificial Neural Networks. J. ETA Marit. Sci. 2020, 8, 98–113. [Google Scholar] [CrossRef]
- Wen, H.L.; Guo, J.L. Using Machine Learning Algorithm to Establish Prognostic Health Management Model for Ship Engine. Army Logist. Q. 2020, 3, 62–77. [Google Scholar]
- Carvalho, T.P.; Soares, F.A.; Vita, R.; Francisco, R.D.P.; Basto, J.P.; Alcalá, S.G. A systematic literature review of machine learning methods applied to predictive maintenance. Comput. Ind. Eng. 2019, 137, 106024. [Google Scholar] [CrossRef]
- Khorsheed, R.M.; Beyca, O.F. An integrated machine learning: Utility theory framework for real-time predictive maintenance in pumping systems. Proc. Inst. Mech. Eng. Part B J. Eng. Manuf. 2021, 235, 887–901. [Google Scholar] [CrossRef]
- Wang, C.; Deng, C.; Yu, Z.; Hui, D.; Gong, X.; Luo, R. Adaptive ensemble of classifiers with regularization for imbalanced data classification. Inf. Fusion 2021, 69, 81–102. [Google Scholar] [CrossRef]
- Antoniadis, A.; Lambert-Lacroix, S.; Poggi, J.-M. Random forests for global sensitivity analysis: A selective review. Reliab. Eng. Syst. Saf. 2021, 206, 107312. [Google Scholar] [CrossRef]
- Paturi, U.M.R.; Cheruku, S. Application and performance of machine learning techniques in manufacturing sector from the past two decades: A review. Mater. Today Proc. 2021, 38, 2392–2401. [Google Scholar] [CrossRef]
- Huo, W.; Li, W.; Zhang, Z.; Sun, C.; Zhou, F.; Gong, G. Performance prediction of proton-exchange membrane fuel cell based on convolutional neural network and random forest feature selection. Energy Convers. Manag. 2021, 243, 114367. [Google Scholar] [CrossRef]
- Tang, Z.; Tang, L.; Zhang, G.; Xie, Y.; Liu, J. Intelligent Setting Method of Reagent Dosage Based on Time Series Froth Image in Zinc Flotation Process. Processes 2020, 8, 536. [Google Scholar] [CrossRef]
- Natekin, A.; Knoll, A. Gradient Boosting Machines, a Tutorial. Front. Neurorobot. 2013, 7, 21. [Google Scholar] [CrossRef] [Green Version]
- Torlay, L.; Perrone-Bertolotti, M.; Thomas, E.; Baciu, M. Machine learning–XGBoost analysis of language networks to classify patients with epilepsy. Brain Inform. 2017, 4, 159–169. [Google Scholar] [CrossRef]
- Zhang, Z.; Jung, C. GBDT-MO: Gradient-Boosted Decision Trees for Multiple Outputs. IEEE Trans. Neural Netw. Learn. Syst. 2020, 32, 3156–3167. [Google Scholar] [CrossRef]
- González, S.; García, S.; Del Ser, J.; Rokach, L.; Herrera, F. A practical tutorial on bagging and boosting based ensembles for machine learning: Algorithms, software tools, performance study, practical perspectives and opportunities. Inf. Fusion 2020, 64, 205–237. [Google Scholar] [CrossRef]
- Hong, C.S.; Oh, T.G. TPR-TNR plot for confusion matrix. Commun. Stat. Appl. Methods 2021, 28, 161–169. [Google Scholar] [CrossRef]
Publisher’s Note: MDPI stays neutral with regard to jurisdictional claims in published maps and institutional affiliations. |
© 2022 by the authors. Licensee MDPI, Basel, Switzerland. This article is an open access article distributed under the terms and conditions of the Creative Commons Attribution (CC BY) license (https://creativecommons.org/licenses/by/4.0/).