Article

Ventilation Capacities of Chinese Industrial Cities and Their Influence on the Concentration of NO2

1
College of Land Science and Technology, China Agricultural University, Beijing 100193, China
2
CAS Key Laboratory of Forest Ecology and Management, Institute of Applied Ecology, Chinese Academy of Sciences, Shenyang 110016, China
3
Ministry of Education Key Laboratory for Earth System Modeling, Department of Earth System Science, Tsinghua University, Beijing 100084, China
4
College of Resources and Environmental Science, China Agricultural University, Beijing 100193, China
5
CMA-CAU Jointly Laboratory of Agriculture Addressing Climate Change, Beijing 100193, China
*
Author to whom correspondence should be addressed.
Remote Sens. 2022, 14(14), 3348; https://doi.org/10.3390/rs14143348
Submission received: 19 June 2022 / Revised: 7 July 2022 / Accepted: 7 July 2022 / Published: 12 July 2022

Abstract

:
Most cities in China, especially industrial cities, are facing severe air pollution, which affects the health of the residents and the development of cities. One of the most effective ways to alleviate air pollution is to improve the urban ventilation environment; however, few studies have focused on the relationship between them. The Frontal Area Index (FAI) can reflect the obstructive effect of buildings on wind. It is influenced by urban architectural form and is an attribute of the city itself that can be used to accurately measure the ventilation capacity or ventilation potential of the city. Here, the FAIs of 45 industrial cities of different sizes in different climatic zones in China were computed, and the relationship between the FAI and the concentration of typical pollutants, i.e., NO2, were analyzed. It was found that (1) the FAIs of most of the industrial cities in China were less than 0.45, indicating that most of the industrial cities in China have excellent and good ventilation capacities; (2) there were significant differences in the ventilation capacities of different cities, and the ventilation capacity decreased from the temperate to the tropical climate zone and increased from large to small cities; (3) there was a significant difference in the ventilation capacity in winter and summer, indicating that that with the exception of building height and building density, wind direction was also the main influencing factor of FAI; (4) the concentration of NO2 was significantly correlated with the FAI, and the relative contribution of the FAI to the NO2 concentration was stable at approximately 9% and was generally higher than other socioeconomic factors. There was a turning point in the influence of the FAI on the NO2 concentration (0.18 < FAI < 0.49), below which the FAI had a strong influence on the NO2 concentration, and above which the influence of the FAI became weaker. The results of this study can provide guidance for suppressing urban air pollution through urban planning.

1. Introduction

With urban expansion and industrial development, urban areas are facing an increasing number of serious air pollution problems worldwide [1,2]. Urban pollution not only directly poses a serious hazard to human health and affects the growth of vegetation, but it also has an important impact on the local climate. For example, air pollution increases urban rainfall [3] and enhances the urban heat island effect [4,5]. Therefore, air pollution has a great impact on the sustainable development of cities [6,7,8]. Thus, identifying a method to alleviate air pollution has become the focus of academic attention.
The blocking of the wind flow by tall or dense building groups in a city can alter the residence time of air pollutants in the building environment, and the positional relationship between the buildings and the wind direction also affects the diffusion direction and range [9,10,11,12]. Thus, the architectural form influences the internal ventilation of the city and significantly impacts urban air pollution [9]. However, at present, most studies have mainly focused on the impacts of the wind speed, temperature, population, economy, and other factors on urban air pollution from natural and socioeconomic aspects [13,14,15,16,17]. Most studies have only focused on evaluating the urban ventilation capacity or the impact thereof on the urban heat island effect, and few studies have focused on improving urban air quality from the perspective of urban planning and architectural morphology. For example, studies have shown that the wind speed in Hong Kong has been reduced from 10.5 m/s to 2.5 m/s (a four-fold reduction) due to obstacles and the wall effect of buildings, which adversely affects the heat island conditions [18]. Improving urban ventilation can effectively alleviate the urban heat island effect and reduce the urban energy demand [19]. Therefore, how to effectively suppress urban air pollution by improving the urban ventilation capacity needs to be further explored.
In previous studies, most scholars have used different architectural morphological parameters to describe the ventilation capacity of a city, such as building density, average building height, the standard deviation of building height, average building volume and closeness, etc. [20,21]. For instance, the building height and the standard deviation of building height can be used to measure the urban ventilation capacity, thus helping to improve urban ventilation and to alleviate the urban heat island effect [6]. In addition, changes in the wind speed, direction, and airflow caused by changes in the building height, volume, shape, and density in high-density urban areas can also reflect the urban ventilation capacity [21]. On this basis, studies proposed a spatial planning strategy to control the wind environment by optimizing the urban form. However, these indices cannot fully reflect the urban ventilation capacity. Thus, other studies have established the Frontal Area Index (FAI) to represent a city’s ventilation capacity [18,19,22,23]. Compared to commonly used parameters such as building height and density, the FAI couples the building height, building density, and urban wind direction; thus, it can more accurately measure the obstructive effect of buildings on wind and describe the urban ventilation capacity [18,24,25,26].
As one of the largest developing countries in the world, 135 of China’s 337 cities have exceeded the environmental air quality standard, accounting for 40.1% of all of the cities in the country. Among them, air pollution is the most serious problem in China’s mega industrial zones, such as the Beijing–Tianjin–Hebei region, the Yangtze River Delta, and the Pearl River Delta [14,27,28,29]. It is estimated that the direct economic losses caused by the emergency response to heavily polluted weather in the Beijing–Tianjin–Hebei region account for 0.4–2.6% of the local Gross Domestic Product (GDP) [30]. In addition, in various air pollution studies, NO2 has gradually been highlighted because it is the best index for measuring air pollution in industrial cities [31,32], which may experience ozone (O3) formation, acid rain, and aerosol particulate matter (PM) [17,33], causing cardiovascular and respiratory diseases, endangering human health [33,34,35,36], and destroying the local ecological environment [33]. Thus, it is of great significance to determine how to alleviate the NO2 concentration in Chinese cities, especially in industrial cities.
Based on the above analysis, we obtained building information for 45 industrial cities in China from Baidu Maps and calculated the FAIs of the different cities using ArcGIS. Additionally, we also obtained the full-year, summer, and winter NO2 concentration data for 45 cities from the Google Earth Engine. Then, we used the FAI index to evaluate the ventilation capacities of these 45 cities; finally, we employed the random forest regression algorithm to explore the relative contribution of the FAI to the NO2 concentration and its marginal effect. This study aimed to (1) clarify the overall ventilation capacities of 45 major industrial cities in China as well as the differences in the ventilation capacities of cities of different sizes in different climatic zones; (2) reveal the influence of the urban ventilation capacity on the concentration of NO2 and its degree; and (3) determine the impact mode and feasibility of mitigating the urban NO2 concentration.

2. Materials and Methods
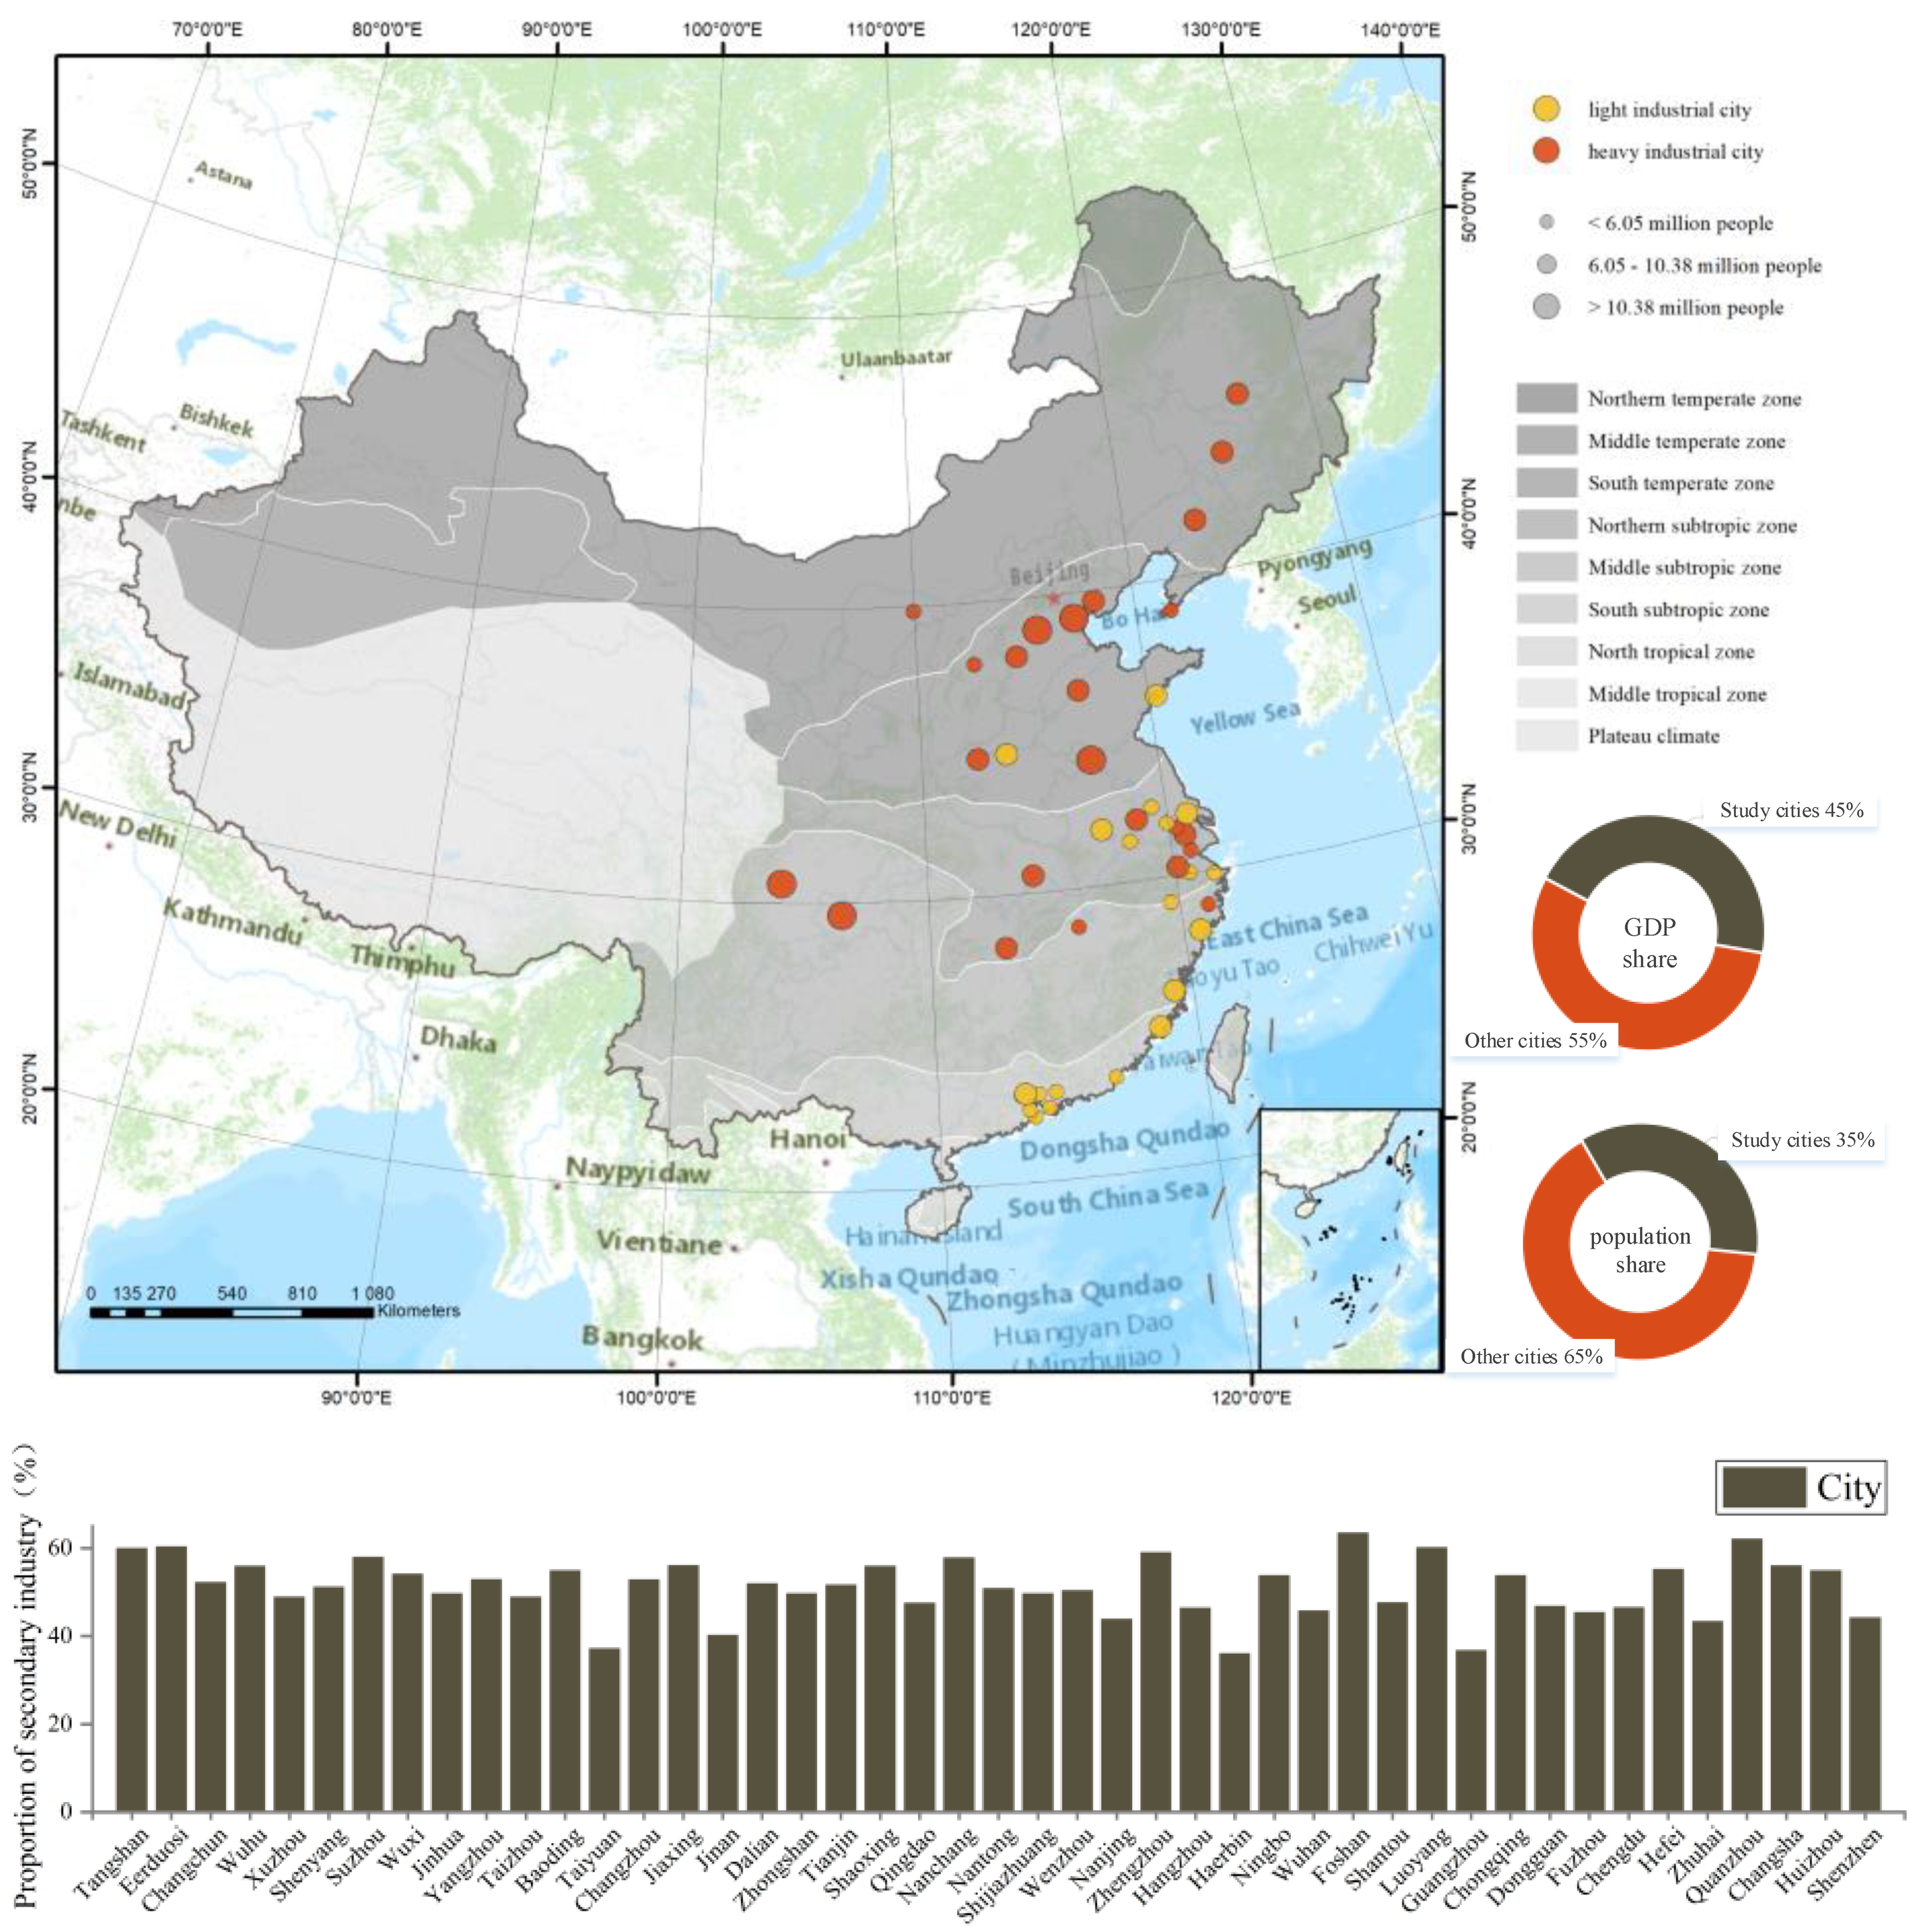
2.1. Study Area

In this study, 45 cities (Figure 1) were selected as the representative industrial cities in China. In these 45 cities, industrialization is the foundation of development. The output value of the secondary industry accounts for more than 30% in most of the cities, of which the proportion is smallest in Guangzhou (27.27%) and largest is in Tangshan (61.55%) In terms of city type, light industrial cities such as Wenzhou and Zhuhai and heavy industrial cities such as Shenyang and Dalian were included. The city scale includes large cities such as Shenzhen and Guangzhou as well as small- and medium-sized cities such as Jinhua and Jiaxing. The GDP, industrial output, and total population of the 45 cities account for 44.5%, 45.5%, and 36.8% of the national values, respectively. Moreover, these cities straddle different climate zones in China and have different geographical locations (Figure 1), so they adequately represent the industrial cities in China.

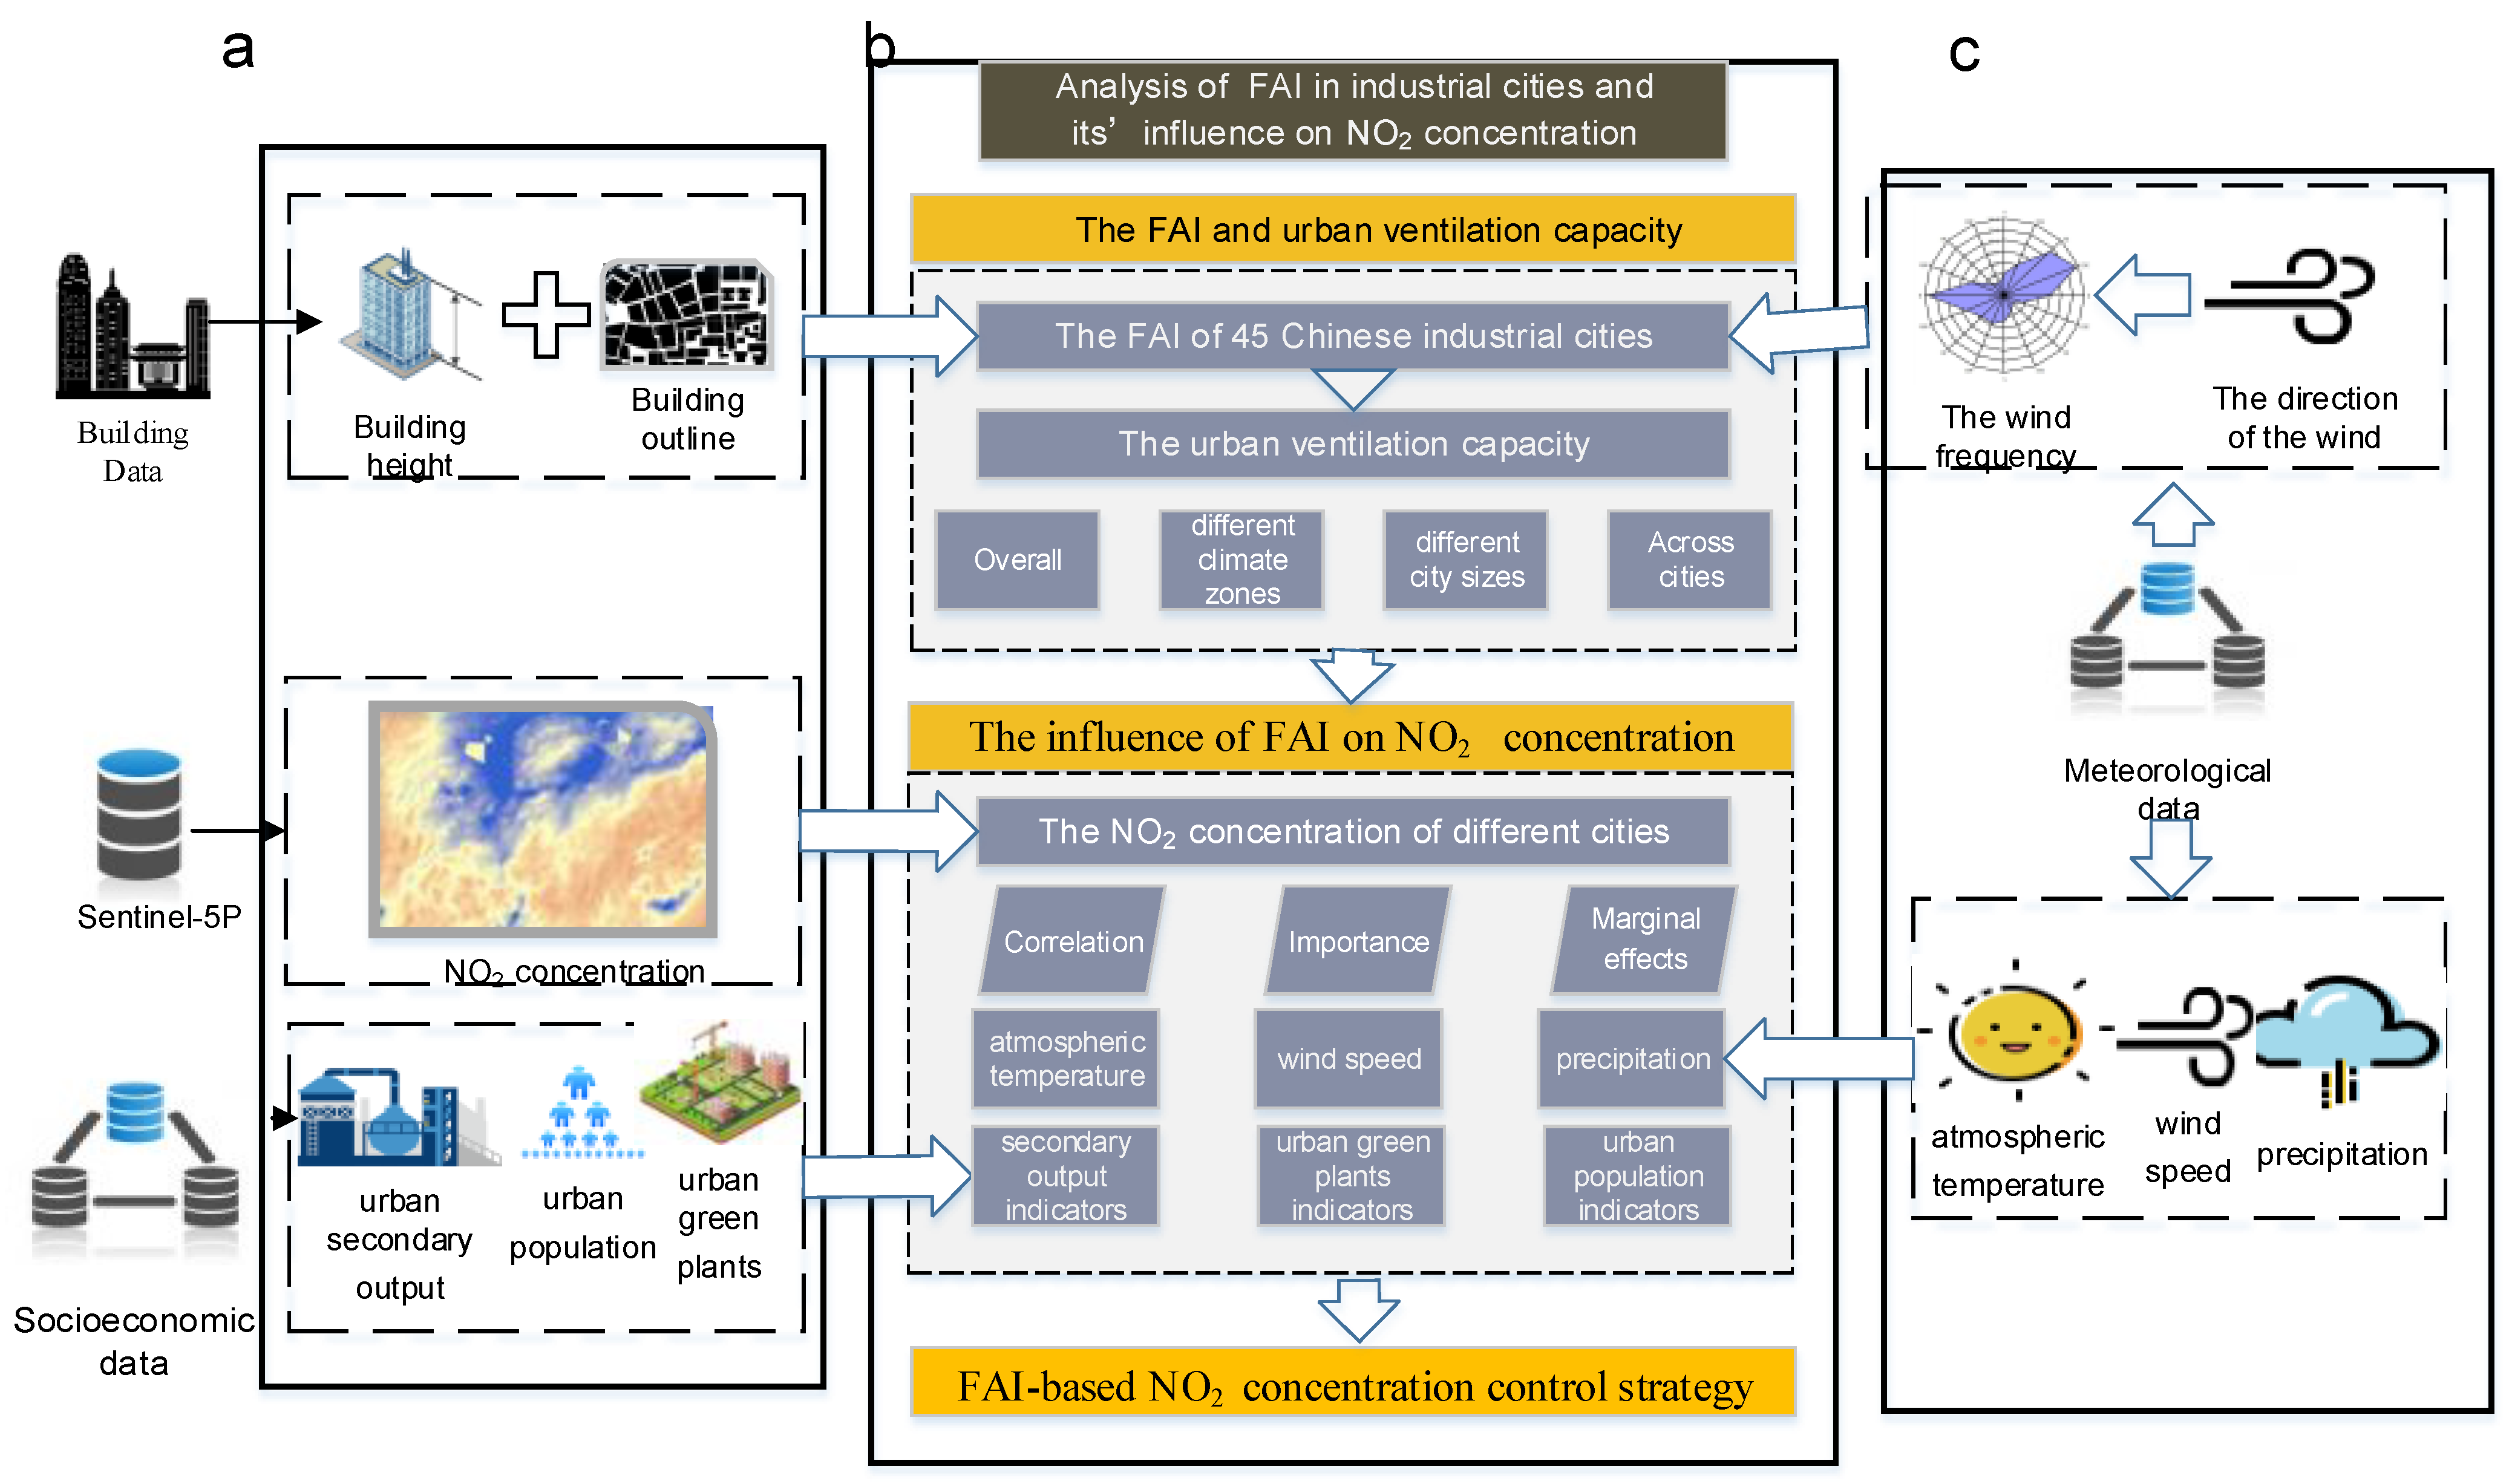
2.2. Research Framework and Data Source

Our research framework follows three main steps (Figure 2):
(1)
FAI calculation: We used construction data for 1,877,100 buildings in 45 Chinese cities, which we obtained from Baidu Maps (https://lbsyun.baidu.com/ (accessed on 20 June 2021)).The construction information included the outline and height, and the urban areas were divided into regular grids with a resolution of 1 km × 1 km. NO2 has a very strong diurnal cycle, with large differences between day and night. However, the satellite–5P data that we used only reflect the local NO2 concentration at noon. In order to match the satellite data, we obtained the daytime wind data from each city’s weather station and calculated the wind frequency for the different wind directions. Based on this, FAI and NO2 concentration maps were plotted one by one. Finally, the FAI of each grid was calculated using ArcGIS (see research methods for details).
(2)
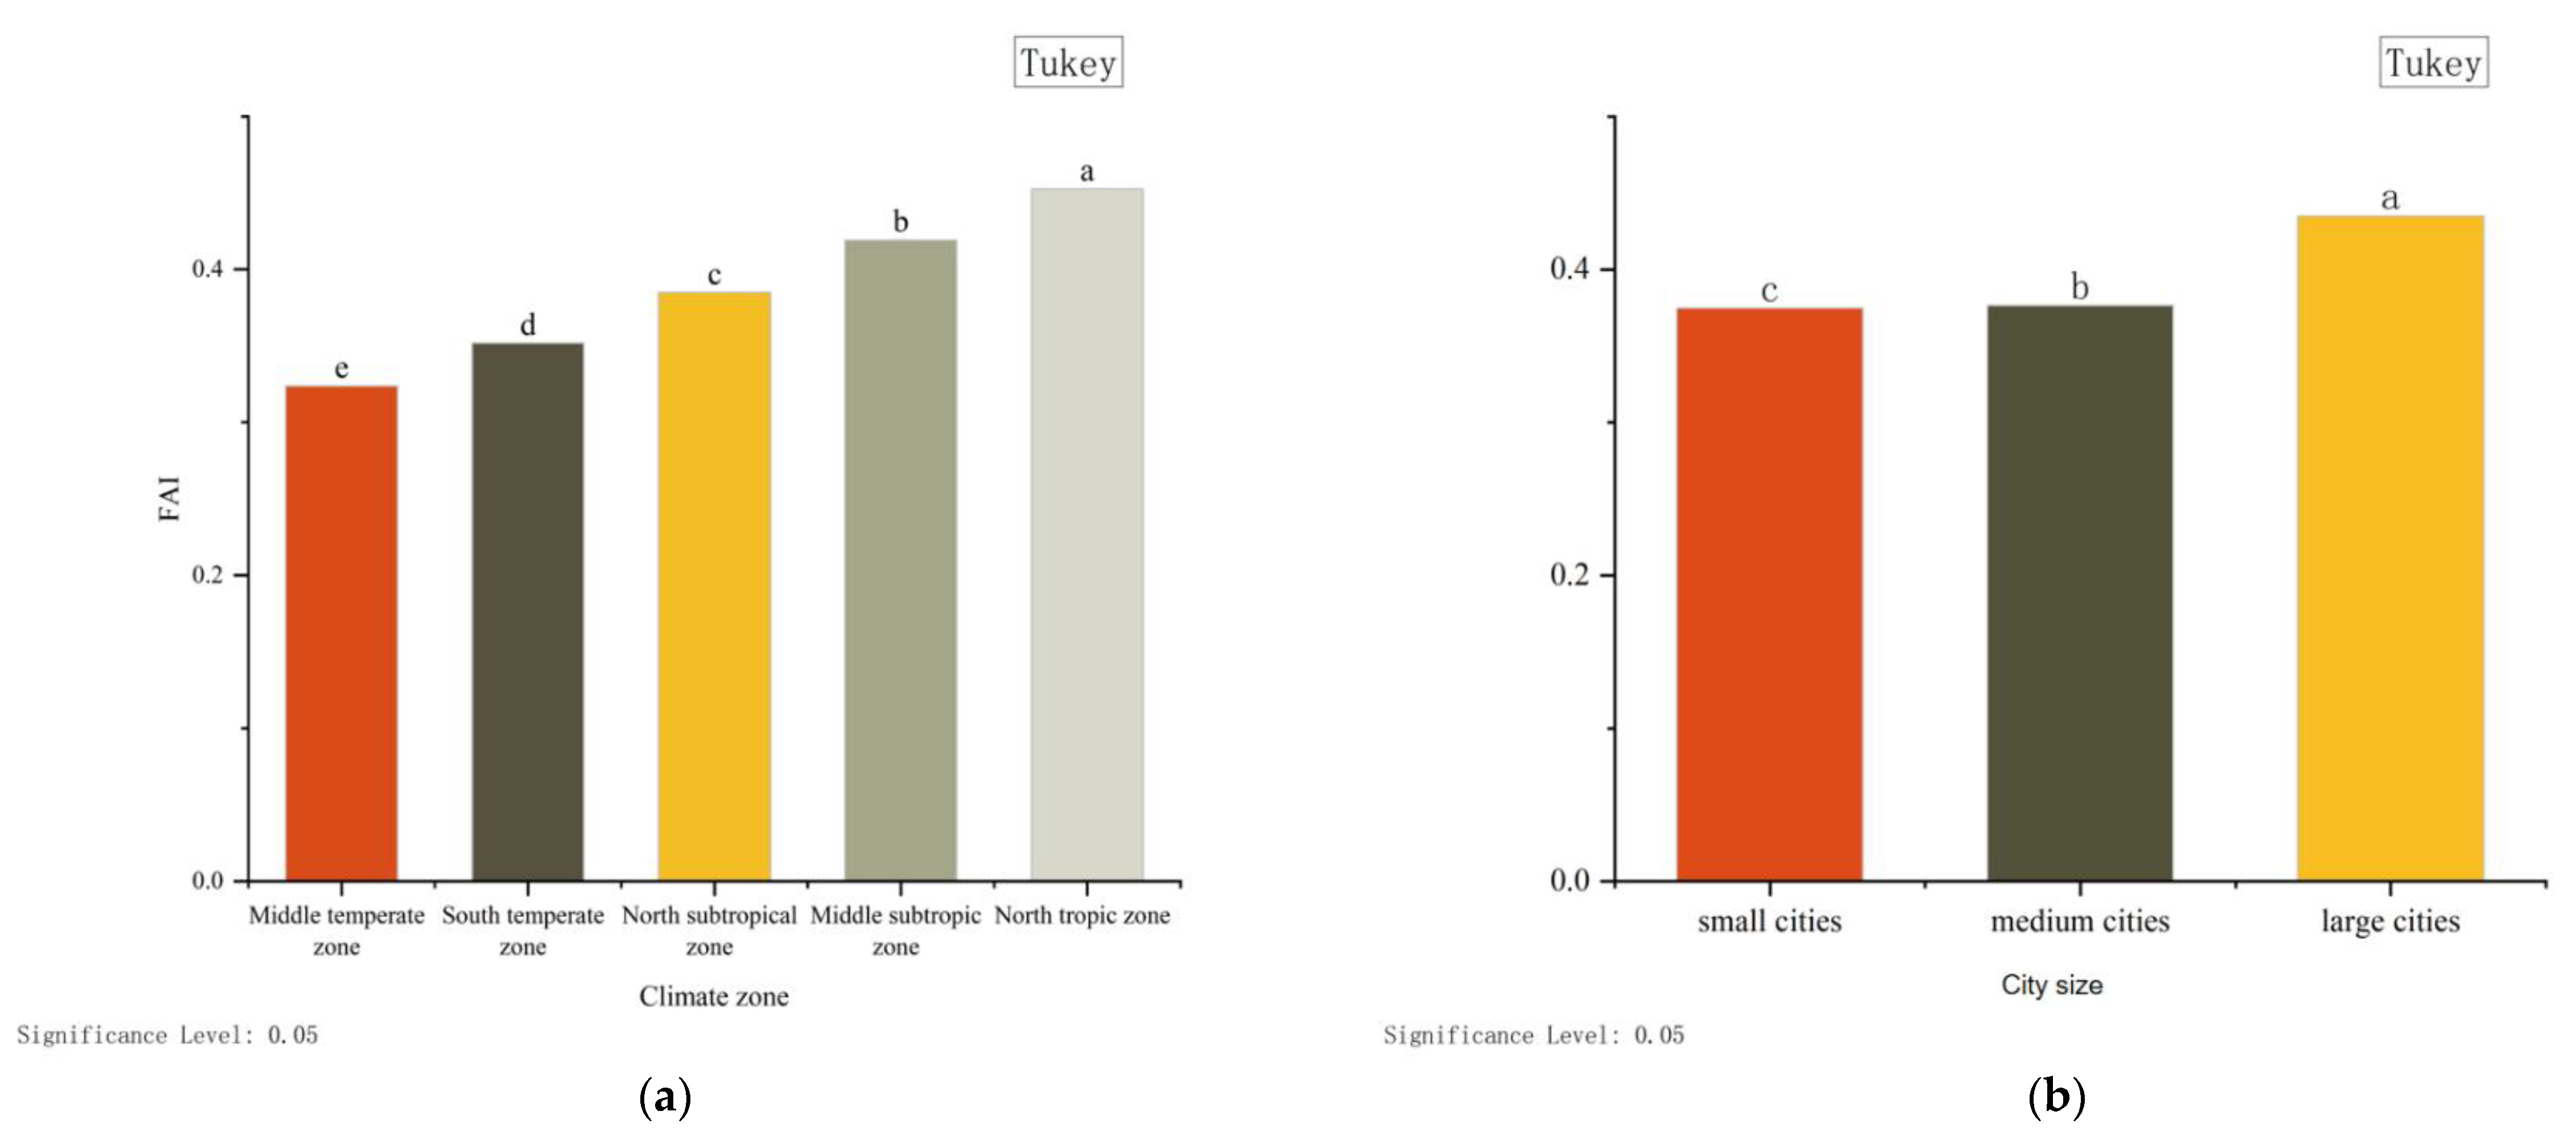
Evaluation of the urban ventilation capacity based on the FAI: FAI was used to evaluate the overall ventilation capacities of the 45 cities, and the paired difference test method was used to compare the ventilation capacities of the industrial cities of different sizes and in different climate zones.
(3)
The influence of FAI on the NO2 concentration: We determined the correlation between the FAI and NO2 concentration using correlation analysis. Then, we compared the relative contribution to and marginal effect of the FAI on the NO2 concentration with other factors (such as the Normalized Difference Vegetation Index (NDVI) and the secondary output value) using the random forest regression method. In addition, the impact of FAI on the NO2 concentration was explored. The data used in this study are presented in Table 1.

2.3. Research Method

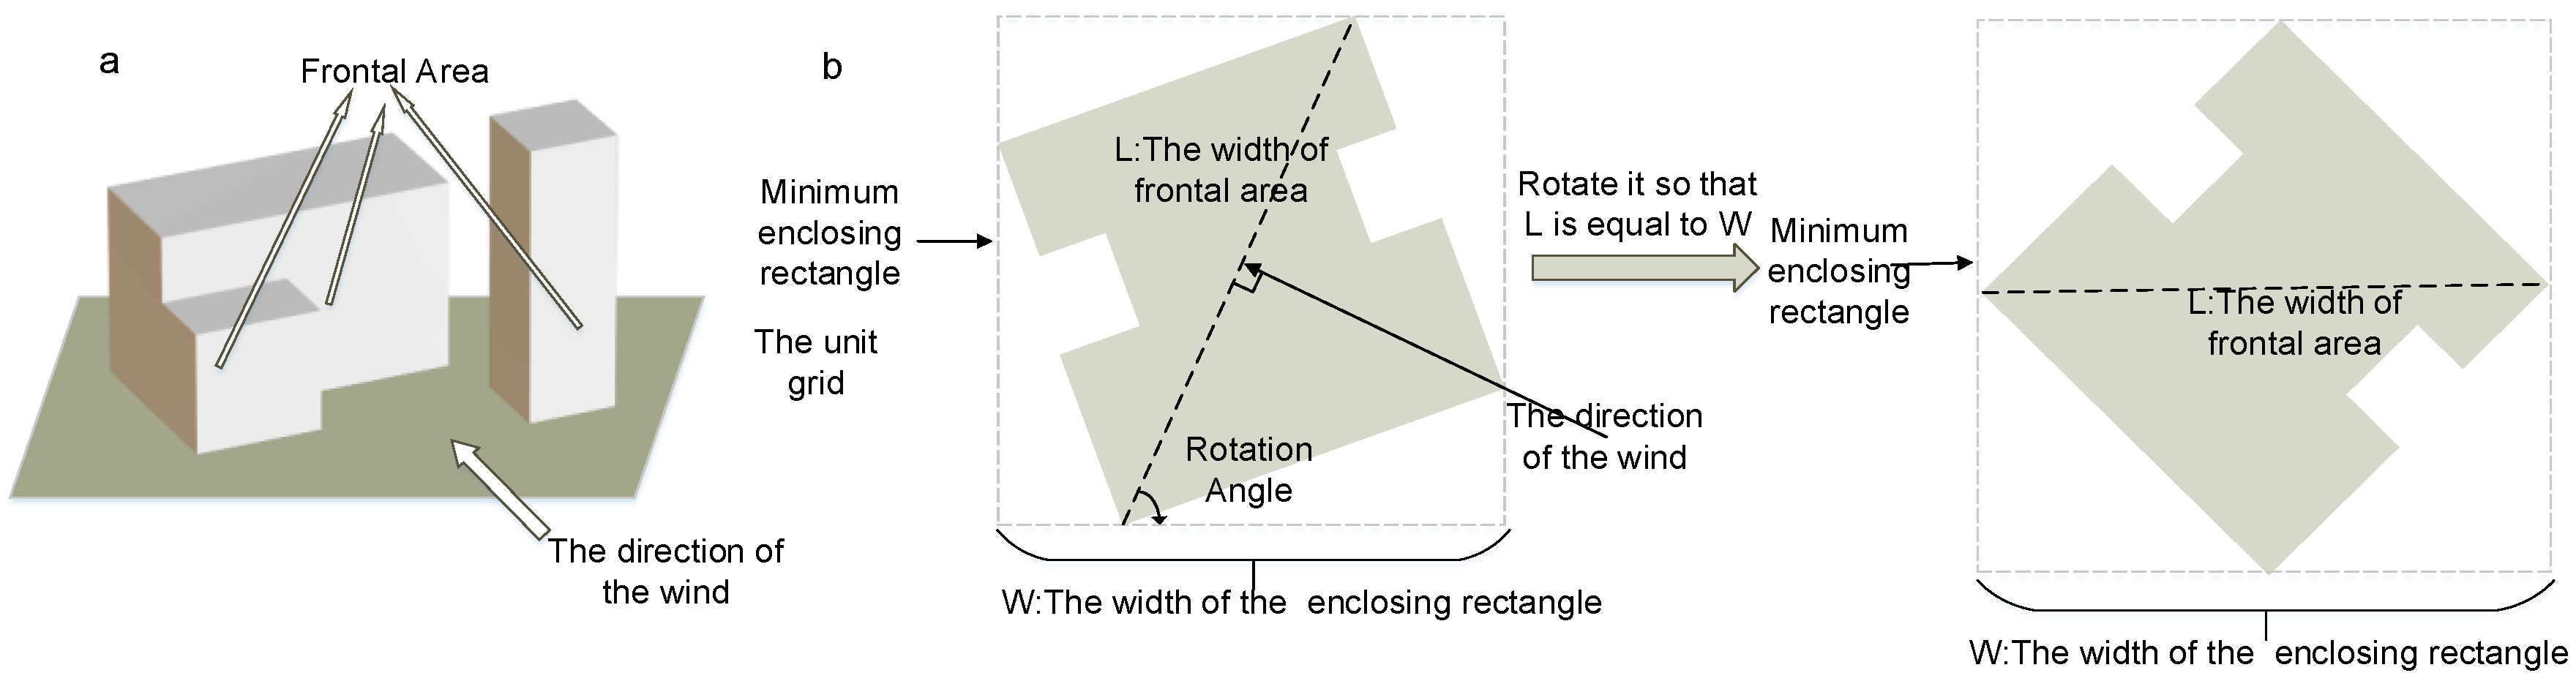
2.3.1. Calculation of FAI Based on ArcGIS

Calculation of FAI

The FAI is defined as the ratio of the projected area on the frontal side of a certain wind direction θ to the unit area of a structure in a unit area [37] (Figure 3a). For the same construction, the FAI corresponding to different wind directions θ is generally different. Its calculation formula is as follows:
λ f ( θ ) = A F ( θ ) / A T
where λ f ( θ ) is the FAI of the unit grid for wind direction θ , A F ( θ ) is the sum of the projected areas of all of the structures in the unit grid for wind direction θ , and A T is the area of the unit grid. The lager λ f ( θ ) is, the more the structures in the unit grid hinder the wind with direction   θ , and the worse the ventilation capacity in direction θ is. Since structures generally have different FAIs for different wind directions, the FAIs of the structure in all directions should be calculated [22,37], and the weighted average of the FAIs for the different directions should be determined according to the wind direction and frequency in the city where the structure is located. The formula is as follows:
λ f = λ f ( θ ) × B ( θ )
where λ f is the weighted average FAI, and B ( θ ) is the wind frequency corresponding to wind direction θ , which is obtained from the statistics of the urban wind direction data.

FAI Calculation Realization

There are many methods of calculating FAI, most of which need to be realized through programming. The method of calculating FAI based on the minimum enclosing rectangle was selected in this study [38], and its core ideas are as follows. After the horizontal contour of the irregular structure is rotated at a certain angle according to the angle of the wind direction, the width of the minimum outer rectangle of the rotated horizontal contour of the structure is equal to the width of the frontal side when the horizontal contour of the structure is not rotated. Furthermore, FAI is calculated using the width of the rotated horizontal contour, that is, the solution path of the proposed problem is transformed into the rotation of the minimum enclosing rectangle of the horizontal outline of the structure (Figure 3b).
In this paper, the C# programming language and the ArcGIS Engine component library were used for the secondary development in ArcGIS to realize the calculation of the urban FAI. C# is an object–oriented programming language. Its high efficiency, versatility, and high interaction with ArcGIS make it the preferred language for secondary development in ArcGIS. The ArcEngine is a complete set of the embedded Geographic Information System (GIS) component library and toolset provided by the company ESRI, which provides a variety of interfaces to realize the independent development of GIS. The algorithm can be divided into four main parts: ① according to the angle between the wind direction θ and the structure, the angle α at which the structure needs to be rotated is determined; ② the structure is rotated by angle α using the RotateSet entity rotation function in the IFeatureEdit interface; ③ for a rotated structure, the IEnvelop interface is used to obtain the minimum envelop rectangle of the structure and to obtain the minimum envelop width w of the structure. By multiplying the width w and the height h, the frontal area of the structure in wind direction θ can be calculated; ④ the frontal area λ f ( θ ) of the structures in the unit grid for direction θ are obtained and summed to obtain the total frontal area A F ( θ ) of the unit grid for direction θ. Furthermore, we divide by A T , i.e., the area of the unit grid, to obtain the λ f ( θ ) for direction θ.

Ventilation Capacity Classification Based on FAI

According to existing studies, the range of FAI is mainly between 0.21 and 0.60 [39,40]. Considering the development of cities, the range of FAI has been expanded to a certain extent. In addition, some researchers in the field of high–density urban wind environmental improvement have reported that according to the linear relationship between the height of a pedestrian and the FAI value, the wind speed ratio (pedestrian–level wind speed and reference level of 500 m in the wind speed ratio) can be obtained. When the FAI value is less than 0.35, the wind speed ratio may be greater than 0.2, which indicates excellent natural ventilation. When the FAI is greater than 0.6, the wind speed ratio may be less than 0.1, which indicates poor natural ventilation [41]. Based on these, the widely recognized FAI classification system was proposed [26,42]: (1) excellent ventilation capacity (FAI < 0.35); (2) good ventilation capacity (0.35 < FAI < 0.45); (3) low ventilation capacity (0.45 < FAI < 0.60); (4) bad ventilation capacity (FAI > 0.60).

2.3.2. Relative Contribution to and the Marginal Effect of FAI on the NO2 Concentration

Selection of Influencing Factors

Urban air pollutants are mainly influenced by human factors and natural factors. The former includes economic intensity, urban morphology, and pollution emissions, and the latter includes climate factors and terrain factors [15,43,44,45,46].
Different influencing factors have different abilities that influence air pollutants. For example, meteorological factors, such as the average temperature, sunshine duration, surface temperature, wind speed, and relative humidity, are negatively correlated with the NO2 concentration, while the average pressure and relative humidity are positively correlated with the NO2 concentration. The primary industry is negatively correlated with the atmospheric pollutant concentration, but the secondary industry and population size are positively correlated with the air pollutant concentration. To analyze the relative contribution to and the marginal effect of the FAI on the NO2 concentration, we selected a series of indicators to represent different important indicators based on previous studies [13,44,47,48], including natural factors such as the atmospheric temperature, wind speed, altitude, and precipitation and human factors such as the FAI, urban population, urban secondary output value, urban green plants, and number of cars.

Random Forest Regression

Random forest is an ensemble learning method for classification that is based on constructing a multitude of decision trees during a training period [49]. Its basic classifier is the decision tree constructed by the CART algorithm without branch–cutting [50]. We used the bagging method [51] to make the training set and finally carried out the classification by voting or regression by averaging. Since the random forest (RF) method has the advantages of high accuracy, effective operation for large datasets, and resistance to over–fitting, in this study, the random forest method was chosen to explore the relationship between the FAI and NO2 concentration. In addition, the RF can provide an importance score for each feature, so it can be used to quantify the relative contributions of the different variables. The RF can also generate partial dependencies to explain the marginal impact of each predictive variable on the response variable [52]. Therefore, it is widely used to analyze the relationships between urban air pollution and environmental variables. In this study, the RF model was developed using Python to study the relationship between the FAI and NO2 concentration [53]. For model training and validation, the NO2 concentration and FAI data for 1,877,100 grids in 45 cities were divided into test groups (80%) and validation groups (20%). On this basis, we computed the mean absolute percentage error (MAPE) regression loss to detect the random forest detection accuracy and observed general prediction accuracy (Figure A1). The results showed that 34 of the 45 cities studied had a MAPE of less than 20%, showing excellent accuracy of the predicted values. Moreover, the MAPE of the remaining 12 cities was slightly larger than 20% and much smaller than 50%. Accordingly, we explored the importance of the nine influencing factors of the NO2 concentration as well as the relative contribution of FAI on the NO2 concentration. Feature relative contribution refers to techniques that assign a score to input features based on how useful they are at predicting a target variable, which can show the impact degree of different impact factors on the impact target. Moreover, a partial dependence graph (PDP) was drawn to investigate the marginal effect of FAI on the NO2 concentration.

3. Results

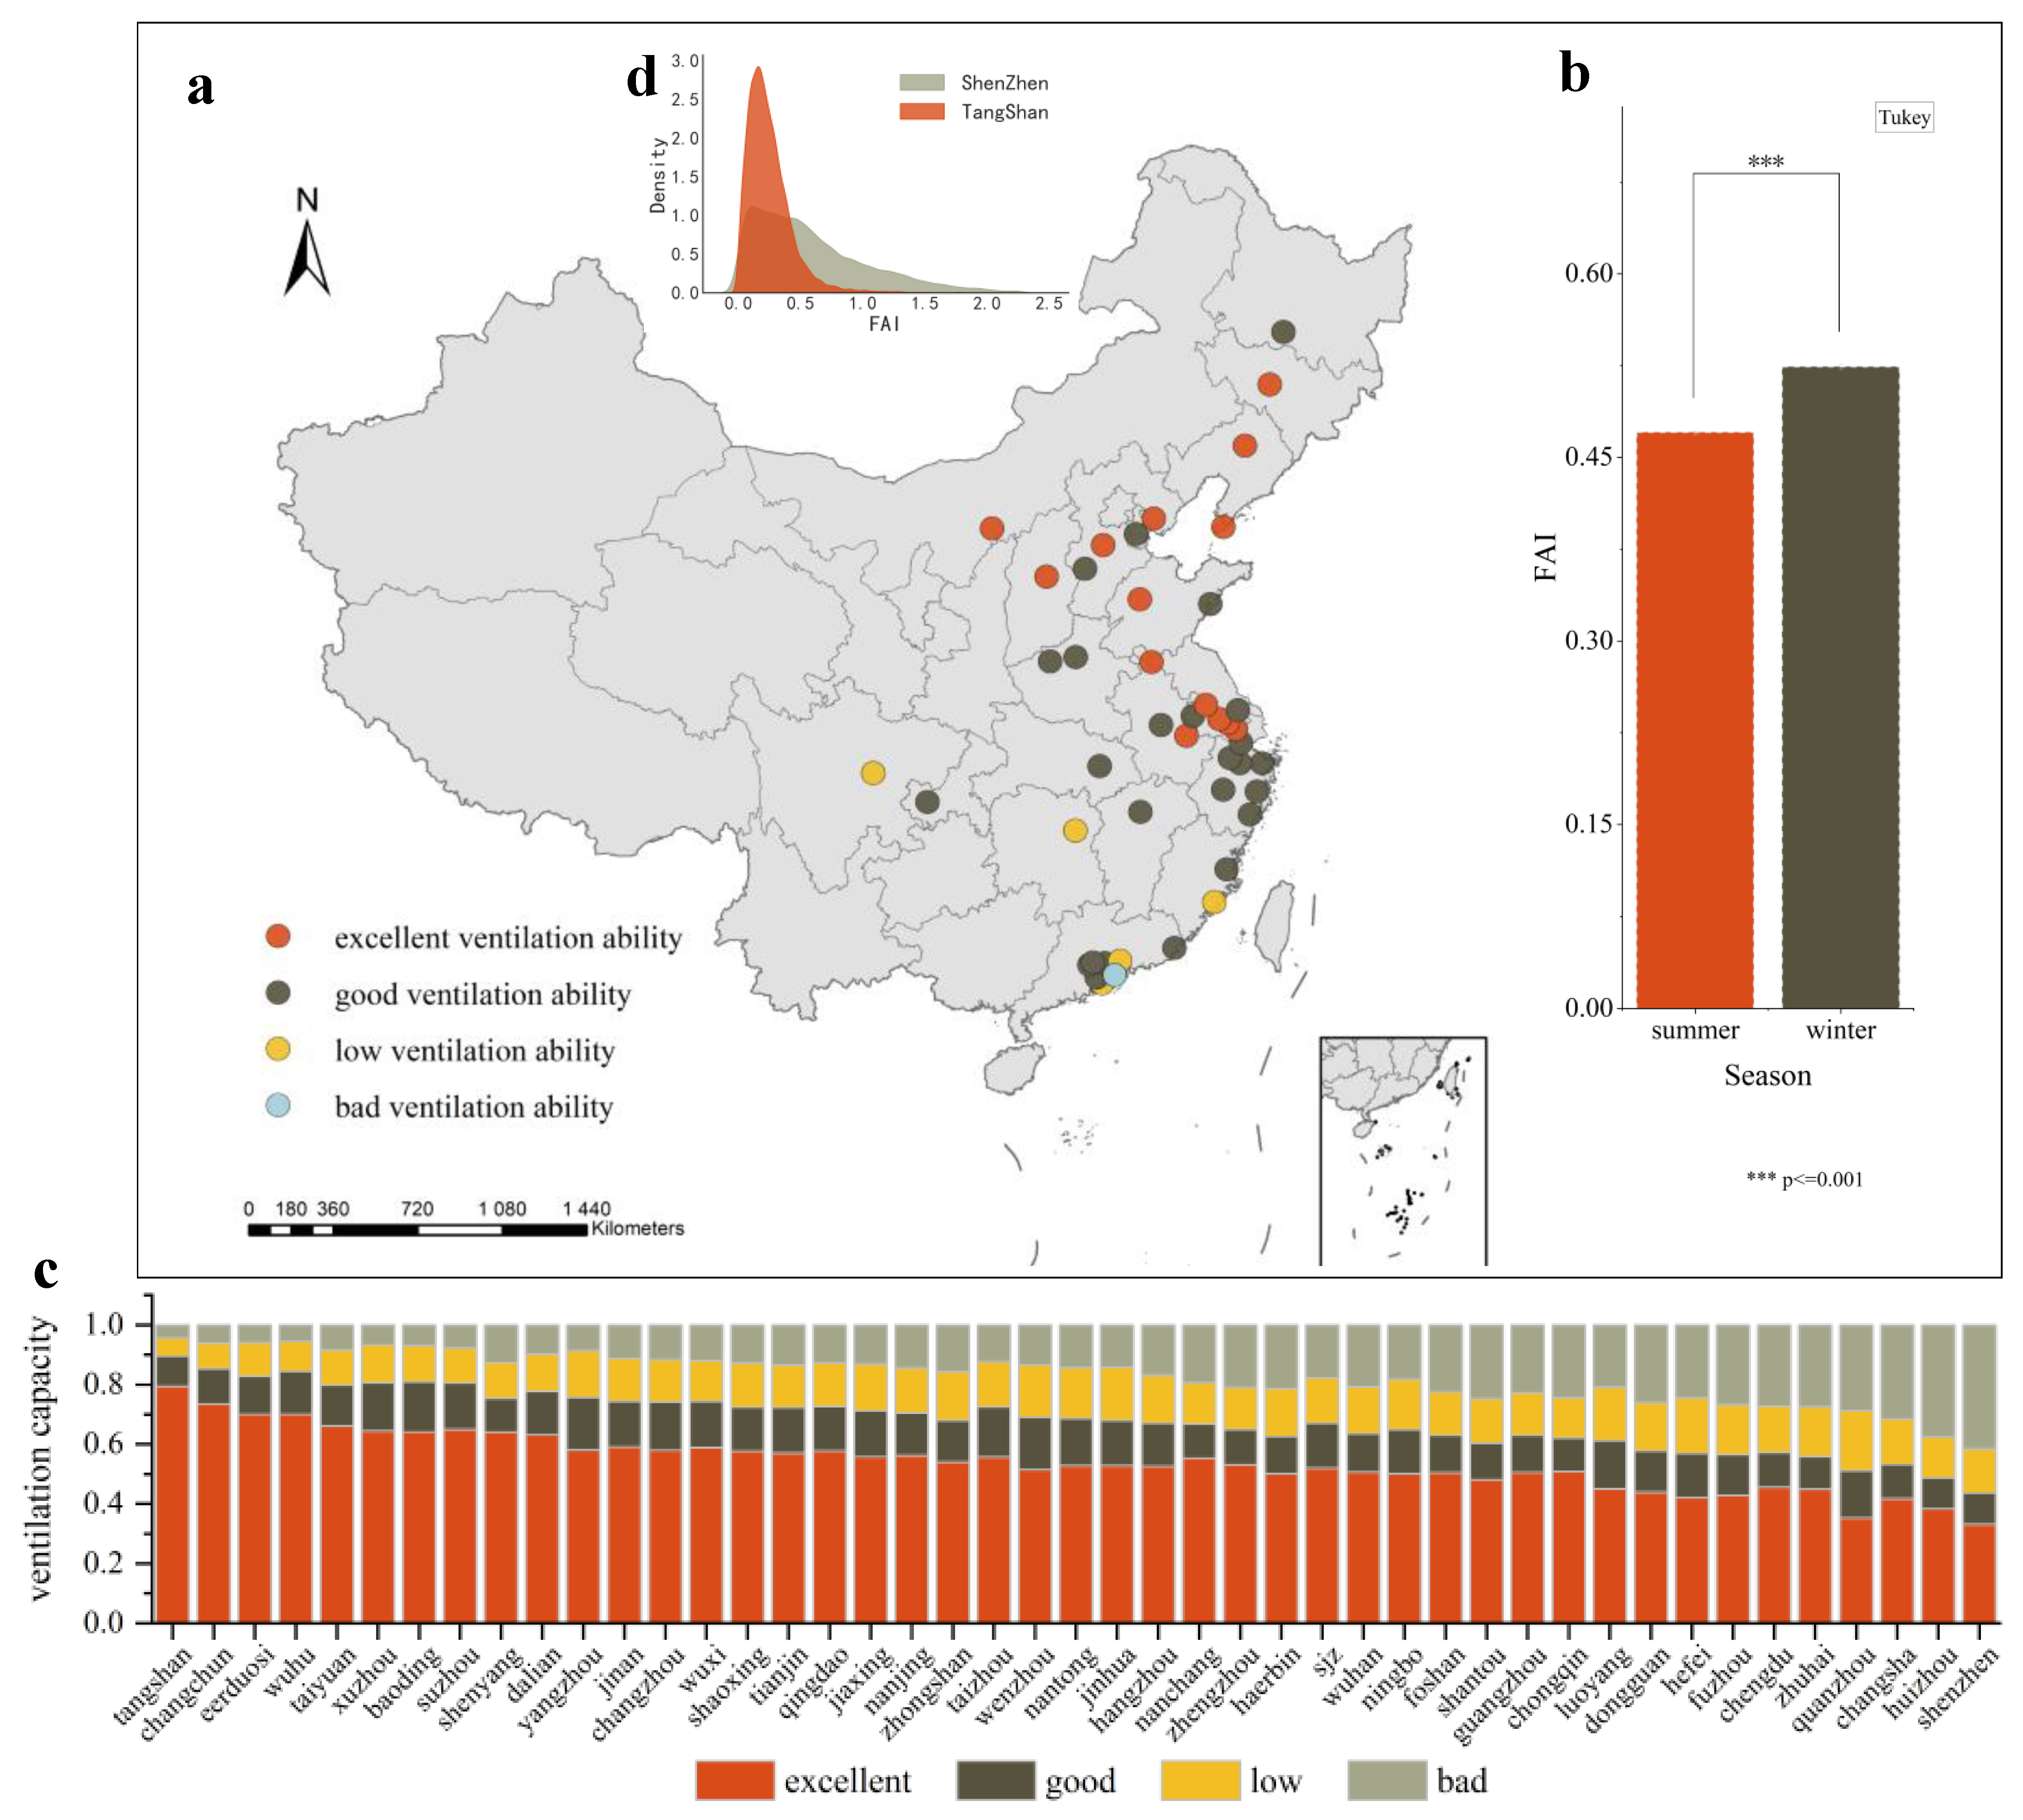
3.1. Analysis of Overall Ventilation Capacities of Industrial Cities Based on FAI

The FAIs of most of the industrial cities in China were less than 0.45, which means that the majority of the industrial cities had good (56%) or excellent (31%) natural ventilation effects (Figure 4a). Among them, Tangshan had the lowest average FAI (0.24). The FAIs of 79% of the areas in the city were less than 0.35, indicating an excellent ventilation ability; the FAIs of 89% of the areas were less than 0.45, indicating a good ventilation capacity. In contrast, the average FAI in Shenzhen was greater than 0.6, and the FAIs of 42% of the areas in the city were greater than 0.6, indicating that Shenzhen had the worst ventilation capacity among all of the industrial cities (Figure 4c,d). In addition, considering the seasonal differences, there is statistically significant difference in the FAI between winter and summer (Figure 4b), indicating that the ventilation capacities of the industrial cities exhibit large seasonal variation.

3.2. Analysis of Ventilation Capacity Differences in Industrial Cities Based on FAI

The FAIs of the industrial cities located in different climate zones were significantly different (p < 0.005, Figure 5a). As the latitude decreased, the FAIs of the cities increased, and the ventilation capacity decreased. The FAIs of all of the industrial cities in the northernmost middle temperate zone were less than 0.45, indicating excellent (75%) or good (25%) ventilation capacities. In contrast, the FAI of the industrial cities in the southernmost southern subtropical zone were all greater than 0.35, indicating that there are no cities with excellent ventilation capacities in this climate zone. Moreover, the cities with FAIs less than 0.45, that is, cities with good ventilation capacities, only accounted for 56% of all of the industrial cities in this climate zone. Similarly, there are significant differences in the FAIs of the cities of different sizes (p < 0.005, Figure 5b). In general, the smaller the city was, the smaller the FAI was, and the better the ventilation capacity was. Among the industrial cities analyzed in this study, the FAIs of 50% of the small cities and 31% of the medium cities were less than 0.35, and this situation did not occur in the large cities. This is mainly because the different climate zones and different city sizes led to differences in the city building density and building height [54]. Compared to large cities, the development of small and medium–sized cities is more backward, which leads to lower building heights, a lower density, and less obstructions to natural wind, leading to a better ventilation capacity in small and medium–sized cities. Compared to cities at low latitudes, cities in high latitudes have smaller solar zenith angles. In order to obtain more sunlight and to meet the demand for lighting, cities in high latitudes have lower buildings and lower density, which leads to a stronger ventilation capacity.

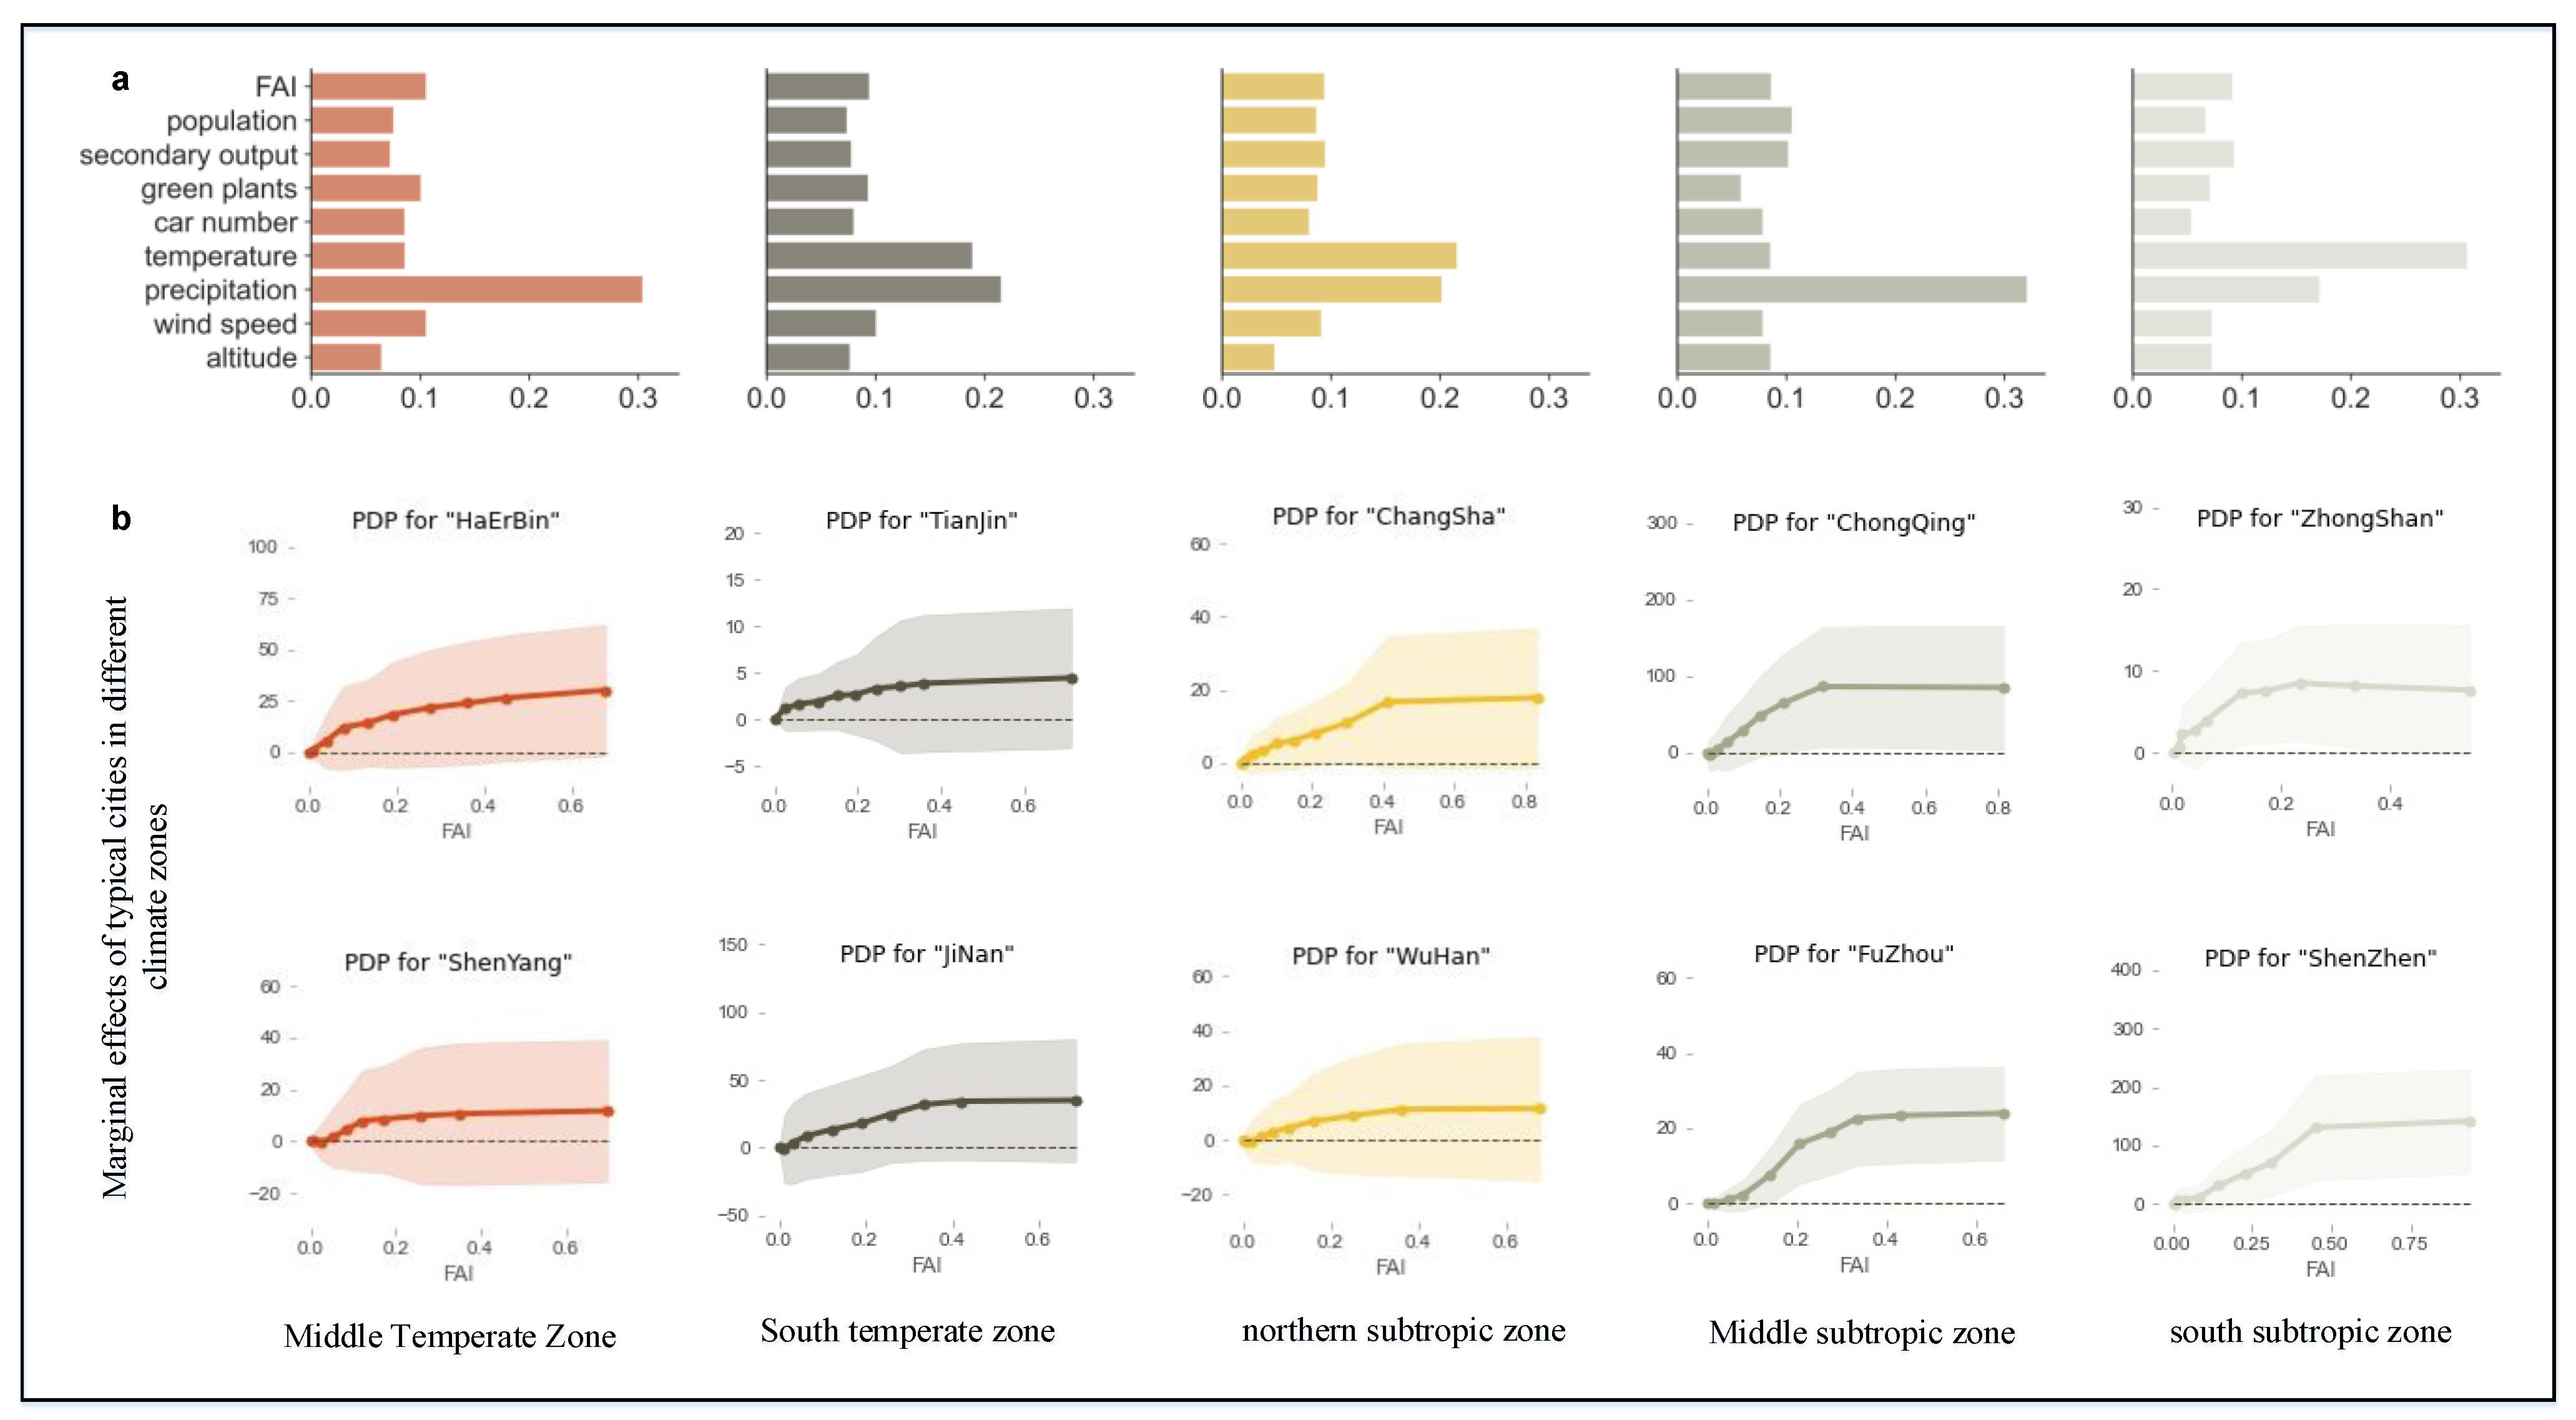
3.3. Influence of FAI on NO2 Concentration in Industrial Cities

There was a significant positive correlation between the FAI and NO2 concentration in the industrial cities [37], and the correlations were moderate (58%) and low (42%). The main reason for the lower correlations is that the concentrations of the air pollutants in the cities were controlled by a variety of factors. The correlation between each impact factor and the air pollutant concentration was not very high, which is consistent with most previous studies [14,15,16,17]. A moderate correlation was found between the FAI and NO2 concentration in all of the cities in the middle temperate zone, but only 33% of the cities in the southern subtropical zone had moderate correlations. The number of moderate correlations between the FAI and NO2 concentration in the large cities (88%) were stronger than those in the small and medium cities (51%). In terms of the relative contribution, the relative contribution of the meteorological factors such as temperature, precipitation, and wind speed to the NO2 concentration was higher than that of the human factors such as the FAI and secondary production ratio. However, the relative contribution of the FAI to the NO2 concentration was still 9%, which was higher than that of the other human factors. Similarly, in the different climate zones, the contributions of the different impact factors to the NO2 concentration were different, but the contribution of the FAI to the NO2 concentration remained at a relatively stable level. With the exception of the middle temperate zone (11%), the contribution of the FAI on the NO2 concentration in the other climate zones was stable at about 9%, which was consistent with the contribution of the FAI for the entire country (Figure 6a). However, the contribution of the FAI to the NO2 concentration varied among the different cities. Foshan had the lowest contribution (8%), and Zhongshan had the highest (27%). This difference was mainly caused by differences in city construction.
From the perspective of the marginal effect, according to the partial dependence plot (PDP), for most industrial cities, there was an obvious turning point in the influence curve of the FAI on the NO2 concentration (0.18 < FAI < 0.49) (Figure 6b). Before the turning point, the NO2 concentration increased significantly as the FAI increased. However, after the turning point, the influence of the FAI on the NO2 concentration began to decrease. Even if the FAI continued to increase, the increasing trend of the NO2 concentration was not obvious. A comparison of several cities revealed that the turning points of the temperate cities and subtropical cities were different. The turning points for subtropical cities (0.32) were higher than the turning points for temperate cities (0.2), which was 1.6 times higher than the value for temperate cities.
The relative contribution was further analyzed, meteorological factors such as temperature, rainfall, and wind speed had a greater impact on pollutants, which indicated that a city’s natural capacity is very important to suppress the NO2 concentration. The results of random forest importance were taken as weights, and the temperature, rainfall, and wind speed data of different cities were weighted and averaged to obtain the natural capacities. The results showed that Harbin, Shijiazhuang, Zhuhai, and other cities had relatively good natural capacities. These cities did not show particularly obvious spatial or climatic characteristics, but at least one of the three natural conditions—temperature, rainfall, and wind speed—was significantly higher than in other cities, such as rainfall in Harbin and wind speed in Zhuhai. In this case, the marginal effect of the FAI on the NO2 concentration was close to zero or even negative.

4. Discussion

4.1. FAI–Based NO2 Concentration Control Strategy

Based on the relative contribution analysis above, the relative contributions of the natural factors such as temperature, precipitation, and wind speed to the NO2 concentration were greater than those of the socioeconomic factors such as FAI and the urban secondary production ratio. These results are similar to the results of other previous studies [47,48,55]. Although lower than those of the natural factors, the relative contribution of the FAI to the NO2 concentration (9%) was greater than those of the other socioeconomic factors, such as the urban population. Furthermore, it is difficult to change the meteorological conditions such as wind and precipitation; hence, restraining the FAI at a certain level should be a feasible and efficient method of suppressing the urban NO2 concentration.
According to the results of marginal effect, the effect of the FAI on the NO2 concentration was divided into two stages according to the turning point, and different regulation strategies should be adopted according to different stages. Taking the industrial cities in the temperate zone as an example, the range of turning points is mainly between 0.18–0.30. If the city’s FAI is less than 0.18, the FAI has a strong influence on the NO2 concentration, then a series of measures can be taken to reduce the FAI, thereby effectively alleviating the city’s NO2 pollution, such as reducing the building density, reducing the building height and width, increasing single–family buildings, and increasing building gaps [20,42]. If the city’s FAI is greater than 0.30, then restraining the FAI to alleviate the city’s NO2 pollution is inefficient or even ineffective. Therefore, other measures are needed to alleviate the urban pollution, such as increasing the urban green spaces, relocating factories, and upgrading industrial institutions [56,57,58]. In addition, subtropical cities have a higher range of turning points (0.26–0.49), suggesting that FAI can play a role in mitigating pollution in cities with more compact or taller buildings compared to temperate cities.
Comparing the ventilation capacity of each industrial city with the turning point of the city, it can be seen that the FAIs of about 60% of the cities are less than or close to the turning points of the effect of the FAI on the NO2 concentration, indicating that for most cities, the urban ventilation capacity has a strong influence on the NO2 concentration. Therefore, the regulation of the FAI can be used as the main means to alleviate urban NO2 pollution. For the remaining cities, although the overall FAI of the city is higher than the turning point, there are still a large number of areas within the city where the FAI is smaller than the turning point. The FAI can be regulated in these areas to improve urban NO2 pollution.

4.2. FAI–Based NO2 Concentration Control Strategy

A city is a densely populated area with diverse social and economic activities, so it can be divided into different functional areas, such as industrial areas and commercial areas [59]. Based on the points of interest data and previous studies, in this study, the city was divided into five functional areas: residential, industrial, commercial, public service, and transportation [60,61]. The statistics of the FAI values of the different functional areas show that the average FAI of the commercial areas was 0.48 and the average FAI of the residential areas was 0.40, which were much greater than those of the industrial (0.29), transportation (0.33), and public service areas (0.29). Further analysis revealed that the average FAI values were greater than the turning points (0.18–0.49) in commercial and residential areas, indicating that the FAI had a weak influence on the NO2 concentration in the urban commercial and residential areas. In these places, even when the FAI is reduced, its effect on the NO2 concentration is insignificant. The reason for this is that commercial and residential areas are mainly located in the central area of the city [60]. Due to the high land price and intensive economic activities, buildings in these areas are mainly high–rises and high–density buildings that are more compact [6]. In these areas, the layout planning is relatively complete, and it is difficult to carry out large–scale transformation [62]. Even if the FAI value of the regions is reduced to a certain extent through a series of measures, the buildings in these regions still have a strong blocking effect on the natural wind, which is still not conducive to the diffusion and mitigation of NO2 and other pollutants. We believe that FAI regulation should be focused on service areas, transportation areas, and industrial areas. The FAI values of these three areas are all within the range of the turning point (0.18–0.49), indicating that the FAI values of these areas have a stronger influence on the NO2 concentration, so it will be easier to reduce the NO2 concentration in these cities by reducing the FAI. In particular, compared to industrial areas and transportation areas, public service areas are more closely connected to commercial and residential areas, and they are more likely to develop into high–value FAI areas, so they should become the key areas for urban planning and construction. A series of measures can be taken to reduce the FAI value by designing a low–building street aspect ratio, increasing the building porosity, designing stepped height buildings, and so on to fully alleviate NO2 pollution in cities [20,56].

4.3. Future Work

In this study, the ventilation capacities of China’s industrial cities were quantitatively evaluated by calculating the FAIs of the urban buildings and analyzing the relationship between FAI and the urban NO2 concentration. The results of this study provide guidance for related urban planning tasks. However, this research still had certain shortcomings. First, we only studied the changes in the urban NO2 concentration in the same year, and only one period of building–related vector data was available. Therefore, this study lacked a comparative study of long–term data series. In addition, this research only paid attention to the influence of the FAI index on the NO2 concentration, and the influence of the FAI on other air pollutants was ignored. Therefore, in the future, long–term research can be conducted by obtaining long–term pollutant data and building data. In addition, more air pollutants can be introduced, and the impact of the FAI on pollutants can be analyzed from a more comprehensive perspective.

5. Conclusions

In this study, the C# language was used to calculate the FAIs of 45 industrial cities in China, which were then used to quantitatively express their urban ventilation capacities. The results showed that China’s industrial cities generally had excellent and good ventilation capacities, and the ventilation capacity was affected by the wind direction in winter and summer. There were significant differences in the ventilation capacities of industrial cities of different sizes and in different climatic zones. Second, based on a regression algorithm and random forest algorithm, the correlation with, relative contribution to, and marginal effects of the urban FAI on the NO2 concentration were calculated. Notably, the FAI and NO2 had significant correlations, and the relative contribution was stable at about 9%, which was lower than those of the natural factors but generally higher than those of the social factors. For most industrial cities, there was a turning point in the influence of the FAI on the NO2 concentration. If the city’s FAI was below the turning point, the city’s FAI could be amended to improve the city’s NO2 concentration. If the city’s FAI was already above the turning point, the method of suppressing the urban NO2 concentration by restraining the urban FAI would be inefficient. The FAIs of about 60% of the cities are less than or close to the turning points of the effect of the FAI on the NO2 concentration, indicating that for most cities, the regulation of the FAI can be used as the main means to alleviate urban NO2 pollution.

Author Contributions

Conceptualization, S.M. and P.A.; methodology, S.M.; software, S.M.; validation, Y.Z., W.G. and Y.J.; formal analysis, S.M. and Y.Z.; investigation, Y.J., H.Z., Y.L., S.C. and X.C.; resources, S.M. and Y.Z.; data curation, S.M., Y.Z. and W.G.; writing—original draft preparation, S.M.; writing—review and editing, S.M., P.A. and Z.P.; visualization, S.M., G.Z. and Y.Z.; supervision, P.A., Z.P. and F.L.; funding acquisition, P.A., Z.P. and S.M. All authors have read and agreed to the published version of the manuscript.

Funding

This work was supported by the National Key Research and Development Plan of China (2018YFA0606300).

Acknowledgments

We thank LetPub (www.letpub.com (accessed on 23 February 2022)) for its linguistic assistance during the preparation of this manuscript. The authors wish to express heartfelt thanks to Wen Zhang for her kind help.

Conflicts of Interest

The authors declare no conflict of interest.

Appendix A

Figure A1. Mean absolute percentage error (MAPE) regression loss. MAPE can provide error assessments for the results of the random forest method for each city.
Remotesensing 14 03348 g0a1

References

  1. Salmond, J.; Sabel, C.E.; Vardoulakis, S. Towards the Integrated Study of Urban Climate, Air Pollution, and Public Health. Climate 2018, 6, 14. [Google Scholar] [CrossRef] [Green Version]
  2. Hertel, O.; Goodsite, M. Urban Air Pollution Climates Throughout the World. In Issues in Environmental Science and Technology; Royal Society of Chemistry: Cambridge, UK, 2009; Volume 28, pp. 1–22. [Google Scholar]
  3. Givati, A.; Rosenfeld, D. Quantifying Precipitation Suppression Due to Air Pollution. J. Appl. Meteorol. 2004, 43, 1038–1056. [Google Scholar] [CrossRef]
  4. Zheng, Z.; Ren, G.; Wang, H.; Dou, J.; Gao, Z.; Duan, C.; Li, Y.; Ngarukiyimana, J.P.; Zhao, C.; Cao, C.; et al. Relationship Between Fine-Particle Pollution and the Urban Heat Island in Beijing, China: Observational Evidence. Bound.-Lay. Meteorol. 2018, 169, 93–113. [Google Scholar] [CrossRef]
  5. Cao, C.; Lee, X.; Liu, S.; Schultz, N.; Xiao, W.; Zhang, M.; Zhao, L. Urban heat islands in China enhanced by haze pollution. Nat. Commun. 2016, 7, 12509. [Google Scholar] [CrossRef] [PubMed]
  6. Zhou, Y.; Zhang, G.; Jiang, L.; Chen, X.; Xie, T.; Wei, Y.; Xu, L.; Pan, Z.; An, P.; Lun, F. Mapping local climate zones and their associated heat risk issues in Beijing: Based on open data. Sustain. Cities Soc. 2021, 74, 103174. [Google Scholar] [CrossRef]
  7. Yamamoto, S.S.; Phalkey, R.; Malik, A.A. A systematic review of air pollution as a risk factor for cardiovascular disease in South Asia: Limited evidence from India and Pakistan. Int. J. Hydrogen. Environ. Health 2014, 217, 133–144. [Google Scholar] [CrossRef]
  8. Hoq, M.N.; Alam, R.; Amin, A. Prediction of Possible Asthma Attack from Air Pollutants: Towards a High Density Air Pollution Map for Smart Cities to Improve Living. In Proceedings of the 2019 International Conference on Electrical, Computer and Communication Engineering (ECCE), Cox’s Bazar, Bangladesh, 7–9 February 2019; pp. 1–5. [Google Scholar]
  9. Berkowicz, R.; Palmgren, F.; Hertel, O.; Vignati, E. Using measurements of air pollution in streets for evaluation of urban air quality—Meterological analysis and model calculations. Sci. Total Environ. 1996, 189–190, 259–265. [Google Scholar] [CrossRef]
  10. Miao, S.; Li, P.; Wang, X. Building morphological characteristics and their effect on the wind in Beijing. Adv. Atmos. Sci. 2009, 26, 1115. [Google Scholar] [CrossRef]
  11. Chen, G.; Rong, L.; Zhang, G. Impacts of urban geometry on outdoor ventilation within idealized building arrays under unsteady diurnal cycles in summer. Build. Environ. 2021, 206, 108344. [Google Scholar] [CrossRef]
  12. Peng, Y.; Gao, Z.; Buccolieri, R.; Shen, J.; Ding, W. Urban ventilation of typical residential streets and impact of building form variation. Sustain. Cities Soc. 2021, 67, 102735. [Google Scholar] [CrossRef]
  13. Bai, L.; Jiang, L.; Yang, D.; Liu, Y. Quantifying the spatial heterogeneity influences of natural and socioeconomic factors and their interactions on air pollution using the geographical detector method: A case study of the Yangtze River Economic Belt, China. J. Clean. Prod. 2019, 232, 692–704. [Google Scholar] [CrossRef]
  14. He, J.; Gong, S.; Yu, Y.; Yu, L.; Wu, L.; Mao, H.; Song, C.; Zhao, S.; Liu, H.; Li, X.; et al. Air pollution characteristics and their relation to meteorological conditions during 2014–2015 in major Chinese cities. Environ. Pollut. 2017, 223, 484–496. [Google Scholar] [CrossRef] [PubMed]
  15. Ma, T.; Duan, F.; He, K.; Qin, Y.; Tong, D.; Geng, G.; Liu, X.; Li, H.; Yang, S.; Ye, S.; et al. Air pollution characteristics and their relationship with emissions and meteorology in the Yangtze River Delta region during 2014–2016. J. Environ. Sci.-China 2019, 83, 8–20. [Google Scholar] [CrossRef] [PubMed]
  16. Qin, J.; Wang, S.; Guo, L.; Xu, J. Spatial Association Pattern of Air Pollution and Influencing Factors in the Beijing–Tianjin–Hebei Air Pollution Transmission Channel: A Case Study in Henan Province. Int. J. Environ. Res. Public Health 2020, 17, 1598. [Google Scholar] [CrossRef] [Green Version]
  17. Lamsal, L.N.; Martin, R.V.; Parrish, D.D.; Krotkov, N.A. Scaling Relationship for NO2 Pollution and Urban Population Size: A Satellite Perspective. Environ. Sci. Technol. 2013, 47, 7855–7861. [Google Scholar] [CrossRef]
  18. Wong, M.S.; Nichol, J.; Ng, E. A study of the “wall effect” caused by proliferation of high-rise buildings using GIS techniques. Landsc. Urban Plan. 2011, 102, 245–253. [Google Scholar] [CrossRef]
  19. Yang, J.; Wang, Y.; Xue, B.; Li, Y.; Xiao, X.; Xia, J.C.; He, B. Contribution of urban ventilation to the thermal environment and urban energy demand: Different climate background perspectives. Sci. Total Environ. 2021, 795, 148791. [Google Scholar] [CrossRef]
  20. Jiang, Z.; Cheng, H.; Zhang, P.; Kang, T. Influence of urban morphological parameters on the distribution and diffusion of air pollutants: A case study in China. J. Environ. Sci.-China 2021, 105, 163–172. [Google Scholar] [CrossRef]
  21. Shi, Y.; Xie, X.; Fung, J.C.; Ng, E. Identifying critical building morphological design factors of street-level air pollution dispersion in high-density built environment using mobile monitoring. Build. Environ. 2018, 128, 248–259. [Google Scholar] [CrossRef] [Green Version]
  22. Gál, T.M.; Sümeghy, Z. Mapping the roughness parameters in a large urban area for urban climate applications. Acta Climatol. ET Chorol. 2007, 40, 27–36. [Google Scholar]
  23. Gál, T.; Unger, J. Detection of ventilation paths using high-resolution roughness parameter mapping in a large urban area. Build. Environ. 2009, 44, 198–206. [Google Scholar] [CrossRef]
  24. Lettau, H. Note on Aerodynamic Roughness-Parameter Estimation on the Basis of Roughness-Element Description. J. Appl. Meteorol. Clim. 1969, 8, 828–832. [Google Scholar] [CrossRef] [Green Version]
  25. Ratti, C.; Di Sabatino, S.; Britter, R.; Brown, M.; Caton, F.; Burian, S. Analysis of 3-D Urban Databases with Respect to Pollution Dispersion for a Number of European and American Cities. Water Air Soil Pollut. Focus 2002, 2, 459–469. [Google Scholar] [CrossRef]
  26. Yuan, C.; Ren, C.; Ng, E. GIS-based surface roughness evaluation in the urban planning system to improve the wind environment—A study in Wuhan, China. Urban Clim. 2014, 10, 585–593. [Google Scholar] [CrossRef]
  27. Hu, J.; Wang, Y.; Ying, Q.; Zhang, H. Spatial and temporal variability of PM2.5 and PM10 over the North China Plain and the Yangtze River Delta, China. Atmos. Environ. 2014, 95, 598–609. [Google Scholar] [CrossRef]
  28. Song, C.; Wu, L.; Xie, Y.; He, J.; Chen, X.; Wang, T.; Lin, Y.; Jin, T.; Wang, A.; Liu, Y.; et al. Air pollution in China: Status and spatiotemporal variations. Environ. Pollut. 2017, 227, 334–347. [Google Scholar] [CrossRef]
  29. Xu, W.; Sun, J.; Liu, Y.; Xiao, Y.; Tian, Y.; Zhao, B.; Zhang, X. Spatiotemporal variation and socioeconomic drivers of air pollution in China during 2005–2016. J. Environ. Manag. 2019, 245, 66–75. [Google Scholar] [CrossRef]
  30. Zeng-kai, Z.; Yu-ting, L.; Peng-yu, Z.; Yuan, W.; Ning, J.; Alam, R. The assessment of economic cost induced by emergency responses for heavy pollution weather within Jing-Jin-Ji area in 2019. China Environ. Sci. 2021, 41, 3399–3408. [Google Scholar]
  31. Prunet, P.; Lezeaux, O.; Camy-Peyret, C.; Thevenon, H. Analysis of the NO2 tropospheric product from S5P TROPOMI for monitoring pollution at city scale. City Environ. Interact. 2020, 8, 100051. [Google Scholar] [CrossRef]
  32. Zhao, S.; Liu, S.; Hou, X.; Cheng, F.; Wu, X.; Dong, S.; Beazley, R. Temporal dynamics of SO2 and NOX pollution and contributions of driving forces in urban areas in China. Environ. Pollut. 2018, 242, 239–248. [Google Scholar] [CrossRef]
  33. Anenberg, S.C.; Horowitz, L.W.; Tong, D.Q.; West, J.J. An Estimate of the Global Burden of Anthropogenic Ozone and Fine Particulate Matter on Premature Human Mortality Using Atmospheric Modeling. Environ. Health Perspect. 2010, 118, 1189–1195. [Google Scholar] [CrossRef] [PubMed]
  34. Bert, B.; Stephen, T.H. Air pollution and health. Lancet 2002, 360, 1233–1242. [Google Scholar]
  35. Townsend, A.R.; Howarth, R.W.; Bazzaz, F.A.; Booth, M.S.; Cleveland, C.C.; Collinge, S.K.; Collinge, A.P.; Dobson, P.R.; Epstein, E.A.; Holland, D.R.; et al. Human Health Effects of a Changing Global Nitrogen Cycle. Front. Ecol. Environ. 2003, 1, 240–246. [Google Scholar] [CrossRef]
  36. US EPA National Center for Environmental Assessment-RTP Division; Luben, T. Integrated Science Assessment for Oxides of Nitrogen—Health Criteria; US EPA—Environmental Protection Agency: Washington, DC, USA, 2008. [Google Scholar]
  37. Shi, Y.; Lau, K.K.; Ng, E. Incorporating wind availability into land use regression modelling of air quality in mountainous high-density urban environment. Environ. Res. 2017, 157, 17–29. [Google Scholar] [CrossRef]
  38. Wei, S.; Huang, H.C.; Yang, J. An optimization algorithm for calculating the frontal area ratio. Jilin Norm. Univ. J. (Nat. Sci. Ed.) 2019, 40, 136–140. [Google Scholar]
  39. Grimmond, C.S.B.; Oke, T.R. Aerodynamic Properties of Urban Areas Derived from Analysis of Surface Form. J. Appl. Meteorol. 1999, 38, 1262–1292. [Google Scholar] [CrossRef]
  40. Rotach, M.W. Determination of the zero plane displacement in an urban environment. Bound.-Lay. Meteorol. 1994, 67, 187–193. [Google Scholar] [CrossRef]
  41. Ng, E.; Yuan, C.; Chen, L.; Ren, C.; Fung, J.C.H. Improving the wind environment in high-density cities by understanding urban morphology and surface roughness: A study in Hong Kong. Landsc. Urban Plan. 2011, 101, 59–74. [Google Scholar] [CrossRef]
  42. Yuan, C.; Ng, E.; Norford, L.K. Improving air quality in high-density cities by understanding the relationship between air pollutant dispersion and urban morphologies. Build. Environ. 2014, 71, 245–258. [Google Scholar] [CrossRef]
  43. Li, J.; Lin, B. Ecological total-factor energy efficiency of China’s heavy and light industries: Which performs better? Renew. Sustain. Energy Rev. 2017, 72, 83–94. [Google Scholar] [CrossRef]
  44. Wang, Y.; Liu, C.; Wang, Q.; Qin, Q.; Ren, H.; Cao, J. Impacts of natural and socioeconomic factors on PM2.5 from 2014 to 2017. J. Environ. Manag. 2021, 284, 112071. [Google Scholar] [CrossRef] [PubMed]
  45. Zhang, X.; Yan, B.; Du, C.; Cheng, C.; Zhao, H. Quantifying the interactive effects of meteorological, socioeconomic, and pollutant factors on summertime ozone pollution in China during the implementation of two important policies. Atmos. Pollut. Res. 2021, 12, 101248. [Google Scholar] [CrossRef]
  46. Han, L.; Zhou, W.; Li, W.; Meshesha, D.T.; Li, L.; Zheng, M. Meteorological and urban landscape factors on severe air pollution in Beijing. J. Air Waste Manag. 2015, 65, 782–787. [Google Scholar] [CrossRef] [Green Version]
  47. Liu, H.; Fang, C.; Zhang, X.; Wang, Z.; Bao, C.; Li, F. The effect of natural and anthropogenic factors on haze pollution in Chinese cities: A spatial econometrics approach. J. Clean. Prod. 2017, 165, 323–333. [Google Scholar] [CrossRef]
  48. Yang, D.; Wang, X.; Xu, J.; Xu, C.; Lu, D.; Ye, C.; Wang, Z.; Bai, L. Quantifying the influence of natural and socioeconomic factors and their interactive impact on PM2.5 pollution in China. Environ. Pollut. 2018, 241, 475–483. [Google Scholar] [CrossRef] [PubMed]
  49. Ho, T.K. Random Decision Forest. In Proceedings of the 3rd International Conference on Document Analysis and Recognition, Montreal, QC, Canada, 14–16 August 1995; pp. 278–282. [Google Scholar]
  50. Ali, J.; Khan, R.; Ahmad, N.; Maqsood, I. Random Forests and Decision Trees. Int. J. Comput. Sci. Issues 2012, 9, 272. [Google Scholar]
  51. Gislason, P.O.; Benediktsson, J.A.; Sveinsson, J.R. Random Forest classification of multisource remote sensing and geographic data. In Proceedings of the IEEE International Geoscience & Remote Sensing Symposium, Anchorage, AK, USA, 20–24 September 2004. [Google Scholar]
  52. Heilmayer, O.; Brey, T.; Pörtner, H.O. Growth Efficiency and Temperature in Scallops: A Comparative Analysis of Species Adapted to Different Temperatures. Funct. Ecol. 2004, 18, 641–647. [Google Scholar] [CrossRef] [Green Version]
  53. Pedregosa, F.; Varoquaux, G.; Gramfort, A.; Michel, V.; Thirion, B.; Grisel, O.; Blondel, M.; Louppe, G.; Prettenhofer, P.; Weiss, R.; et al. Scikit-learn: Machine Learning in Python. J. Mach. Learn. Res. 2011, 12, 2825–2830. [Google Scholar]
  54. Li, H.; Liu, Y.; Zhang, H.; Xue, B.; Li, W. Urban morphology in China: Dataset development and spatial pattern characterization. Sustain. Cities Soc. 2021, 71, 102981. [Google Scholar] [CrossRef]
  55. Ren, L.; Matsumoto, K. Effects of socioeconomic and natural factors on air pollution in China: A spatial panel data analysis. Sci. Total Environ. 2020, 740, 140155. [Google Scholar] [CrossRef]
  56. Yang, J.; Shi, B.; Shi, Y.; Marvin, S.; Zheng, Y.; Xia, G. Air pollution dispersal in high density urban areas: Research on the triadic relation of wind, air pollution, and urban form. Sustain. Cities Soc. 2020, 54, 101941. [Google Scholar] [CrossRef]
  57. Lu, J.; Li, B.; Li, H.; Al-Barakani, A. Expansion of city scale, traffic modes, traffic congestion, and air pollution. Cities 2021, 108, 102974. [Google Scholar] [CrossRef]
  58. Sun, C.; Luo, Y.; Li, J. Urban traffic infrastructure investment and air pollution: Evidence from the 83 cities in China. J. Clean. Prod. 2018, 172, 488–496. [Google Scholar] [CrossRef]
  59. Yu, Z.; Jing, Y.; Yang, G.; Sun, R. A New Urban Functional Zone-Based Climate Zoning System for Urban Temperature Study. Remote Sens. 2021, 13, 251. [Google Scholar] [CrossRef]
  60. Gong, P.; Chen, B.; Li, X.; Liu, H.; Wang, J.; Bai, Y.; Chen, J.; Chen, X.; Fang, L.; Feng, S.; et al. Mapping essential urban land use categories in China (EULUC-China): Preliminary results for 2018. Sci. Bull. 2020, 65, 182–187. [Google Scholar] [CrossRef] [Green Version]
  61. Zhang, X.; Du, S.; Wang, Q. Hierarchical semantic cognition for urban functional zones with VHR satellite images and POI data. ISPRS J. Photogramm. Remote Sens. 2017, 132, 170–184. [Google Scholar] [CrossRef]
  62. Ng, E. Air Ventilation Assessment System for High Density Planning and Design. In Proceedings of the 2006 Xi’an International Conference of Architecture and Technology, Xi’an, China, 6–8 September 2006; pp. 667–675. [Google Scholar]
Figure 1. The study area and the fraction of secondary industry in the cities under investigation in 2019.
Remotesensing 14 03348 g001
Figure 2. Research framework: (a) data sources are presented, including construction data, NO2 concentration data, and some socio–economic data; (b) the specific process of the research is shown, in which the yellow part represents the research content, and the gray part represents the research data and research methods; (c) data sources are presented, including wind speed, wind direction, and other natural data.
Remotesensing 14 03348 g002
Figure 3. The principle of FAI calculation: (a) the frontal area of buildings in a unit grid; (b) schematic diagram of FAI calculation principle based on minimum enclosing rectangle.
Remotesensing 14 03348 g003
Figure 4. Ventilation capacities of 45 industrial cities: (a) the spatial distribution of ventilation capacities in 45 cities; (b) comparison of urban FAI in winter and summer; (c) the proportion of different levels of the ventilation capacity in each city; (d) density plots of FAI in Shenzhen and Tangshan.
Remotesensing 14 03348 g004
Figure 5. Tukey’s multiple comparisons of FAI in different cities. The figure uses letters on different bar charts to show differences. If the letters on two bars that are the same, there is no difference between them, whereas if the letters are different, there is a difference. (a) Cities in different climate zones; (b) cities of different sizes.
Remotesensing 14 03348 g005
Figure 6. Relationship between FAI and NO2 concentration. Different colors indicate different temperature zones: (a) the contribution of FAI to NO2 concentration in different climate zones; (b) the dependence plots of cities in different climate zones.
Remotesensing 14 03348 g006
Table 1. Data sources.
DataTimeDetails of the DataPurpose Source
Construction data2019Vector dataCalculate the frontal areahttps://lbsyun.baidu.com/ (accessed on 20 June 2021)
Sentinel–5P2019Annual average of the tropospheric column of NO2Determine NO2 concentration in industrial citieshttps://s5phub.copernicus.eu/dhus/#/home (accessed on 7 May 2022)
Meteorological data2019Daily data recorded by Chinese ground observation stations, which is corresponds to the daily mean windDetermine the wind directionhttps://data.cma.cn/ (accessed on 14 May 2022)
Climatic zoning data2016Annual average dataDetermine the city wind direction, demeanor, rainfall, and other natural factorshttps://www.resdc.cn/Default.aspx (accessed on 5 October 2021)
Urban secondary industry and population data2019Annual average dataDetermine the size of the cityhttps://www.resdc.cn/Default.aspx (accessed on 5 October 2021)
Traffic2019Obtain vehicle speed data from different streets and calculate the number of vehicles using the relationship between vehicle speeds data and the number of vehiclesDetermine the number of cars per gridhttps://lbs.amap.com/api/webservice/guide/api/direction (accessed on 27 May 2022)
Publisher’s Note: MDPI stays neutral with regard to jurisdictional claims in published maps and institutional affiliations.

