Risk Factors for Recurrence in Serous Borderline Ovarian Tumors and Early-Stage Low-Grade Serous Ovarian Carcinoma

Abstract
:1. Introduction
2. Materials and Methods
3. Results
3.1. Patterns of Recurrence for FSS Group and RS Group
3.2. Patients Clinicopathological Characteristics
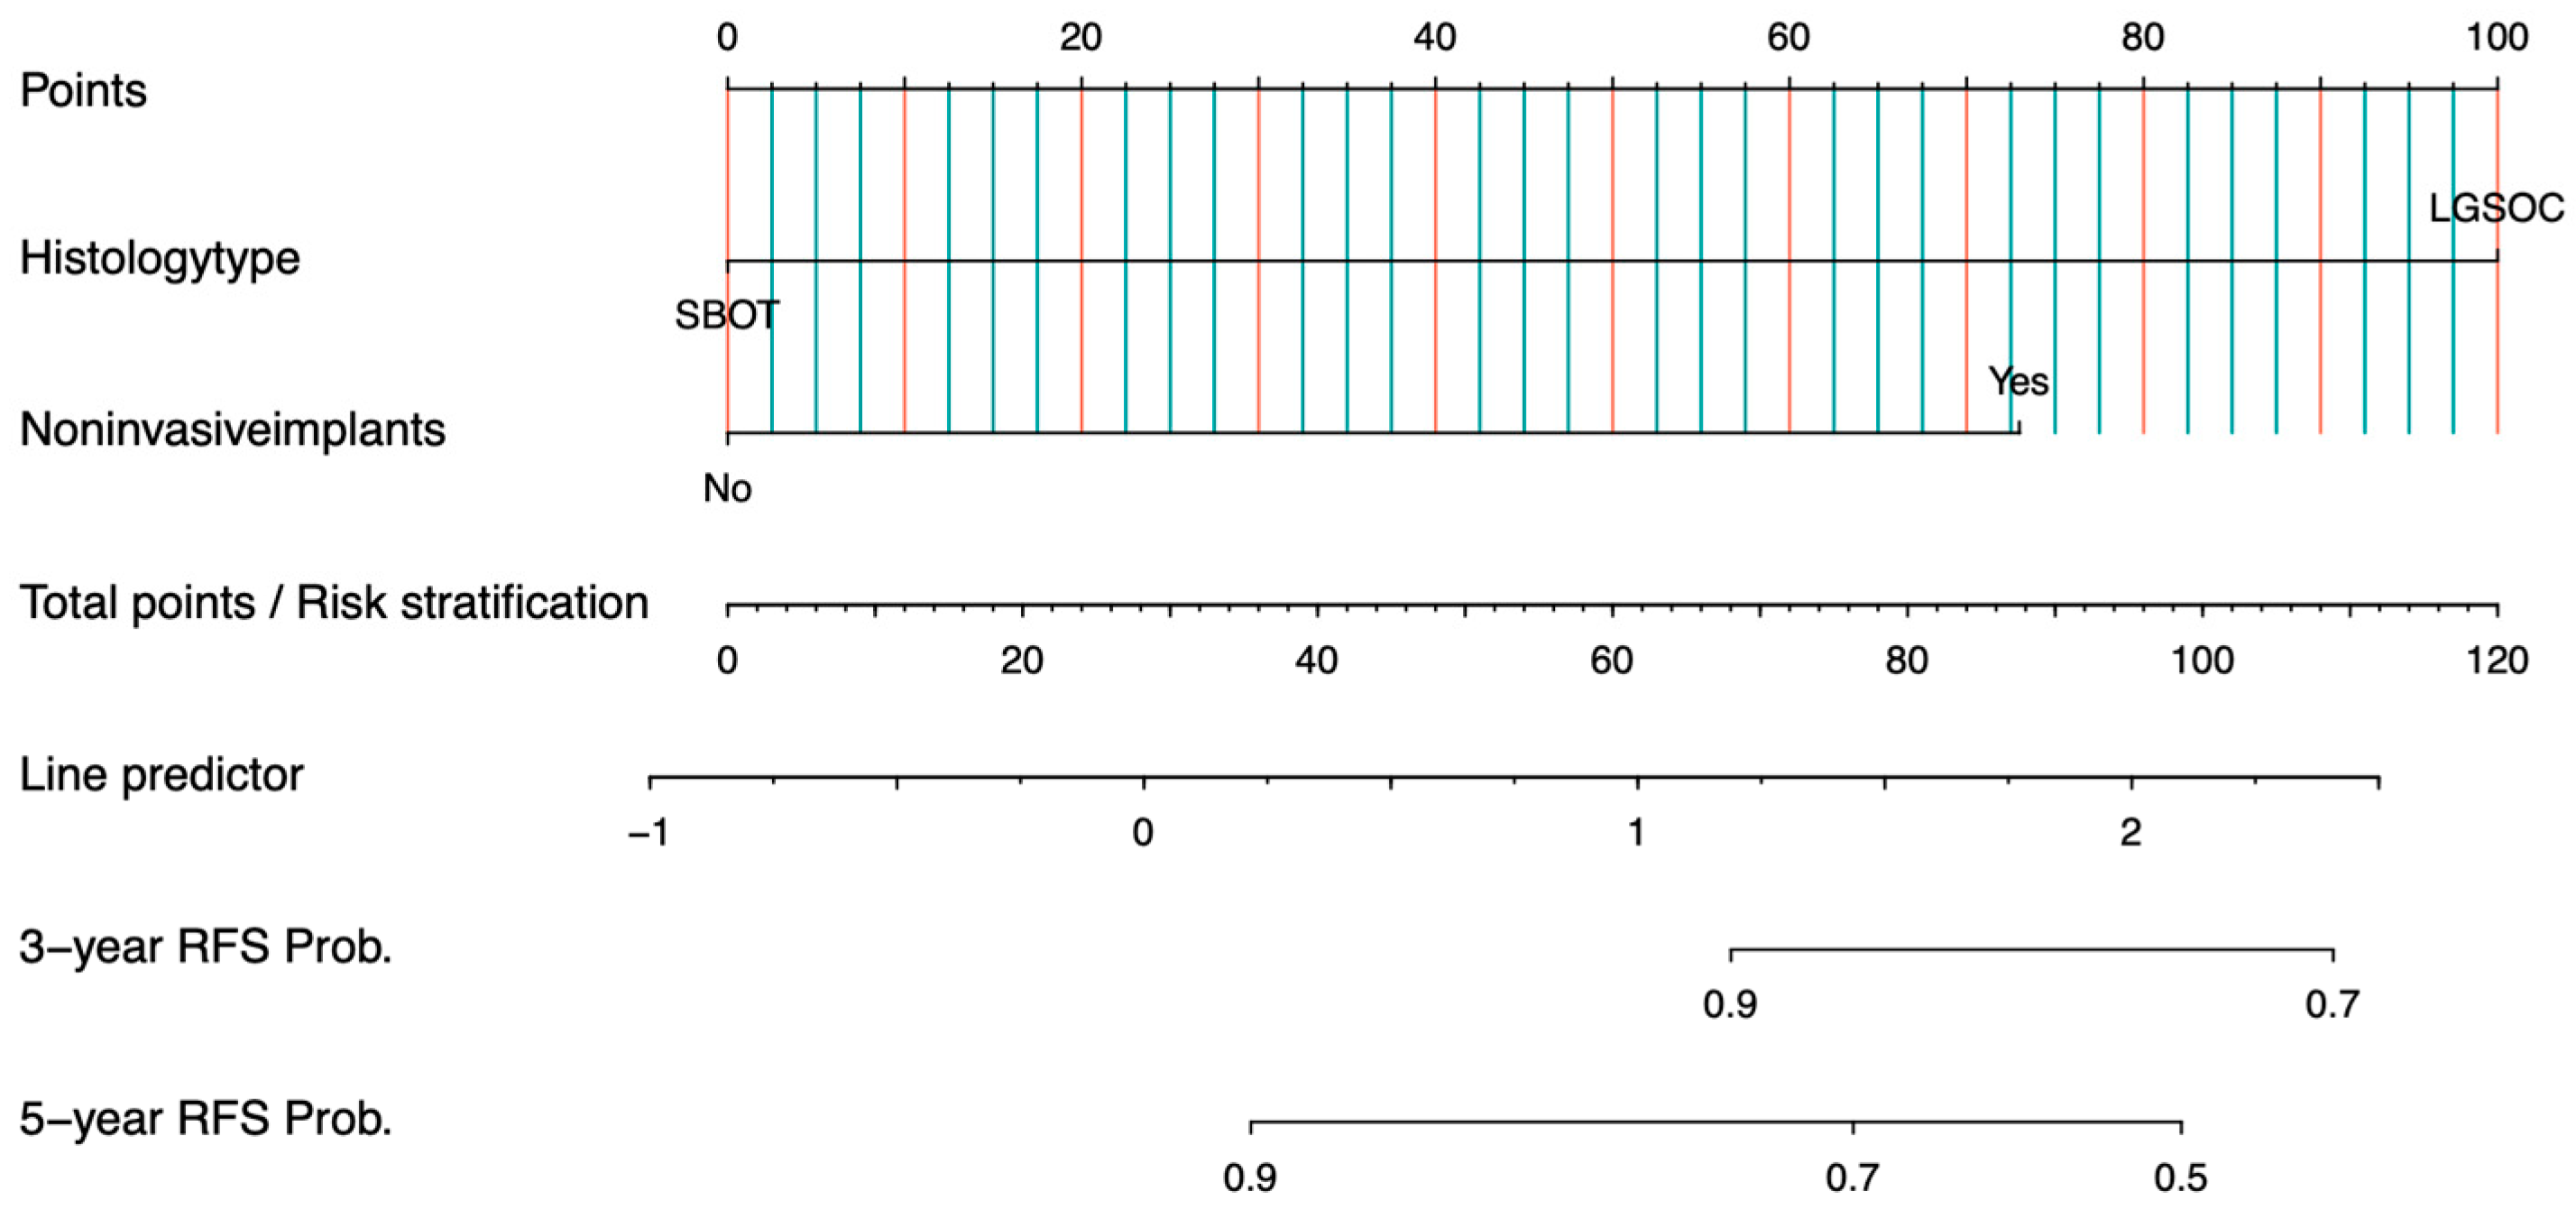
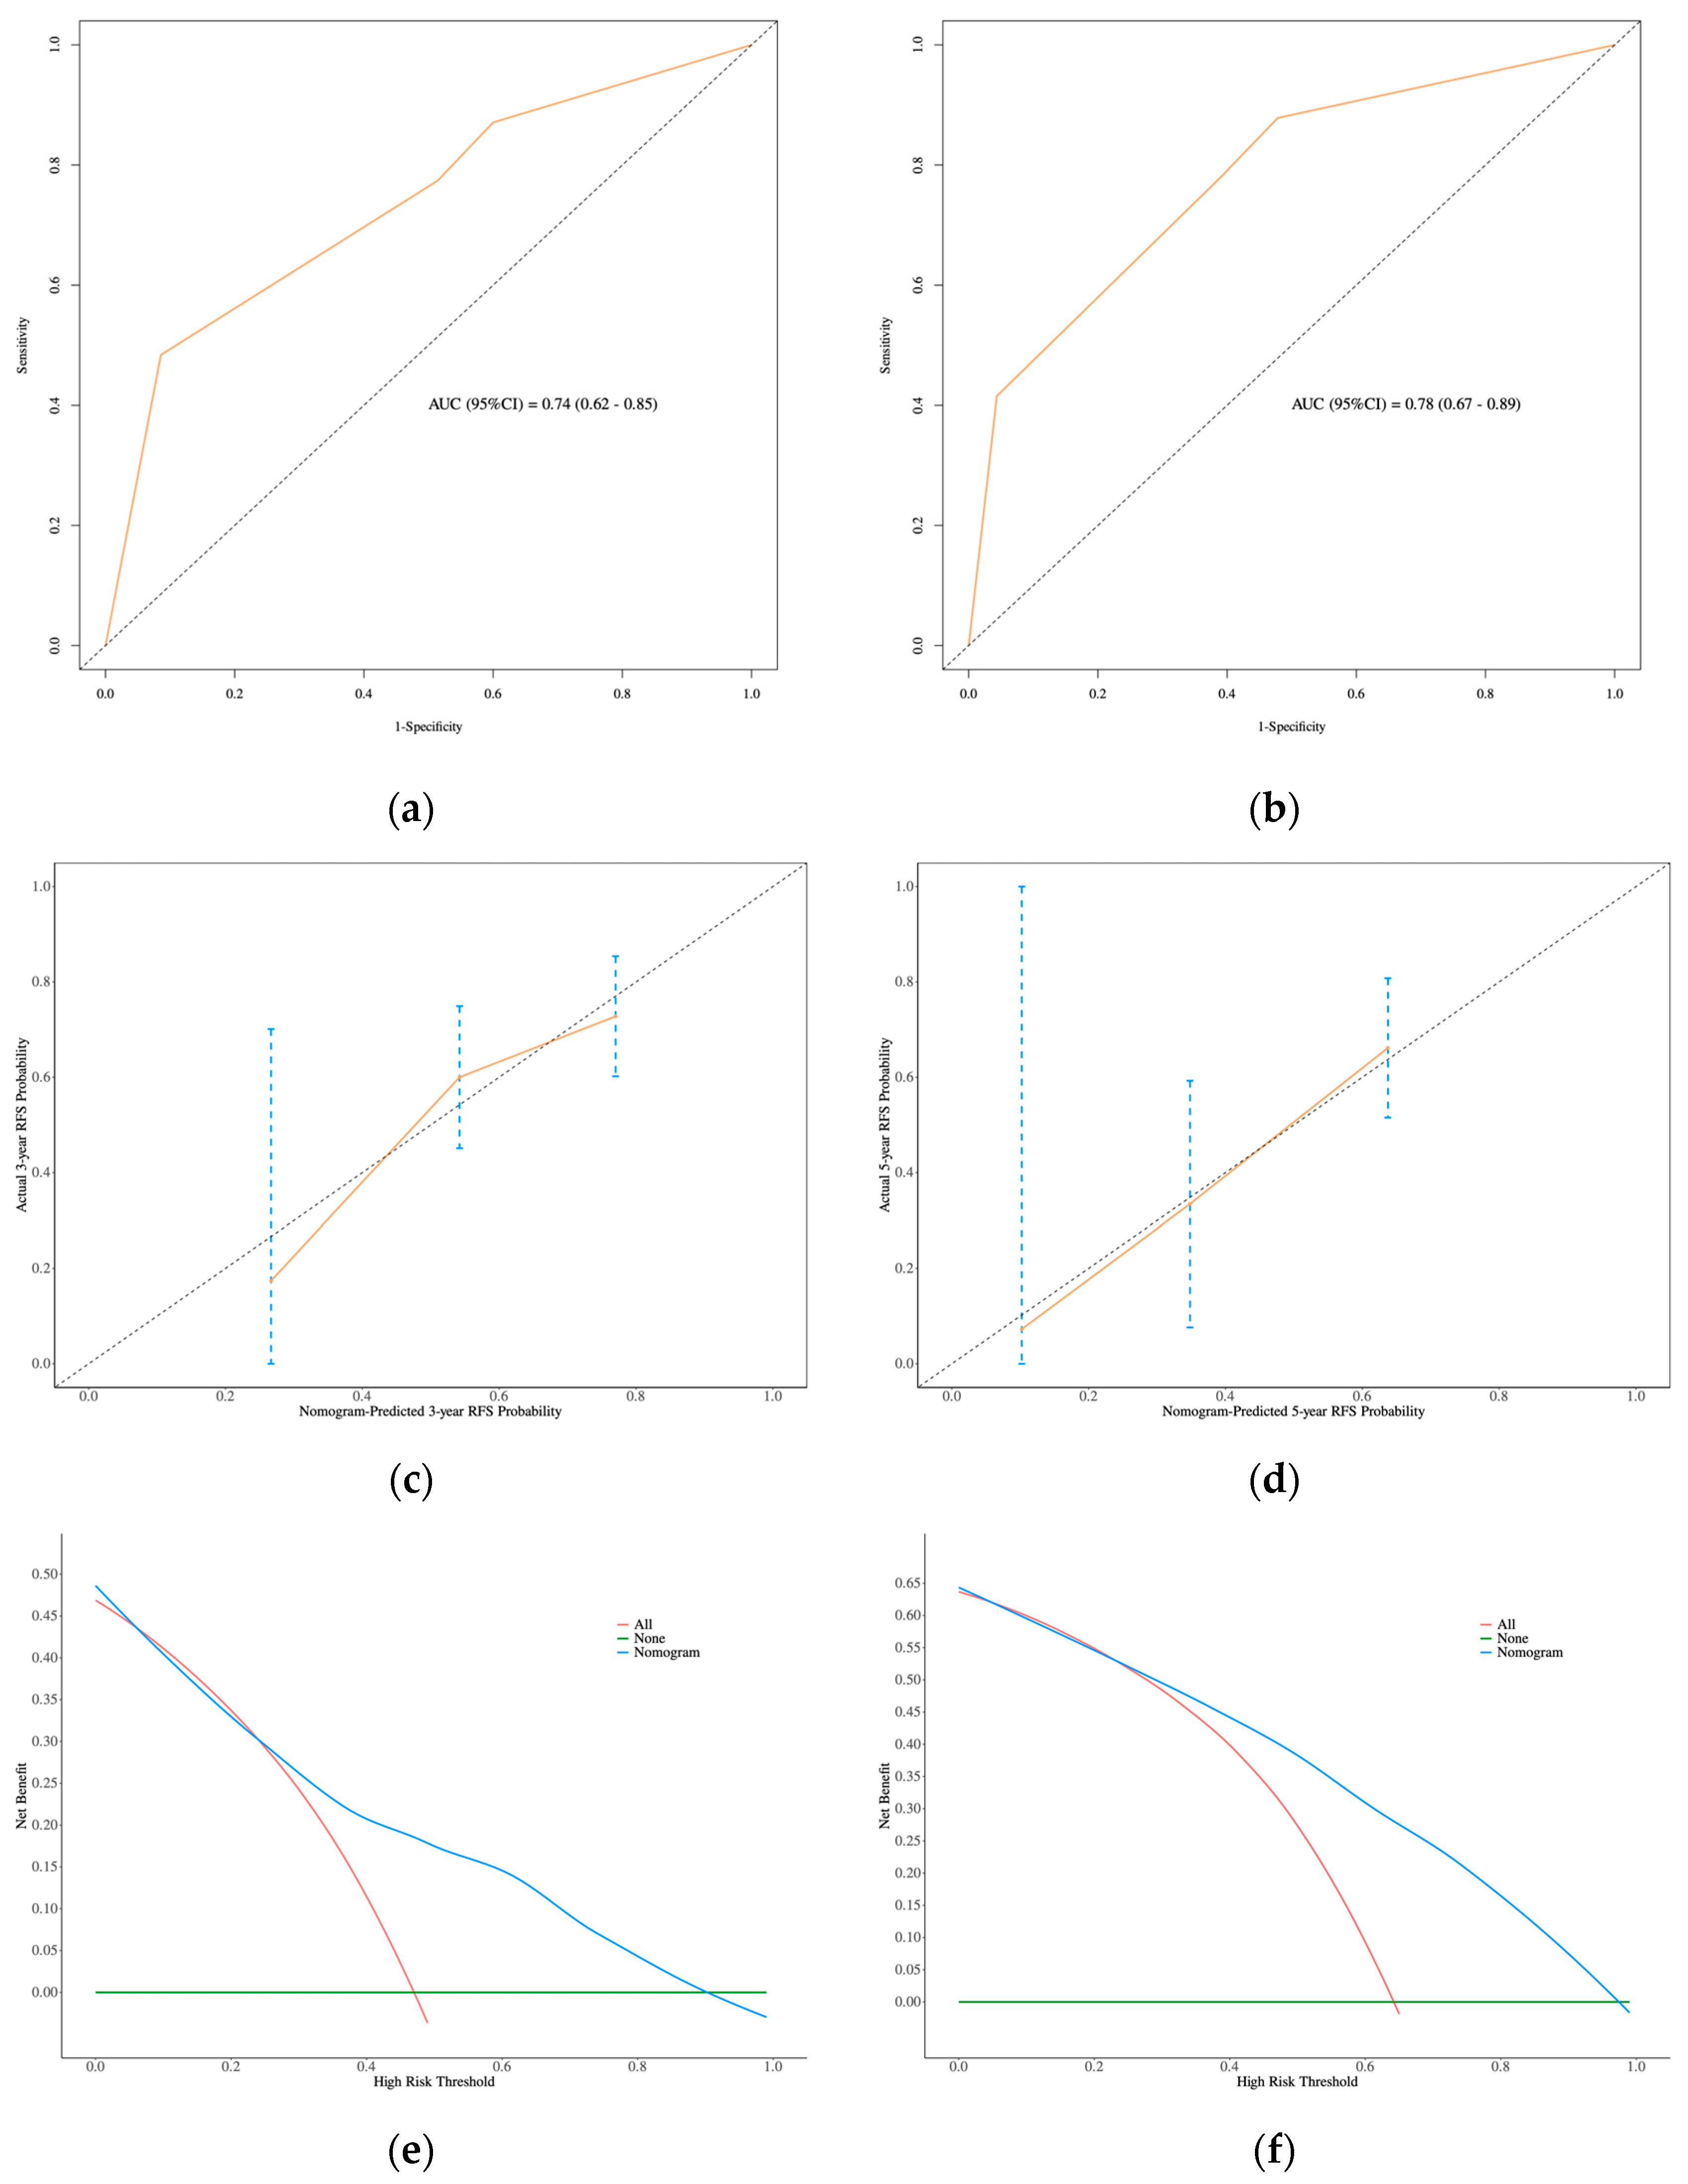
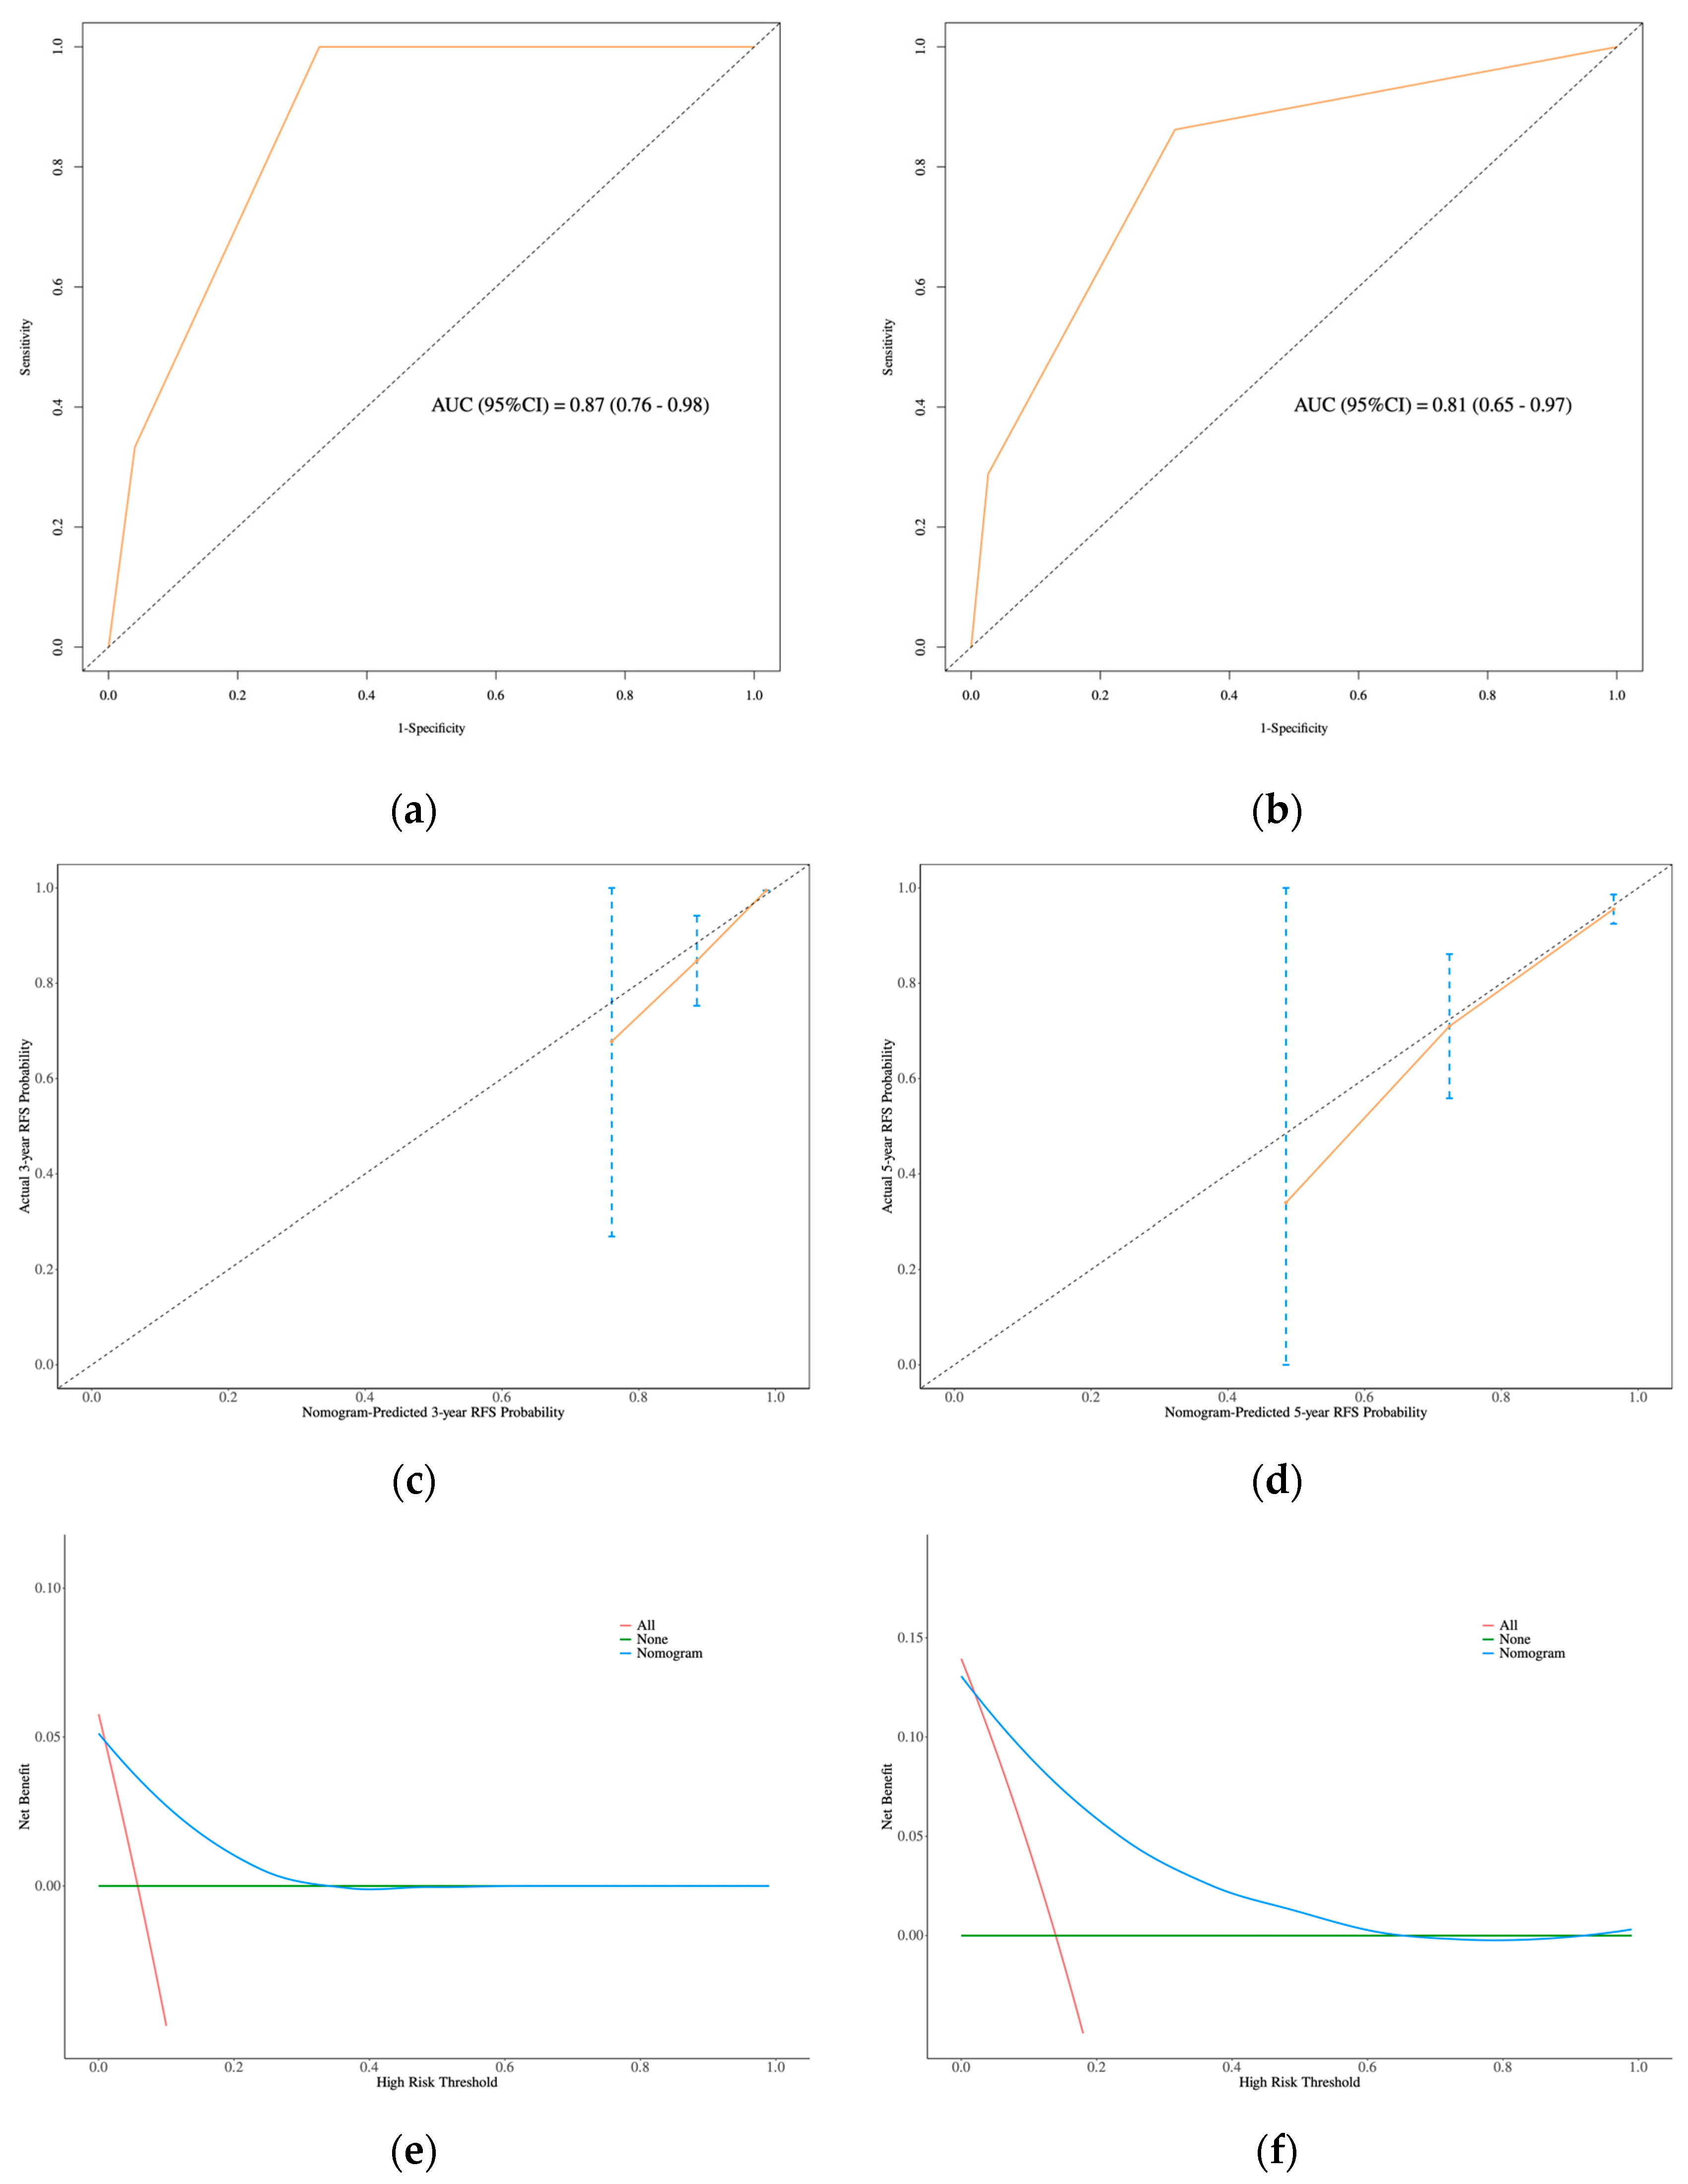
3.3. Development and Validation of the Nomogram
4. Discussion
5. Conclusions
Author Contributions
Funding
Institutional Review Board Statement
Informed Consent Statement
Data Availability Statement
Acknowledgments
Conflicts of Interest
Abbreviations
| SBOT | Serous borderline ovarian tumors |
| LGSOC | Low-grade serous ovarian carcinoma |
| RFS | Recurrence-free survival |
| C-index | Concordance index |
| AUC | Area under the curve |
| ROC | Receiver operating characteristic |
| DCA | Decision curve analysis |
| FSS | Fertility-sparing surgery |
| CI | Confidence interval |
| EOC | Epithelial ovarian cancer |
| WHO | World Health Organization |
| HGSOC | High-grade serous ovarian carcinoma |
| BOT | Borderline ovarian tumors |
| MPSC | Micropapillary serous carcinoma |
| FIGO | International Federation of Gynecology and Obstetrics |
| RD | Gross residual disease |
| NCCN | National Comprehensive Cancer Network |
| WHO | World Health Organization |
| UC | Unilateral ovarian cystectomy |
| BC | Bilateral ovarian cystectomy |
| USO | Unilateral salpingo-oophorectomy |
| USO + CC | Unilateral salpingo-oophorectomy and contralateral ovarian cystectomy |
| TH + BSO | Total hysterectomy and bilateral salpingo-oophorectomy |
| CA125 | Carbohydrate antigen 125 |
| SD | Standard deviation |
References
- Kurman, R.J.; Shih, I.-M. The Origin and Pathogenesis of Epithelial Ovarian Cancer: A Proposed Unifying Theory. Am. J. Surg. Pathol. 2010, 34, 433–443. [Google Scholar] [CrossRef]
- Shih, I.-M.; Kurman, R.J. Ovarian Tumorigenesis. Am. J. Pathol. 2004, 164, 1511–1518. [Google Scholar] [CrossRef]
- Smith Sehdev, A.E.; Sehdev, P.S.; Kurman, R.J. Noninvasive and Invasive Micropapillary (Low-Grade) Serous Carcinoma of the Ovary. Am. J. Surg. Pathol. 2003, 27, 725–736. [Google Scholar] [CrossRef]
- Malpica, A.; Wong, K.-K. The molecular pathology of ovarian serous borderline tumors. Ann. Oncol. 2016, 27, i16–i19. [Google Scholar] [CrossRef]
- Chui, M.H.; Xing, D.; Zeppernick, F.; Wang, Z.Q.; Hannibal, C.G.; Frederiksen, K.; Kjaer, S.K.; Cope, L.; Kurman, R.J.; Shih, I.-M.; et al. Clinicopathologic and Molecular Features of Paired Cases of Metachronous Ovarian Serous Borderline Tumor and Subsequent Serous Carcinoma. Am. J. Surg. Pathol. 2019, 43, 1462–1472. [Google Scholar] [CrossRef]
- Turashvili, G.; Grisham, R.N.; Chiang, S.; DeLair, D.F.; Park, K.J.; Soslow, R.A.; Murali, R. BRAF V 600E mutations and immunohistochemical expression of VE1 protein in low-grade serous neoplasms of the ovary. Histopathology 2018, 73, 438–443. [Google Scholar] [CrossRef]
- Scott, S.A.; Llaurado Fernandez, M.; Kim, H.; Elit, L.; Nourmoussavi, M.; Glaze, S.; Roberts, L.; Offman, S.L.; Rahimi, K.; Lytwyn, A.; et al. Low-grade serous carcinoma (LGSC): A Canadian multicenter review of practice patterns and patient outcomes. Gynecol. Oncol. 2020, 157, 36–45. [Google Scholar] [CrossRef]
- Trimble, C.L.; Kosary, C.; Trimble, E.L. Long-Term Survival and Patterns of Care in Women with Ovarian Tumors of Low Malignant Potential. Gynecol. Oncol. 2002, 86, 34–37. [Google Scholar] [CrossRef]
- Gershenson, D.M.; Cobb, L.P.; Westin, S.N.; Zhang, Y.; Jazaeri, A.; Malpica, A.; Sun, C.C. Contemporary primary treatment of women with stage II–IV low-grade serous ovarian/peritoneal cancer (LGSOC): Determinants of relapse and disease-free survival. Gynecol. Oncol. 2022, 167, 139–145. [Google Scholar] [CrossRef] [PubMed]
- Uzan, C.; Kane, A.; Rey, A.; Gouy, S.; Duvillard, P.; Morice, P. Outcomes after conservative treatment of advanced-stage serous borderline tumors of the ovary. Ann. Oncol. 2010, 21, 55–60. [Google Scholar] [CrossRef] [PubMed]
- Lu, Z.; Lin, F.; Li, T.; Wang, J.; Liu, C.; Lu, G.; Li, B.; Pan, M.; Fan, S.; Yue, J.; et al. Identification of clinical and molecular features of recurrent serous borderline ovarian tumour. eClinicalMedicine 2022, 46, 101377. [Google Scholar] [CrossRef] [PubMed]
- Bendifallah, S.; Ballester, M.; Uzan, C.; Fauvet, R.; Morice, P.; Darai, E. Nomogram to predict recurrence in patients with early- and advanced-stage mucinous and serous borderline ovarian tumors. Am. J. Obstet. Gynecol. 2014, 211, 637.e1–637.e6. [Google Scholar] [CrossRef] [PubMed]
- Morice, P.; Scambia, G.; Abu-Rustum, N.R.; Acien, M.; Arena, A.; Brucker, S.; Cheong, Y.; Collinet, P.; Fanfani, F.; Filippi, F.; et al. Fertility-sparing treatment and follow-up in patients with cervical cancer, ovarian cancer, and borderline ovarian tumours: Guidelines from ESGO, ESHRE, and ESGE. Lancet Oncol. 2024, 25, e602–e610. [Google Scholar] [CrossRef]
- Ouldamer, L.; Body, G.; Daraï, E.; Bendifallah, S. Borderline Ovarian Tumours: CNGOF Guidelines for Clinical Practice–Epidemiological Aspects and Risk Factors. Gynecol. Obstet. Fertil. Senol. 2020, 48, 239–247. [Google Scholar] [PubMed]
- Grisham, R.N.; Slomovitz, B.M.; Andrews, N.; Banerjee, S.; Brown, J.; Carey, M.S.; Chui, H.; Coleman, R.L.; Fader, A.N.; Gaillard, S.; et al. Low-grade serous ovarian cancer: Expert consensus report on the state of the science. Int. J. Gynecol. Cancer. 2023, 33, 1331–1344. [Google Scholar] [CrossRef]
- Ureyen, I.; Karalok, A.; Tasci, T.; Turkmen, O.; Boran, N.; Tulunay, G.; Turan, T. The Factors Predicting Recurrence in Patients With Serous Borderline Ovarian Tumor. Int. J. Gynecol. Cancer 2015, 26, 66–72. [Google Scholar] [CrossRef]
- Matsuo, K.; Machida, H.; Grubbs, B.H.; Sood, A.K.; Gershenson, D.M. Trends of low-grade serous ovarian carcinoma in the United States. J. Gynecol. Oncol. 2018, 29, e15. [Google Scholar] [CrossRef]
- Huchon, C.; Bourdel, N.; Abdel Wahab, C.; Azaïs, H.; Bendifallah, S.; Bolze, P.-A.; Brun, J.-L.; Canlorbe, G.; Chauvet, P.; Chereau, E.; et al. Borderline ovarian tumors: French guidelines from the CNGOF. Part 1. Epidemiology, biopathology, imaging and biomarkers. J. Gynecol. Obstet. Hum. Reprod. 2020, 50, 101965. [Google Scholar] [CrossRef]
- Romagnolo, C.; Gadducci, A.; Sartori, E.; Zola, P.; Maggino, T. Management of borderline ovarian tumors: Results of an Italian multicenter study. Gynecol. Oncol. 2005, 101, 255–260. [Google Scholar] [CrossRef]
- Kasaven, L.S.; Chawla, M.; Jones, B.P.; Al-Memar, M.; Galazis, N.; Ahmed-Salim, Y.; El-Bahrawy, M.; Lavery, S.; Saso, S.; Yazbek, J. Fertility Sparing Surgery and Borderline Ovarian Tumours. Cancers 2022, 14, 1485. [Google Scholar] [CrossRef]
- Uzan, C.; Muller, E.; Kane, A.; Rey, A.; Gouy, S.; Bendiffallah, S.; Duvillard, P.; Fauvet, R.; Darai, E.; Morice, P. Prognostic factors for recurrence after conservative treatment in a series of 119 patients with stage I serous borderline tumors of the ovary. Ann. Oncol. 2014, 25, 166–171. [Google Scholar] [CrossRef] [PubMed]
- Delle Marchette, M.; Ceppi, L.; Andreano, A.; Bonazzi, C.M.; Buda, A.; Grassi, T.; Giuliani, D.; Sina, F.; Lamanna, M.; Bianchi, T.; et al. Oncologic and fertility impact of surgical approach for borderline ovarian tumours treated with fertility sparing surgery. Eur. J. Cancer 2019, 111, 61–68. [Google Scholar] [CrossRef]
- Falcone, F.; Malzoni, M.; Carnelli, M.; Cormio, G.; De Iaco, P.; Di Donato, V.; Ferrandina, G.; Raspagliesi, F.; Sorio, R.; Losito, N.S.; et al. Fertility-sparing treatment for serous borderline ovarian tumors with extra-ovarian invasive implants: Analysis from the MITO14 study database. Gynecol. Oncol. 2022, 165, 302–308. [Google Scholar] [CrossRef]
- Hannibal, C.G.; Vang, R.; Junge, J.; Frederiksen, K.; Kurman, R.J.; Kjaer, S.K. A nationwide study of ovarian serous borderline tumors in Denmark 1978–2002. Risk of recurrence, and development of ovarian serous carcinoma. Gynecol. Oncol. 2016, 144, 174–180. [Google Scholar] [CrossRef] [PubMed]
- Colombo, N.; Sessa, C.; du Bois, A.; Ledermann, J.; McCluggage, W.; McNeish, I.; Morice, P.; Pignata, S.; Ray-Coquard, I.; Vergote, I.; et al. ESMO–ESGO consensus conference recommendations on ovarian cancer: Pathology and molecular biology, early and advanced stages, borderline tumours and recurrent disease. Int. J. Gynecol. Cancer 2019, 29, 728–760. [Google Scholar] [CrossRef] [PubMed]
- Morice, P.; Uzan, C.; Fauvet, R.; Gouy, S.; Duvillard, P.; Darai, E. Borderline ovarian tumour: Pathological diagnostic dilemma and risk factors for invasive or lethal recurrence. Lancet Oncol. 2012, 13, e103–e115. [Google Scholar] [CrossRef]
- Seidman, J.D.; Kurman, R.J. Ovarian serous borderline tumors: A critical review of the literature with emphasis on prognostic indicators. Hum. Pathol. 2000, 31, 539–557. [Google Scholar] [CrossRef]
- Qi, Y.; Wang, M.; Yang, Y.; Zeng, Z.; Zhou, Y. Analysis of Factors Influencing Relapse and Pregnancy in Patients with Borderline Ovarian Tumors. J. Cancer 2021, 12, 5275–5285. [Google Scholar] [CrossRef]
- Sozen, H.; Vatansever, D.; Topuz, S.; Iyibozkurt, C.; Kandemir, H.; Yalçin, I.; Onder, S.; Yavuz, E.; Salihoglu, Y. Clinicopathological analysis of borderline ovarian tumours and risk factors related to recurrence: Experience of single institution. J. Obstet. Gynaecol. 2018, 39, 253–258. [Google Scholar] [CrossRef]
- Uzan, C.; Nikpayam, M.; Ribassin-Majed, L.; Gouy, S.; Bendifallah, S.; Cortez, A.; Rey, A.; Duvillard, P.; Darai, E.; Morice, P. Influence of histological subtypes on the risk of an invasive recurrence in a large series of stage I borderline ovarian tumor including 191 conservative treatments. Ann. Oncol. 2014, 25, 1312–1319. [Google Scholar] [CrossRef]
- Zhou, F.; Zhan, X.; Hu, D.; Wu, N.; Hong, J.; Li, G.; Chen, Y.; Zhou, X. Evaluation of ERCP-related perforation: A single-center retrospective study. Gastroenterol. Rep. 2023, 12, goae044. [Google Scholar] [CrossRef] [PubMed]


| Forms | FSS Group (54) | RS Group (14) | ||
|---|---|---|---|---|
| n | % | n | % | |
| Imaging recurrence | 52 | 96.3 | 14 | 100 |
| Biochemical recurrence | 29 | 53.7 | 13 | 92.9 |
| Clinical recurrence | 8 | 14.8 | 2 | 14.3 |
| Locations | FSS Group (54) | Locations | RS Group (14) | ||
|---|---|---|---|---|---|
| n | % | n | % | ||
| Ovary | 47 | 87.0 | Pelvic cavity | 10 | 71.4 |
| Ovary + pelvic cavity | 2 | 3.7 | Abdominal cavity | 3 | 21.4 |
| Ovary + abdominal cavity | 1 | 1.9 | Pelvic + abdominal cavity | 1 | 7.1 |
| Ovary + pelvic + abdominal cavity | 2 | 3.7 | |||
| Pelvic cavity | 2 | 3.7 | |||
| Consistency | Before Recurrence | After Recurrence | n/% |
|---|---|---|---|
| Consistent | 22/55.0 | ||
| classical SBOT | 18/45.0 | ||
| MPSC | 2/5.0 | ||
| SBOT with microinvasion | 1/2.5 | ||
| microinvasive LGSOC | 1/2.5 | ||
| Inconsistent | 18/45.0 | ||
| Downgrade | 9/22.5 | ||
| MPSC | classical SBOT | 1/2.5 | |
| SBOT with microinvasion | classical SBOT | 6/15.0 | |
| LGSOC | classical SBOT | 1/2.5 | |
| LGSOC | MPSC | 1/2.5 | |
| Upgrade | 9/22.5 | ||
| classical SBOT | MPSC | 4/10.0 | |
| classical SBOT | LGSOC | 1/2.5 | |
| SBOT with microinvasion | MPSC | 2/5.0 | |
| SBOT with microinvasion | LGSOC | 1/2.5 | |
| MPSC | LGSOC | 1/2.5 | |
| Consistency | Before Recurrence | After Recurrence | n/% |
|---|---|---|---|
| Consistent | 4/50.0 | ||
| classical SBOT | 4/50.0 | ||
| Inconsistent | 4/50.0 | ||
| Downgrade | 1/12.5 | ||
| SBOT with microinvasion | classical SBOT | 1/12.5 | |
| Upgrade | 3/37.5 | ||
| classical SBOT | microinvasive LGSOC | 1/12.5 | |
| classical SBOT | LGSOC | 1/12.5 | |
| MPSC | LGSOC | 1/12.5 | |
| Factors | Recurrence Group n (%) or Median (Range) | Non-Recurrence Group n (%) or Median (Range) | p |
|---|---|---|---|
| Cases | 54 | 12 | |
| Age at diagnosis (y) | |||
| ≥40 | 5 (9.3) | 3 (25.0) | 0.152 |
| <40 | 49 (90.7) | 9 (75.0) | |
| CA125 (U/mL) | 40.6 (9.3–1720.5) | 37.4 (8.7–455.8) | 0.470 |
| Tumor size (cm) | 7.6 (3.0–20.0) | 6.8 (3.8–25.0) | 0.790 |
| Laterality | |||
| Unilateral | 32(59.3) | 10 (83.3) | 0.186 |
| Bilateral | 22(40.7) | 2 (16.7) | |
| Tumor capsule disruption | |||
| No | 15 (27.8) | 9 (75.0) | 0.006 * |
| Yes | 39 (72.2) | 3 (25.0) | |
| RD | |||
| No | 49 (90.7) | 12 (100.0) | 0.575 |
| Yes | 5 (9.3) | 0 (0) | |
| FIGO stage | |||
| I | 46 (85.2) | 12 (100.0) | 0.333 |
| II–III | 8 (14.8) | 0 (0) | |
| Histology type | |||
| Classical SBOT | 33 (61.1) | 11 (91.7) | 0.462 |
| MPSC | 6 (11.1) | 0 (0) | |
| SBOT with microinvasion | 12(22.2) | 1 (8.3) | |
| Microinvasive LGSOC | 1 (1.9) | 0 (0) | |
| LGSOC | 2 (3.7) | 0 (0) | |
| Micropapillary | |||
| No | 16 (29.6) | 10 (83.3) | 0.001 * |
| Yes | 38 (70.4) | 2 (16.7) | |
| Non-invasive implants | |||
| No | 46 (85.2) | 12 (100.0) | 0.333 |
| Yes | 8 (14.8) | 0 (0) | |
| Invasive implants | |||
| No | 53 (98.1) | 12 (100.0) | 1 |
| Yes | 1 (1.9) | 0 (0) | |
| Surgical approach | |||
| Laparotomy | 20 (37.0) | 8 (66.7) | 0.060 |
| Laparoscopy | 34 (63.0) | 4 (33.3) | |
| FSS extent | |||
| USO + CC | 16 (29.6) | 2 (16.7) | 0.299 |
| USO | 15 (27.8) | 6 (50.0) | |
| BC | 14 (25.9) | 1 (8.3) | |
| UC | 9 (16.7) | 3 (25.0) | |
| Complete staging | |||
| Yes | 9 (16.7) | 3 (25.0) | 0.679 |
| No | 45 (83.3) | 9 (75.0) | |
| Adjuvant chemotherapy | |||
| Yes | 4 (7.4) | 0 (0) | 1 |
| No | 50 (92.6) | 12 (100.0) |
| Factors | Recurrence Group n (%) or Median (range) | Non-Recurrence Group n (%) or Median (Range) | p |
|---|---|---|---|
| Cases | 14 | 38 | |
| Age at diagnosis (y) | |||
| ≥40 | 11 (78.6) | 35 (92.1) | 0.325 |
| <40 | 3 (21.4) | 3 (7.9) | |
| CA125 (U/mL) | 57.1 (12.4–579.2) | 55.4 (4.5–1096.03) | 0.798 |
| Tumor size (cm) | 8.3 (4.0–15.0) | 8.1 (3.2–19.1) | 0.963 |
| Laterality | |||
| Unilateral | 5 (35.7) | 21 (55.3) | 0.211 |
| Bilateral | 9(64.3) | 17 (44.7) | |
| Tumor capsule disruption | |||
| No | 1 (7.1) | 15 (39.5) | 0.040 * |
| Yes | 13 (92.9) | 23 (60.5) | |
| RD | |||
| No | 14 (100) | 36 (94.7) | 0.545 |
| Yes | 0 (0) | 2 (5.3) | |
| FIGO stage | |||
| I | 5 (35.7) | 30 (78.9) | 0.006 * |
| II–III | 9(64.3) | 8 (21.1) | |
| Histology type | |||
| Classical SBOT | 7 (50.0) | 22 (57.9) | 0.027 * |
| MPSC | 2 (14.3) | 7 (18.4) | |
| SBOT with microinvasion | 3 (21.4) | 5 (13.2) | |
| Microinvasive LGSOC | 0 (0) | 3 (7.9) | |
| LGSOC | 2 (14.3) | 1 (2.6) | |
| Micropapillary | |||
| No | 1 (7.1) | 17 (44.7) | 0.019 * |
| Yes | 13 (92.9) | 21 (55.3) | |
| Non-invasive implants | |||
| No | 5 (35.7) | 31 (71.6) | 0.005 * |
| Yes | 9(64.3) | 7 (18.4) | |
| Invasive implants | |||
| No | 14 (100) | 36 (94.7) | 1 |
| Yes | 0 (0) | 2 (5.3) | |
| Surgical approach | |||
| Laparotomy | 8 (57.1) | 25 (65.8) | 0.566 |
| Laparoscopy | 6 (42.9) | 13 (34.2) | |
| Complete staging | |||
| Yes | 12 (85.7) | 30 (78.9) | 0.710 |
| No | 2 (14.3) | 8 (21.1) | |
| Adjuvant chemotherapy | |||
| Yes | 6 (42.9) | 8 (21.1) | 0.161 |
| No | 8 (57.1) | 30 (78.9) |
| Variables | Univariate | Multivariate | ||||
|---|---|---|---|---|---|---|
| Z | p | OR (95%CI) | Z | p | OR (95%CI) | |
| Age at diagnosis (y) | ||||||
| ≥40 | ||||||
| <40 | 1.452 | 0.147 | 3.267 (0.661–16.150) | |||
| Laterality | ||||||
| Unilateral | ||||||
| Bilateral | 1.501 | 0.133 | 3.437 (0.686–17.237) | |||
| Tumor capsule disruption | ||||||
| No | ||||||
| Yes | 2.804 | 0.005 * | 7.800 (1.856–32.788) | 3.056 | 0.002 * | 39.857 (3.751–423.493) |
| RD | ||||||
| No | ||||||
| Yes | 0.009 | 0.993 | 10,419,137.716 (0.000–Inf) | |||
| FIGO stage | ||||||
| I | ||||||
| II–III | 0.007 | 0.994 | 30,169,250.418 (0.000–Inf) | |||
| Histology type | ||||||
| SBOT | ||||||
| LGSOC | 0.009 | 0.993 | 3,611,852.489 (0.000–Inf) | |||
| Micropapillary | ||||||
| No | ||||||
| Yes | 2.982 | 0.003 * | 11.875 (2.335–60.403) | 3.198 | 0.001 * | 56.615 (4.769–672.061) |
| Non-invasive implants | ||||||
| No | ||||||
| Yes | 0.007 | 0.994 | 30,169,250.418 (0.000–Inf) | |||
| Invasive implants | ||||||
| No | ||||||
| Yes | 0.010 | 0.992 | 1,303,655.742 (0.000–Inf) | |||
| Surgical approach | ||||||
| Laparotomy | ||||||
| Laparoscopy | 1.815 | 0.069 | 3.400 (0.907–12.743) | |||
| Complete staging | ||||||
| Yes | ||||||
| No | 0.672 | 0.502 | 1.667 (0.376–7.394) | |||
| Adjuvant chemotherapy | ||||||
| Yes | ||||||
| No | −0.008 | 0.993 | 0.000 (0.000–Inf) | |||
| CA125 (U/mL) | 0.798 | 0.425 | 1.002 (0.997–1.006) | |||
| Tumor size (cm) | −0.508 | 0.611 | 0.965 (0.841–1.108) | |||
| Variables | Univariate | Multivariate | ||||
|---|---|---|---|---|---|---|
| Z | p | OR (95%CI) | Z | p | OR (95%CI) | |
| Age at diagnosis (y) | ||||||
| ≥40 | ||||||
| <40 | 1.305 | 0.192 | 3.182 (0.560–18.088) | |||
| Laterality | ||||||
| Unilateral | ||||||
| Bilateral | 1.237 | 0.216 | 2.224 (0.627–7.890) | |||
| Tumor capsule disruption | ||||||
| No | ||||||
| Yes | 1.962 | 0.050 | 8.478 (1.002–71.731) | |||
| RD | ||||||
| No | ||||||
| Yes | −0.009 | 0.993 | 0.000 (0.000–Inf) | |||
| FIGO stage | ||||||
| I | ||||||
| II–III | 0.257 | 0.797 | 1.385 (0.116–16.581) | |||
| Histology type | ||||||
| SBOT | ||||||
| LGSOC | 1.434 | 0.152 | 6.167 (0.513–74.169) | |||
| Micropapillary | ||||||
| No | ||||||
| Yes | 2.164 | 0.030 * | 10.524 (1.248–88.739) | |||
| Non-invasive implants | ||||||
| No | ||||||
| Yes | 2.977 | 0.003 * | 7.971 (2.032–31.266) | 2.977 | 0.003 * | 7.971 (2.032–31.266) |
| Invasive implants | ||||||
| No | ||||||
| Yes | −0.009 | 0.993 | 0.000 (0.000–Inf) | |||
| Surgical approach | ||||||
| Laparotomy | ||||||
| Laparoscopy | 0.573 | 0.567 | 1.442 (0.412–5.048) | |||
| Complete staging | ||||||
| Yes | ||||||
| No | −0.546 | 0.585 | 0.625 (0.116–3.380) | |||
| Adjuvant chemotherapy | ||||||
| Yes | ||||||
| No | −1.542 | 0.123 | 0.356 (0.095–1.324) | |||
| CA125 (U/mL) | −0.190 | 0.849 | 1.000 (0.997–1.002) | |||
| Tumor size (cm) | −0.331 | 0.740 | 0.976 (0.844–1.128) | |||
| Variables | Univariate | Multivariate | ||||
|---|---|---|---|---|---|---|
| Z | p | HR (95%CI) | Z | p | HR (95%CI) | |
| Age at diagnosis (y) | ||||||
| ≥40 | ||||||
| <40 | 2.047 | 0.041 * | 2.929 (1.047–8.194) | |||
| Laterality | ||||||
| Unilateral | ||||||
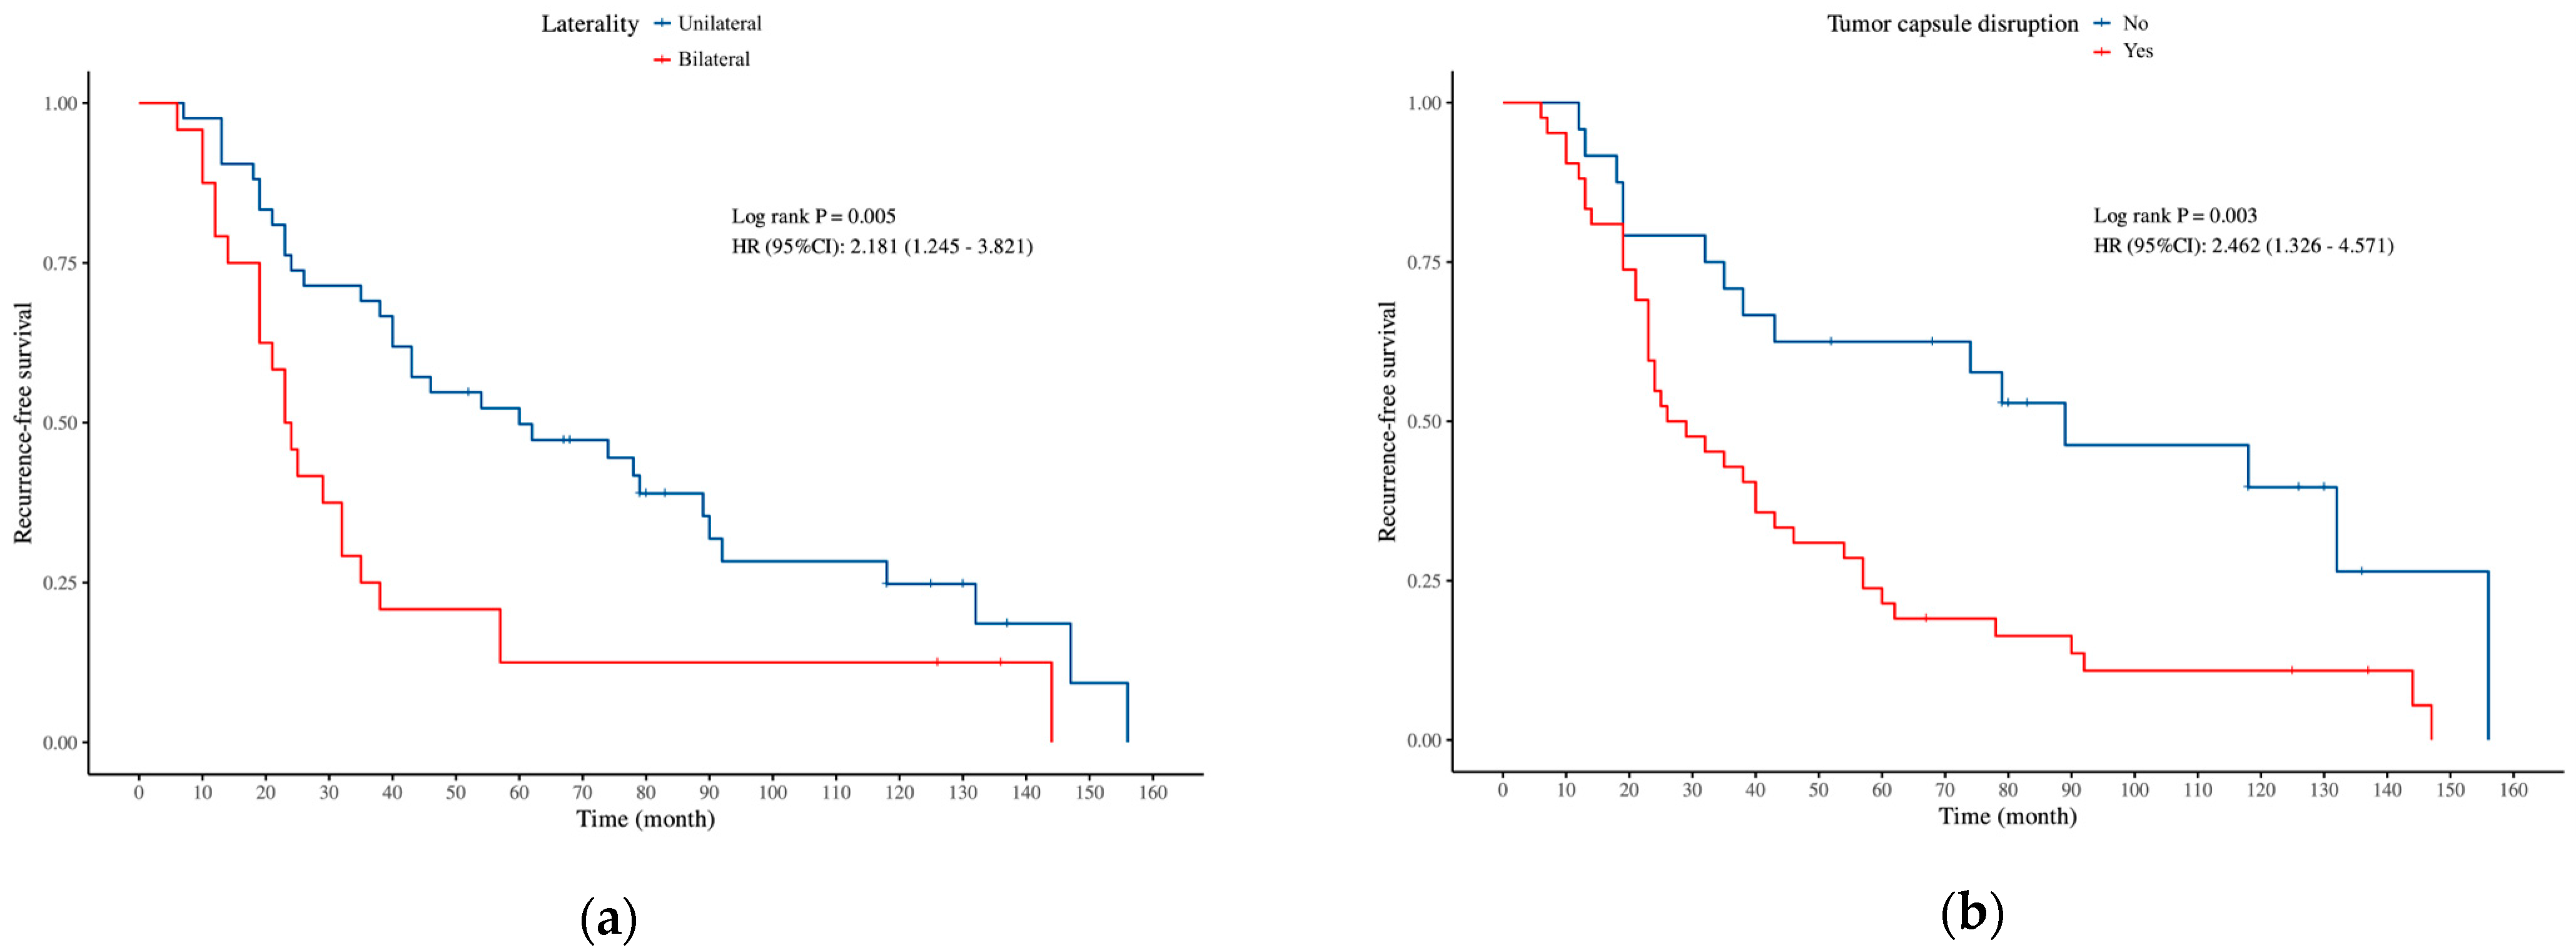
| Bilateral | 2.726 | 0.006 * | 2.181 (1.245–3.821) | 2.536 | 0.011 * | 2.075 (1.180–3.648) |
| Tumor capsule disruption | ||||||
| No | ||||||
| Yes | 2.855 | 0.004 * | 2.462 (1.326–4.571) | 2.718 | 0.007 * | 2.369 (1.272–4.413) |
| RD | ||||||
| No | ||||||
| Yes | 2.295 | 0.022 * | 3.107 (1.180–8.180) | |||
| FIGO stage | ||||||
| I | ||||||
| II–III | 3.176 | 0.001 * | 3.613 (1.635–7.983) | |||
| Histology type | ||||||
| SBOT | ||||||
| LGSOC | 0.979 | 0.328 | 2.047 (0.488–8.593) | |||
| Micropapillary | ||||||
| No | ||||||
| Yes | 1.289 | 0.197 | 1.478 (0.816–2.678) | |||
| Non-invasive implants | ||||||
| No | ||||||
| Yes | 2.874 | 0.004 * | 3.174 (1.444–6.979) | |||
| Invasive implants | ||||||
| No | ||||||
| Yes | 1.176 | 0.240 | 3.354 (0.446–25.210) | |||
| Surgical approach | ||||||
| Laparotomy | ||||||
| Laparoscopy | 1.169 | 0.243 | 1.394 (0.799–2.433) | |||
| Complete staging | ||||||
| Yes | ||||||
| No | −0.365 | 0.715 | 0.874 (0.423–1.805) | |||
| Adjuvant chemotherapy | ||||||
| Yes | ||||||
| No | −2.327 | 0.020 * | 0.281 (0.097–0.819) | |||
| CA125 (U/mL) | 1.741 | 0.082 | 1.001 (1.000–1.002) | |||
| Tumor size (cm) | 0.781 | 0.435 | 1.024 (0.965–1.086) | |||
| Variables | Univariate | Multivariate | ||||
|---|---|---|---|---|---|---|
| Z | p | HR (95%CI) | Z | p | HR (95%CI) | |
| Age at diagnosis (y) | ||||||
| ≥40 | ||||||
| <40 | 1.303 | 0.192 | 2.364 (0.648–8.616) | |||
| Laterality | ||||||
| Unilateral | ||||||
| Bilateral | 1.253 | 0.210 | 2.021 (0.673–6.074) | |||
| Tumor capsule disruption | ||||||
| No | ||||||
| Yes | 1.719 | 0.086 | 5.973 (0.778–45.838) | |||
| RD | ||||||
| No | ||||||
| Yes | −0.002 | 0.998 | 0.000 (0.000–Inf) | |||
| FIGO stage | ||||||
| I | ||||||
| II–III | 2.805 | 0.005 * | 4.870 (1.611–14.721) | |||
| Histology type | ||||||
| SBOT | ||||||
| LGSOC | 2.259 | 0.024 * | 6.022 (1.268–28.606) | 3.128 | 0.002 * | 19.809 (3.050–128.648) |
| Micropapillary | ||||||
| No | ||||||
| Yes | 2.251 | 0.024 * | 10.530 (1.356–81.802) | |||
| Non-invasive implants | ||||||
| No | ||||||
| Yes | 2.971 | 0.003 * | 5.326 (1.767–16.054) | 3.237 | 0.001 * | 8.840 (2.363–33.075) |
| Invasive implants | ||||||
| No | ||||||
| Yes | −0.002 | 0.998 | 0.000 (0.000–Inf) | |||
| Surgical approach | ||||||
| Laparotomy | ||||||
| Laparoscopy | 0.030 | 0.976 | 1.016 (0.349–2.964) | |||
| Complete staging | ||||||
| Yes | ||||||
| No | −1.215 | 0.224 | 0.384 (0.082–1.799) | |||
| Adjuvant chemotherapy | ||||||
| Yes | ||||||
| No | −1.713 | 0.087 | 0.391 (0.134–1.145) | |||
| CA125 (U/mL) | 0.274 | 0.784 | 1.000 (0.998–1.003) | |||
| Tumor size (cm | 0.368 | 0.713 | 1.025 (0.897–1.172) | |||
Disclaimer/Publisher’s Note: The statements, opinions and data contained in all publications are solely those of the individual author(s) and contributor(s) and not of MDPI and/or the editor(s). MDPI and/or the editor(s) disclaim responsibility for any injury to people or property resulting from any ideas, methods, instructions or products referred to in the content. |
© 2025 by the authors. Licensee MDPI, Basel, Switzerland. This article is an open access article distributed under the terms and conditions of the Creative Commons Attribution (CC BY) license (https://creativecommons.org/licenses/by/4.0/).
Share and Cite
Zhang, J.; Wang, M.; Wu, Y. Risk Factors for Recurrence in Serous Borderline Ovarian Tumors and Early-Stage Low-Grade Serous Ovarian Carcinoma. Curr. Oncol. 2025, 32, 263. https://doi.org/10.3390/curroncol32050263
Zhang J, Wang M, Wu Y. Risk Factors for Recurrence in Serous Borderline Ovarian Tumors and Early-Stage Low-Grade Serous Ovarian Carcinoma. Current Oncology. 2025; 32(5):263. https://doi.org/10.3390/curroncol32050263
Chicago/Turabian StyleZhang, Jingjing, Ming Wang, and Yumei Wu. 2025. "Risk Factors for Recurrence in Serous Borderline Ovarian Tumors and Early-Stage Low-Grade Serous Ovarian Carcinoma" Current Oncology 32, no. 5: 263. https://doi.org/10.3390/curroncol32050263
APA StyleZhang, J., Wang, M., & Wu, Y. (2025). Risk Factors for Recurrence in Serous Borderline Ovarian Tumors and Early-Stage Low-Grade Serous Ovarian Carcinoma. Current Oncology, 32(5), 263. https://doi.org/10.3390/curroncol32050263