Predictive Value of GINI and ALBI Grades in Esophageal Cancer Receiving Chemoradiotherapy


Abstract
1. Introduction
2. Materials and Methods
2.1. Patient Selection
2.2. Treatment Details
2.3. Data Collection
2.4. Patient Follow-Up and Response Evaluations
2.5. Statistical Analysis
3. Results
4. Discussion
5. Conclusions
Author Contributions
Funding
Institutional Review Board Statement
Informed Consent Statement
Data Availability Statement
Conflicts of Interest
References
- Sung, H.; Ferlay, J.; Siegel, R.L.; Laversanne, M.; Soerjomataram, I.; Jemal, A.; Bray, F. Global Cancer Statistics 2020: GLOBOCAN Estimates of Incidence and Mortality Worldwide for 36 Cancers in 185 Countries. CA Cancer J. Clin. 2021, 71, 209–249. [Google Scholar] [CrossRef] [PubMed]
- Coleman, H.G.; Xie, S.-H.; Lagergren, J. The Epidemiology of Esophageal Adenocarcinoma. Gastroenterology 2018, 154, 390–405. [Google Scholar] [CrossRef]
- Obermannová, R.; Alsina, M.; Cervantes, A.; Leong, T.; Lordick, F.; Nilsson, M.; van Grieken, N.; Vogel, A.; Smyth, E. Oesophageal cancer: ESMO Clinical Practice Guideline for diagnosis, treatment and follow-up. Ann. Oncol. 2022, 33, 992–1004. [Google Scholar] [CrossRef] [PubMed]
- Kornberg, A.; Witt, U.; Schernhammer, M.; Kornberg, J.; Müller, K.; Friess, H.; Thrum, K. The role of preoperative albumin-bilirubin grade for oncological risk stratification in liver transplant patients with hepatocellular carcinoma. J. Surg. Oncol. 2019, 120, 1126–1136. [Google Scholar] [CrossRef]
- Li, Q.; Chen, C.; Zhang, J.; Wu, H.; Qiu, Y.; Song, T.; Mao, X.; He, Y.; Cheng, Z.; Zhai, W.; et al. Prediction Efficacy of Prognostic Nutritional Index and Albumin–Bilirubin Grade in Patients With Intrahepatic Cholangiocarcinoma After Radical Resection: A Multi-Institutional Analysis of 535 Patients. Front. Oncol. 2021, 11, 769696. [Google Scholar] [CrossRef] [PubMed]
- Fernandez-Placencia, R.; Berrospi-Espinoza, F.; Uribe-Rivera, K.; Medina-Cana, J.; Chavez-Passiuri, I.; Sanchez-Bartra, N.; Paredes-Galvez, K.; Vasquez, C.L.-V.; Celis-Zapata, J.; Ruiz-Figueroa, E. Preoperative Predictors for 90-Day Mortality after Pancreaticoduodenectomy in Patients with Adenocarcinoma of the Ampulla of Vater: A Single-Centre Retrospective Cohort Study. Surg. Res. Pract. 2021, 2021, 6682935. [Google Scholar] [CrossRef]
- Koh, H.-H.; Cho, E.-S.; Lee, J.-H.; Shin, S.-J.; Lee, H.S.; Park, E.J.; Baik, S.H.; Lee, K.Y.; Kang, J. Association of Albumin-Bilirubin Grade and Myosteatosis with its Prognostic Significance for Patients with Colorectal Cancer. Ann. Surg. Oncol. 2022, 29, 3868–3876. [Google Scholar] [CrossRef]
- Zhang, J.; Xu, Q.; Zhang, H.; Zhang, Y.; Yang, Y.; Luo, H.; Lin, X.; He, X.; Mou, Y.; Zhou, Z.; et al. High preoperative albumin-bilirubin score predicts poor survival in patients with newly diagnosed high-grade gliomas. Transl. Oncol. 2021, 14, 101038. [Google Scholar] [CrossRef]
- Zhu, C.; Wang, X.; Chen, S.; Yang, X.; Sun, J.; Pan, B.; Zhang, W.; Chen, X.; Huang, Y. Efficacy of the Preoperative Albumin–Bilirubin Grade for Predicting Survival and Outcomes of Postoperative Chemotherapy for Advanced Gastric Cancer. Cancer Manag. Res. 2020, 12, 11921–11932. [Google Scholar] [CrossRef]
- Zhu, S.; Cheng, Z.; Hu, Y.; Chen, Z.; Zhang, J.; Ke, C.; Yang, Q.; Lin, F.; Chen, Y.; Wang, J. Prognostic Value of the Systemic Immune-Inflammation Index and Prognostic Nutritional Index in Patients With Medulloblastoma Undergoing Surgical Resection. Front. Nutr. 2021, 8, 754958. [Google Scholar] [CrossRef]
- Sethi, G.; Shanmugam, M.K.; Ramachandran, L.; Kumar, A.P.; Tergaonkar, V. Multifaceted link between cancer and inflammation. Biosci. Rep. 2011, 32, 1–15. [Google Scholar] [CrossRef] [PubMed]
- Topkan, E.; Selek, U.; Pehlivan, B.; Kucuk, A.; Ozturk, D.; Ozdemir, B.S.; Besen, A.A.; Mertsoylu, H. The Prognostic Value of the Novel Global Immune-Nutrition-Inflammation Index (GINI) in Stage IIIC Non-Small Cell Lung Cancer Patients Treated with Concurrent Chemoradiotherapy. Cancers 2023, 15, 4512. [Google Scholar] [CrossRef] [PubMed]
- McShane, L.M.; Altman, D.G.; Sauerbrei, W.; Taube, S.E.; Gion, M.; Clark, G.M. REporting recommendations for tumour MARKer prognostic studies (REMARK). Br. J. Cancer 2005, 93, 387–391. [Google Scholar] [CrossRef] [PubMed]
- Rice, T.W.; Patil, D.T.; Blackstone, E.H. 8th edition AJCC/UICC staging of cancers of the esophagus and esophagogastric junction: Application to clinical practice. Ann. Cardiothorac. Surg. 2017, 6, 119–130. [Google Scholar] [CrossRef]
- Johnson, P.J.; Berhane, S.; Kagebayashi, C.; Satomura, S.; Teng, M.; Reeves, H.L.; O’Beirne, J.; Fox, R.; Skowronska, A.; Palmer, D.; et al. Assessment of Liver Function in Patients With Hepatocellular Carcinoma: A New Evidence-Based Approach—The ALBI Grade. J. Clin. Oncol. 2015, 33, 550–558. [Google Scholar] [CrossRef]
- Eisenhauer, E.A.; Therasse, P.; Bogaerts, J.; Schwartz, L.H.; Sargent, D.; Ford, R.; Dancey, J.; Arbuck, S.; Gwyther, S.; Mooney, M.; et al. New response evaluation criteria in solid tumours: Revised RECIST guideline (version 1.1). Eur. J. Cancer 2009, 45, 228–247. [Google Scholar] [CrossRef]
- Wang, Y.-Y.; Zhong, J.-H.; Su, Z.-Y.; Huang, J.-F.; Lu, S.-D.; Xiang, B.-D.; Ma, L.; Qi, L.-N.; Ou, B.-N.; Li, L.-Q. Albumin–bilirubin versus Child–Pugh score as a predictor of outcome after liver resection for hepatocellular carcinoma. Br. J. Surg. 2016, 103, 725–734. [Google Scholar] [CrossRef]
- Ho, S.-Y.; Liu, P.-H.; Hsu, C.-Y.; Hsia, C.-Y.; Lee, Y.-H.; Lee, R.-C.; Huang, Y.-H.; Lee, F.-Y.; Hou, M.-C.; Tsai, Y.-J.; et al. Prognostic role of noninvasive liver reserve markers in patients with hepatocellular carcinoma undergoing transarterial chemoembolization. PLoS ONE 2017, 12, e0180408. [Google Scholar] [CrossRef]
- Mishra, G.; Majeed, A.; Dev, A.; Eslick, G.D.; Pinato, D.J.; Izumoto, H.; Hiraoka, A.; Huo, T.-I.; Liu, P.-H.; Johnson, P.J.; et al. Clinical Utility of Albumin Bilirubin Grade as a Prognostic Marker in Patients with Hepatocellular Carcinoma Undergoing Transarterial Chemoembolization: A Systematic Review and Meta-analysis. J. Gastrointest. Cancer 2022, 54, 420–432. [Google Scholar] [CrossRef]
- Aoyama, T.; Ju, M.; Machida, D.; Komori, K.; Tamagawa, H.; Tamagawa, A.; Maezawa, Y.; Kano, K.; Hara, K.; Segami, K.; et al. Clinical Impact of Preoperative Albumin-Bilirubin Status in Esophageal Cancer Patients Who Receive Curative Treatment. Vivo 2022, 36, 1424–1431. [Google Scholar] [CrossRef]
- Shinozuka, T.; Kanda, M.; Shimizu, D.; Tanaka, C.; Inokawa, Y.; Hattori, N.; Hayashi, M.; Koike, M.; Kodera, Y. Prognostic Value of a Modified Albumin–Bilirubin Score Designed for Patients with Esophageal Squamous Cell Carcinoma After Radical Resection. Ann. Surg. Oncol. 2022, 29, 4889–4896. [Google Scholar] [CrossRef]
- Kitahama, T.; Ishii, K.; Haneda, R.; Inoue, M.; Mayanagi, S.; Tsubosa, Y. Clinical Significance of Albumin–Bilirubin Grade in Thoracic Esophageal Squamous Cell Carcinoma. J. Surg. Res. 2023, 295, 673–682. [Google Scholar] [CrossRef] [PubMed]
- Fucà, G.; Guarini, V.; Antoniotti, C.; Morano, F.; Moretto, R.; Corallo, S.; Marmorino, F.; Lonardi, S.; Rimassa, L.; Sartore-Bianchi, A.; et al. The Pan-Immune-Inflammation Value is a new prognostic biomarker in metastatic colorectal cancer: Results from a pooled-analysis of the Valentino and TRIBE first-line trials. Br. J. Cancer 2020, 123, 403–409. [Google Scholar] [CrossRef] [PubMed]
- Baba, Y.M.; Nakagawa, S.; Toihata, T.; Harada, K.; Iwatsuki, M.M.; Hayashi, H.M.; Miyamoto, Y.M.; Yoshida, N.M.; Baba, H.M. Pan-immune-inflammation Value and Prognosis in Patients With Esophageal Cancer. Ann. Surg. Open 2021, 3, e113. [Google Scholar] [CrossRef] [PubMed]

| Variables | GINI | ALBI | ||||
|---|---|---|---|---|---|---|
| Low (≤814.7) | High (>814.7) | p | Grade 1 | Grade 2 | p | |
| Age | ||||||
| ≤60 years | 6 (42.9%) | 15 (46.9%) | 0.80 | 18 (47.4%) | 3 (37.5%) | 0.61 |
| >60 years | 8 (57.1%) | 17 (53.1%) | 20 (52.6%) | 5 (62.5%) | ||
| Gender | ||||||
| Female | 3 (21.4%) | 17 (53.1%) | 0.04 | 15 (39.5%) | 5 (62.5%) | 0.23 |
| Male | 11 (78.6%) | 15 (46.9%) | 23 (60.5%) | 3 (37.5%) | ||
| ECOG-PS | ||||||
| 0–1 | 11 (78.6%) | 27 (84.4%) | 0.01 | 35 (92.1%) | 3 (37.5%) | <0.001 |
| 2 | 3 (21.4%) | 5 (15.6%) | 3 (7.9%) | 5 (62.5%) | ||
| Histology | ||||||
| SCC | 14 (100%) | 26 (81.3%) | 0.08 | 34 (89.5%) | 6 (75.0%) | 0.26 |
| AC | 0 (0%) | 6 (18.8%) | 4 (10.5%) | 2 (25.0%) | ||
| T Stage | ||||||
| 3 | 7 (50.0%) | 19 (59.4%) | 0.55 | 20 (52.6%) | 6 (75.0%) | 0.24 |
| 4 | 7 (50.0%) | 13 (40.6%) | 18 (47.4%) | 2 (25.0%) | ||
| N Stage | ||||||
| N0 | 3 (21.4%) | 12 (37.5%) | 0.28 | 13 (34.2%) | 2 (25.0%) | 0.61 |
| N+ | 11 (78.6%) | 20 (62.5%) | 25 (65.8%) | 6 (75.0%) | ||
| Radiotherapy | ||||||
| Definitive | 13 (92.9%) | 26 (81.3%) | 0.31 | 33 (86.8%) | 6 (75.0%) | 0.39 |
| Neoadjuvant | 1 (7.1%) | 6 (18.8%) | 5 (13.2%) | 2 (25.0%) | ||
| Variables | Cut-Off | Sensitivity (%) | Specificity (%) | AUC (95% Cl) | p |
|---|---|---|---|---|---|
| Neutrophil count, 103 | 5.60 | 35.7 | 100.0 | 0.64 (0.48–0.80) | 0.100 |
| Platelet count, 103 | 254 | 57.1 | 61.1 | 0.54 (0.37–0.71) | 0.613 |
| Monocyte count, 103 | 0.48 | 57.1 | 55.6 | 0.49 (0.32–0.66) | 0.964 |
| Lymphocyte count, 103 | 1.40 | 39.3 | 94.4 | 0.64 (0.48–0.80) | 0.100 |
| NLR | 2.94 | 60.7 | 88.9 | 0.74 (0.60–0.88) | 0.006 |
| PLR | 162.1 | 53.6 | 94.4 | 0.71 (0.56–0.86) | 0.017 |
| MLR | 0.27 | 71.4 | 61.1 | 0.65 (0.49–0.81) | 0.075 |
| CRP (mg/L) | 16.25 | 60.7 | 61.1 | 0.62 (0.45–0.78) | 0.163 |
| Albumin (g/dL) | 4.34 | 71.4 | 66.7 | 0.71 (0.56–0.86) | 0.014 |
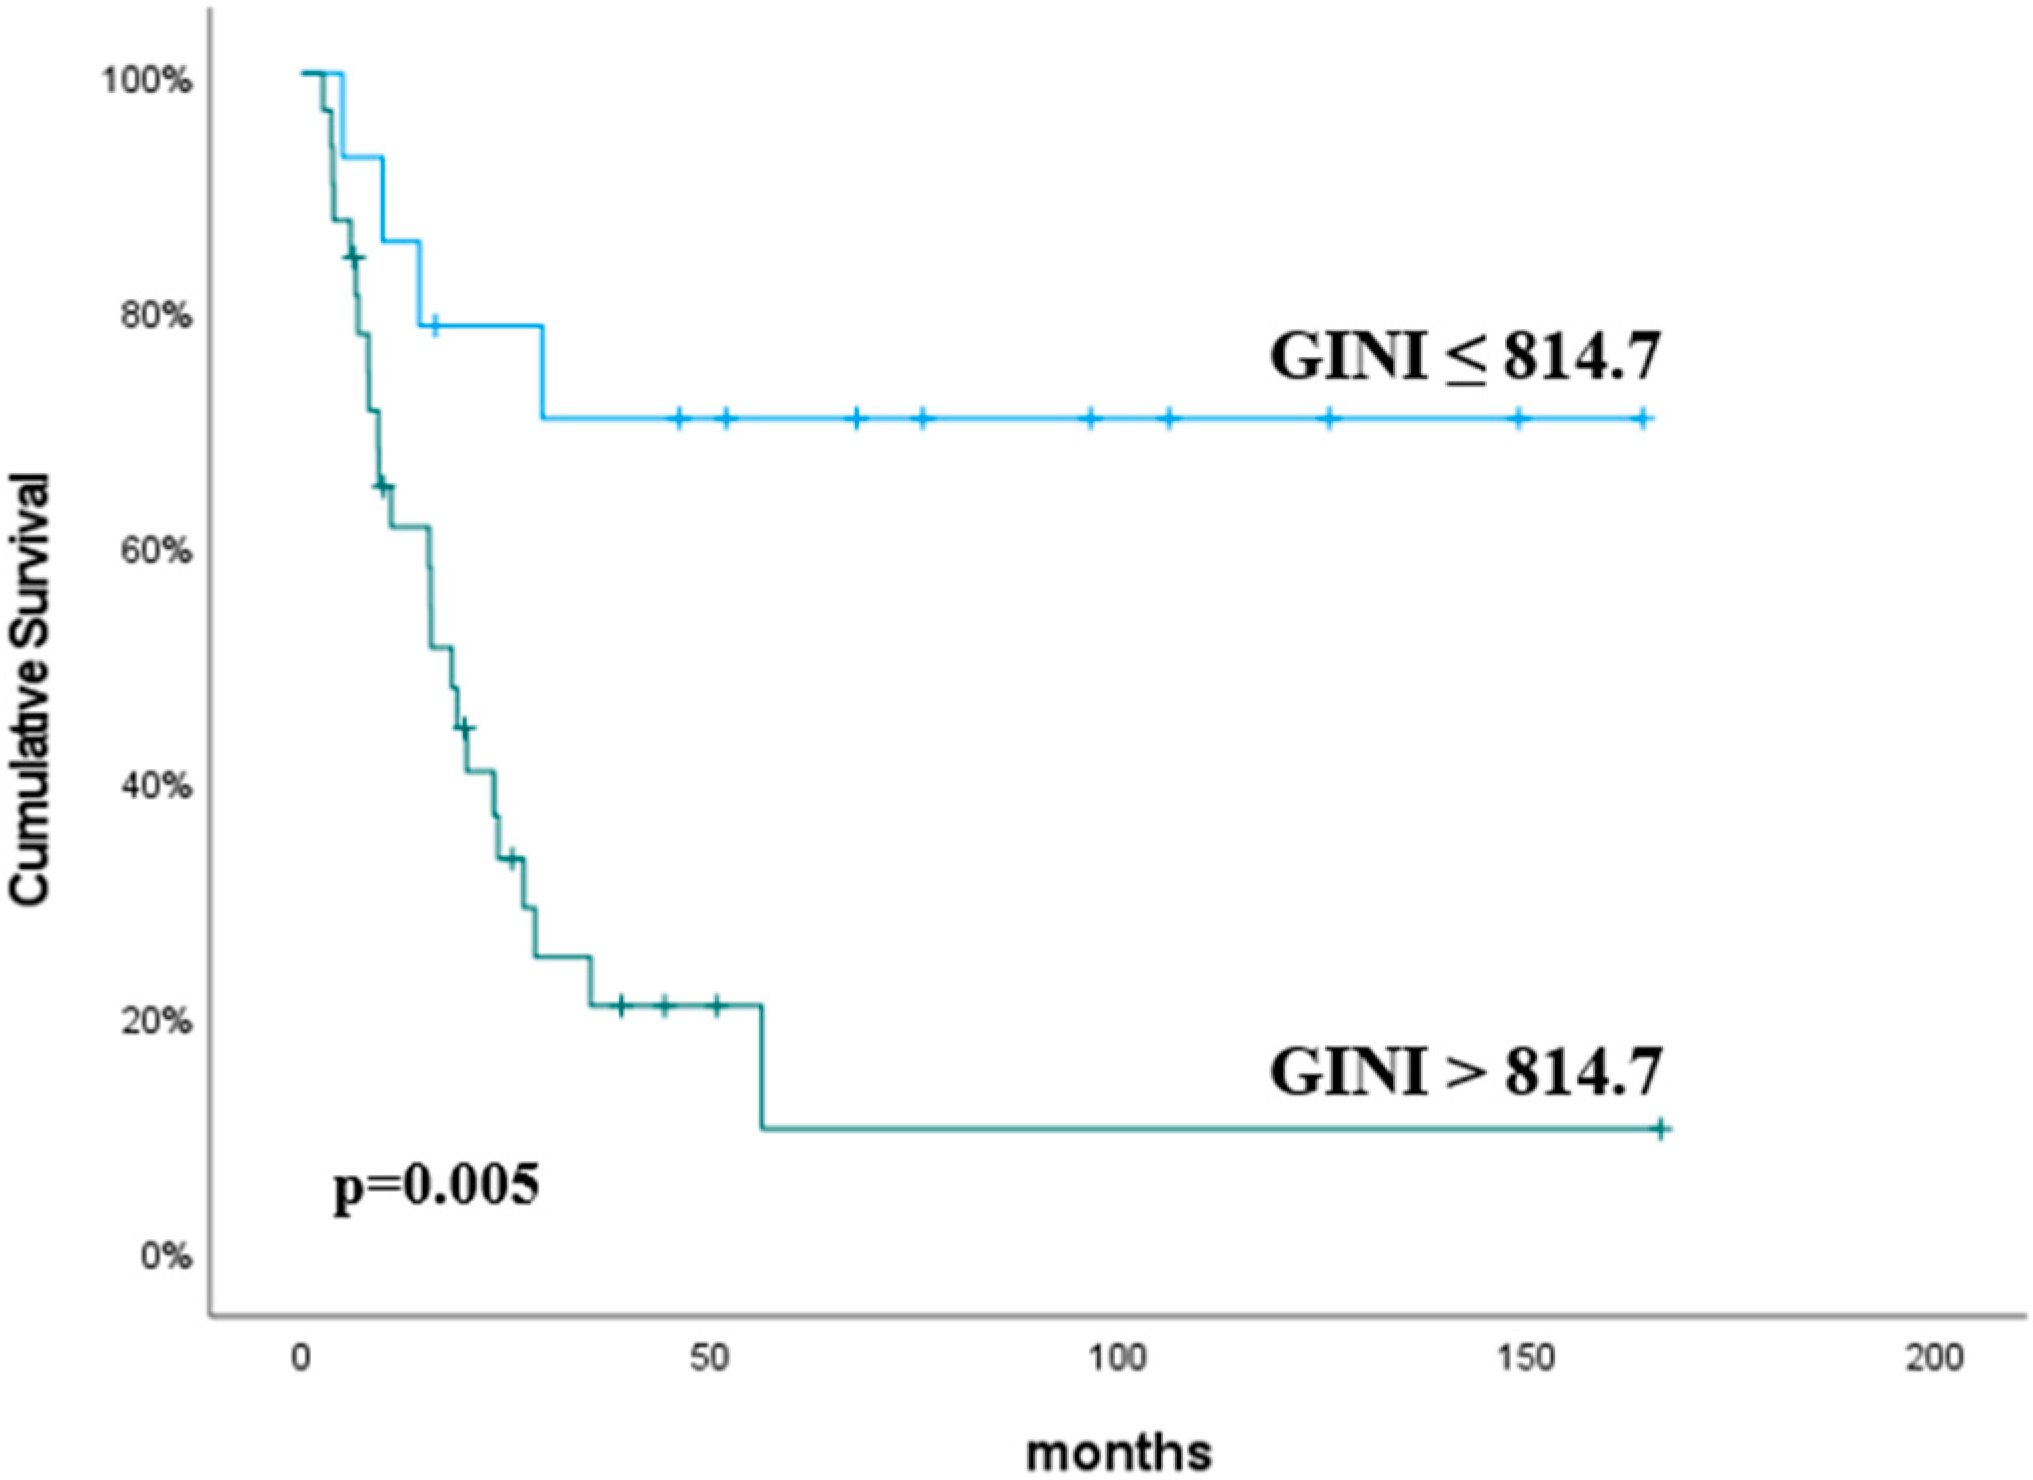
| GINI | 814.7 | 85.7 | 55.6 | 0.69 (0.52–0.85) | 0.031 |
| Univariate Analysis | Multivariate Analysis | ||||
|---|---|---|---|---|---|
| Variables | Cut-Off | HR (%95 Cl) | p | HR (%95 Cl) | p |
| Age (years) | ≤60 vs. >60 | 1.07 (0.44–2.60) | 0.86 | ||
| Gender | Male vs. Female | 1.02 (0.42–2.47) | 0.95 | ||
| ECOG-PS | 0–1 vs. 2 | 0.88 (0.26–3.03) | 0.85 | ||
| Histology | SCC vs. AC | 2.25 (0.73–6.87) | 0.15 | ||
| RT | Definitive vs. Neoadj. | 0.29 (0.04–2.17) | 0.22 | ||
| T stage | T3 vs. T4 | 0.86 (0.35–2.11) | 0.75 | ||
| N stage | N0 vs. N+ | 0.93 (0.37–2.34) | 0.88 | ||
| Neutrophil | ≤5.60 vs. >5.60 | 1.47 (0.52–4.14) | 0.46 | ||
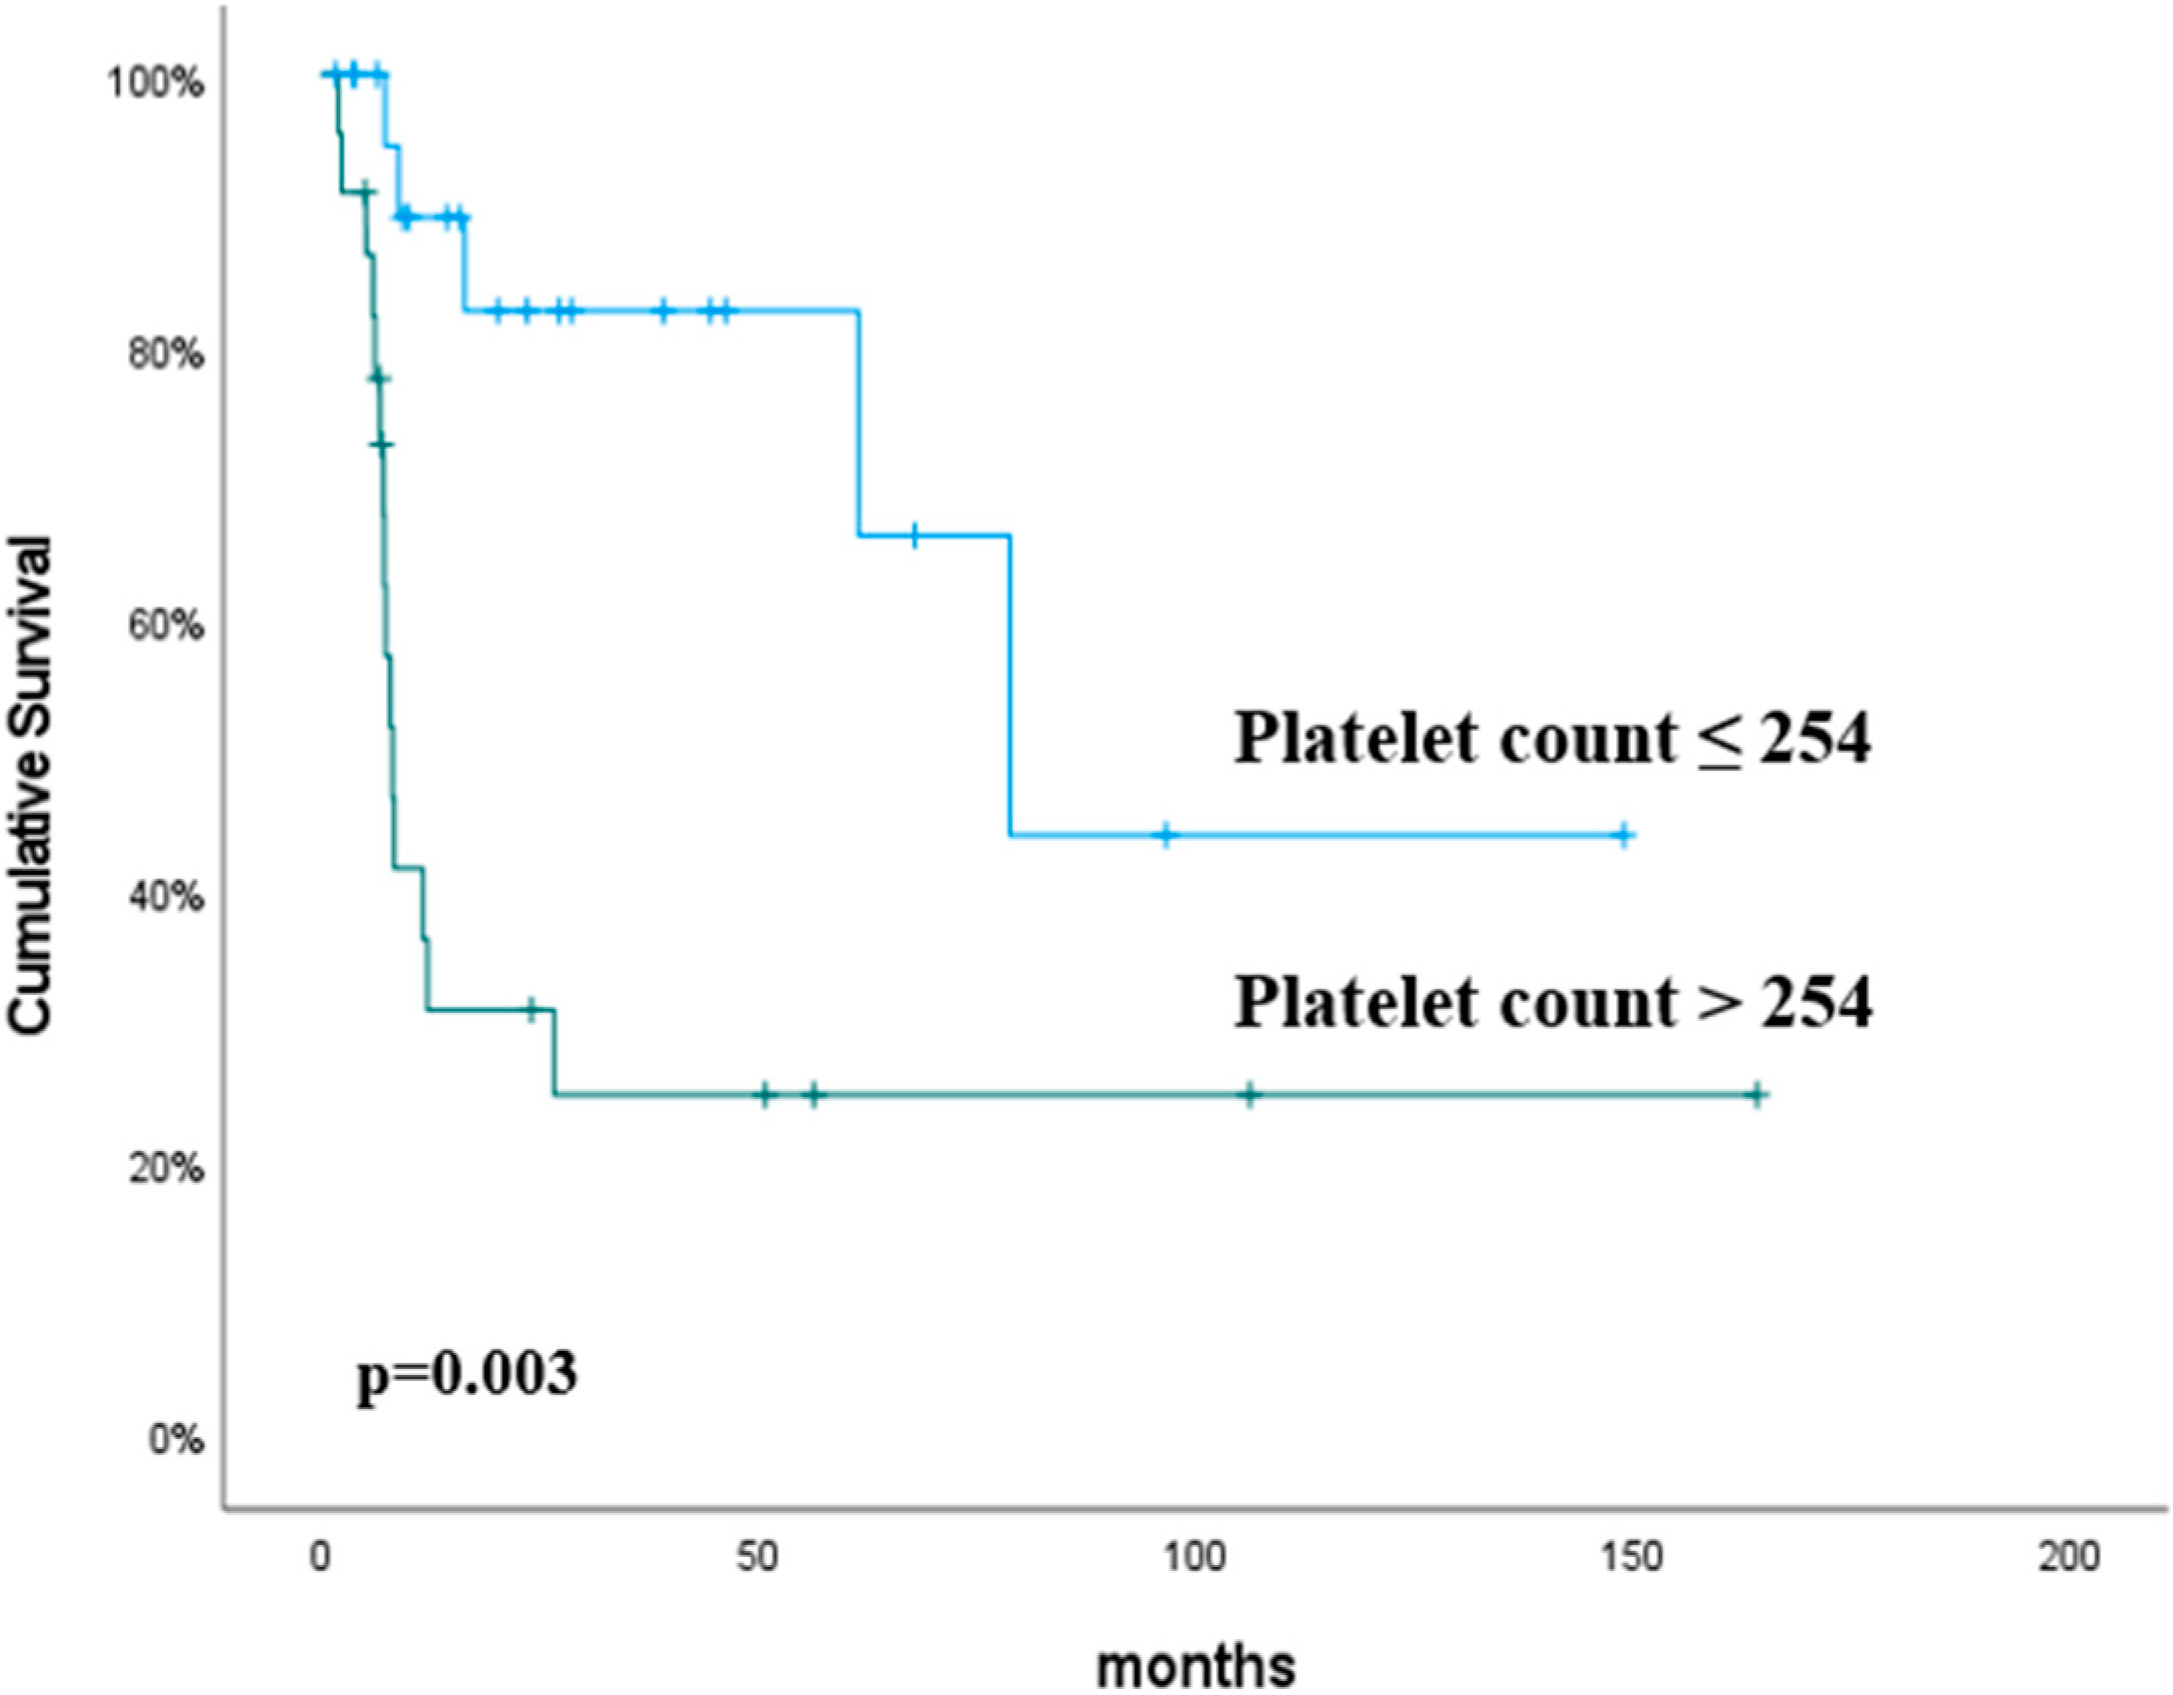
| Platelet | ≤254 vs. >254 | 4.71 (1.69–13.1) | 0.003 | 4.32 (1.54–12.1) | 0.005 |
| Monocyte | ≤0.48 vs. >0.48 | 2.61 (1.04–6.54) | 0.04 | 2.10 (0.79–5.57) | 0.13 |
| Lymphocyte | ≤1.40 vs. >1.40 | 1.45 (0.47–4.43) | 0.51 | ||
| NLR | ≤2.94 vs. >2.94 | 1.00 (0.38–2.58) | 1.00 | ||
| PLR | ≤162.1 vs. >162.1 | 1.32 (0.51–3.45) | 0.55 | ||
| MLR | ≤0.27 vs. >0.27 | 1.15 (0.45–2.88) | 0.76 | ||
| CRP | ≤16.25 vs. >16.25 | 2.19 (0.87–5.50) | 0.09 | ||
| Albumin | ≤4.34 vs. >4.34 | 0.73 (0.30–1.80) | 0.50 | ||
| ALBI grade | 1 vs. 2 | 1.61 (0.52–4.94) | 0.39 | ||
| GINI | ≤814.7 vs. >814.7 | 2.17 (0.74–6.40) | 0.15 | ||
| Univariate Analysis | Multivariate Analysis | ||||
|---|---|---|---|---|---|
| Variables | Cut-Off | HR (%95 Cl) | p | HR (%95 Cl) | p |
| Age (years) | ≤60 vs. >60 | 1.33 (0.62–2.81) | 0.45 | ||
| Gender | Male vs. Female | 0.60 (0.28–1.26) | 0.18 | ||
| ECOG-PS | 0–1 vs. 2 | 1.77 (0.74–4.18) | 0.19 | ||
| Histology | SCC vs. AC | 1.46 (0.50–4.24) | 0.48 | ||
| RT | Definitive vs. Neoadj. | 1.71 (0.69–4.23) | 0.24 | ||
| T stage | T3 vs. T4 | 0.57 (0.26–1.28) | 0.17 | ||
| N stage | N0 vs. N+ | 0.72 (0.34–1.55) | 0.41 | ||
| Neutrophil | ≤5.60 vs. >5.60 | 2.23 (1.02–4.86) | 0.04 | 0.96 (0.35–2.68) | 0.95 |
| Platelet | ≤254 vs. >254 | 1.51 (0.71–3.20) | 0.27 | ||
| Monocyte | ≤0.48 vs. >0.48 | 1.40 (0.66–2.96) | 0.37 | ||
| Lymphocyte | ≤1.40 vs. >1.40 | 0.37 (0.16–0.84) | 0.01 | 0.86 (0.23–3.17) | 0.82 |
| NLR | ≤2.94 vs. >2.94 | 2.99 (1.38–6.46) | 0.005 | 1.91 (0.60–6.08) | 0.27 |
| PLR | ≤162.1 vs. >162.1 | 3.09 (1.44–6.66) | 0.004 | 1.14 (0.28–4.60) | 0.85 |
| MLR | ≤0.27 vs. >0.27 | 1.82 (0.79–4.15) | 0.15 | ||
| CRP | ≤16.25 vs. >16.25 | 2.39 (1.10–5.20) | 0.02 | 1.14 (0.42–3.06) | 0.79 |
| Albumin | ≤4.34 vs. >4.34 | 0.48 (0.21–1.10) | 0.08 | ||
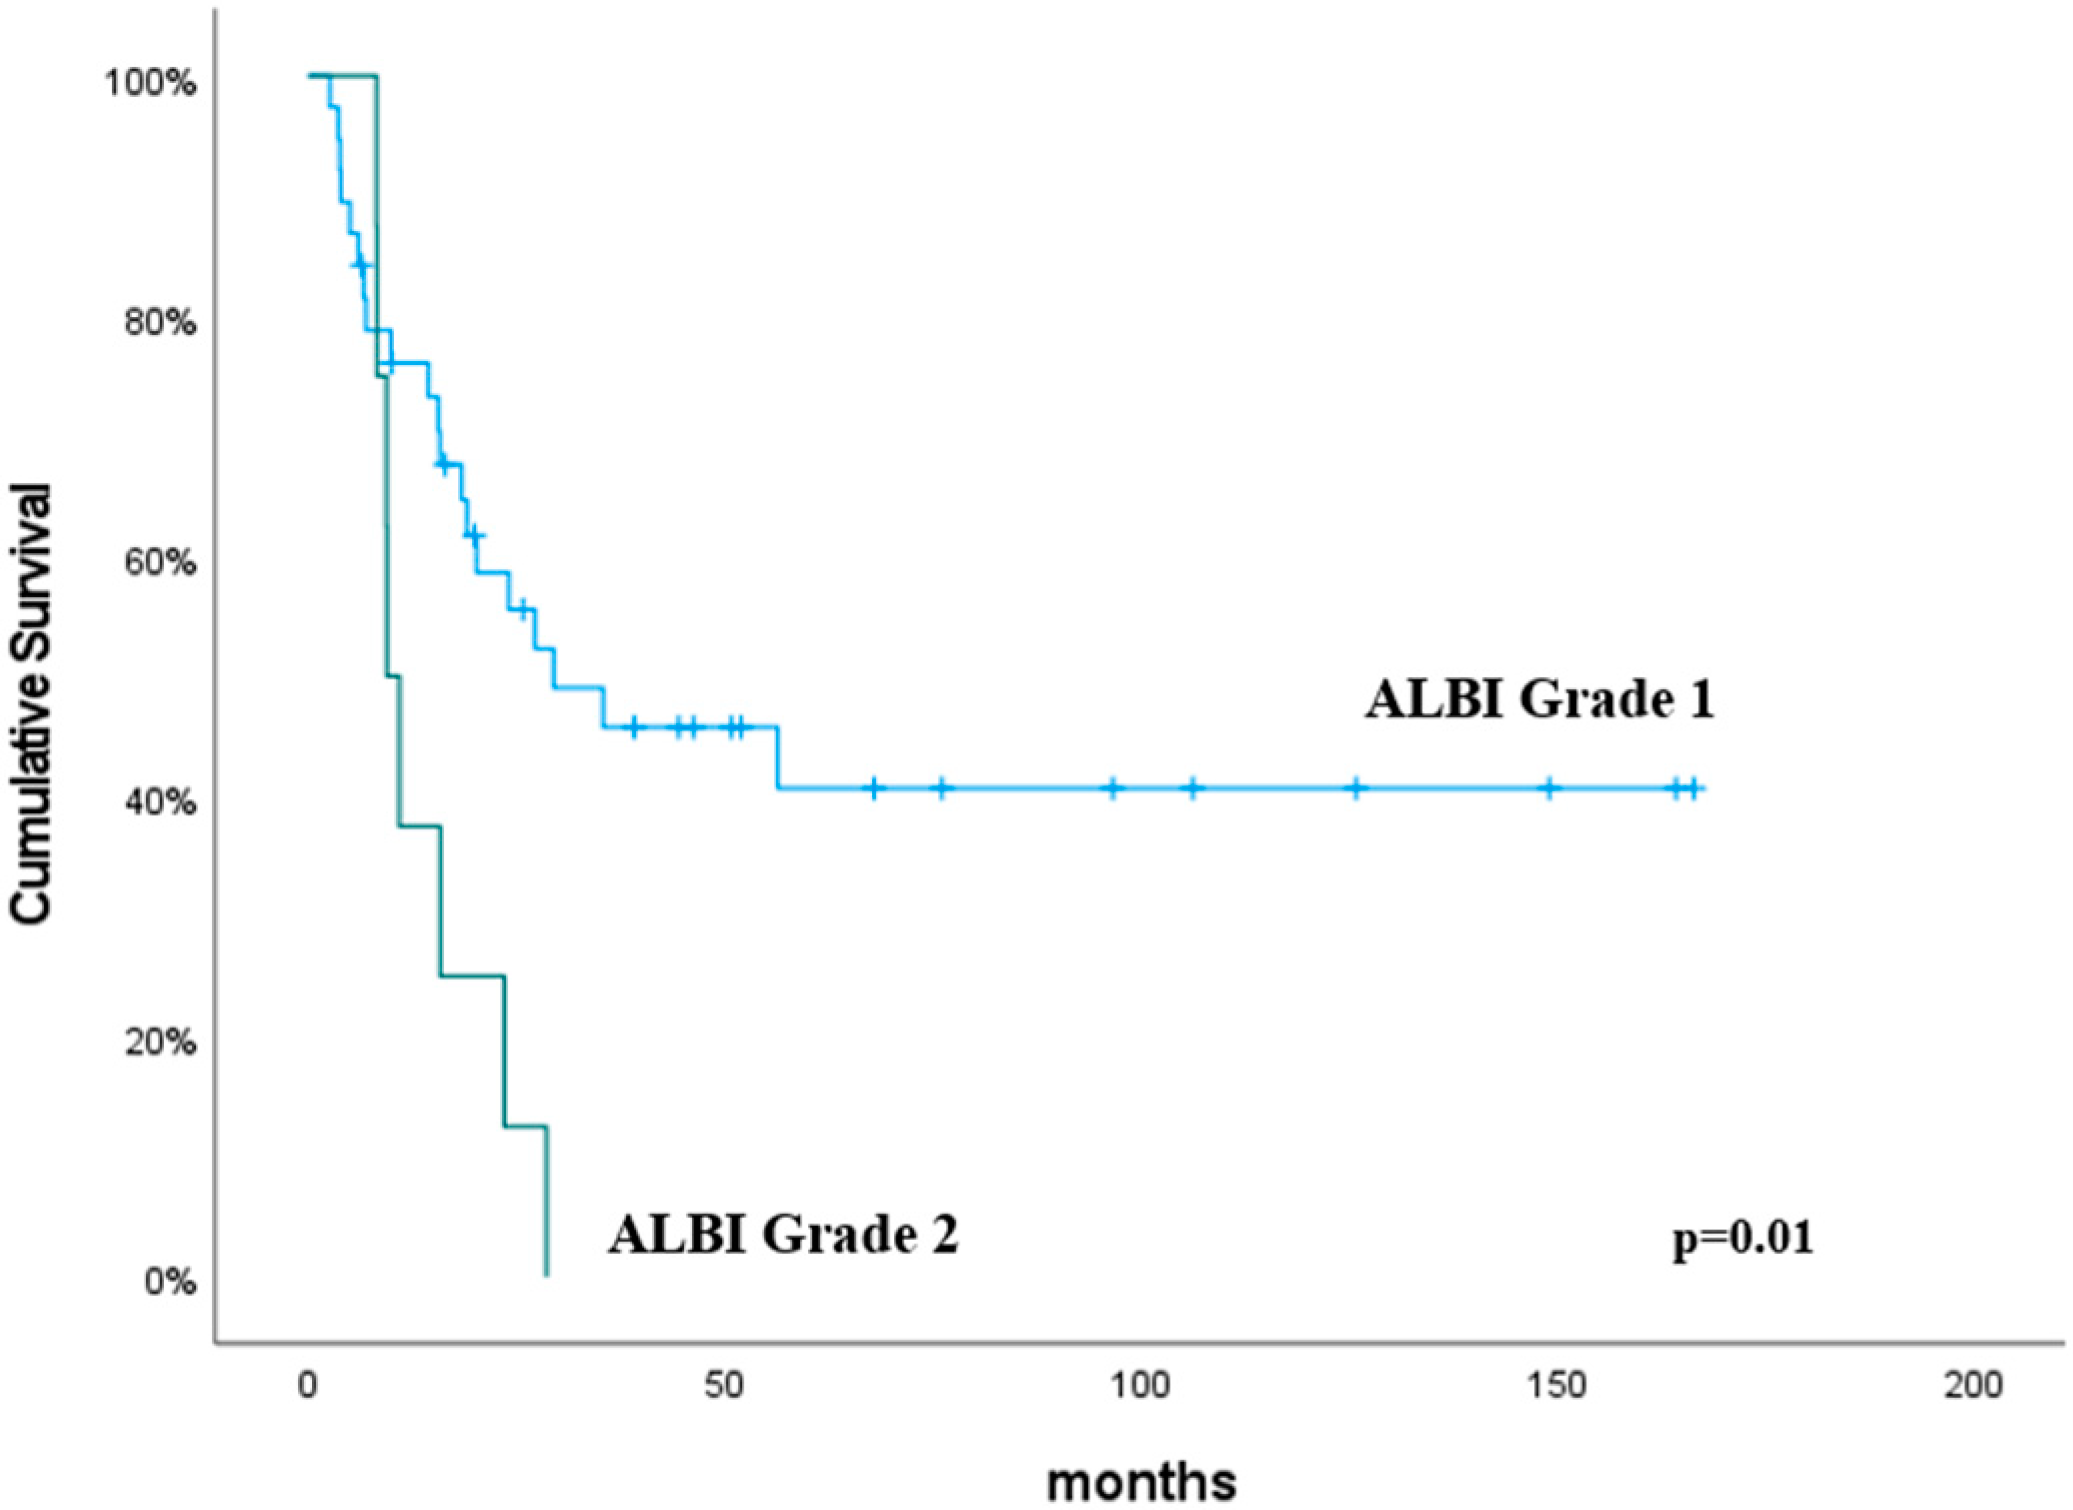
| ALBI grade | 1 vs. 2 | 3.07 (1.29–7.25) | 0.01 | 1.28 (0.35–4.59) | 0.70 |
| GINI | ≤814.7 vs. >814.7 | 4.73 (1.60–13.9) | 0.005 | 3.22 (0.83–12.4) | 0.08 |
Disclaimer/Publisher’s Note: The statements, opinions and data contained in all publications are solely those of the individual author(s) and contributor(s) and not of MDPI and/or the editor(s). MDPI and/or the editor(s) disclaim responsibility for any injury to people or property resulting from any ideas, methods, instructions or products referred to in the content. |
© 2024 by the authors. Licensee MDPI, Basel, Switzerland. This article is an open access article distributed under the terms and conditions of the Creative Commons Attribution (CC BY) license (https://creativecommons.org/licenses/by/4.0/).
Share and Cite
Koca, T.; Hasdemir, B.; Aksoy, R.A.; Korcum, A.F. Predictive Value of GINI and ALBI Grades in Esophageal Cancer Receiving Chemoradiotherapy. Curr. Oncol. 2024, 31, 6829-6839. https://doi.org/10.3390/curroncol31110504
Koca T, Hasdemir B, Aksoy RA, Korcum AF. Predictive Value of GINI and ALBI Grades in Esophageal Cancer Receiving Chemoradiotherapy. Current Oncology. 2024; 31(11):6829-6839. https://doi.org/10.3390/curroncol31110504
Chicago/Turabian StyleKoca, Timur, Busra Hasdemir, Rahmi Atıl Aksoy, and Aylin Fidan Korcum. 2024. "Predictive Value of GINI and ALBI Grades in Esophageal Cancer Receiving Chemoradiotherapy" Current Oncology 31, no. 11: 6829-6839. https://doi.org/10.3390/curroncol31110504
APA StyleKoca, T., Hasdemir, B., Aksoy, R. A., & Korcum, A. F. (2024). Predictive Value of GINI and ALBI Grades in Esophageal Cancer Receiving Chemoradiotherapy. Current Oncology, 31(11), 6829-6839. https://doi.org/10.3390/curroncol31110504