Article

Dynamics Simulation and Field Test Verification of Multi-Functional Beekeeping Loading Box Based on the Tracked Vehicle

1
Department of Biosystems Engineering, College of Agriculture and Life Sciences, Kangwon National University, Chuncheon 24341, Korea
2
Interdisciplinary Program in Smart Agriculture, College of Agriculture and Life Sciences, Kangwon National University, Chuncheon 24341, Korea
3
Department of Agricultural Biology, The National Institute of Agricultural Science, RDA, Wanju 55365, Korea
*
Author to whom correspondence should be addressed.
Appl. Sci. 2022, 12(13), 6667; https://doi.org/10.3390/app12136667
Submission received: 17 May 2022 / Revised: 16 June 2022 / Accepted: 24 June 2022 / Published: 1 July 2022
(This article belongs to the Section Mechanical Engineering)

Abstract

:
The Korean beekeeping industry is continuously declining owing to the aging worker population and a lack of automation. To solve the problem of manual transportation and low automation of transportation tools in Korean apiculture, a multifunctional beekeeping transport loading box was developed by modifying a tracked vehicle developed in previous studies. To ensure the safety of the modified beekeeping vehicle in an apiary, a dynamic analysis of the vehicle in virtual simulation conditions and a field test inside an actual apiary were conducted. Firstly, the TRACK_LM module in multibody dynamics software RecurDyn was used to model the vehicle. Then, the model was analyzed in two use cases (bee frame loading and beehive loading), three geological conditions (clayey soil, dry sand, and upland sandy loam), and two types of terrain (s-turn and 8° slope). Meanwhile, tests under similar conditions were conducted in an actual apiary. The simulation results indicated that the modified beekeeping vehicle operated stably in the simulated agricultural apiary ground (clayey soil and upland sandy loam). The maximum pitch angles in the clayey soil and upland sandy loam conditions were 11.77° and 12.74°, respectively. However, the vehicle cannot operate under dry sand conditions on a slope because it exceeded the calculated maximum angle (34°) during operation. The maximum pitch angle of only 8.8° in the apiary transport experiment proved that the modified beekeeping vehicle could be driven safely in actual apiaries. Moreover, a comparison of the field test results with the simulation results revealed that the field test further verifies the reference value and correctness of the simulation results.

1. Introduction

Beekeeping dates back thousands of years to ancient Egypt and ancient Greece. The development of modern beekeeping techniques stems from the development of Lang’s beehive (Longstroch, a beekeeper in Philadelphia, USA), which has a portable design with interchangeable bee frames. By 1861, Lang’s hives had become widespread in the United States, in addition to arriving in Europe and other countries [1].
As beekeeping has spread worldwide, beekeeping tools and husbandry techniques have developed significantly. In 1865, Franz invented the centrifugal honey picker, which could extract honey without destroying the nest spleen [2]. This type of honey picker has a simple structure, is easy to operate, and allows beekeepers to produce honey without destroying the bee frame. The centrifugal honey picker continues to be actively used by beekeepers in various countries and has undergone several changes, for instance, from hand-cranked to electrically driven, which have significantly increased beekeepers’ productivity. Other beekeeping tools such as smart beehives, beeswax separators, electric honey capping machines, and uncrewed remote-controlled honey harvesters have been invented and used with various types of beekeeping hives [3,4,5].
In South Korea, beekeeping started in the Goguryeo Kingdom 2000 years ago. In the early 21st century, the number of beehives in Korea’s beekeeping industry increased dramatically to 2 million, and the country now produces about 30,000 tons of honey annually. Korea’s beekeeping industry is ranked 17th in the world, and its annual revenue is USD 191 million [6,7]. The terrain in South Korea is mainly mountainous with few plains [8]. For this reason, South Korea’s beekeeping industry is dominated by small-scale family-run beekeeping farms, and large-scale beekeeping farms are rare. These small apiaries are usually located in suburban areas far from the city center in small, relatively flat areas. They consist of 4–5 rows of hives that are arranged closely with a spacing of 2–3 m between two rows to allow 1 or 2 persons to pass through [9]. In Korea, the weather varies considerably across various regions. For this reason, many farmers use mobile beekeeping units to optimize economic benefits [10]. They travel to the south during cold weather, gradually move to the north as the weather warms up, and then return to the south again. This mobile beekeeping breaks the limitations of traditional fixed beekeeping and allows beekeepers to produce honey in all seasons [11].
Large apiaries are equipped with various automated equipment lines. When necessary, staff members use electric lifts to raise the hives in sequence to check the condition of the internal bee frames. To harvest honey, beehives are placed on a railed mini-transporter that automatically transports the hives to the electric honey picker when it detects a load. The beekeeping staff then picks these bee frames and places them in an electric honey picker to start the honey harvesting process. After extraction, the frames are returned to the mini-transporter for the subsequent honey harvesting and transportation. The honey collected by the electric honey picker is eventually packaged using an automatic filling machine. Only one person can operate this workflow efficiently, which is great for the aging Korean beekeeping industry. However, such automated apiaries have many disadvantages. First, such orbital-type automated apiaries are incompatible with mobile beekeeping. Second, automated apiaries are not economically efficient and cannot facilitate multiple harvests in a year. Third, the massive upfront investment of approximately USD 20,000 means that the system is not an option for small apiaries.
In small apiaries, manual and semi-automatic machines are used more commonly. Beekeepers generally arrange their hives together so that there are as few environmental constraints as possible at the site-selection state. When checking the bee frames inside a hive, beekeepers must manually check the upper sides of the hives first and then turn them upside down to check the lower side. For collecting honey, bee frames are loaded onto a two-wheeled trolley and pushed manually to an automatic bee remover and automatic honey picker. The leftover bees are removed from the frame by using the automatic bee remover, and honey is collected using the automatic honey picker. After honey collection, the empty bee frames are reloaded onto the two-wheeled trolley and transported back to the empty hives. In mobile beekeeping, beekeepers need to use a two-wheeled trolley to load the beehives and carry them manually to the truck. The loading efficiency of the trolley is extremely low, and it can only load two hives at a time. Small apiaries must hire 2–3 workers to complete the honey harvesting work in each honey harvesting season, and their economic efficiency is extremely low [12]. Moreover, owing to the problem of aging in the Korean beekeeping industry, it is becoming increasingly difficult to perform beekeeping manually [13].
In our previous research [14], we described the design of a multifunctional beekeeping loading box by modifying the rear loading box mounted on tracked vehicles. First, the rear loading box can be opened on three sides, with removable combination panels in the middle. When the loading box is folded, it could load up to 80 bee frames at once, which was the number of bee frames in 8 beehives. When the loading box is unfolded, it can load up to 6 beehives. Compared to the traditional method, the proposed method increased the efficiencies of bee frame transportation and beehive transportation by 8 and 3 times, respectively. The loading box was modeled using SolidWorks, and static analysis of bee frames was performed using the simulation mode in SolidWorks by considering two conditions: folded and unfolded loading box conditions. The static analysis result concluded that the stability of the loading box was still within the safe limits when fully loaded. However, the safety of the tracked vehicle cannot be ensured by relying on static analysis alone. Considering the different geologies and ground flatness encountered during actual operations, in some extreme cases, it could lead to extreme phenomena such as bee frames breaking and flying off the vehicle. Moreover, because of differences in external ground conditions, vehicle stability must be analyzed considering the various ground surfaces so that the vehicle can be moved smoothly during actual operations.
In this paper, Korean multibody dynamics analysis software RecurDyn (Recursive Dynamic) was used to simulate the transportation of a tracked beekeeping vehicle. RecurDyn represents the newest generation of multibody system dynamics simulation software applications developed by FunctionBay, Inc. Owing to its powerful solving capabilities, RecurDyn has been used in diverse industries, including aviation, military vehicles, construction machinery, railroads, marine machinery, and other general-purpose machinery. Among them, the TrackLM module in RecurDyn was used in various low-speed tracked vehicle simulation scenarios [15].
Based on the original design and static analysis of a tracked beekeeping vehicle, the dynamics of the tracked beekeeping vehicle were simulated in various terrain and geological scenarios using the RecurDyn multi-body dynamics analysis software application. The safety performance of the tracked beekeeping vehicle in the transportation process was examined by determining the vibration performance of the shaking bee frame, vehicle passability, and vehicle stability during the loading of the bee boxes. However, because of the differences between the dynamic analysis model and actual operations, the actual operation test was conducted inside an apiary in Korea to verify the realism of the simulation. The specific objectives of this study are as follows:
(1)
Perform modeling and dynamics analysis of actual vehicles in RecurDyn.
(2)
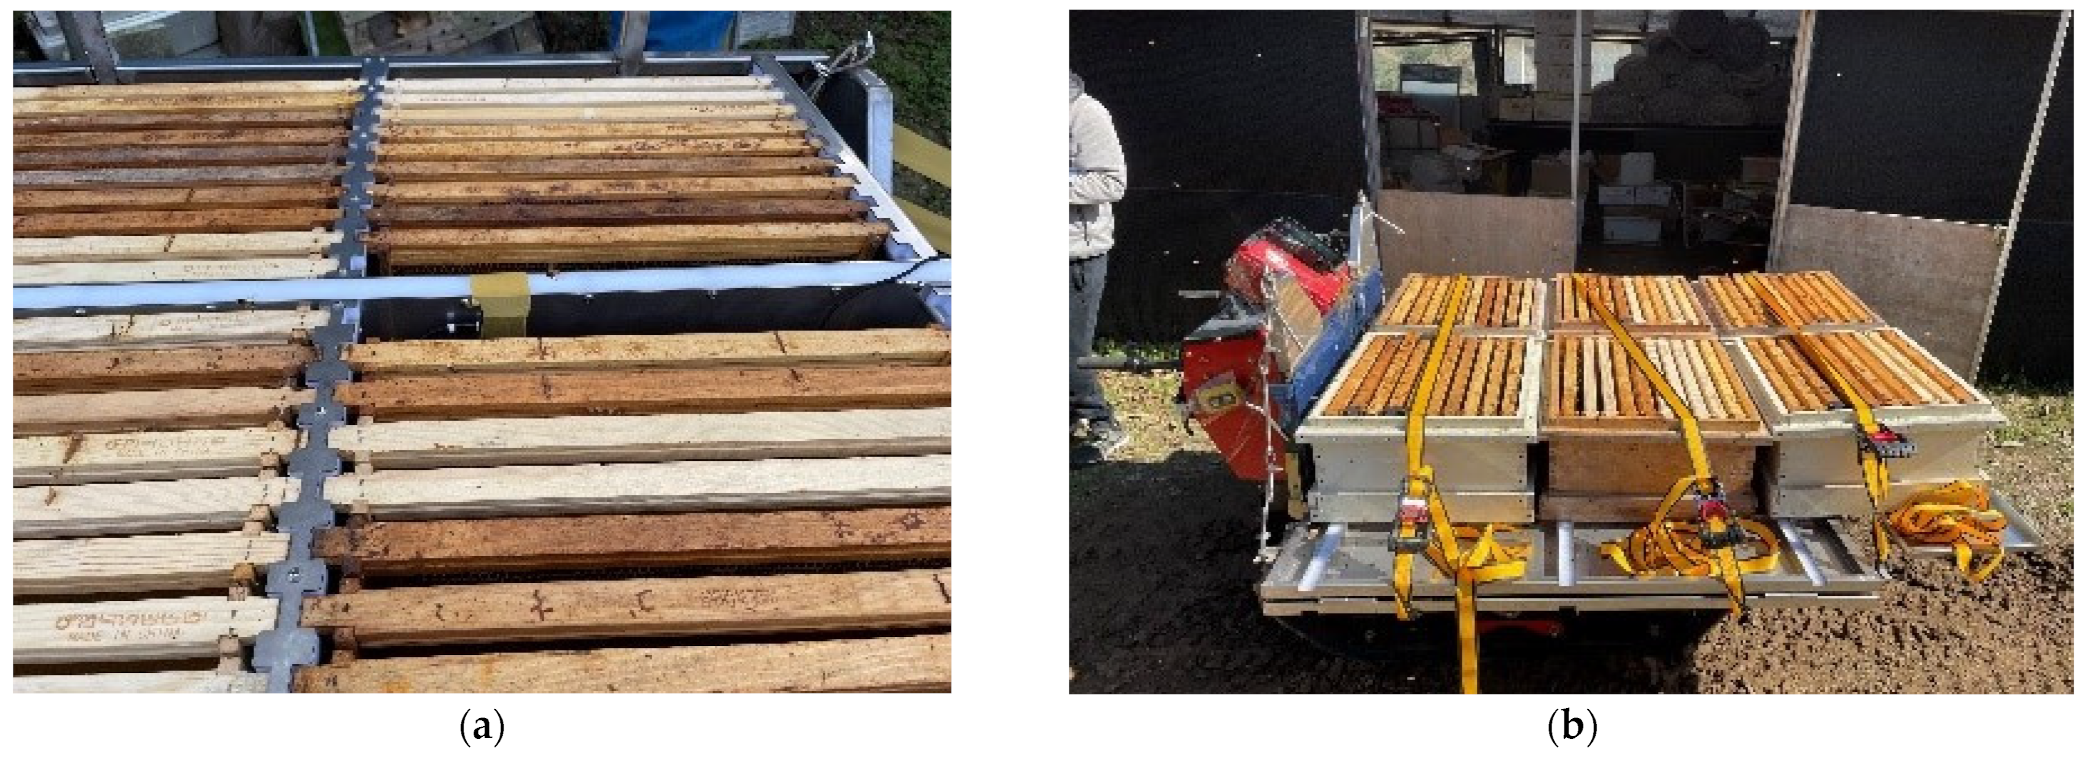
Conduct field transportation tests of beekeeping transporters inside apiaries to determine their safety.
(3)
Compare the results of dynamics analysis with those of the field test to verify the correctness of the dynamics analysis test and feasibility of field operation.

2. Materials and Methods

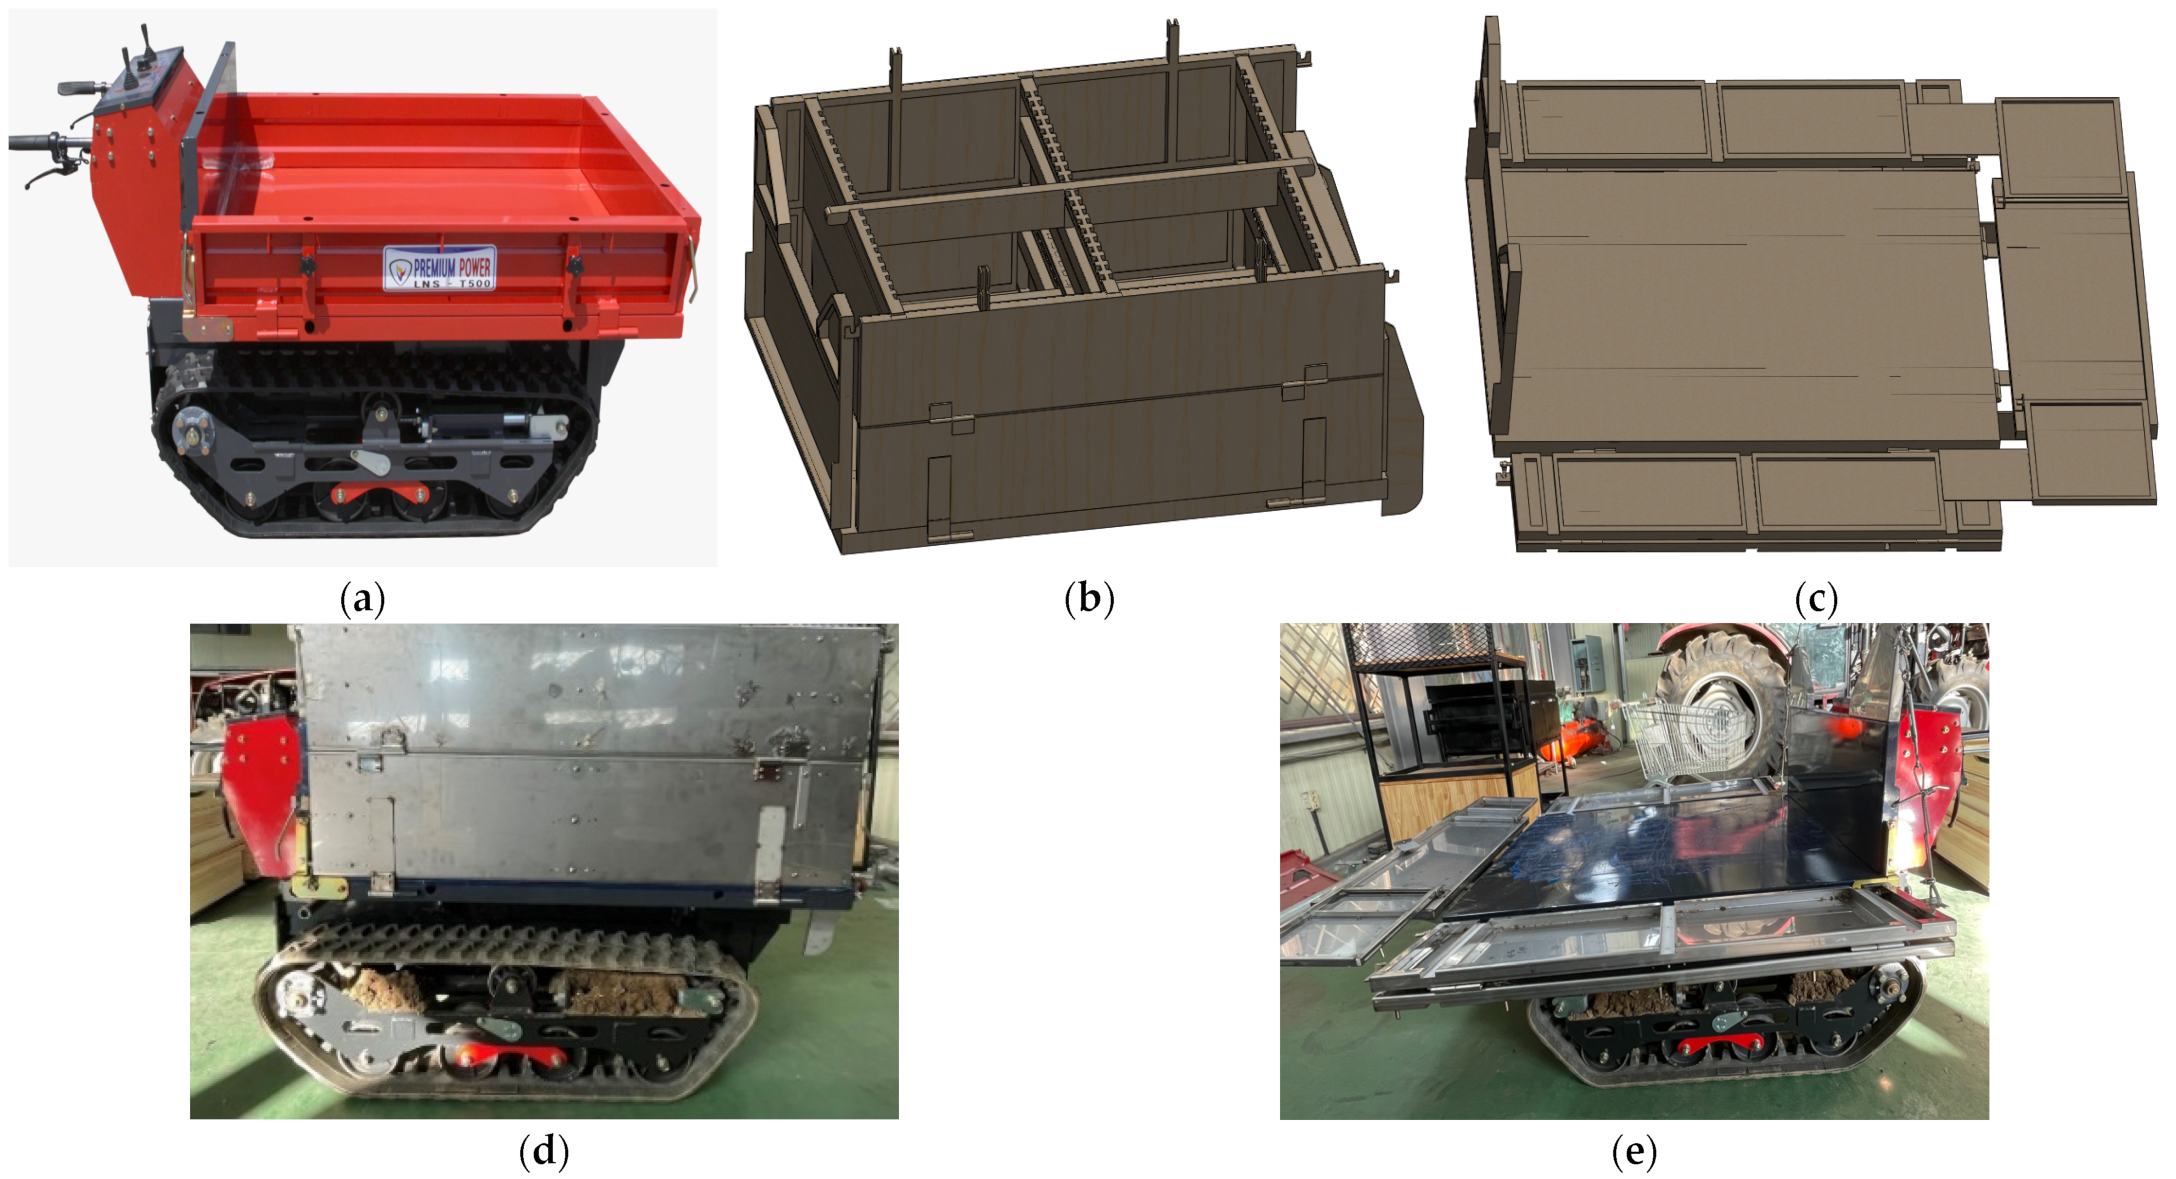
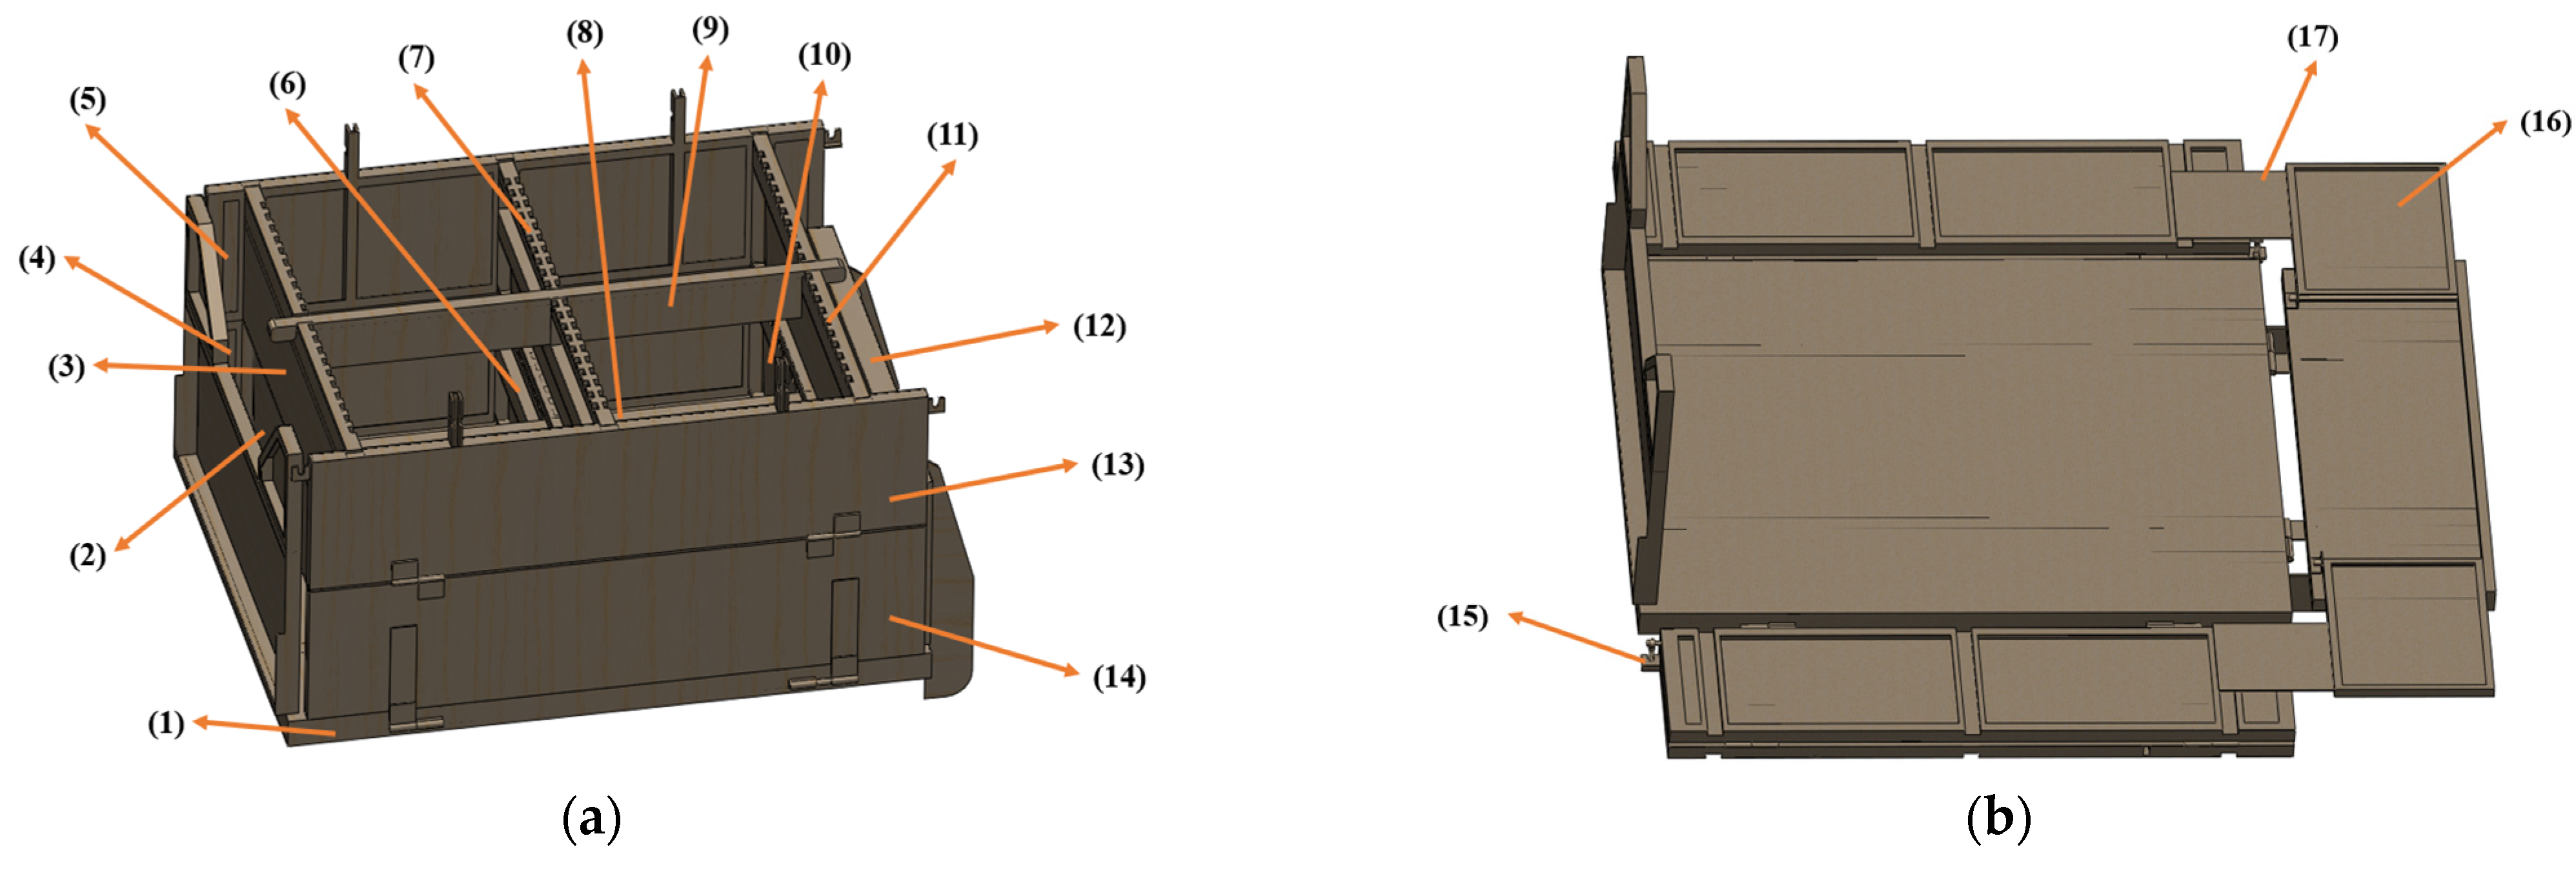
2.1. Multi-Functional Tracked Beekeeping Vehicle

To solve the problem of low automation and, consequently, intense physical effort required on the part of beekeepers, in beekeeping transportation, a multifunctional beekeeping transportation vehicle was developed in our previous study [14]. The tracked beekeeping vehicle was developed based on the T500 electric tracked vehicle of LNS Korea (LNS, Gwangju, Korea). The T500 electric tracked vehicle is battery-driven (240AH/20HR). Its maximum loading capacity and maximum transportation speed are 500 kg and 3.2 km/h, respectively. Moreover, because of its rubber track, this vehicle can easily move through fields. In our previous study, the loading box of T500 was developed using SolidWorks, such that it was capable of loading the beehive and bee frames. Static analysis of the two forms of the loading box was performed by conducting a simulation to verify whether the loading box can be used safely [14]. Figure 1a–e show the LNS T500 tracked vehicle, design model when the loading box is loaded with bee frames, design model when the loading box is loaded with beehives, actual construction of the beekeeping vehicle during the transportation of bee frames, and actual construction of the beekeeping vehicle during the transportation of beehives, respectively.
When using the multifunctional beekeeping transporter to load bee frames, first, the upper layer of side panels (5) (13) of the loading box is opened, and the upper layers of partition panels (3) (7) (9) (11) are removed. When the lower layer of the loading box is full, the upper layer of dismantling plates is be loaded, and side panels (5) (13) are fastened; then, the upper layer of the loading box can start to be loaded.
When using the multifunctional beekeeping tracked vehicle for beehive transportation, it is necessary to remove all dismantling plates (2) (3) (6) (7) (8) (9) (10) (11) inside the loading box, unfold the sides panels (4) (5) (13) (14), unfold the back panel (12) horizontally, and attach two side plates (15) (17). The beehives can be loaded using the support devices on the side and rear panels. Figure 2 illustrates the positions of the side panels and dismantling plates.

2.2. Dynamics Modeling and Analysis of Multifunctional Tracked Vehicle

In the design phase, SolidWorks was used to model the loading box. To investigate the safety performance of the loading box, a static analysis of the loading box was performed by conducting a simulation, but the static analysis module in SolidWorks can only provide the force situation of the loading box at rest. However, the safety of the tracked vehicle during its movement must be considered. Therefore, RecurDyn (FunctionBay, Seongnam, Korea) was used to analyze the dynamics of the tracked vehicle.
The tracked vehicle must be modeled using RecurDyn to verify its dynamics. Owing to the complexity of modeling in RecurDyn, only the tracked part of the tracked vehicle was modeled using RecurDyn, while the main body and loading box parts were modeled using SolidWorks and, subsequently, imported into RecurDyn to be folded with the tracked part [16].

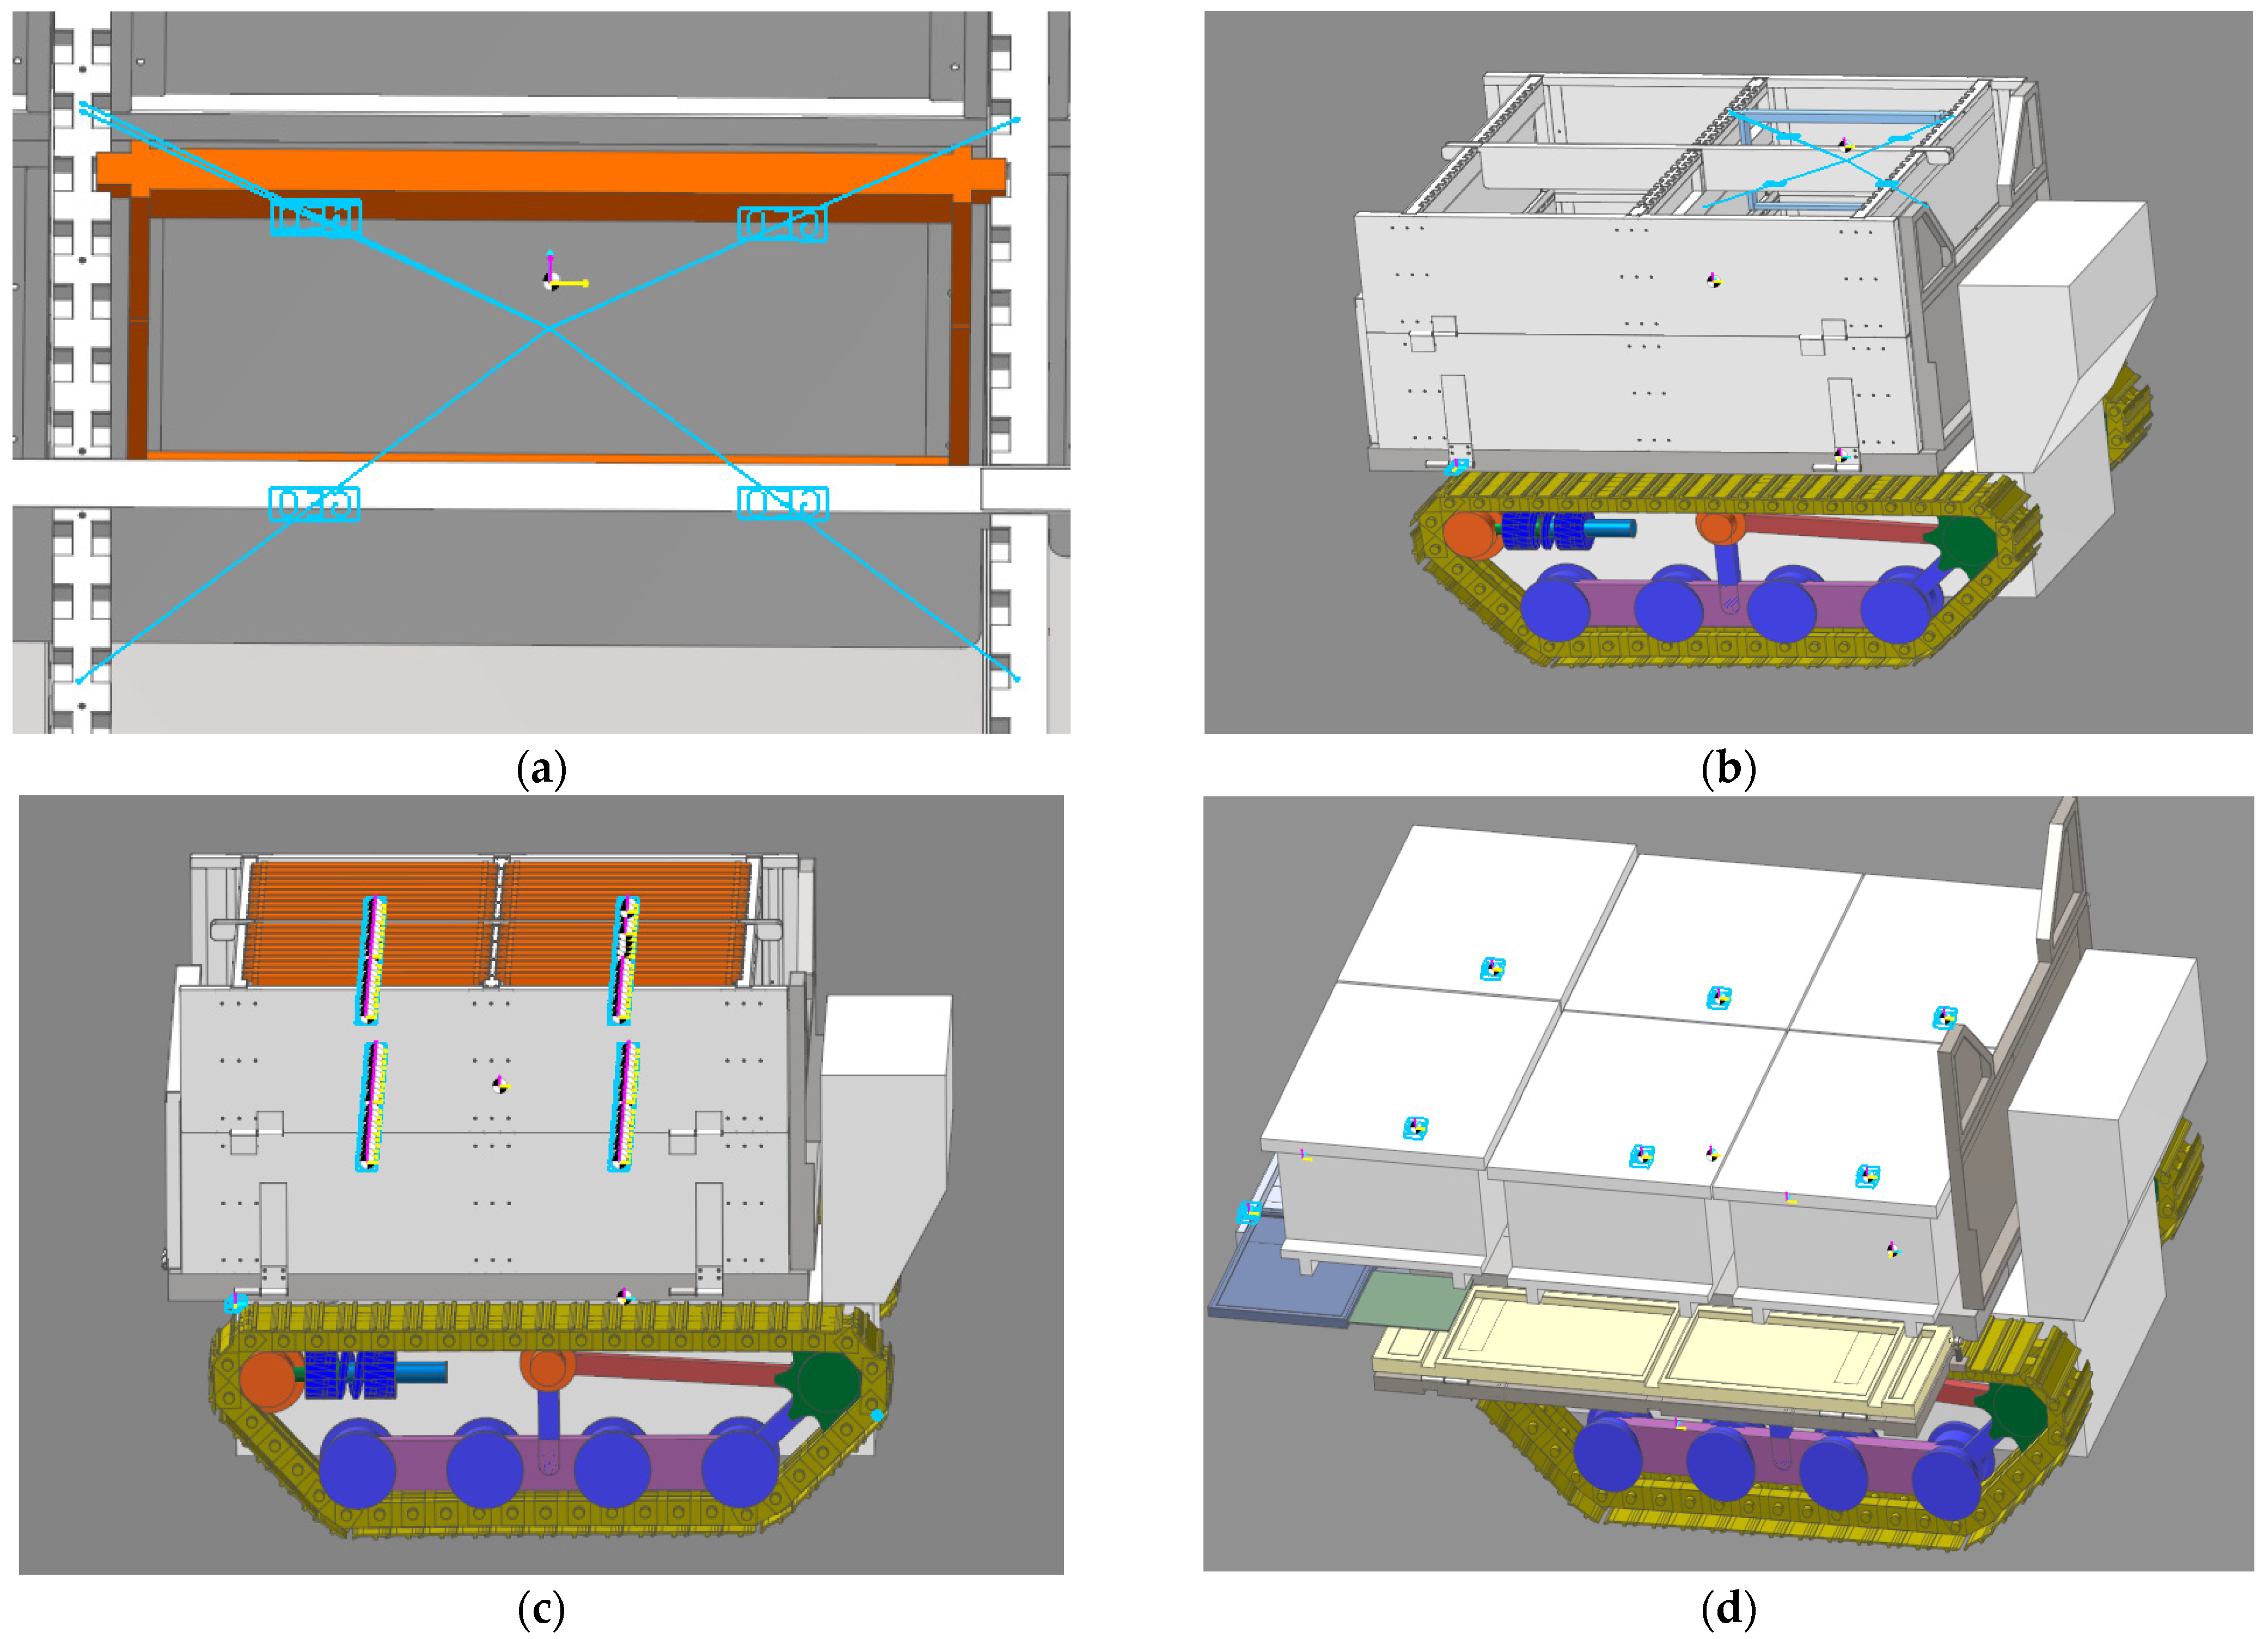
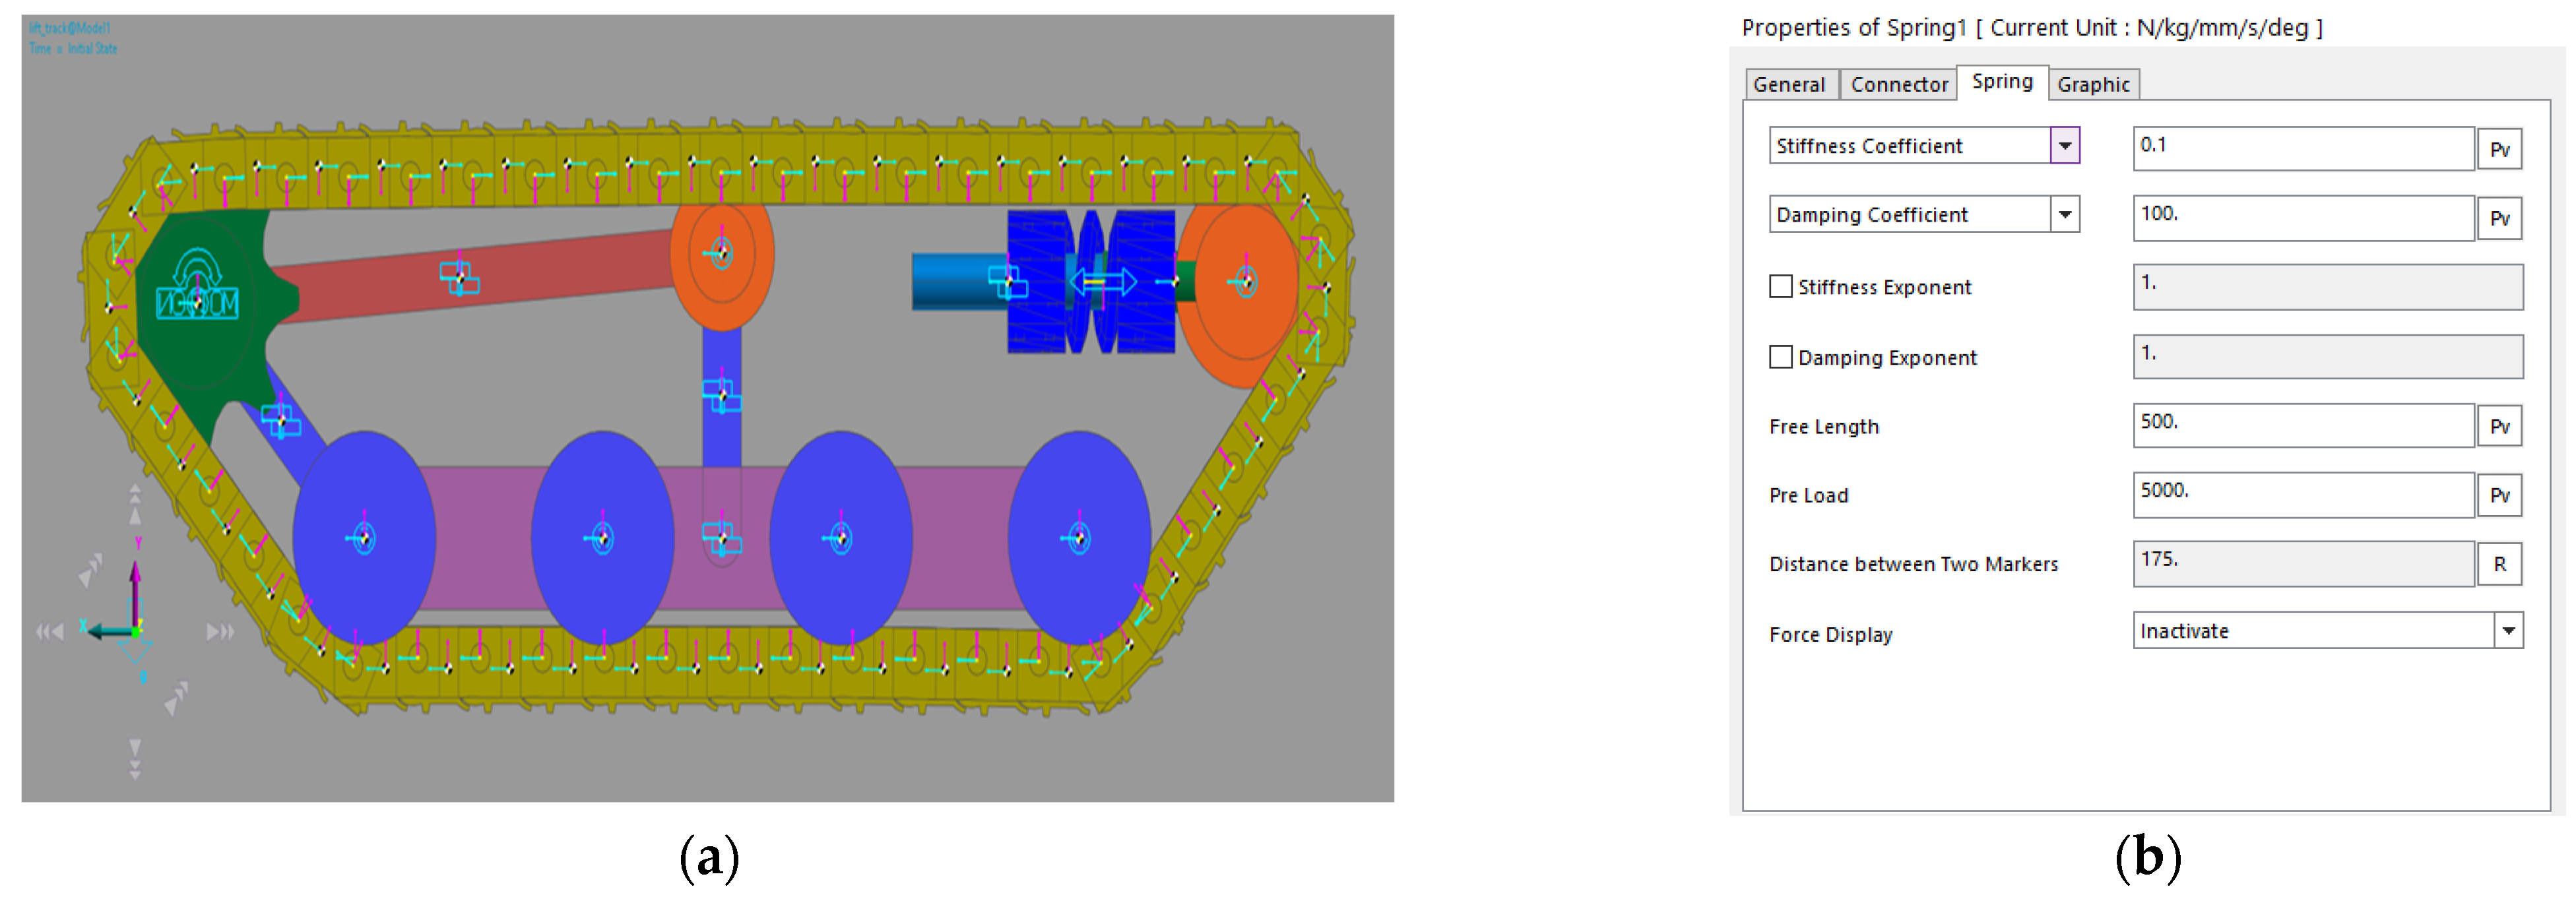
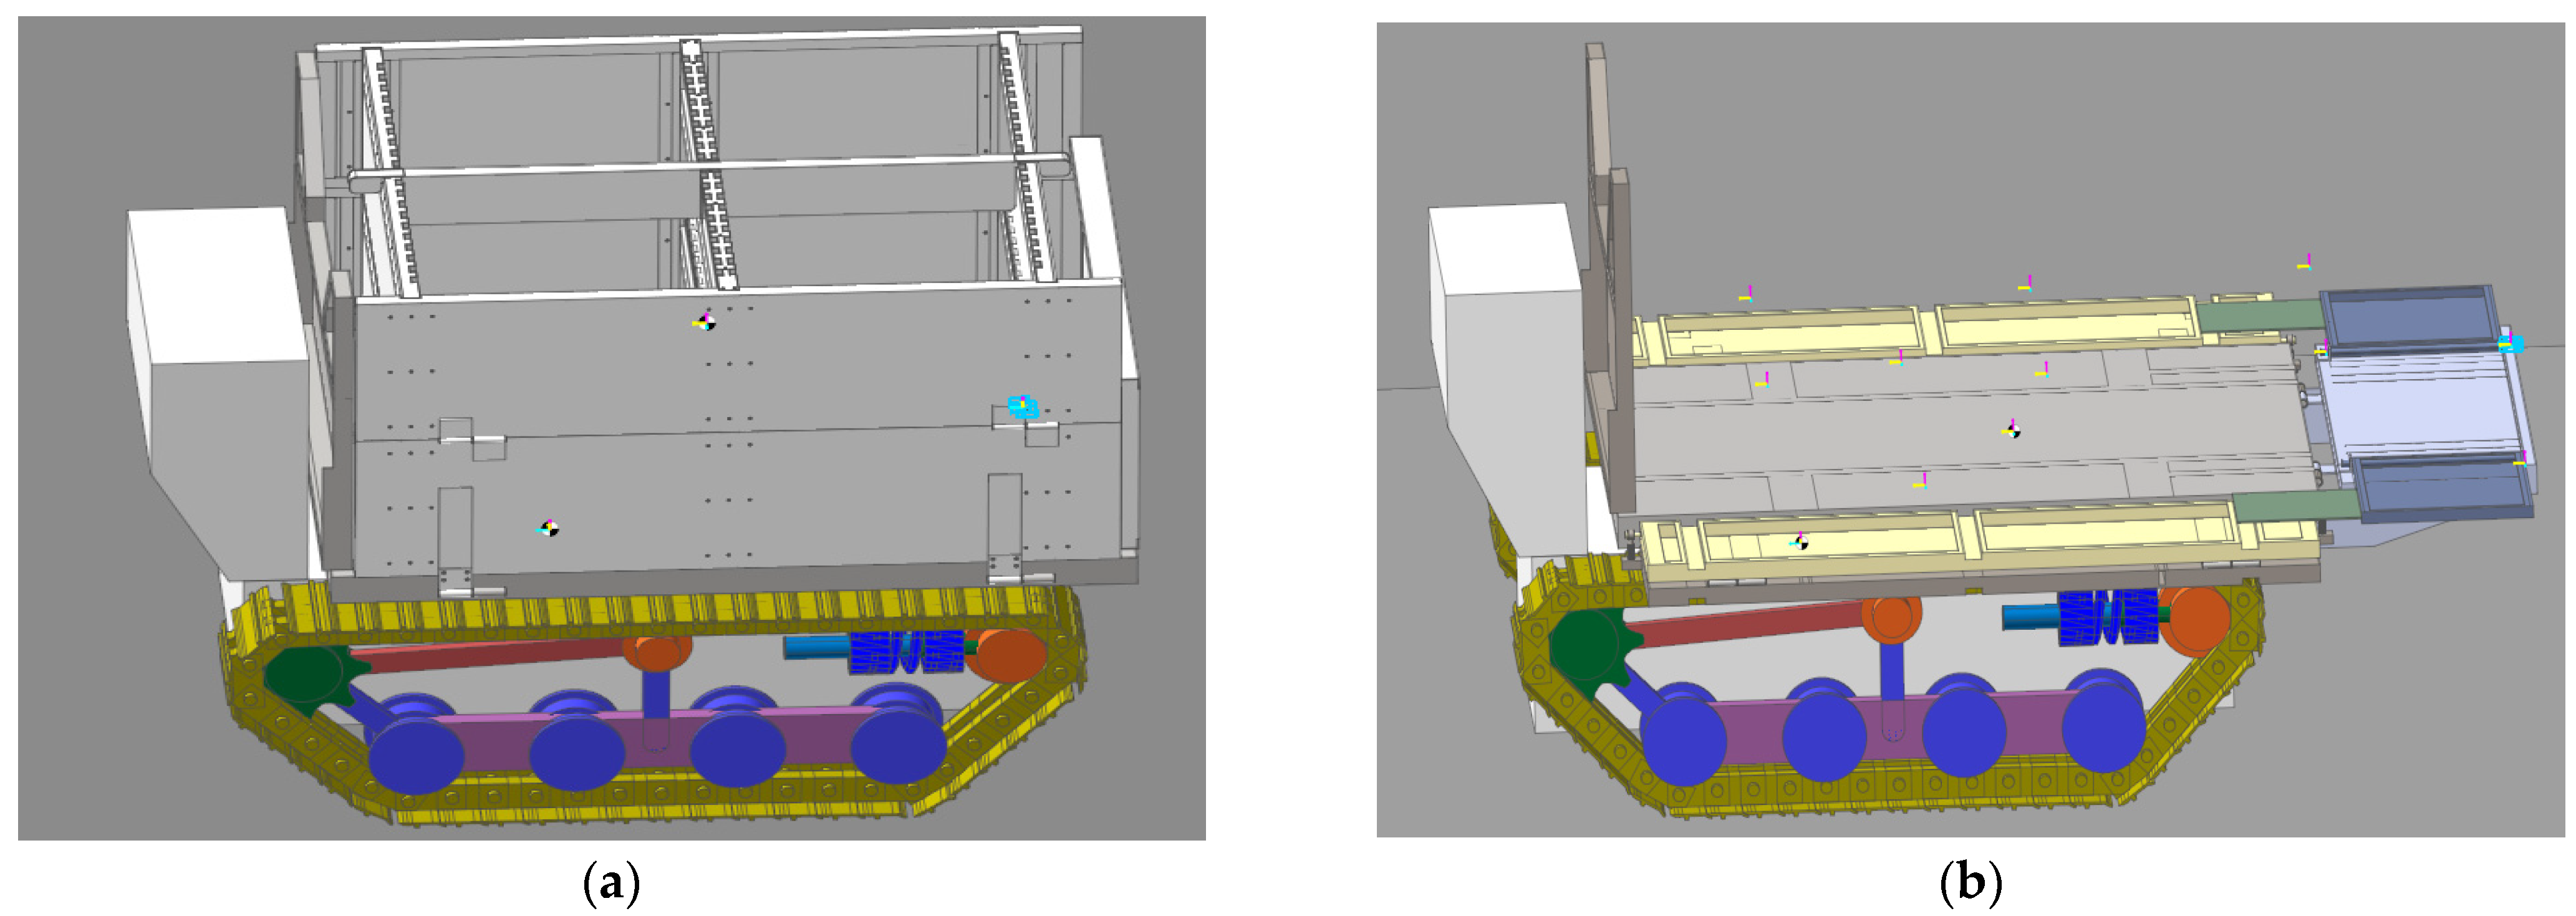
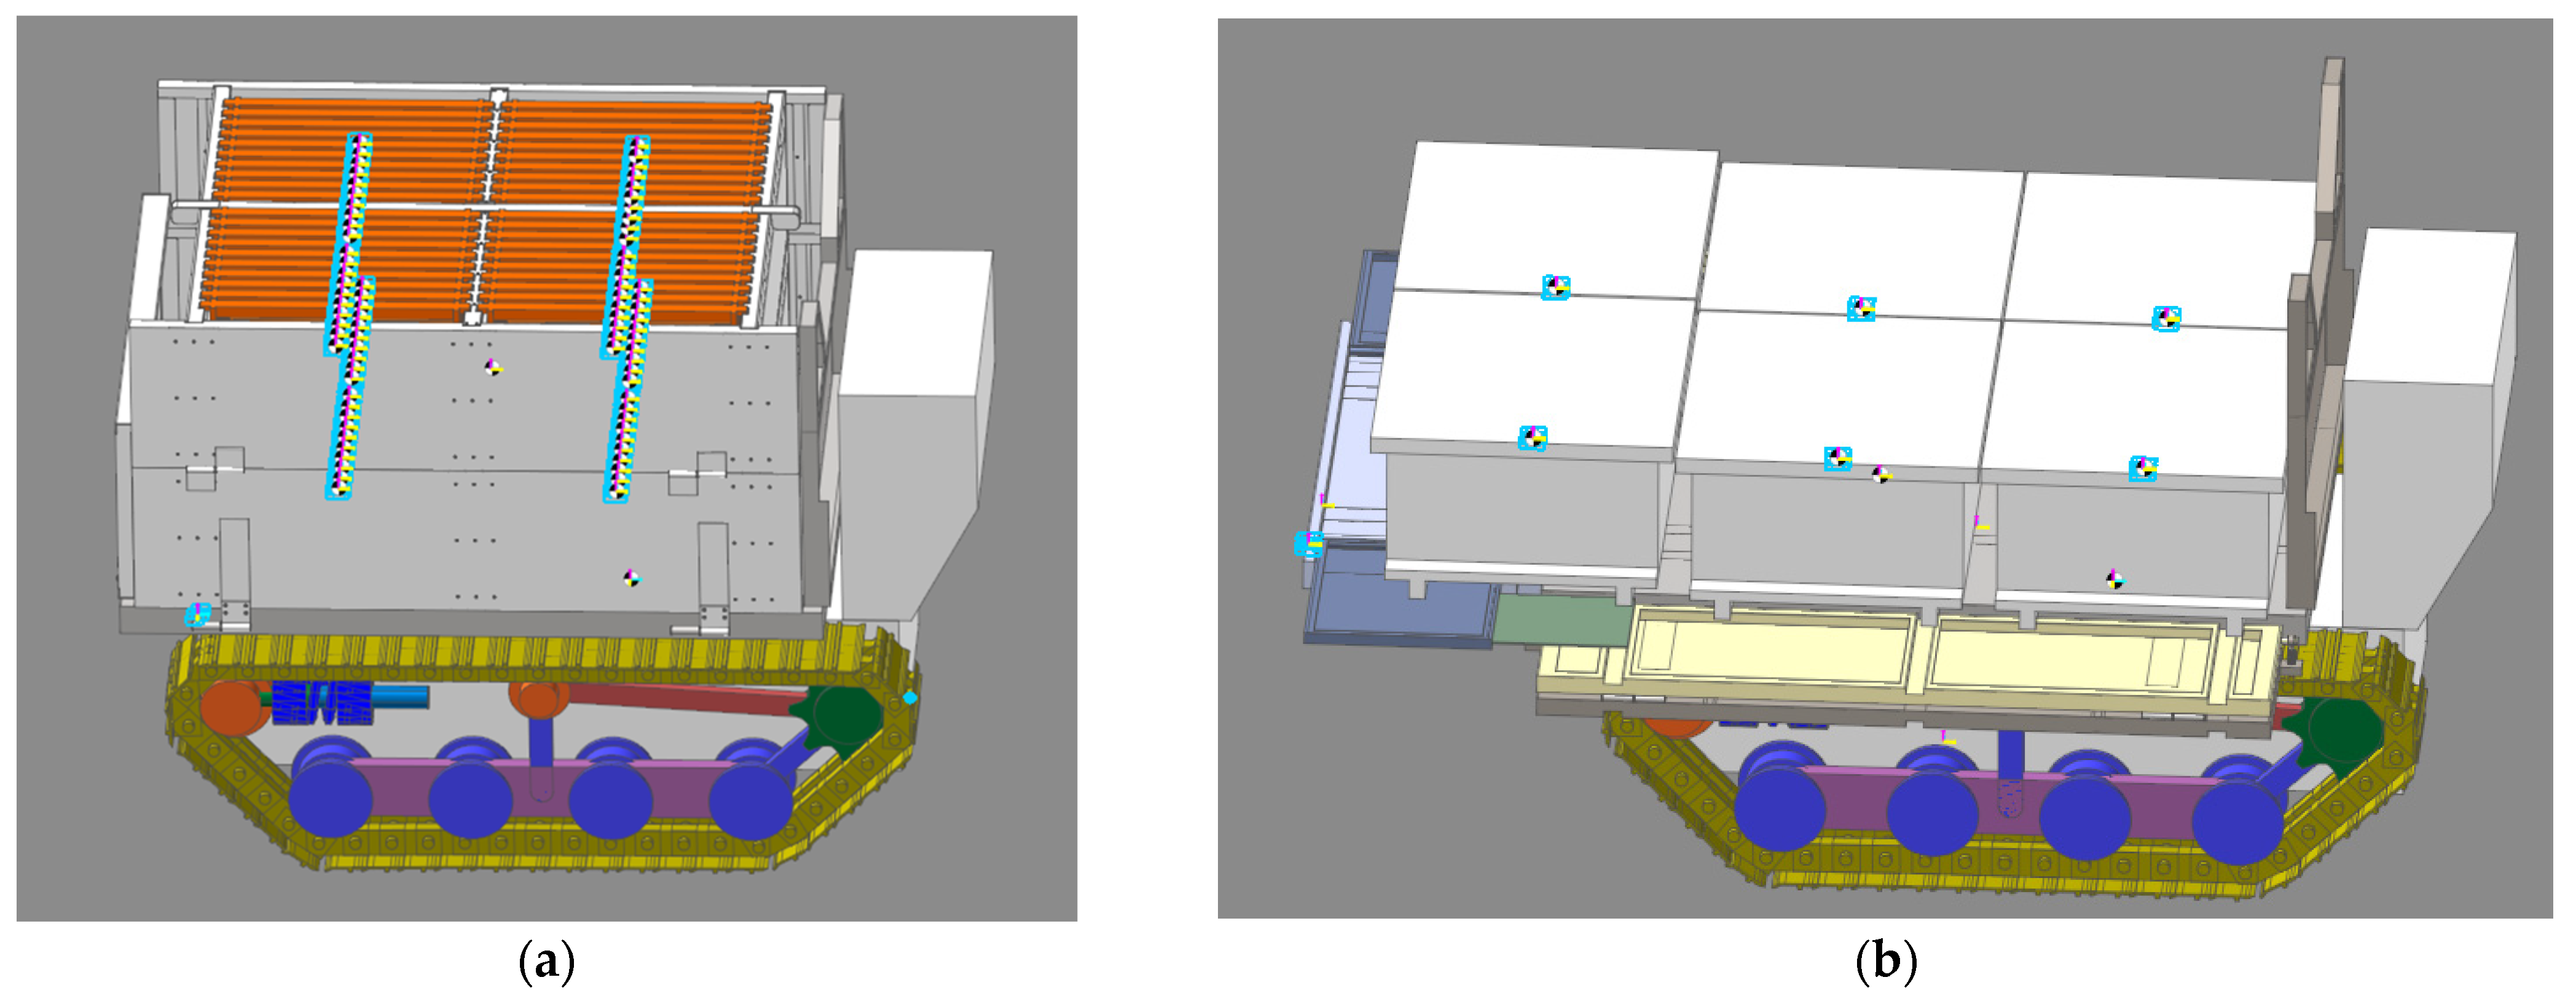
2.2.1. Dynamics Modeling of Multifunctional Tracked Vehicle

Because the maximum travel speed of the LNS-T500 tracked vehicle is 3.2 km/h, the Track_LM (low-speed tracked vehicle) module in RecurDyn was used to design the vehicle track. First, the wheels of the tracked vehicle were measured, and the desired material properties were identified. The tracked part of the LNS-T500 tracked vehicle measured 180 mm in width and was made of rubber, while the other parts of the vehicle were made of steel. The track consisted of seven wheels (sprocket, passive single flange, center flange, and behind flange) and a spring. The sprocket (green) acts as the driving wheel; the passive wheel is a single flange (blue wheel) used to support the entire track structure; the center flange (orange) is used to support the upper side of the track, and the rear flange–spring combination provides tension and support to the rear side of the track. The shape and size of the wheel structure were derived from actual vehicle measurements. Figure 3a shows the model of the track section.
The tracked vehicle’s preload was set by pushing the guide wheel to tighten the track chain before running the track. The preload is the force exerted on the track’s tensioning device, and the proper preload significantly impacts the track walking device’s running performance. The weight of this vehicle was approximately 650 kg, but the tracked part was made of one piece of rubber. After several tests, the track’s preload force in the actual vehicle’s running state was 5 KN. Figure 3b shows the properties for setting the tension force.
The loading box and the vehicle’s main body were designed using SolidWorks. These parts were imported into RecurDyn, folded, and treated as one part called the mother body. Then, the mother body and tracks were assembled in a fixed relationship by using Recurdyn. The model of the tracked vehicle created in RecurDyn is shown in Figure 4, where Figure 4a shows the tracked transporter when the loading box is in the folded condition for loading bee frames, and Figure 4b shows the tracked transporter when the loading boxes are unfolded for loading beehives.

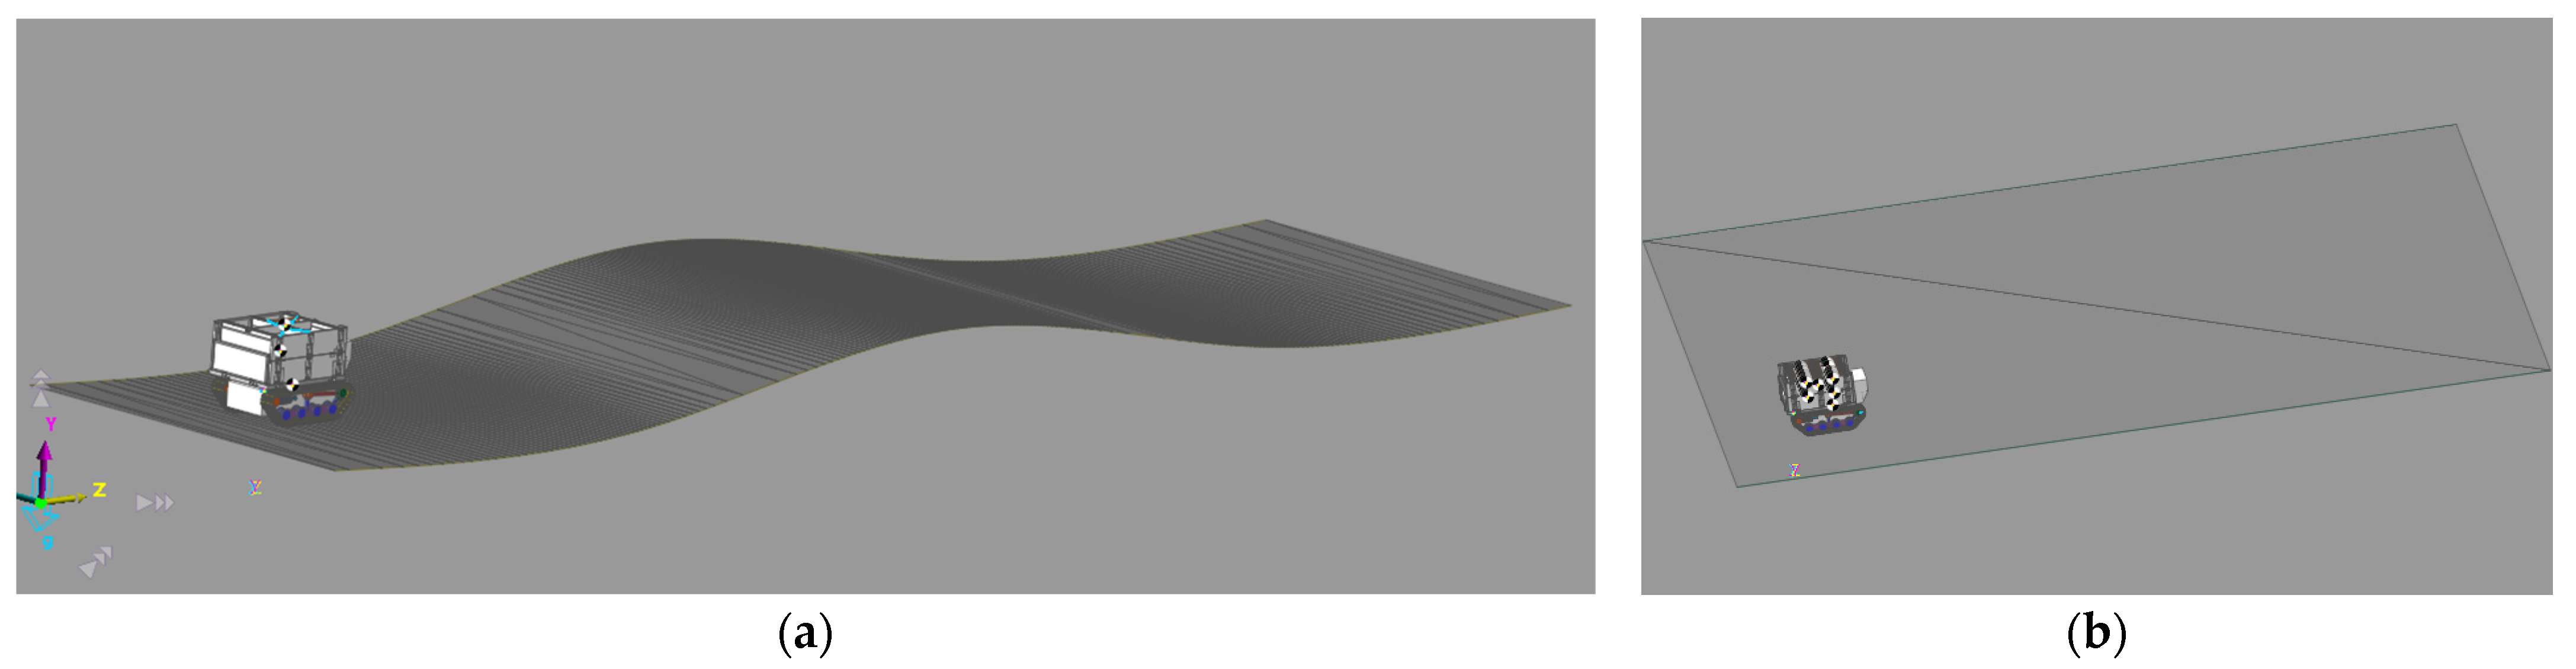
2.2.2. Dynamics Analysis of Multifunctional Tracked Vehicle

At the start of the simulation analysis, it is important first to define the experimental object. In the actual beekeeping process, several aspects must be considered when the tracked vehicle is transporting bee frames. First, one must consider whether the shaking of bee frames in the loading box during the transportation is excessive. Then, the stability of the transport vehicle in the two transport processes, from the transport vehicle in the two transport processes (bee frames loading and beehives loading) of the pitch direction angle change to determine whether the transport vehicle in the transport of the head tilt caused by the rollover phenomenon. In terms of transportation, the test can be divided into two phases: bee frame loading and beehive loading. When the bee frames were loaded, each bee frame had five contact relationships, as shown in Figure 5a (three contact relationships with the central removal plate and two contact relationships with the front removal plate). To facilitate the loading of 80 bee frames, 472 contact points must be designed between the bee frames and panels. The bee frame loading situation was divided into two types to improve calculation efficiency. In the first type, the loading of a single bee frame was considered, and this type was used to specifically analyze the vibration of bee frames in the loading box. In the second type, all bee frames were loaded, and this type was used to analyze the vibration of the tracked vehicle. In this case, the vibration of the bee frames was ignored. Based on this usage classification, the experiment can be divided into three components: single bee frame loading, full loading with bee frames, and full loading with beehives. Figure 5b–d show the dynamics models of these three experimental cases.
Actual field surveys indicated that most mobile and fixed Korean apiaries were located on flat lands to facilitate easy hive arrangement and use of various tools and wheelbarrows. It is more appropriate to set up apiaries in areas with a slope of 15° (with an angle of change of approximately 8°) or less. Therefore, we conducted experiments on two types of terrain [17]. The first test was conducted on sloped terrain to determine vehicle stability on a sloped surface. The second test was conducted on flat ground to investigate the stability of the loading box in straight and turning motions. To this end, the vehicle was operated on an S-shaped route to solve for straight running and turning simultaneously. Figure 6 shows the two surface models in RecurDyn.
The soil properties of apiaries in Korea might differ from one another depending on their geographical locations. The sliding and sinking of crawlers vary in different soil conditions. To determine whether the tracked vehicle can traverse each geological condition, tests must be conducted in various ground conditions [18,19]. The transport simulation experiment was conducted under three different soil conditions (clayey soil, dry sand, and upland sandy loam), representing the most common soil types in Korean apiaries. Table 1 summarizes the properties of each of these soil types.
The algorithm for determining the contact relationship between the tracked vehicle and soft ground in RecurDyn uses the sink-pressure formula proposed by Bekker [20].
P = K φ + K c / b z n
where P is the ground pressure ( Pa ), z is the sinkage depth ( m ), K φ is the internal friction angle ( N · m n + 2 ), b is the track plate width ( m ), K c is the soil material coefficient ( N · m n + 2 ), and n is the deformation index.

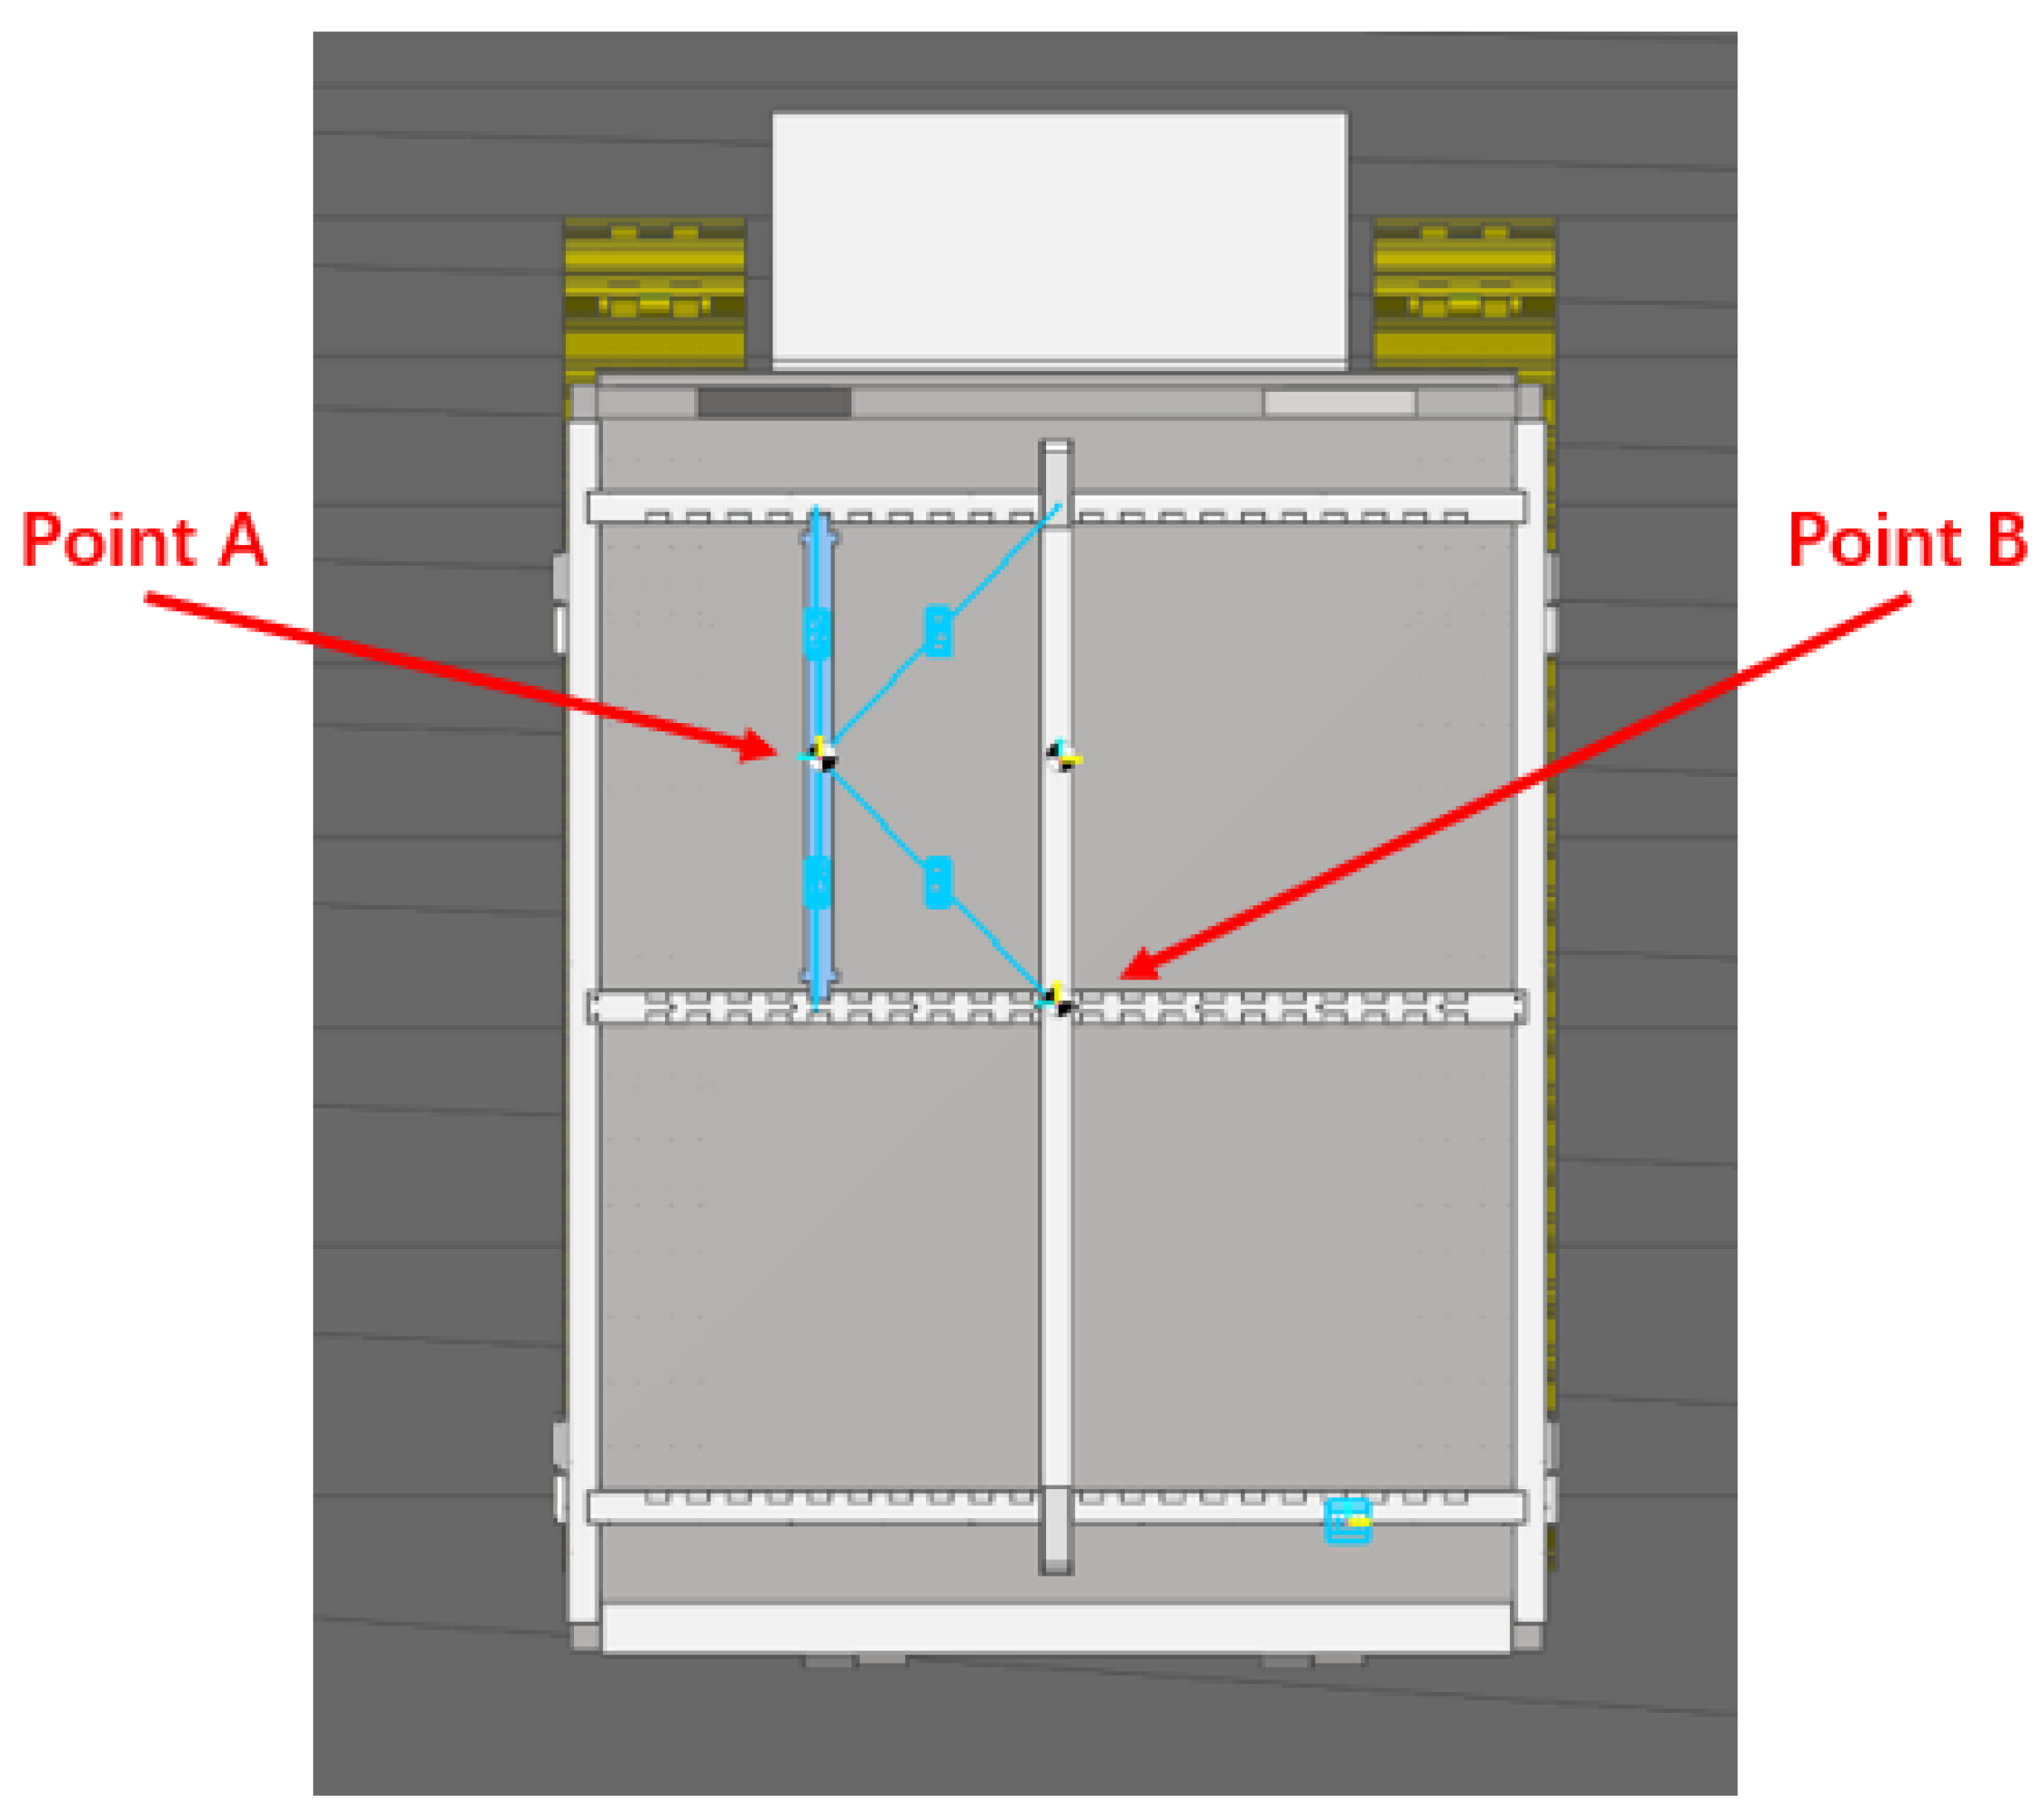
2.2.3. Analysis Details Related to the Loading of a Single Bee Frame

To conduct vibration analysis of a bee frame, one bee frame was placed in a loading box made of stainless steel with a slot spacing of 485 mm. The bee frame was made of wood, and its length was 480 mm, loaded with a margin of 2.5 mm on each side of the dismantling panels in the loading box. As the tracked vehicle moves, the bee frame will shake inside the loading box and come into contact with the grooved surface. Owing to material limitations in RecurDyn, the stiffness coefficient was used as a contact parameter for the wood–iron contact surface, while the elasticity coefficient was empirically set to approximately one-thousandth of the stiffness coefficient. Table 2 shows the stiffness contact coefficients of different materials in RecurDyn.
Vibrations of the bee frame inside the loading box were calculated using the relative coordinate difference. The difference between the center of mass of the bee frame A and the center of mass of the loading box B was used as the basis of calculation in the simulation. The change in center of mass displacement on each axis was used to represent the oscillation of the bee frame in the loading box. Figure 7 shows the bee frame when it is loaded in the loading box.
The D function was used to calculate the relative coordinates, where D X , D Y , and D Z denote the differences in the coordinates along the X, Y, and Z directions, respectively. Let us consider direction D X as an example. Equation (2) is the general relative coordinate calculation formula in the simulation. According to this equation, any change in A . C M and B . C M in the X-direction can be considered relative to C . C M .
D X A . C M , B . C M , C . C M
where A . C M and B . C M denote the centers of mass of objects A and B, respectively, and C . C M denotes the reference coordinate system for the change in center of mass.

2.2.4. Analysis Details of Box Fully Loaded with Bee Frames and Fully Loaded with Beehives

Considering the complexity and duration of analysis, the vibration of the bee frame inside the hive was analyzed by conducting a single-frame experiment. Vehicle safety performance was determined by analyzing its stability when fully loaded with bee frames. Figure 8a shows the vehicle dynamics model when the vehicle is fully loaded with bee frames. Meanwhile, Figure 8b shows the vehicle dynamics model when the vehicle is fully loaded with beehives. In actual application, it is necessary to secure the beehives by using fastening ropes to ensure they are not dropped during operation. However, fixation relationships were used instead of fastening ropes in the dynamics analysis. Experiments were conducted considering different terrains and soil conditions to determine the stability of the transporter during movement.

2.2.5. Design of Runtime Functions

The experiment was conducted under two conditions, namely flat terrain (vehicle was operated on an s-shaped path), terrain with an upward slope and downward slope (vehicle was operated on a straight path). The maximum speed of the tracked vehicle was 3.2 km/h. The vehicle travel depended on the rotation of the track plate, which was driven by the sprocket wheel. The angular velocity of the sprocket wheel was calculated to be 9.476 rad/s based on its circumference. Meanwhile, the turning motions of the vehicle were found to be affected by the speed difference between the tracks, and for this experiment, the vehicle speed was set to half of the top speed during turning. Equation (3) was applied to each driven wheel as a step function [23,24] to simulate vehicle movement.
S T E P   t , t 0 , h 0 , t 1 , h 1
w h e n   t t 0   ,   S T E P = h 0 w h e n   t 0 < t < t 1   ,     S T E P = h 0 + h 1 h 0 x x 0 x 1 x 0 4 3 2 x x 0 x 1 x 0 w h e n   t t 1   ,     S T E P = h 1
where t denotes a changing independent variable, t 0 is the initial value of the independent variable ( s ), t 1 is the terminal value of the independent variable ( s ), h 0 is the initial value of the dependent variable ( mm ), and h 1 is the terminal value of the dependent variable ( mm ).
Figure 9 depicts the angular velocity of the sprocket in each condition. In the s-turn condition, 0–2 s represented free fall, 2–5 s represented uniform acceleration, 16.9–18.9 s represented consistent motion, 7–16.9 s represented rotation, and 30.8–33.8 s represented consistent deceleration until stop. In the 8° slope condition, the stage of uniform acceleration was 2–5 s, and the entire process remained uniform; the stage of constant deceleration was 22–24 s.

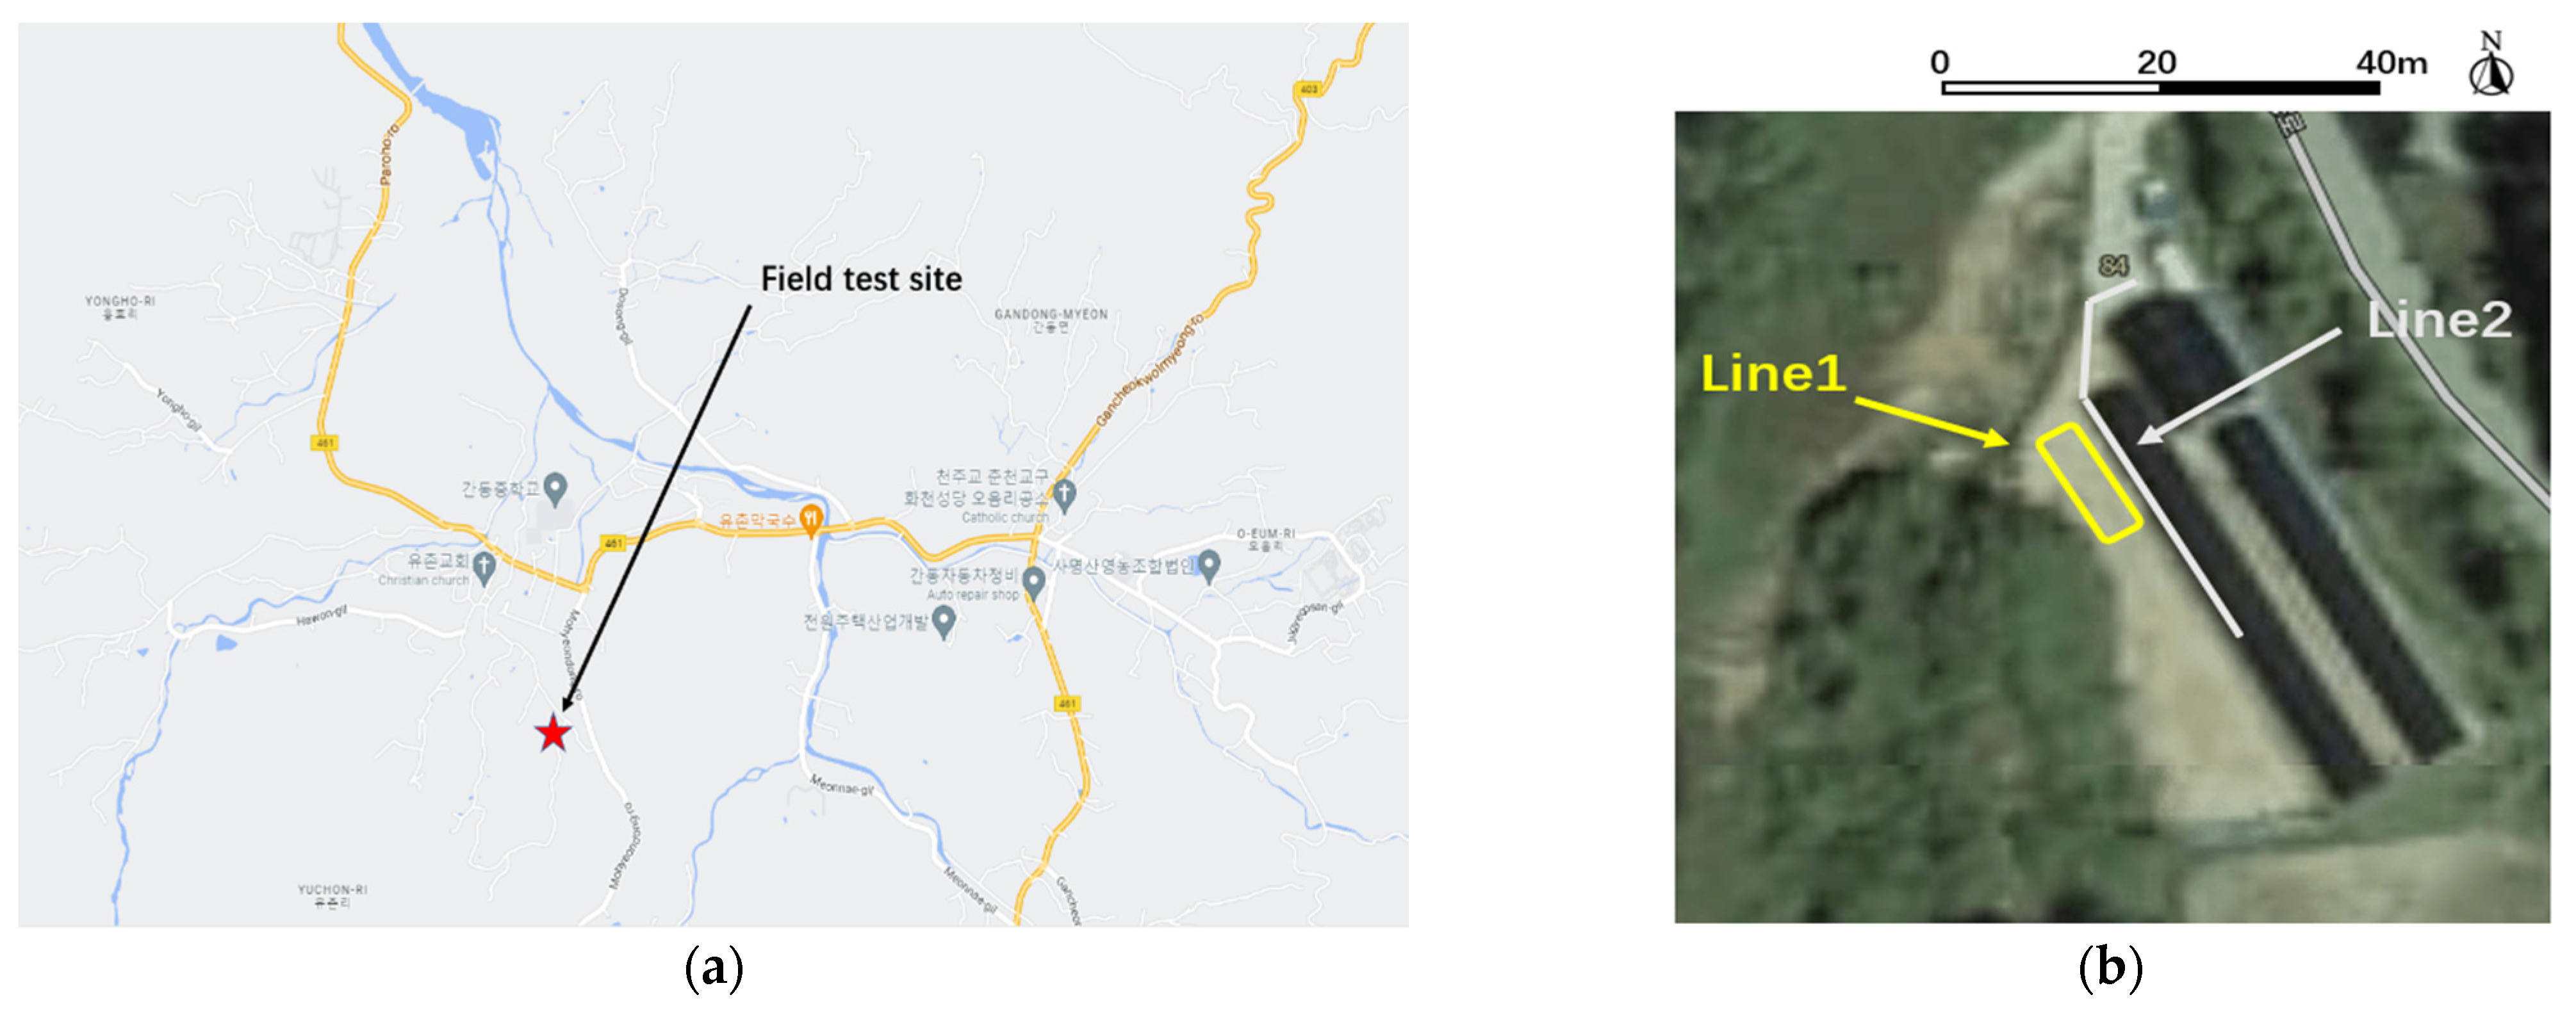
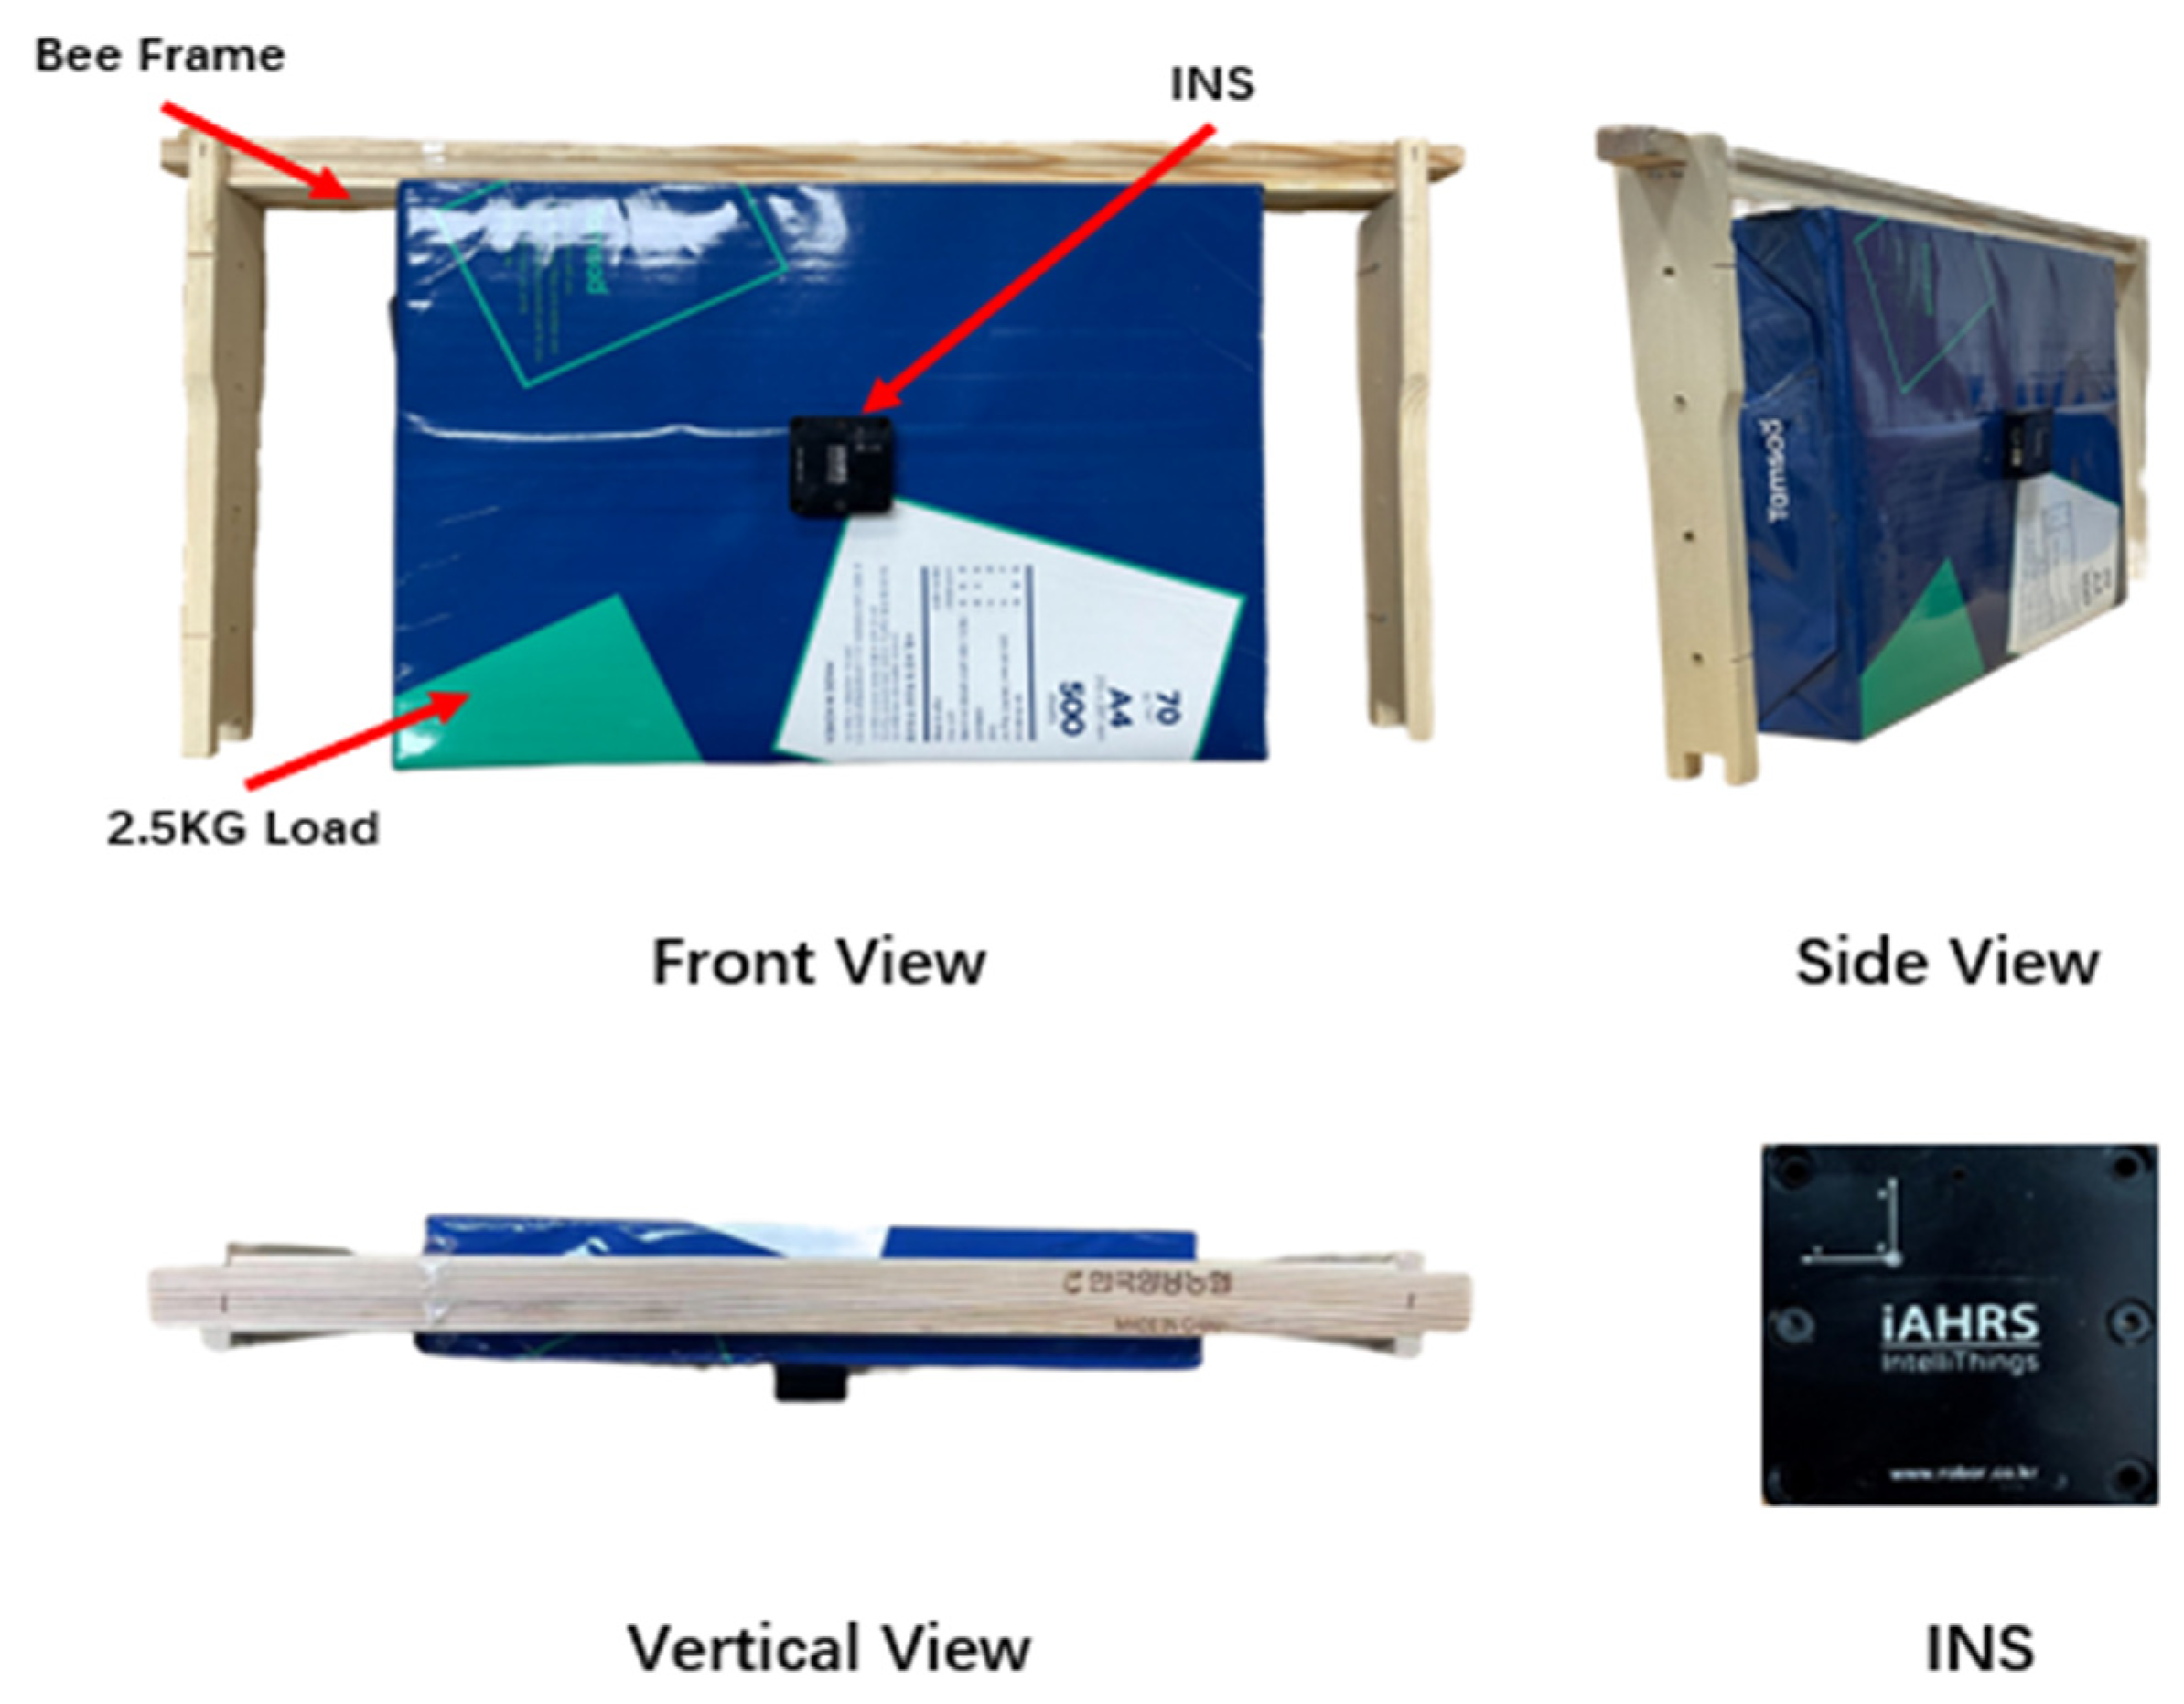
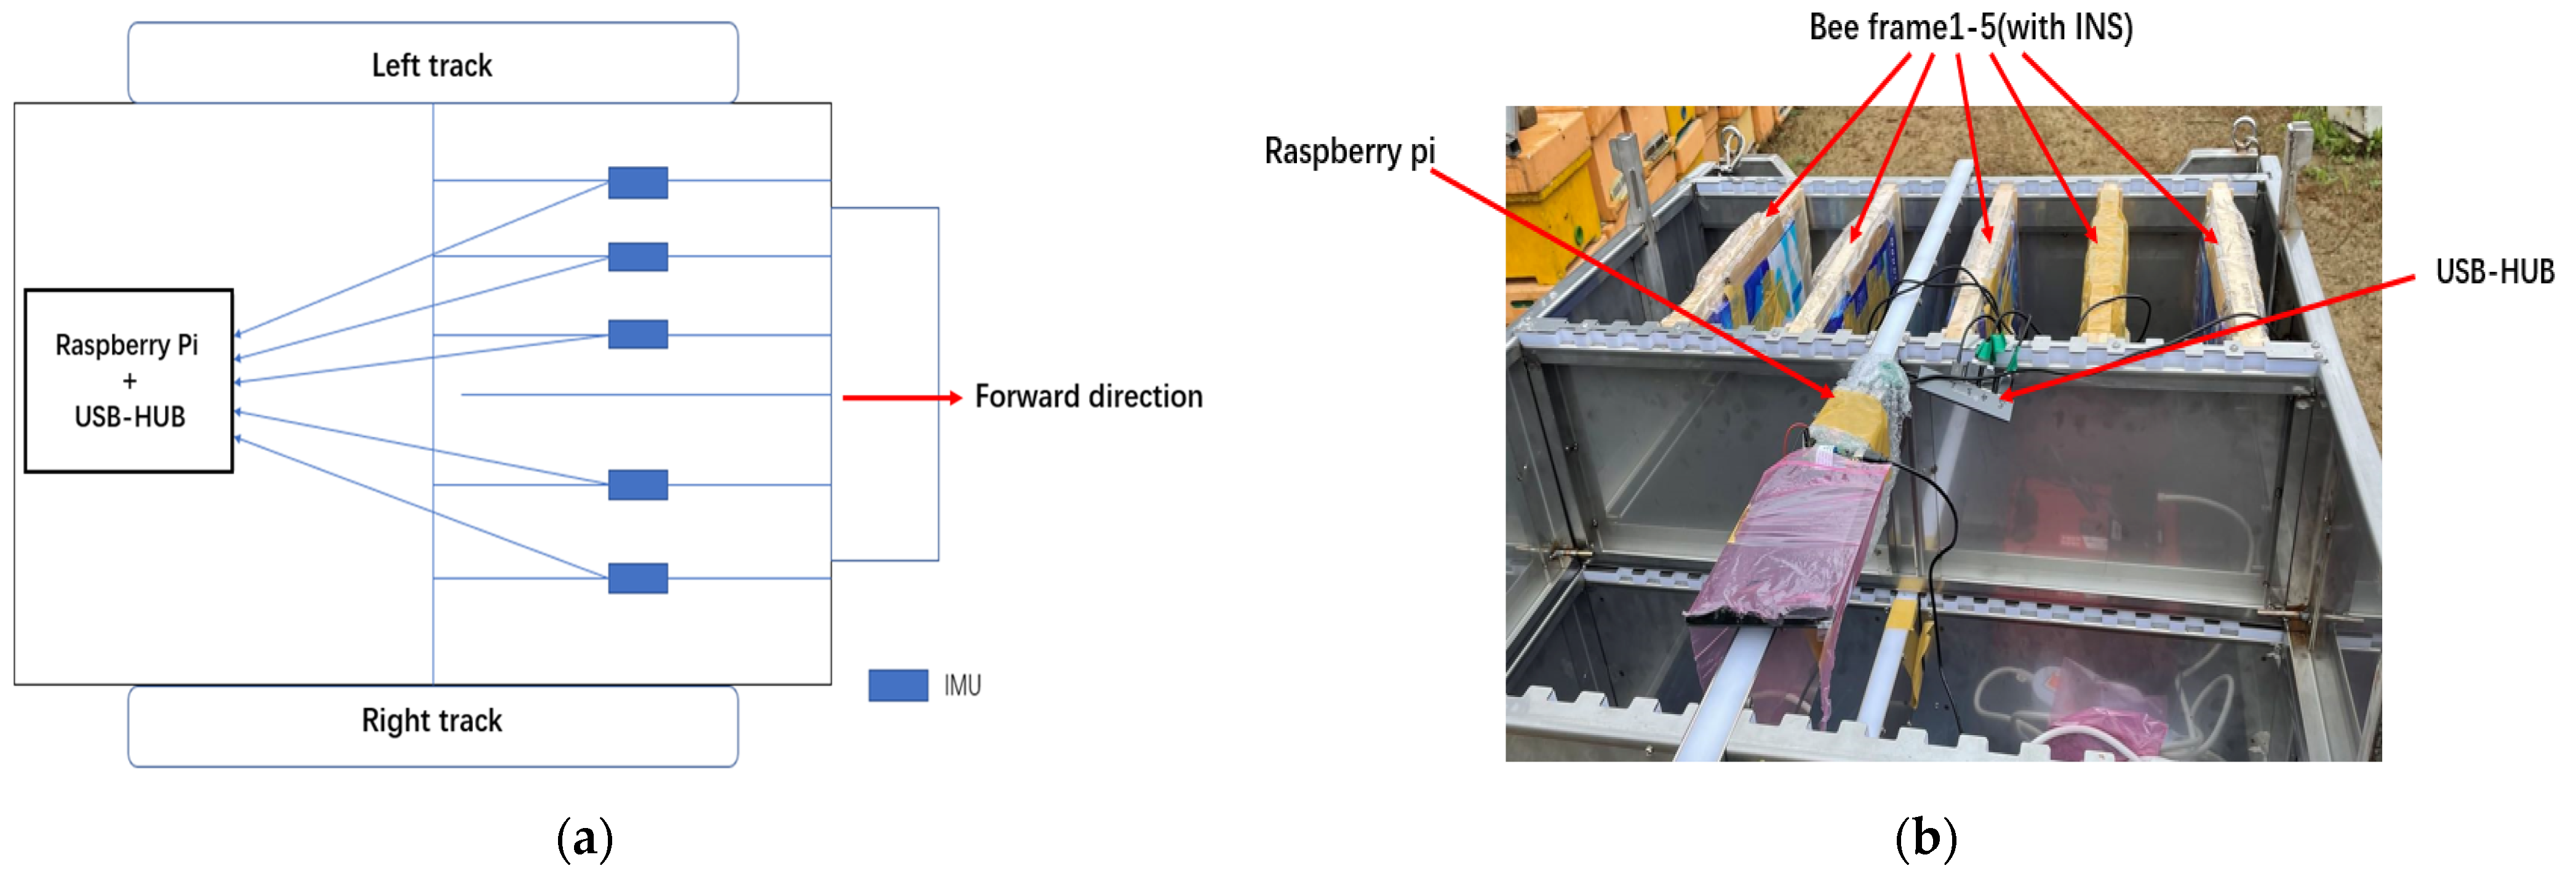
2.3. Field Test Design and Validation of Multifunctional Tracked Vehicle

To determine the operational feasibility of the tracked vehicle in an apiary and verify the experimental results of the dynamics analysis, an apiary in Hwacheon-gun in the Chuncheon region of Korea (Latitude 38.046126°N, Longitude 127.795118°W in the WGS-84 coordinate system) was selected for the field test. Figure 10 shows the two test lines in the field test. The field test was conducted in two parts to test the vehicle’s stability when turning (Figure 10 Line 1) and traversing sloped terrain (Figure 10 Line 2). Line 1 represents a U-turn on a flat road surface, and the movement path comprises a straight path and a curved path. Line 2 is the route from the beehive to the honey shaker. The speed is set to the full vehicle speed of 3.2 km/h, and the terrain of the U-turn path consists of sand, soil, and concrete. The first half of the route contains sand and soil, while the second half contains concrete. Because the test site was located in the field, a three-part field test was conducted simultaneously: single bee frame loading, full bee frame loading, and full beehive loading. The results were compared with those of the simulated analysis.
In the single frame experiment, the original frame was modified to simulate the actual loading conditions. The mass of a single bee frame fully loaded with honey was approximately 2.5 kg [14], and the mass of the empty bee frame was approximately 0.8 kg. Instead of using actual honey, the frames were modified with a pack of paper (1.7 kg) to simulate the weight of fully loaded honey. The weight of a paper pack used to simulate a honey-filled bee frame was slightly more than 2.5 kg. As a result, some of the paper was removed until the total weight of the structure was precisely 2.5 kg. The paper and bee frame were tightly wrapped with tape, so there was almost no distortion. Five bee frames were modified for the experiment to ensure that the data were sufficient and not disturbed by external factors. Figure 11 shows the bee frames modified with the Inertial Navigation System (iAHRS-RB-SDA-v1, ROBOR, Korea) to simulate a full load of honey.
To compute the vibration of the bee frame inside the loading box during the operation of the tracked vehicle, time, pitch, yaw, and roll angle data were collected in this experiment. The data collection rate was 20 Hz. Table 3 lists the specifications of iAHRS-RB-SDA-v1.
In the field test, five modified bee frames were placed on the upper front part of the loading box. A Raspberry Pi module (version 4, Raspberry Pi Foundation, Cambridge, UK) was fixed to the top center of the loading box using tape. The INS units mounted on the five modified bee frames were connected to a USB-HUB for data collection. Figure 12a shows a conceptual diagram of the experimental equipment, and Figure 12b shows the actual experimental setup.
There was no space for INS when the box was fully loaded with bee frames. To ensure that the experiment proceeded smoothly, one bee frame each was removed from the upper left and right sides, and a total of 78 bee frames were loaded. The INS was fixed inside the loading box to measure the vibration level of the bee frames during the operation of the tracked vehicle. In the experiments where the box was fully loaded with beehives, the INS was fixed to the bottom plate of the loading box, and the beehives were fixed to the loading box using fixing straps. Figure 13a,b show the experimental setups when the loading box is fully loaded with bee frames and beehives, respectively.

2.4. Stability Analysis Criterion and Experimental Design

2.4.1. Single Bee Frame Transportation Analysis

When the loading box was loaded with a single bee frame, owing to the special structure of the loading box, the bee frame almost always vibrated in the roll direction. Stability analysis was performed considering two main aspects of verification, namely whether dropping occurs inside the loading box during transportation and whether the damage is incurred inside the loading box during transportation. The extent of damage was compared by comparing the speed of the bee frame during actual operation with that of the honey picker during the actual operation. The extent of damage to the bee frame due to the honey picker differs depending on the rotation speed of the latter. According to the relationship between honey picker speed and damage to the bee frame proposed by Al-Rajhi et al. [25] in 2014, the maximum value of damage to the bee frame was 4.63%, and the minimum value was 0.81% at 5700–21980 mm/s. The relationship between the honey picker speed and damage to the bee frame is shown in Figure 14. The honey harvesting efficiency increases with speed because speed increases the amount of honey outflow. The stability of the single bee frame was determined by comparing the frame speed in the roll direction with the honey picker speed under two operating conditions in the simulation and field experiments: up and downslope and s-turn.

2.4.2. Stability Analysis of Fully Loaded Bee Frames and Beehives

The stability analysis was performed under two different load conditions mainly to judge the passability of the tracked vehicle: the loading box fully loaded with bee frames and the loading box fully loaded with beehives. To determine the passability of the vehicle, its center of gravity must be determined for each loading condition. As a result, different maximum passing angles are obtained for each loading condition. The location of the center of gravity of each vehicle is shown in Figure 15.
Given that each ground parameter is different under the uphill and downhill conditions owing to the different types of road surfaces involved, it is impossible to perform calculations precisely. In this study, the center of gravity was used to calculate the maximum uphill limit angle of the vehicle and then compare the result with the maximum pitch angle change of the vehicle during driving to determine vehicle safety [26,27]. The maximum uphill limit angle θ can be calculated using Equation (4). According to the calculation results, the maximum uphill limit angles of the vehicle when transporting bee frames was higher than transporting beehives, which were approximately 40.7° and 34°. Although the center of gravity in beehives transportation was lower than in bee frames transportation, it moved backward. On the soft ground, the different supporting forces of the front and back of the track caused the vehicle to capsize more quickly.
θ = arctan α h
where θ is the maximum uphill limit angle ( ° ), α is the distance between the center of gravity and the last load-bearing wheel center ( mm ), and h is the height of the center of gravity relative to the ground ( mm ).

3. Results

3.1. Simulation Results

3.1.1. Results and Analysis of the Transportation of a Single Bee Frame

Herein, the results of multiple tests involving three geologies and two different advance methods are compared to illustrate vehicle movement in different geologies. The X-direction represents the left-right change direction, also called the roll direction. The Y-direction is perpendicular to the ground, while the Z-direction represents the front-to-back change direction, also called the pitch direction.
First, displacement variation of the bee frame centroid in the XYZ directions under the condition of 8° upslope and downslope is shown in Figure 16. The figure shows that under the three soil conditions, the bee frame is the most stable along the Z-direction in clayey Soil, followed by dry sand, and upland sandy loam. The variations in the X- and Y-directions are between ±0.1 mm, and there are no significant differences. Throughout operation under the conditions of 8° upslope and downslope, the centroid of the bee frame had the most extensive range of variation in the Z-direction (−1.573–0.490 mm), followed by the X-direction (−0.060–0.066 mm), and the Y-direction (−0.0059–0.0700 mm). The trend of the Z-direction changed in the negative direction first and then in the positive direction. When the tracked vehicle first traveled uphill and then downhill, under the action of inertia, the bee frame first moved toward the negative Z-axis direction and then converged to 0. The variation range (−1.573–0.490 mm) was less than the size between the space of the bee frame placement and the length of the bee frame in the loading box (−2.5–2.5 mm). In the simulation, variation of the bee frame centroid displacement in the X-direction with a variation of less than 0.1 mm in the Y-direction was insufficient to affect the stability of the bee frame during transportation.
In the box diagram of the 8° upslope and downslope, the values of X and Y directions are around 0, which means that vibrations in the left and right and up and down directions were small during the movement of the bee frame, and safety was not a concern. The variation in the Z-axis direction was mainly negative because the vehicle moved backward relative to the direction of the bee frame movement on the upslope and downslope due to gravity, and it moved forward along the direction of movement on the downslope. However, the deviation range between the maximum and the minimum values was 3 mm at most, which did not exceed the free motion range of the bee frame in the loading box. Therefore, the experimental results are consistent with common sense, and the bee frame can be transported stably on the 8° upslope and downslope. The displacement variation of the bee frame centroid under s-turn conditions is presented in Figure 17. In the s-turn transportation process, the free fall process lasts for 0–2 s. Therefore, in the figure, 0–3 s represents a straight line in the forward direction. It is presented that for 0–3 s, almost no change occurs in the bee frame along with the XYZ directions. During 5–15 s in the counterclockwise turning stage, the vibration of the bee frame centroid in the X- and Y-direction increases gradually. The ranges of variation in the X-direction are (−0.73–0.59 mm) in clayey soil, (−2.49–0.88 mm) in dry sand, and (−9.45–10.29 mm) in upland sandy loam. The ranges of variation in the Y-direction are 0–0.28 mm in clayey soil, 0–0.125 mm in dry sand, and 0–2 mm upland sandy loam, followed by convergence at 0. The clockwise turning phase corresponds to 17–29 s, where vibration in the XY direction increases gradually and then tends to 0. During this run, the variation ranges in the X-direction are (−2.95–2.81 mm) in clayey soil, (−0.70–1.38 mm) in dry sand, and (−17.05–18.80 mm) in upland sandy loam; those in the Y-direction are (0–0.4 mm) in clayey soil, (0–0.26 mm) in dry sand, and (0–4.6 mm) in upland sandy loam. In the last phase, from 29 to 32 s, uniform deceleration occurs until the frame stops.
According to Figure 17, there is almost no change in the XY direction when the vehicle is driven in a straight line. When the tracked vehicle is driven along a curved path, vibration occurs from the time when the vehicle enters the corner, and it decreases as the vehicle leaves the corner; the vibration peaks as the vehicle travels through the corner. The ranges of vibration of the first and second amplitude changes are different because the position of the bee frame in the loading box changes after the first turn, and it is different from the initial symmetrical placement, which leads to a greater shake during the second turn. The changes in the Z-direction are different from those in the X- and Y-directions. As the vehicle starts to enter the first turn, the surface contact friction between the bee frame and the loading box changes to linear contact friction due to the generation of oscillation; moreover, the friction force decreases, and the bee frame gradually moves in the direction opposite to the vehicle travel direction because of inertia. During the subsequent straight-line driving phase, the change in the Z-direction shifts somewhat forward with the directional shift of the loading box. Finally, in the uniform deceleration phase, vibration starts to slowly become smaller. The ranges of variation are (−0.70–0.09 mm) in clayey soil, (−0.15–0.26 mm) in dry sand, and (−2.31–0.03 mm) in upland sandy loam. The range of variation was the widest in upland sandy loam, and the maximum value of 2.31 mm did not exceed half of the difference between the length of the loading box and the length of the bee frame by 2.5 mm. Therefore, the simulation results are consistent with the actual results.
In the box plot of the s-curve, the results under clayey soil and dry sand pavement show that the displacement variations in each direction are relatively small, with the most significant variation occurring in the X-direction due to driving along the curve. The greatest variation occurred under the upland sandy loam pavement condition, where the variation in the XYZ directions was several times higher than that under the first two pavement conditions. The reason is that, under the same driving function, the vehicle completes the turn phase simultaneously and starts driving straight under the clayey soil and dry sand conditions. By contrast, under the upland sandy loam condition, the driving trajectory of the vehicle is not the standard s-curve. Compared to those in the clayey soil and dry sand conditions, the angle of turn in the upland sandy loam condition is greater than the expected value of 180°, so stronger vibration is generated.
The velocity variation of the bee frame centroid under the upland sandy loam condition during s-curve driving is shown in Figure 18. Because the range of variation under the upland sandy loam condition during s-curve driving is the greatest among the two driving conditions, the displacement data obtained under the upland sandy loam condition in each direction during s-curve driving is used as the basis to determine the velocity variation of the bee frame in each direction during driving. As can be seen from Figure 18, the range of speed variation in the Y- and Z-directions throughout the driving process is small, where the ranges of speeds in the Y- and Z-directions are (−0.025–0.020 mm/s) and (−0.0058–0.0023 m/s), respectively, and the range of speed fluctuation does not exceed ±0.06 mm/s. The range of speed variation in the X-direction with the greatest change (−0.159–0.180 m/s) does not exceed ±0.2 mm/s. Based on a comparison with the relationship between the speed of the honey picker and the damage to the bee frame in the previous paper [25], it can be seen that the speed variation of the transport vehicle during the transportation is considerably smaller than the range of speed variation of the honey picker (5.7–21.9 m/s). Therefore, damage to the bee frame during the transportation is considerably smaller than the damage due to the use of the honey picker. The transportation vehicle can, therefore, safely transport the bee frames.

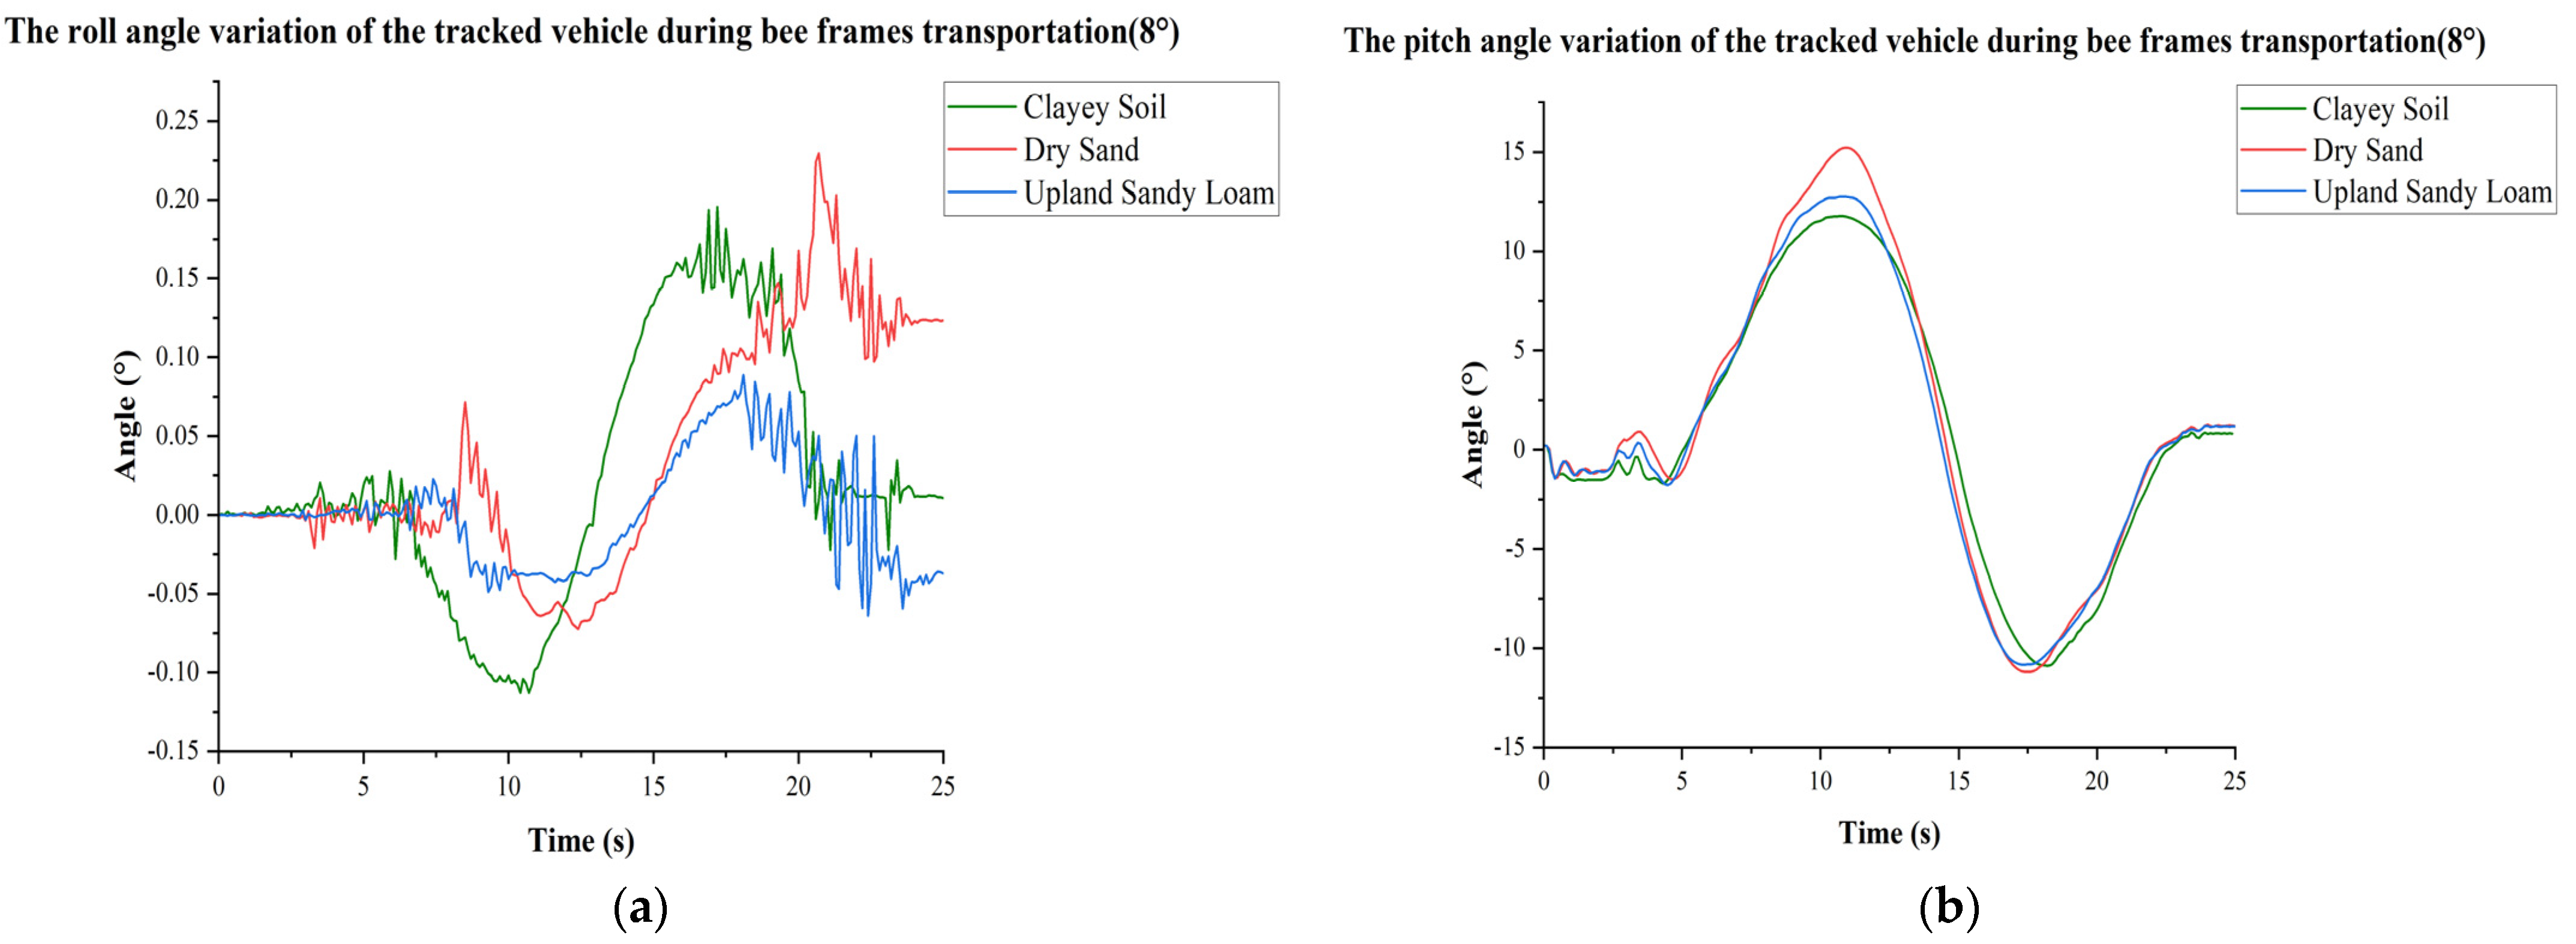
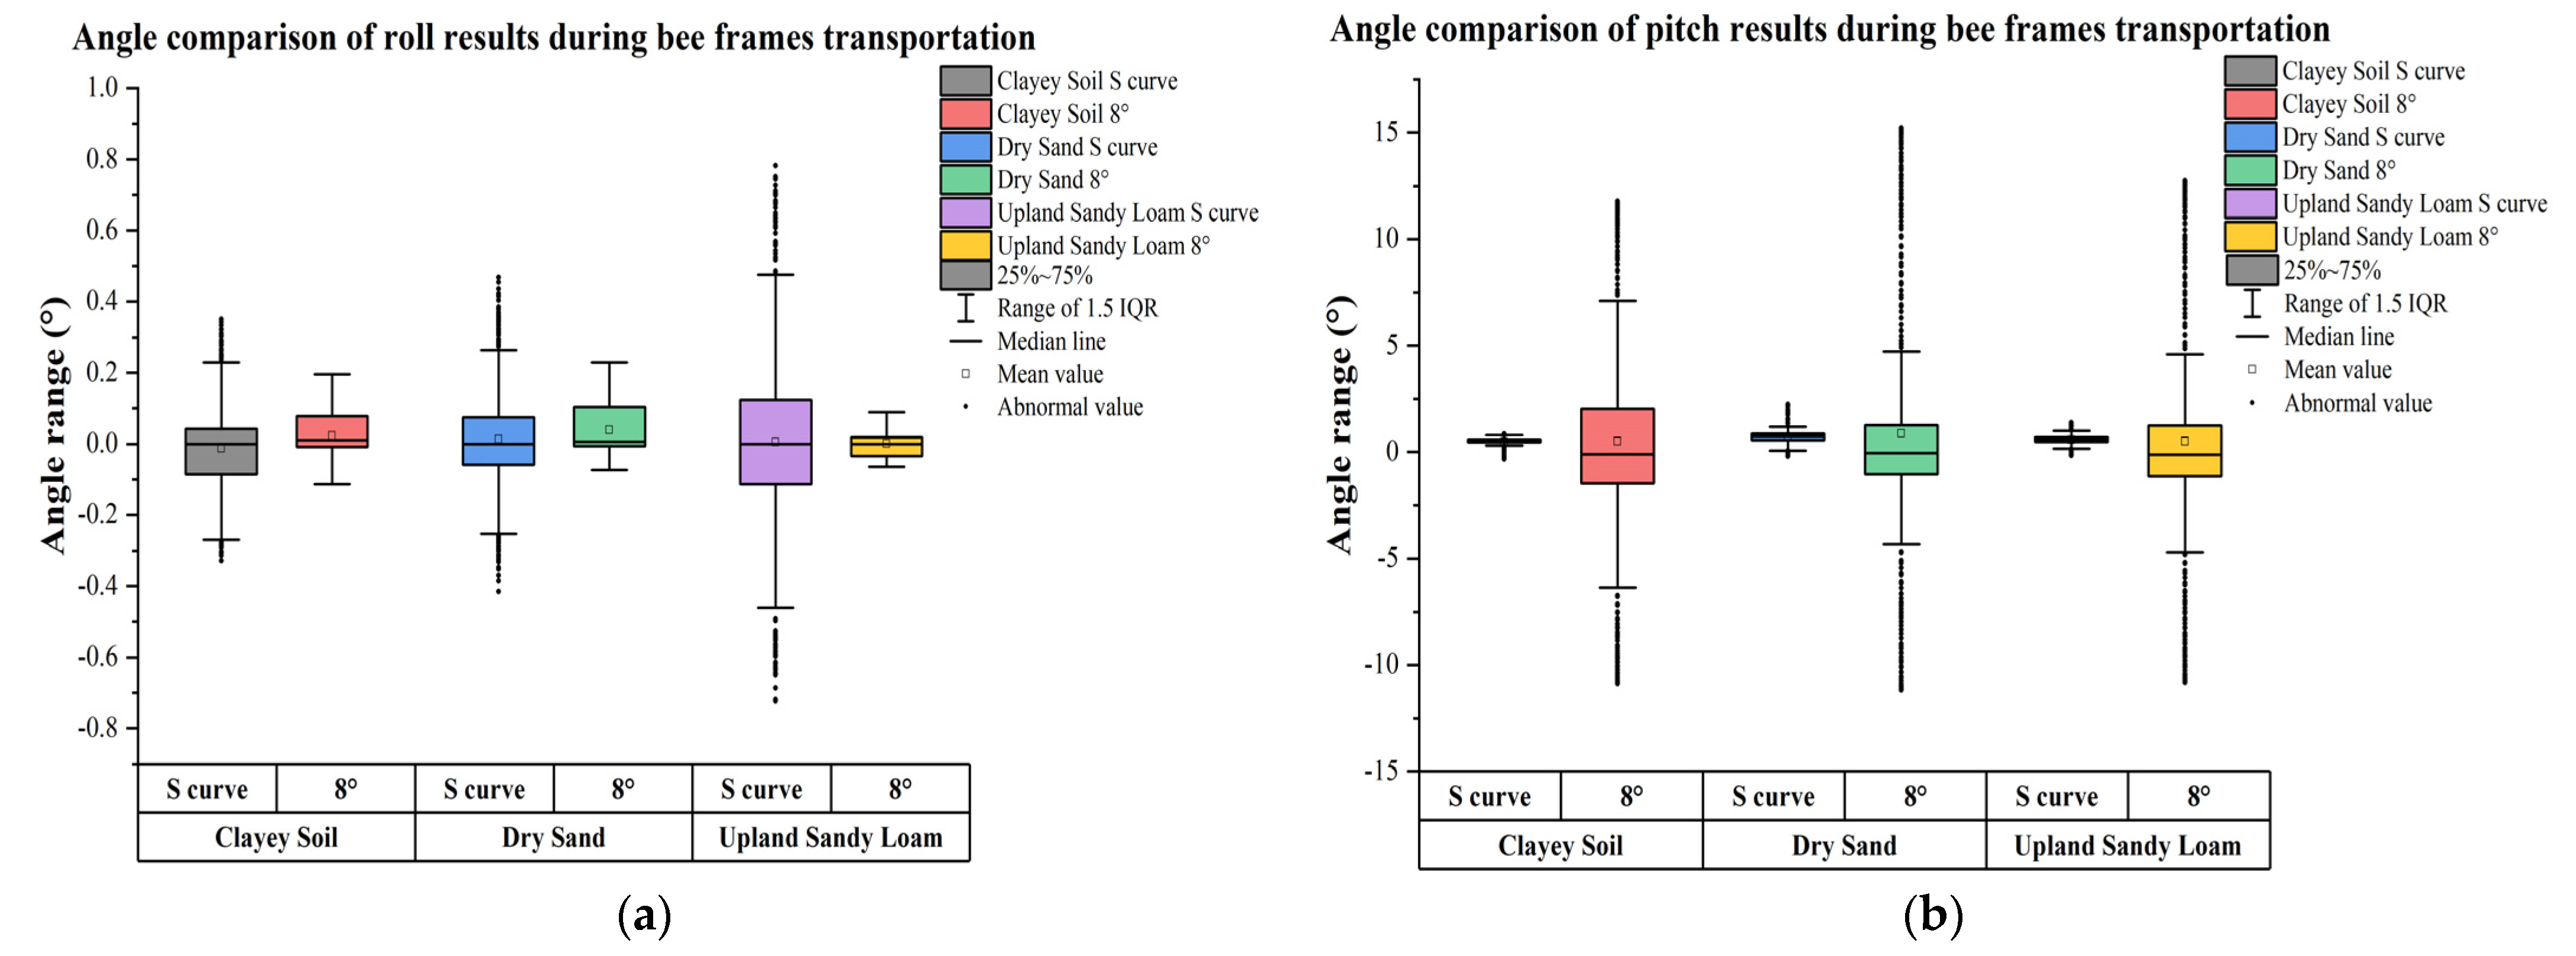
3.1.2. Results and Analysis of the Loading Box Fully Loaded with Bee Frames

When the loading box is fully loaded with bee frames, variations of the roll and pitch values of the vehicle under each road condition on 8° upslope and downslope are shown in Figure 19. In the roll direction, the maximum range of angle change was (−0.15–0.25°). As the vehicle was driven on the 8° upslope, the left and right wheel settings had extremely small errors, and as a result, the vehicle in the process of going up and down the slope in the driving direction of a slight steering. The change in the yaw direction caused a gap in the pressure carried by the left and right wheels, which led to a marginal change (−0.1–0.3°) in the roll direction. However, the angle change was not significant, meaning that the vehicle was stable in the roll direction when traveling uphill. In the pitch direction, the vehicle started in the horizontal position, drove uphill, drove downhill, and finally returned to the horizontal position. The head-up phenomenon occurred to different degrees in the pitch direction under the three different road conditions, with dry sand representing the most severe head-up circumstances during transportation with an angle change of 15.19°, followed by clayey soil and upland sandy loam, which, too, generated considerable head-ups, respectively, with the maximum angles of 11.77° and 12.75°. However, according to the calculation of the maximum uphill limit inclination angle of the transporter, the limit uphill angle of the transporter when fully loaded with bee frames is 40.7°; thus, the condition of safe transportation is satisfied.
Variations in the roll and pitch values of the vehicle under each pavement condition with full loading of bee frames during s-curve driving are shown in Figure 20. In plane driving, because both sides of the track are subjected to different ground pressures, the transport vehicle will oscillate to a certain degree when driving through the two curve sections. The figure can be seen that the roll angle change at the three road conditions in the range of (−1–1°), so the vehicle in the s-turn roll direction stability need not be concerned. The change in the pitch direction shows that, similar to the upslope and downslope driving conditions, the largest pitch change angle of 2.23° occurs under the dry sand condition. The next largest change was recorded in upland sandy loam, with a maximum value of 1.38°. The smallest variation was recorded in clayey soil, with a maximum value of 0.84°. According to the figure, the pitch angle reaches the maximum value of 2.24° when the vehicle first starts on the three types of road surfaces, while the pitch angle of the vehicle gradually returns to normal after the vehicle enters the uniform straight-line driving section. The rate of change of the pitch angle during turning is higher than that when the vehicle moves along a straight line, which is consistent with reality. The maximum pitch angle of the vehicle during driving on the horizontal ground is 2.24°, which is considerably smaller than the maximum uphill limit angle of 40.7°. It means that the vehicle can be driven stably and normally on a horizontal road.
A box plot of the variations in the roll and pitch values of the vehicle under each road condition when the loading box is fully loaded with bee frames is shown in Figure 21. It can be seen that the trend of roll direction change is significantly correlated to road conditions, terrain conditions, and other factors, and the range of angle change is within (−0.8–0.8°). It can be seen in the graph of change in pitch value that on the horizontal road and 8° upslope and downslope driving conditions, the values of the three in the road conditions (clayey soil, dry sand, upland sandy loam) do not exceed 15°, which is considerably lower than the maximum uphill limit angle. Therefore, under the two transportation conditions and three road surface conditions, the tracked vehicles can travel safely when its loading box is fully loaded with bee frames. Dry sand has the largest pitch limit angle among the three road conditions, while clayey soil and upland sandy loam have similar maximum angles. The possible reason is that the bearing capacity of the road sand under the dry sand condition is weak during the driving process. The different pitch angles were caused by the load-bearing capabilities of the road conditions. When the leaning front part of the track touches the ground, the rear part of the track easily falls into the dry sand because of the poor ground support capacity of dry sand. For this reason, a large pressure difference is generated between the front and rear, and the vehicle’s head tilts more severely during the driving process. Under the clayey soil and upland sandy loam conditions, although this phenomenon of pressure difference exists, the load-bearing capacities of these soils are superior to that of dry sand, and for this reason, the head-up phenomenon is relatively mild compared to that in dry sand.

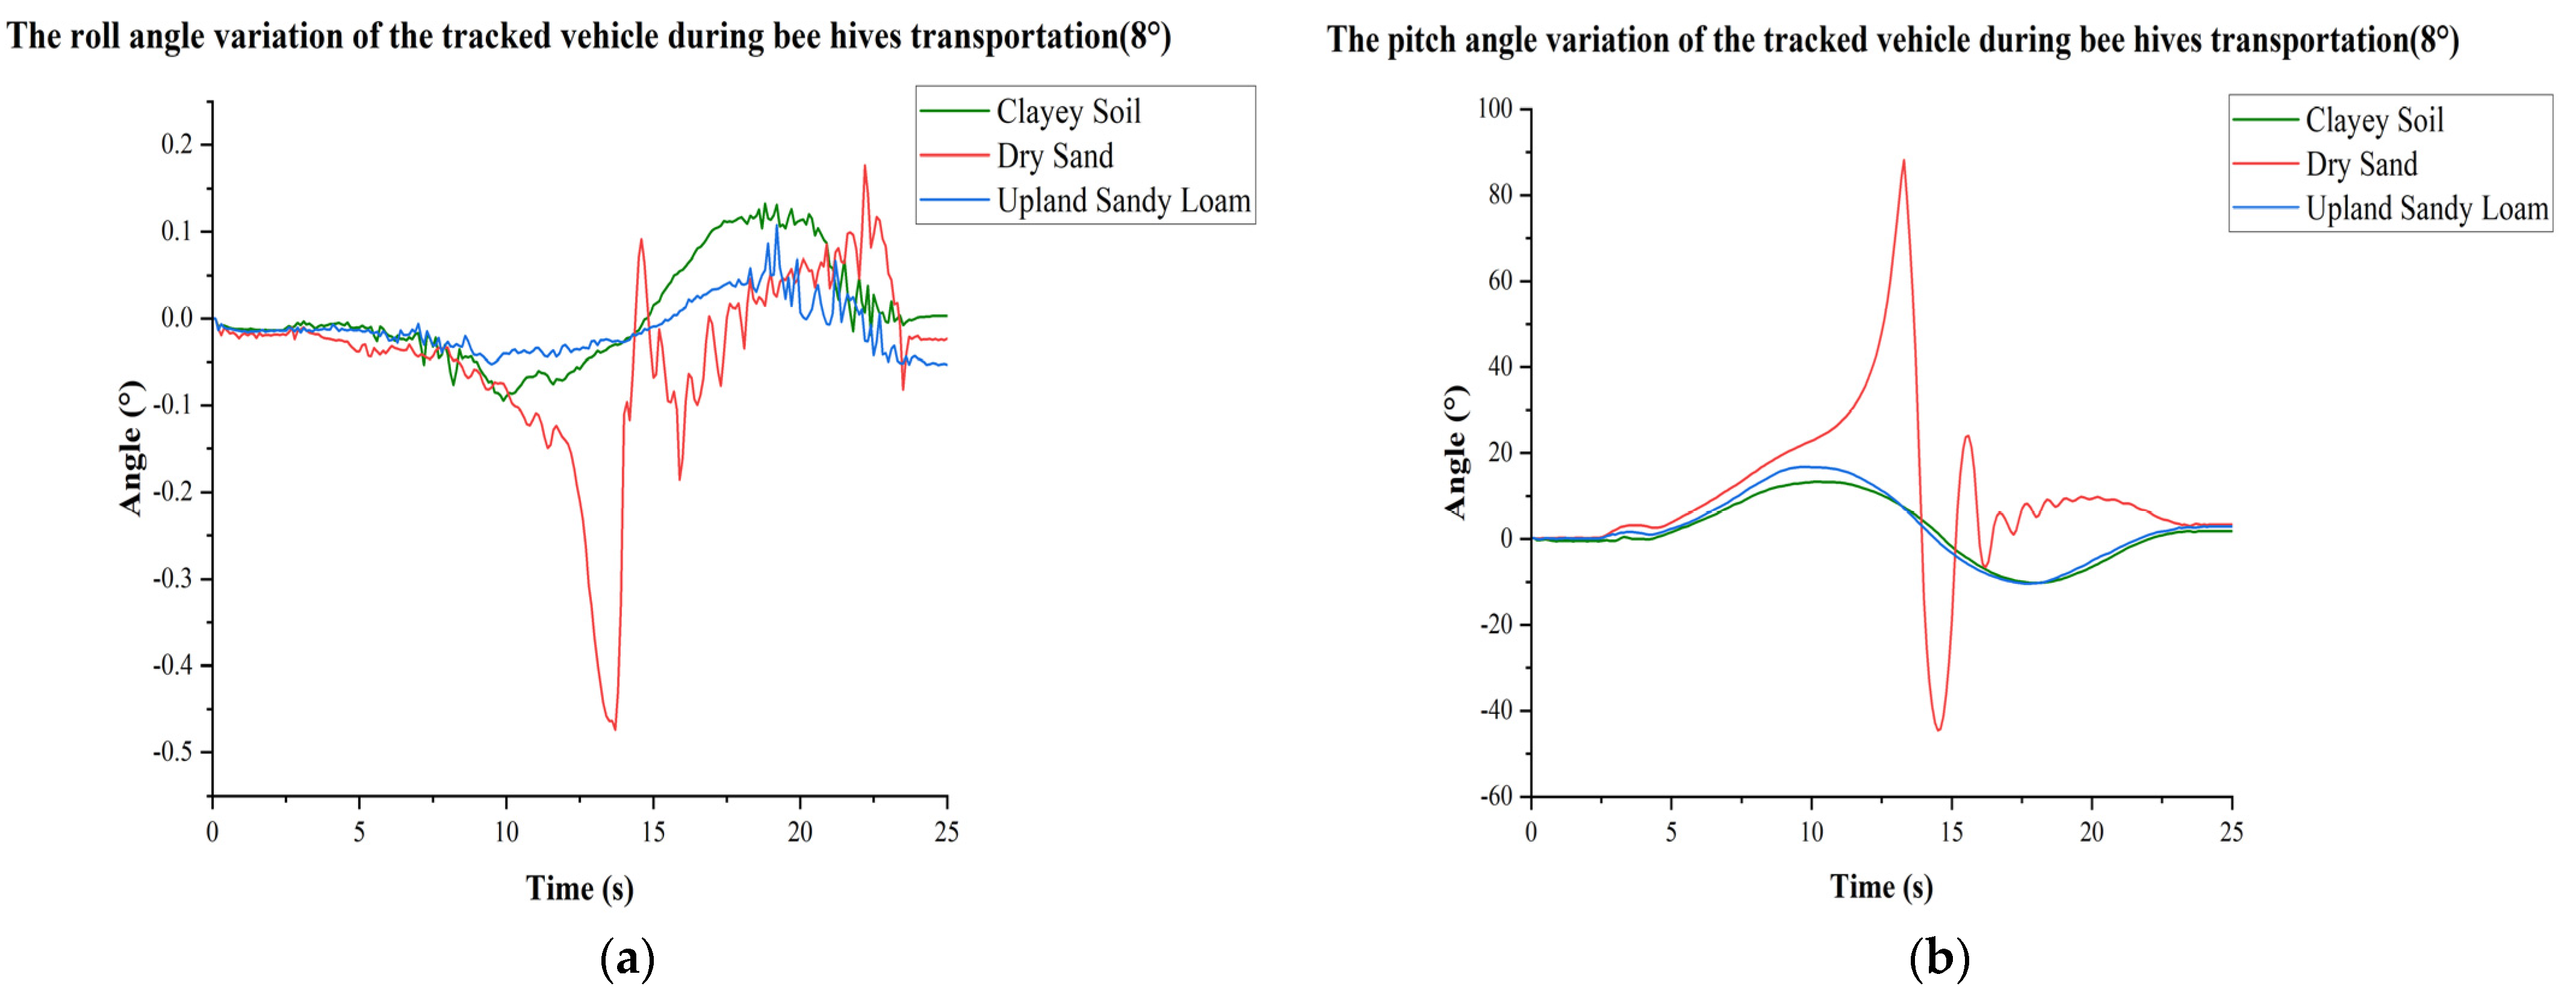
3.1.3. Results and Analysis for Full Load of Beehives

The variations in the roll and pitch values of the vehicle under each road condition when the loading box is fully loaded with bee frames on the 8° upslope and downslope are shown in Figure 22. It can be seen roll value of the vehicle when the loading box is fully loaded with bee frames on clayey soil and upland sandy loam can vary between −1 and 1°. The variation ranges of pitch angle are not considerably different between the clayey soil and upland sandy loam conditions, where the variation range of pitch angle in clayey soil is (−10.02–13.29°) and that in upland sandy loam is (−10.2–16.29°). The range of variation in upland sandy loam is slightly greater in the uphill phase. However, the vehicle in the dry sand road condition of overturned at the uphill stage, and the change in angle in the initial stage of the uphill drive had the same upward trend as that on clayey soil and upland sandy loam from the perspective of the pitch. At 11.8 s, the critical value of tipping was reached, and the angle was approximately 34.12°, which exceeded the maximum uphill tipping angle of 34° under the beehive loading situation. For this reason, the vehicle could not be restrained from tipping. This is basically the same as the maximum uphill limit angle of the vehicle when it is fully loaded with beehives, as calculated in the previous section. At this time, the roll angle fluctuates drastically due to the tipping of the vehicle. The inability of the dry sandy ground to provide sufficient load carrying capacity for the vehicle is the main reason why the vehicle tilted its head and eventually overturned.
Figure 23 shows the vehicle’s driving torque and crawler stress when fully loaded with beehives on clayey soil and dry sand pavement. The vehicle’s driving torque increased during the uphill process in the dry sand road condition; however, the vehicle’s track force on the two pavements was nearly the same. It indicates that the cause of the tipping is unrelated to the track section. The driving torque and track force of the vehicle under clayey soil and dry sand pavement demonstrate this.
The variation of roll and pitch values of the vehicle under each road condition with a full load of beehives during s-turn is shown in Figure 24. First, in the s-turn transport test, all ground conditions were passed, and similar to the vehicle fully loaded with bee frames, the change in the roll value of the vehicle fully loaded with beehives did not exceed ±1°, and the maximum value changed between (−0.4−0.4°). Thus, the range of change in the roll direction when the vehicle is fully loaded with beehives is tight, and there is no safety risk. In terms of the pitch angle variation of the vehicle with a full load of beehives, the angle variation is the largest in the dry sand road conditions, peaking at approximately 6°, and in the subsequent runs, the angle changes in the range of (3.5−5°). The peak reaches 4° in upland sandy loam, with a smaller range of variation in the subsequent runs (2−3°). The most stable surface is clayey soil, with the lowest amount of track sinking and the least amount of head tilt. The peak pitch angle is only about 2°, and subsequent variations are only 1.5° up and down. On all three surfaces, the angle is less than the maximum uphill limit inclination angle of 34°, so that the vehicle can be driven safely on level ground.
A box plot of the variations in the roll and pitch values of the vehicle under each road condition with a full load of beehives is shown in Figure 25. As can be seen in Figure 25a, the roll values do not vary by more than ±1° under the three ground conditions and two driving conditions, and the maximum values vary between −0.5° and 0.4°. These values have almost no effect on vehicle roll during driving. Therefore, changes in the roll direction of the vehicle under both driving conditions fulfill the conditions for safe driving. In terms of the variation of the beehive under full load conditions, the vehicle’s center of gravity shifts backward, resulting in a pitch angle of more than 10° on the 8° upslope and downslope, where the vehicle is overturned on the dry sand road surface because it exceeds the maximum uphill limit dip angle. However, when the vehicle is on a horizontal road, the stability due to pitch angle change is ranked as follows: dry sand, upland sandy loam, and clayey soil. The dry sand angle has the largest variation range of (0–6°). Under horizontal ground conditions, the pitch angle of the transporter with a full load of beehives is considerably smaller than the minimum uphill limit angle. The stability is better, and vehicle overturning does not occur.

3.2. Field Experiment Results

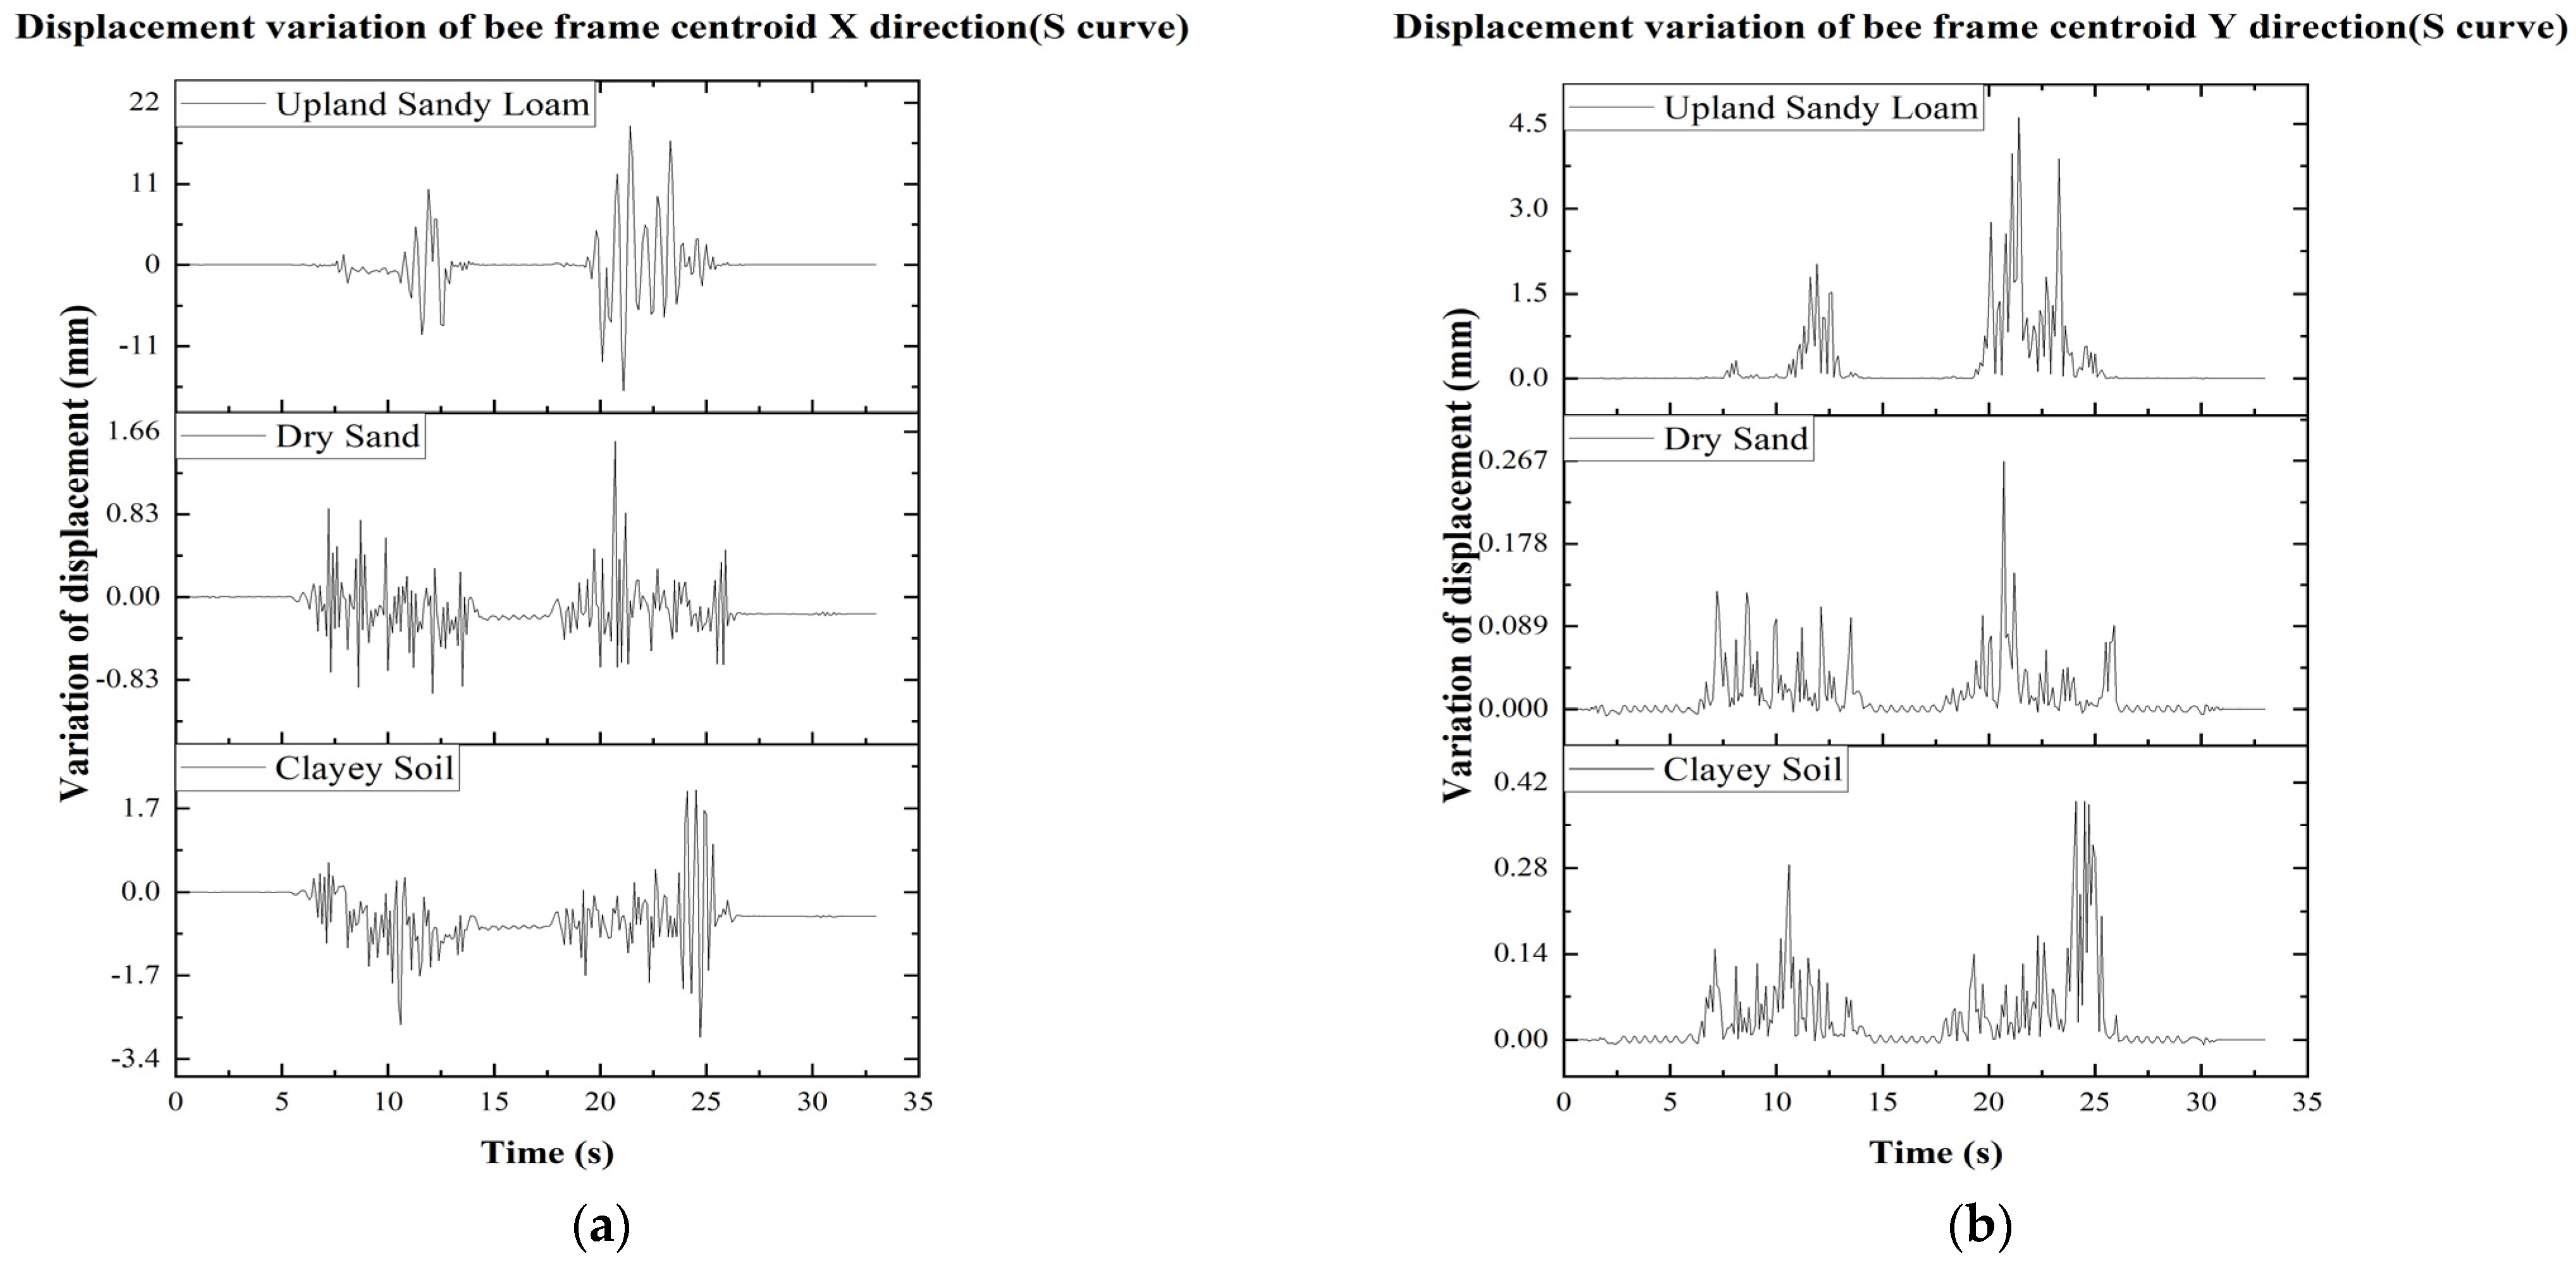
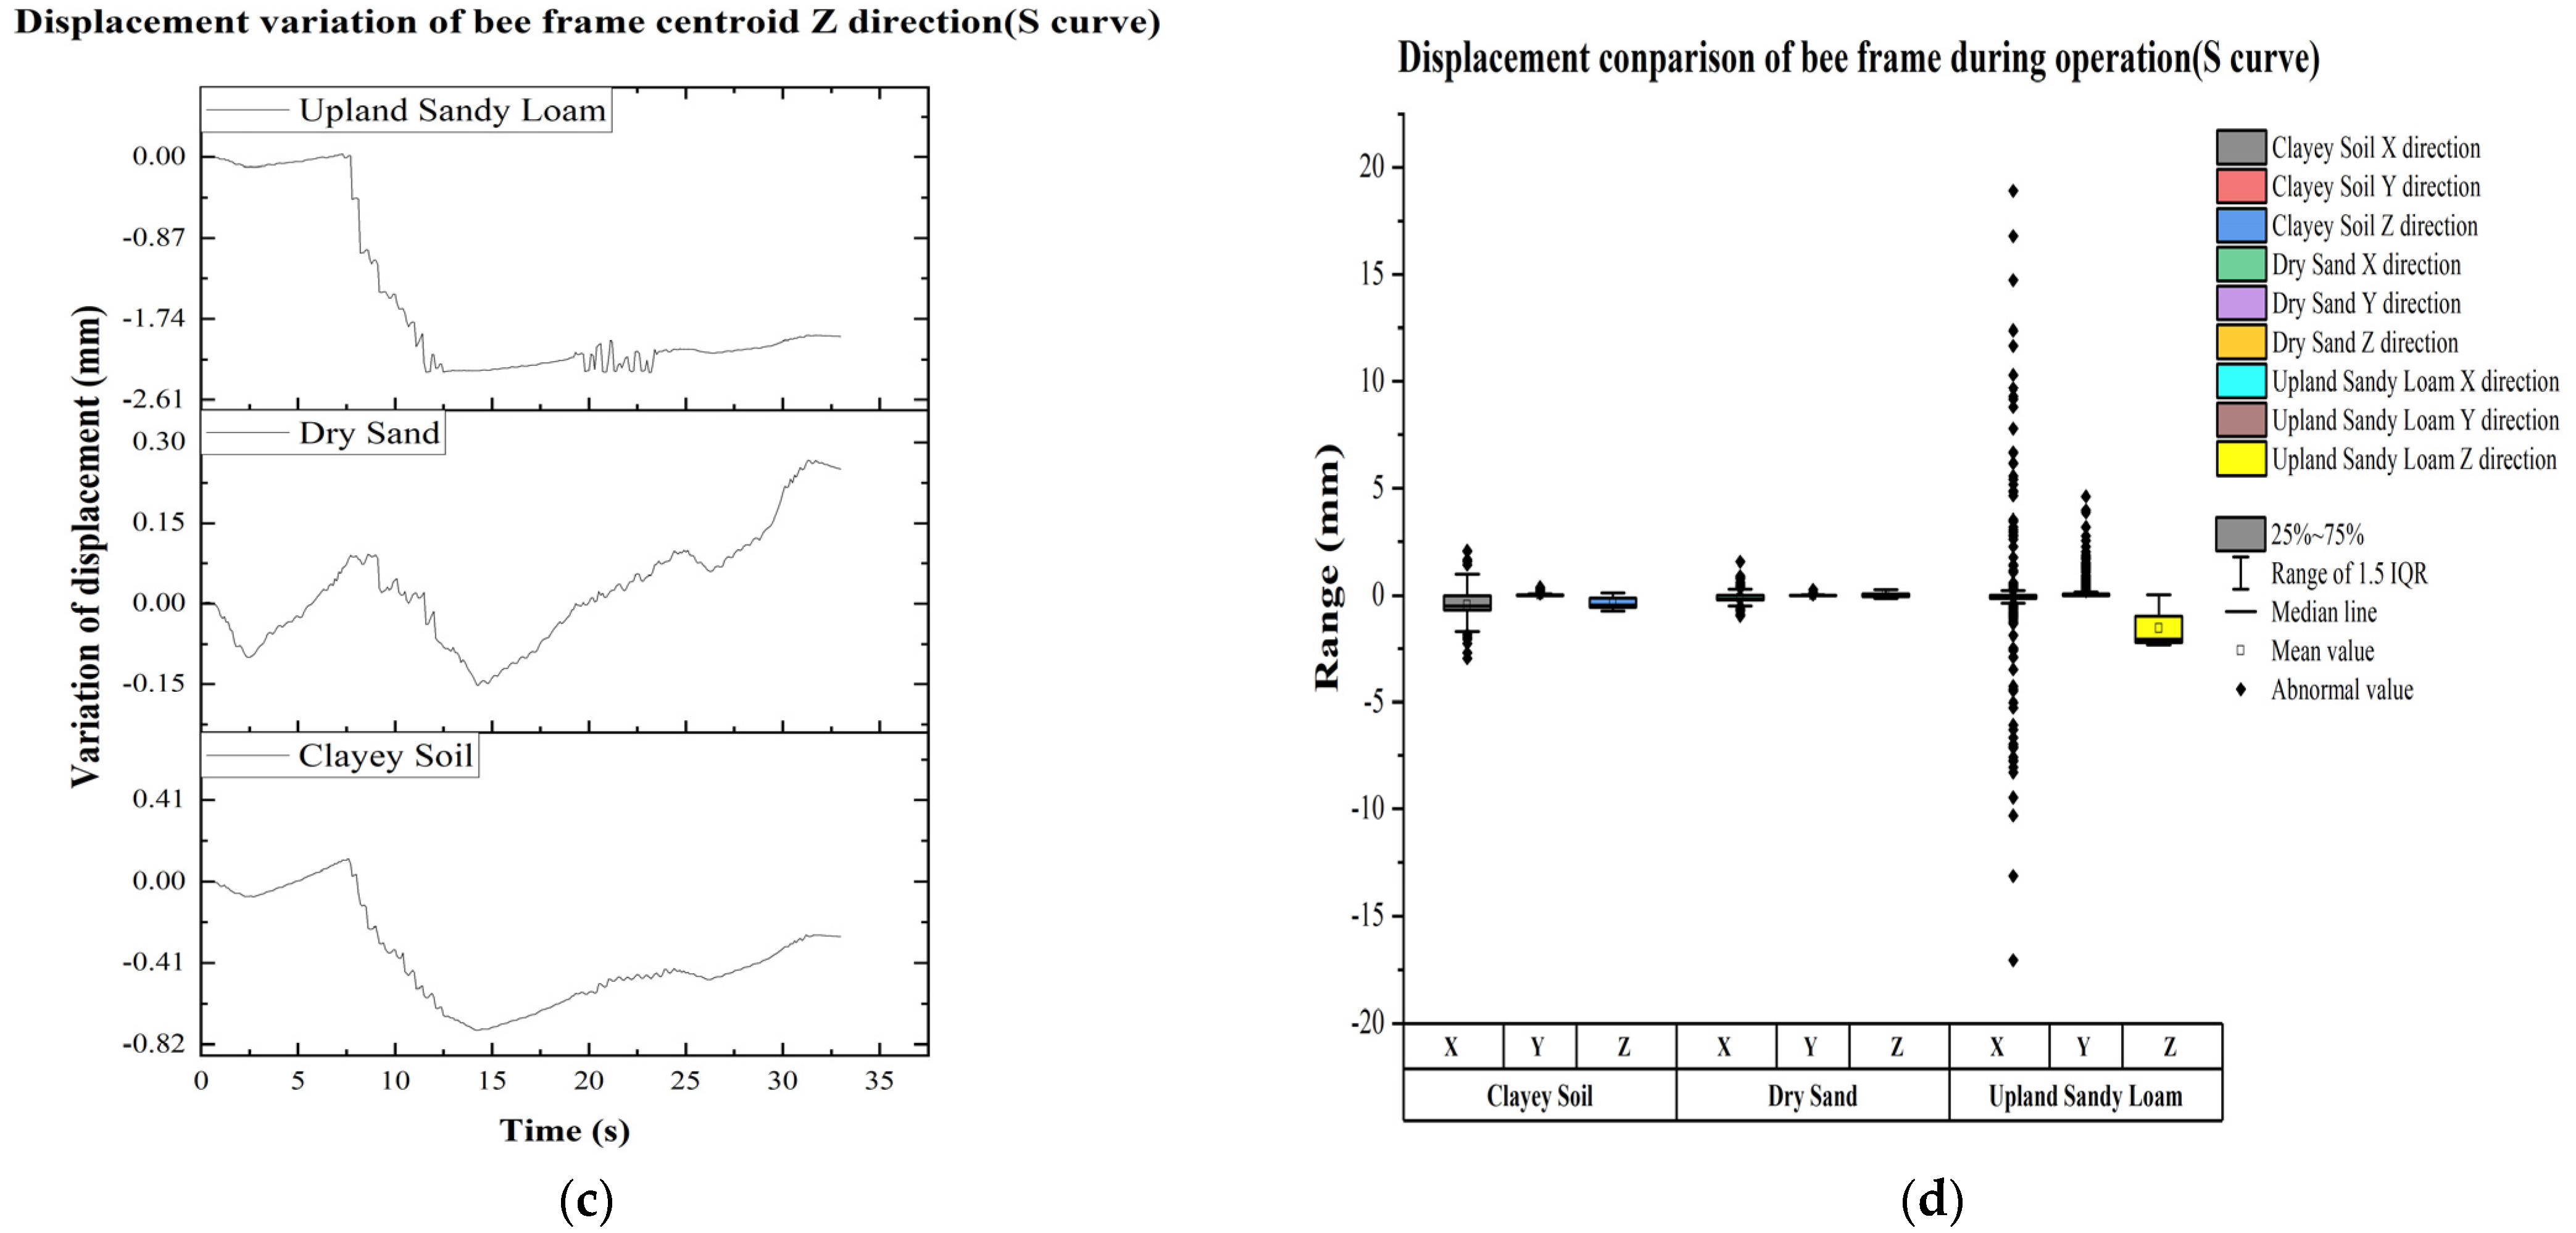
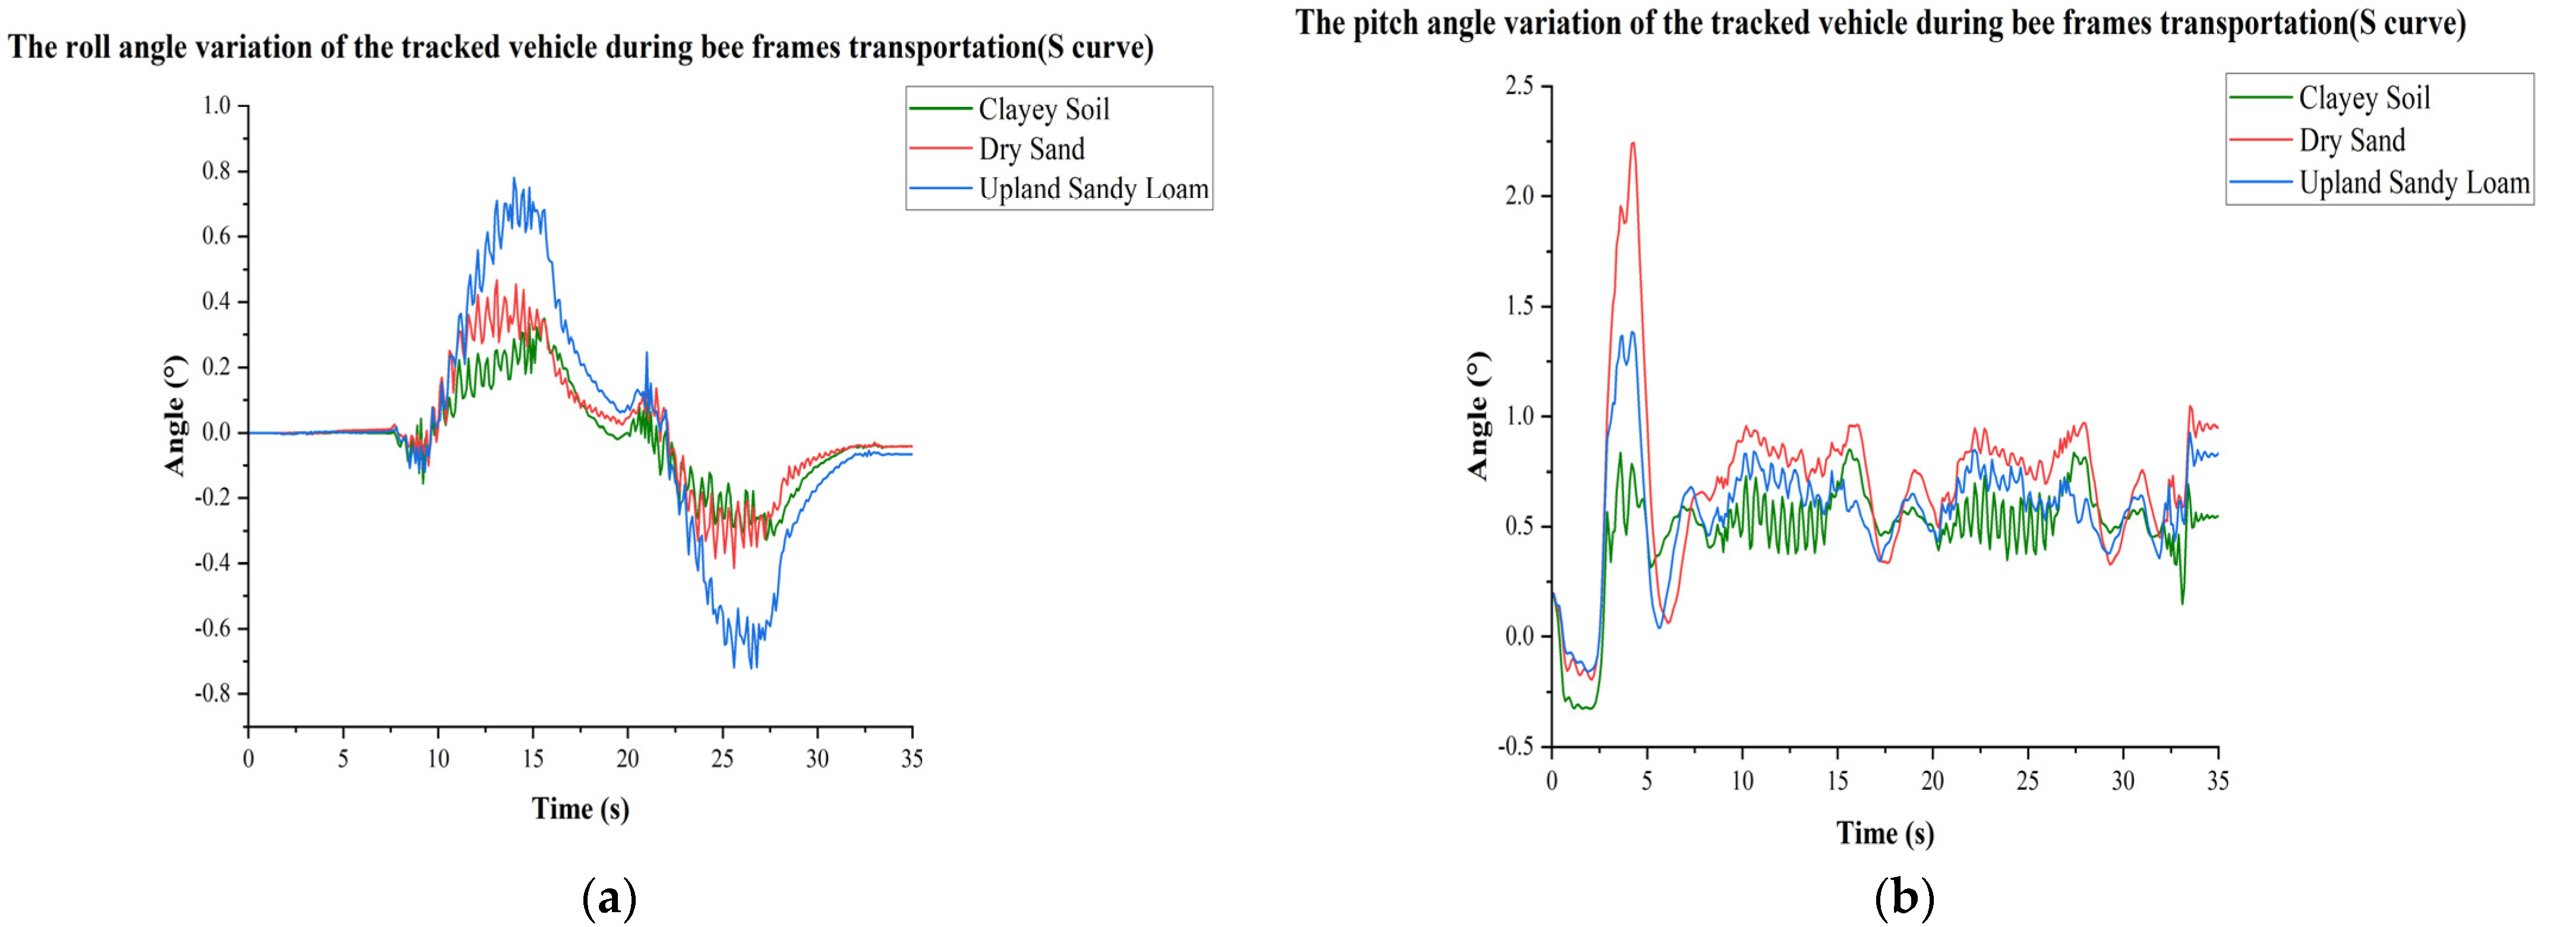
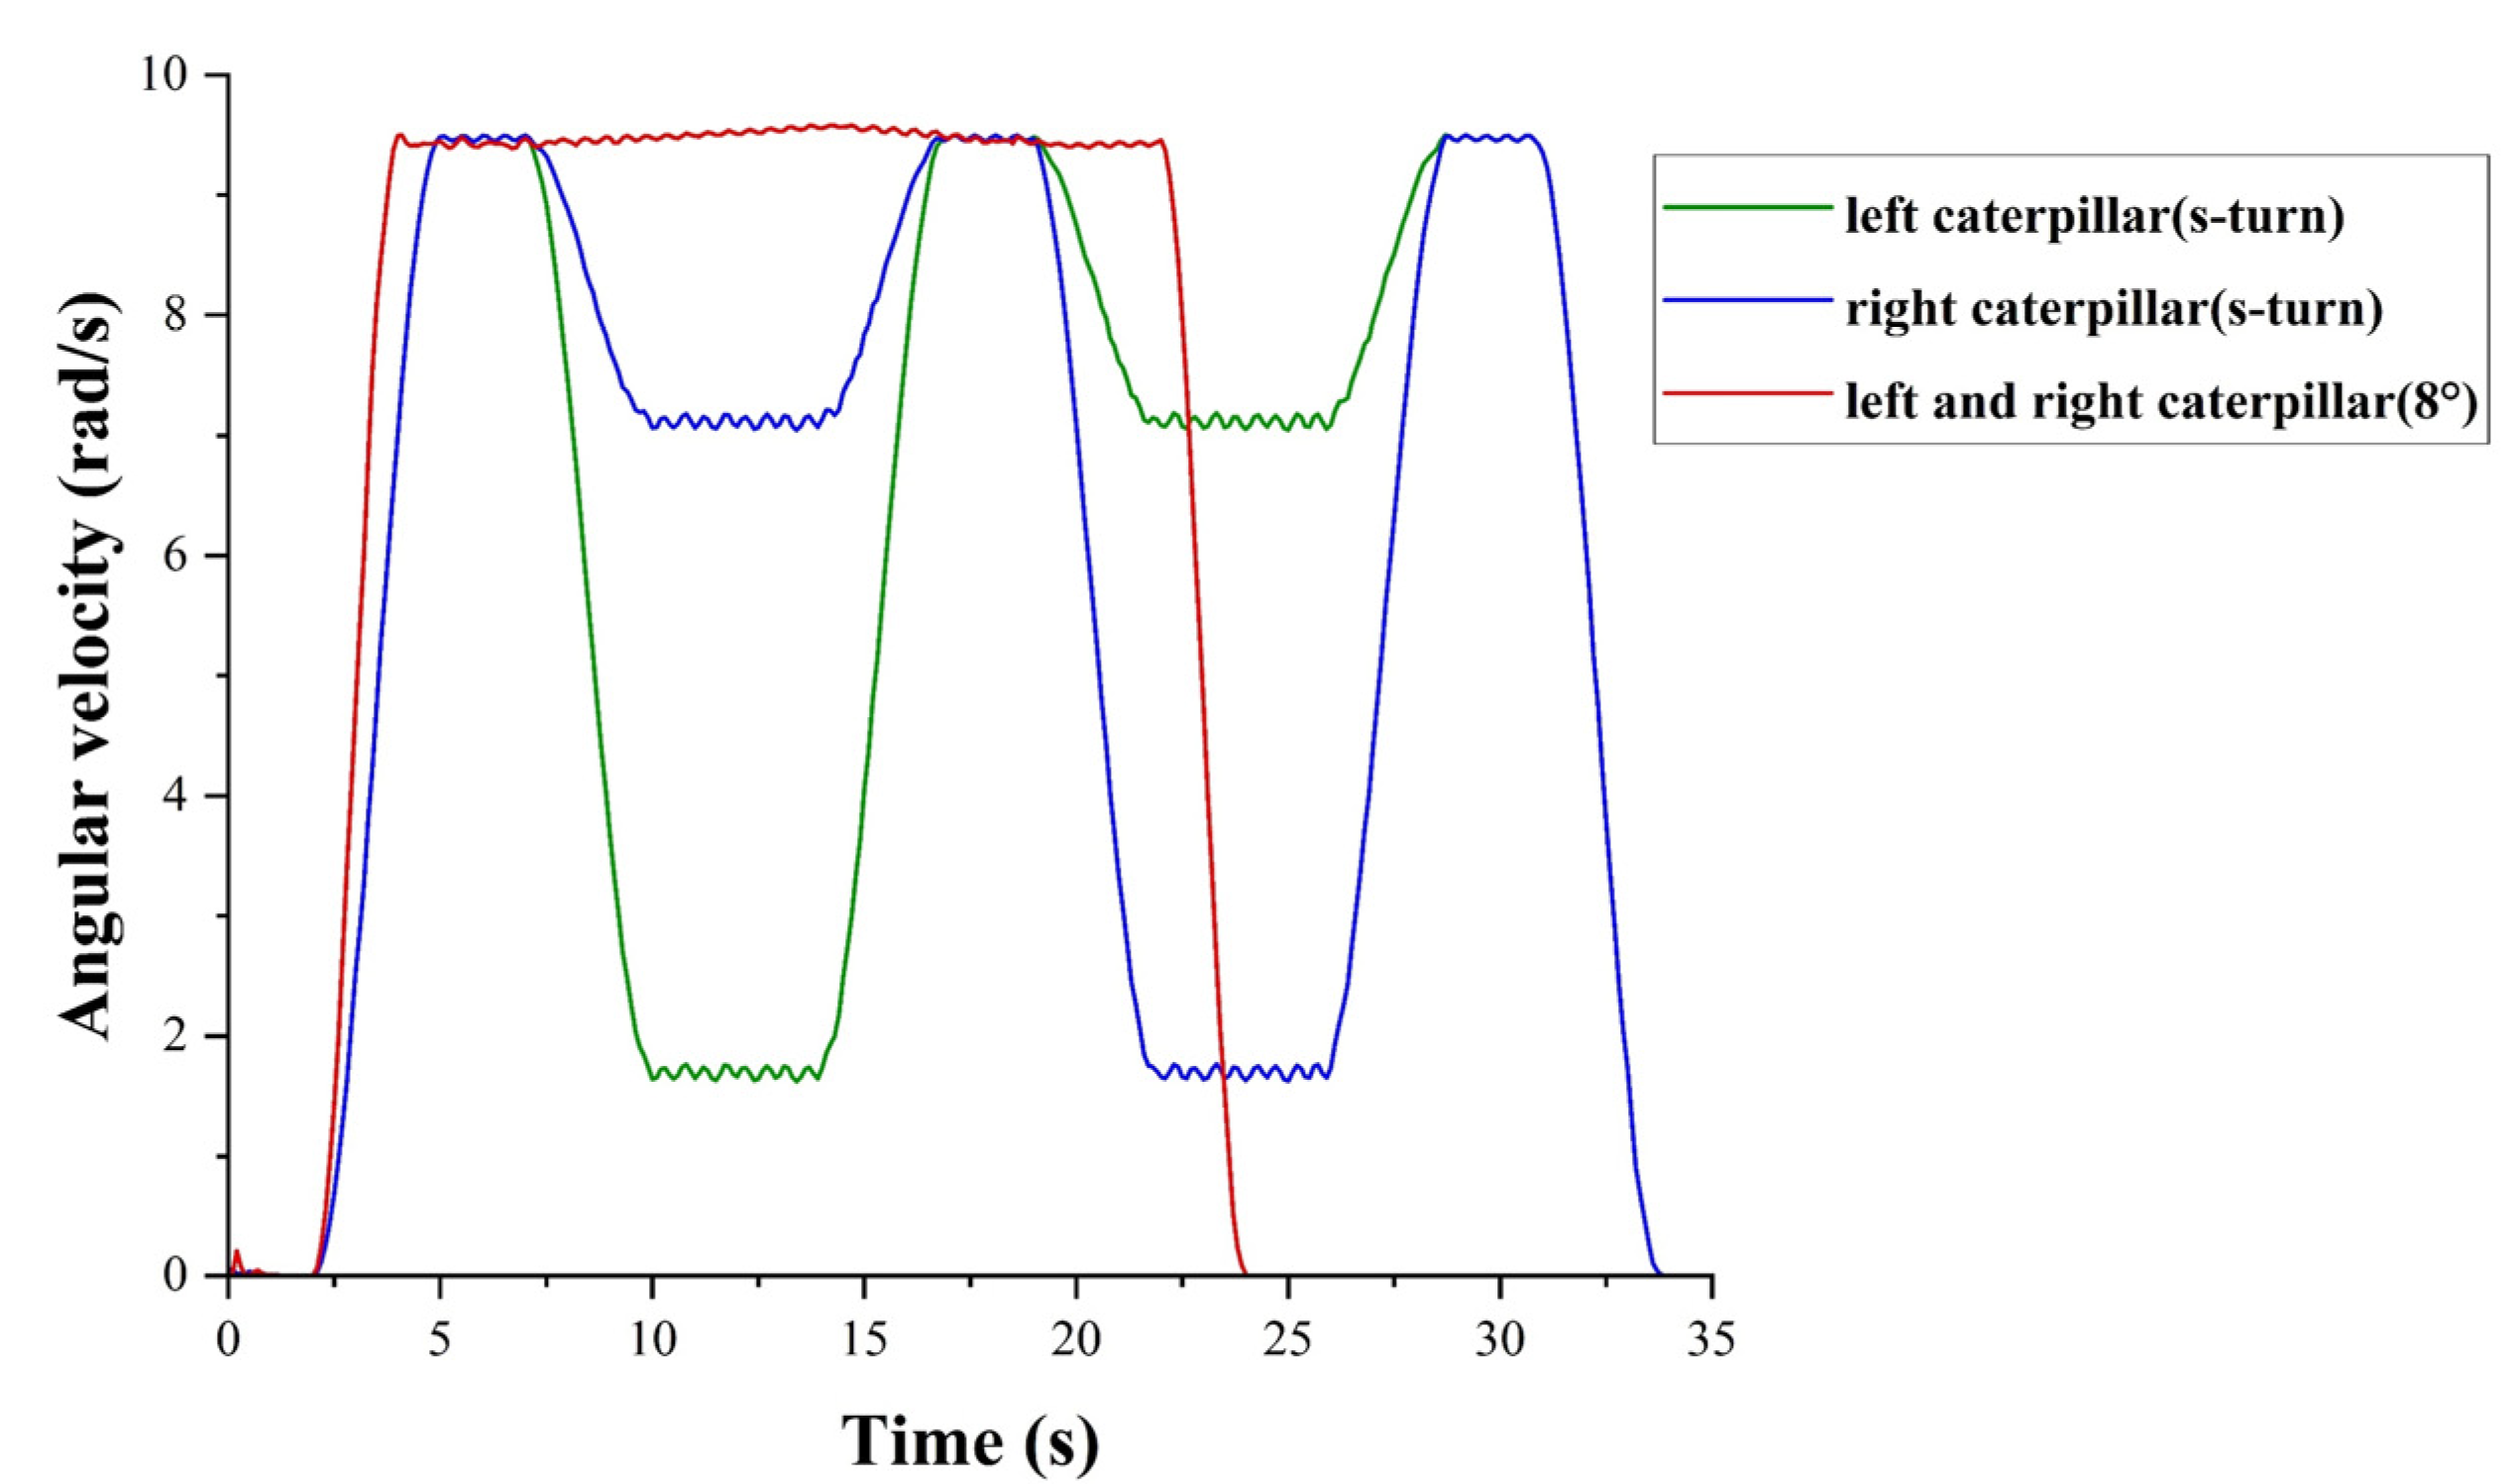
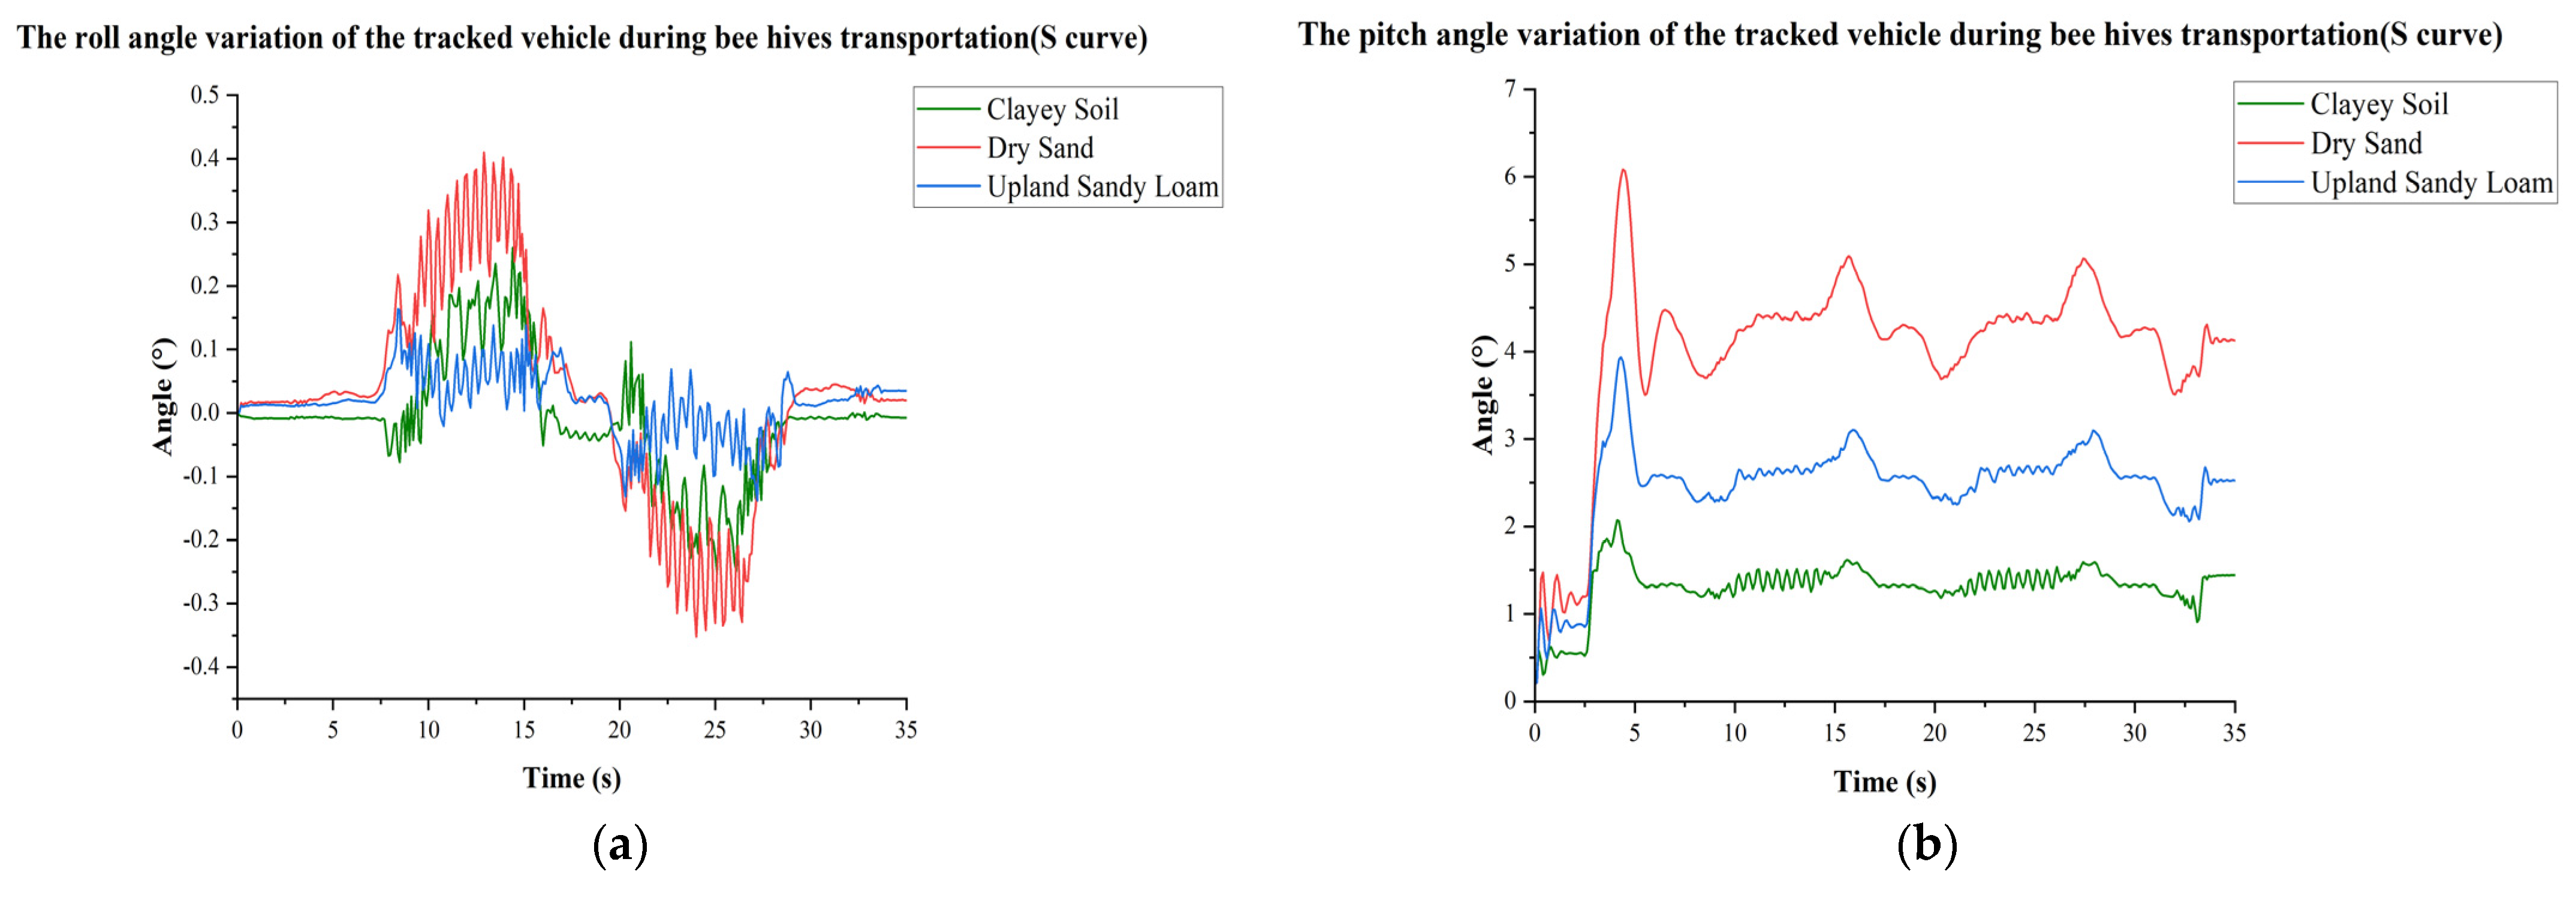
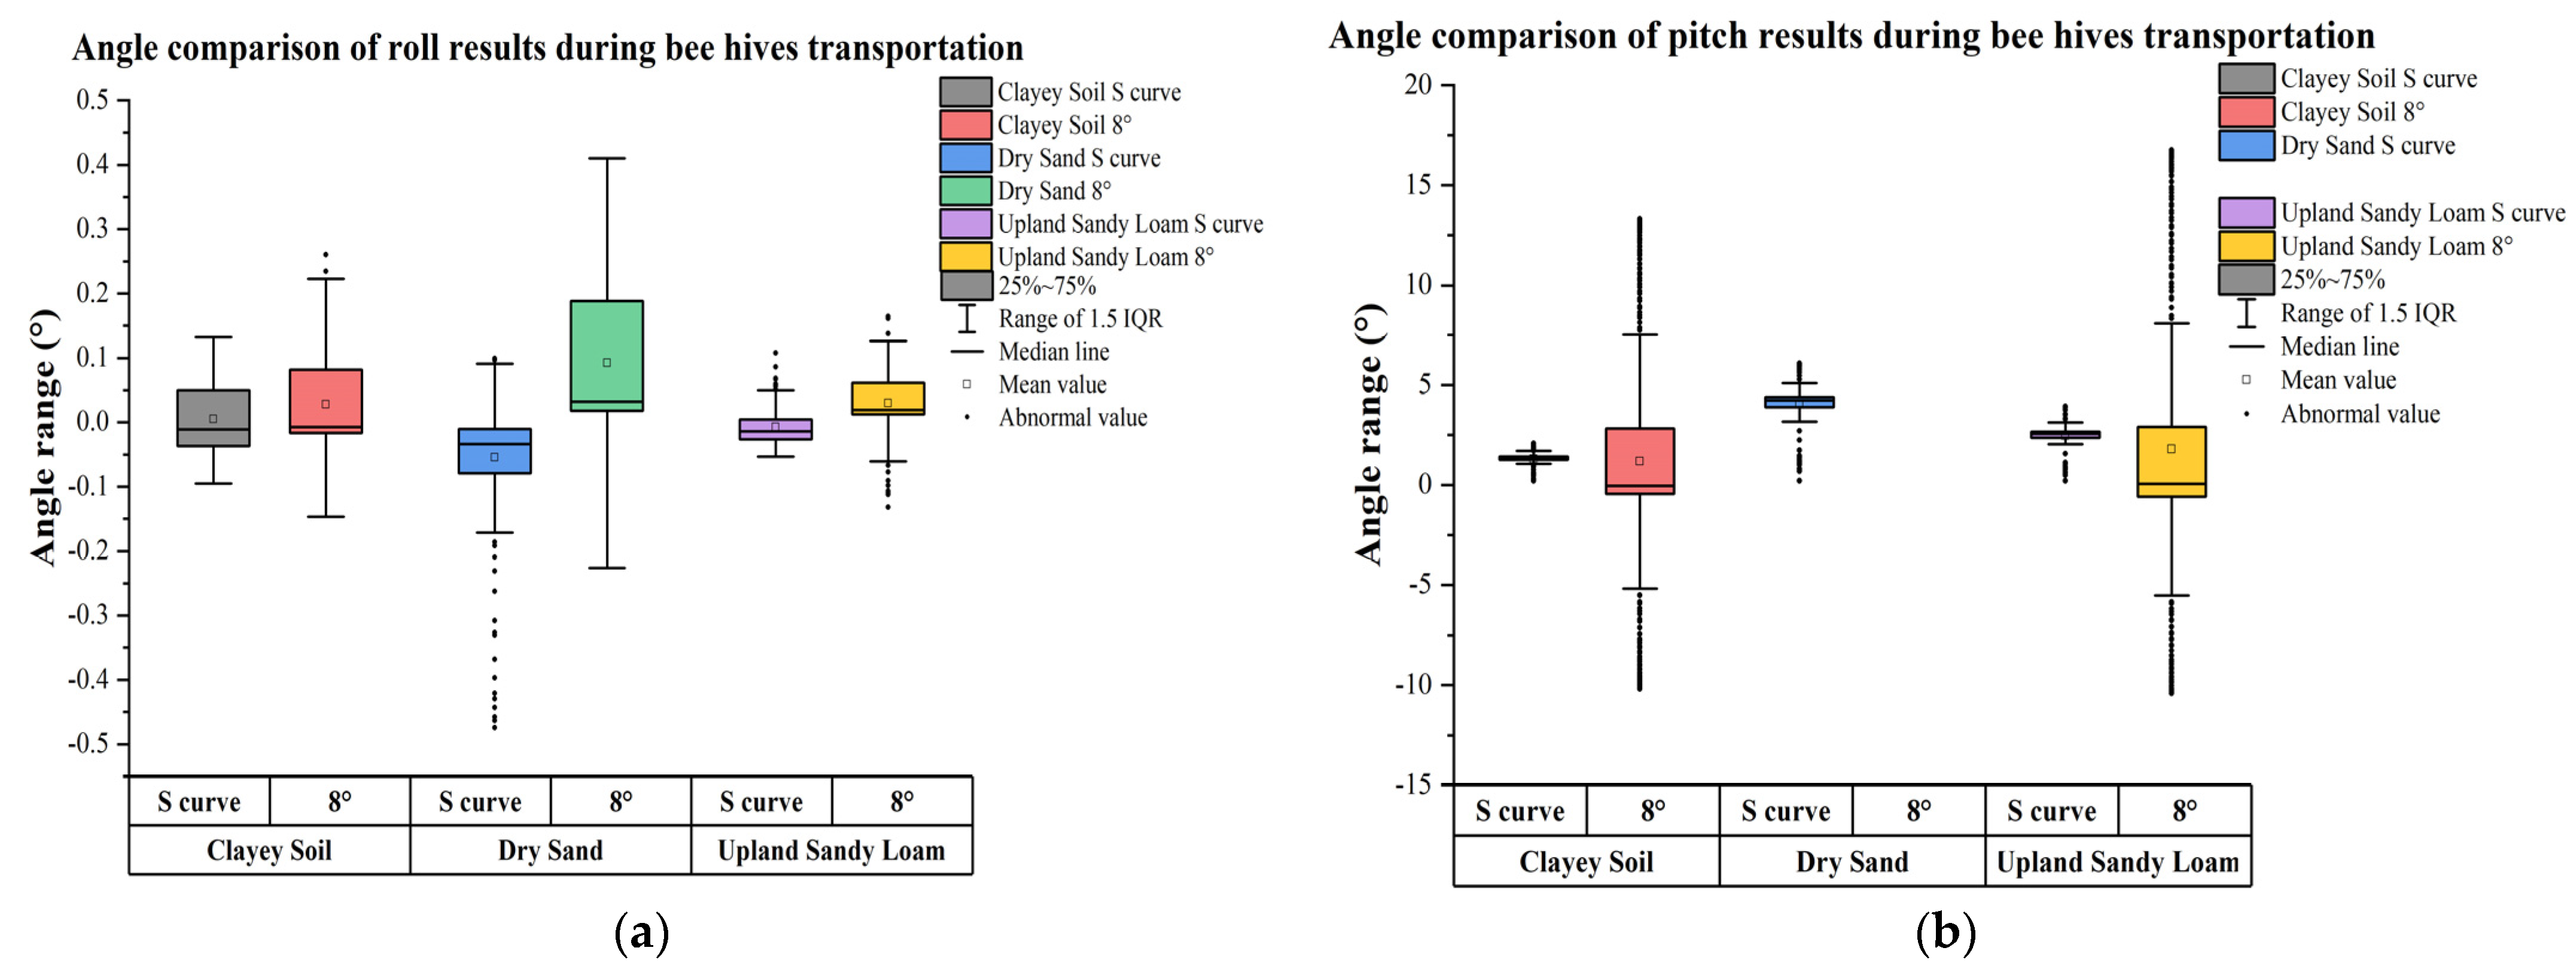
3.2.1. Results and Analysis during S-Turn Transportation

The displacement change data in Figure 26b were obtained by converting and processing the original angle change data shown in Figure 26a in each direction. The values were obtained at the same frequency as that in the simulation. From the displacement variation data in Figure 26b, the peak value of the bee frame centroid in the roll direction (corresponding to the X-direction in the simulation) ranges from (−12–17 mm), which is similar to the peak result obtained in the simulation (18.8 mm). The peak variation (−17 mm) in the pitch direction (corresponding to the Y-direction in the simulation) of the bee frame centroid is nearly three times higher than the peak result obtained in the simulation (4.6 mm). In the field test, the sandy loam soil could not be guaranteed to remain flat under several tests. It is impossible to achieve the perfect simulation conditions during the actual driving process, with the peak pitch angle being approximately three times greater than the peak angle in the simulation. During the driving process, the shaking of the bee frame centroid was only (−17–17 mm), and no falling occurred. Thus, the bee frames can be transported safely within the apiary.
By solving Figure 26c in each direction, we found that during the transportation process, the variation range of velocity in the roll direction (corresponding to the X-direction in the simulation) did not exceed ±0.15 mm/s, while the variation range of velocity in the pitch direction (corresponding to the Y-direction in the simulation) was in the range of ±0.05 mm/s. The X-direction range in the field test was consistent with the simulation results (−0.159–0.180 m/s), and the Y-direction range in the field was slightly wider than that in the simulation (−0.025–0.020 m/s). The speed variation of the bee frames during transportation in the field test was considerably smaller than that of the honey picker (5.7–21.9 m/s), meaning that damage to the bee frames during transportation was considerably less than the damage caused by the honey picker. The transport vehicle can, there-fore, safely transport the bee frames.
In the field experiment, angle variations with full bee frames loads and full beehive loads are shown in Figure 27. As shown in Figure 27a, the range of roll value change with a full load of bee frames is (−2.5–5.0°), and the range of roll value change in the field test is considerably wider than the range of roll value change with a full load of bee frames in the simulation (−0.8–0.8°). Moreover, the range of roll value change is (−1.362–3.419°) in the result of angle change with a full load of beehives, as illustrated in Figure 27b. The results obtained with the full load of the beehives are slightly smaller than those obtained with the full load of bee frames and larger than the simulation results (−1–1°). During transportation, the beehives are fixed above the transport vehicle, while the bee frames are free inside the loading box. Therefore, the vehicle with a full load of beehives will be more stable than the vehicle with a full load of bee frames. However, the results are all greater than the simulation results because of the lack of flat terrain due to multiple experiments in the field test, which led to the generation of large error values in the range of variation. In Figure 27, the change in pitch angle is within ±5° with either a full load of bee frames or beehives, which is considerably smaller than the maximum uphill limit inclination angle of 34°. Thus, the vehicle can transport bee frames and beehives safely and stably.

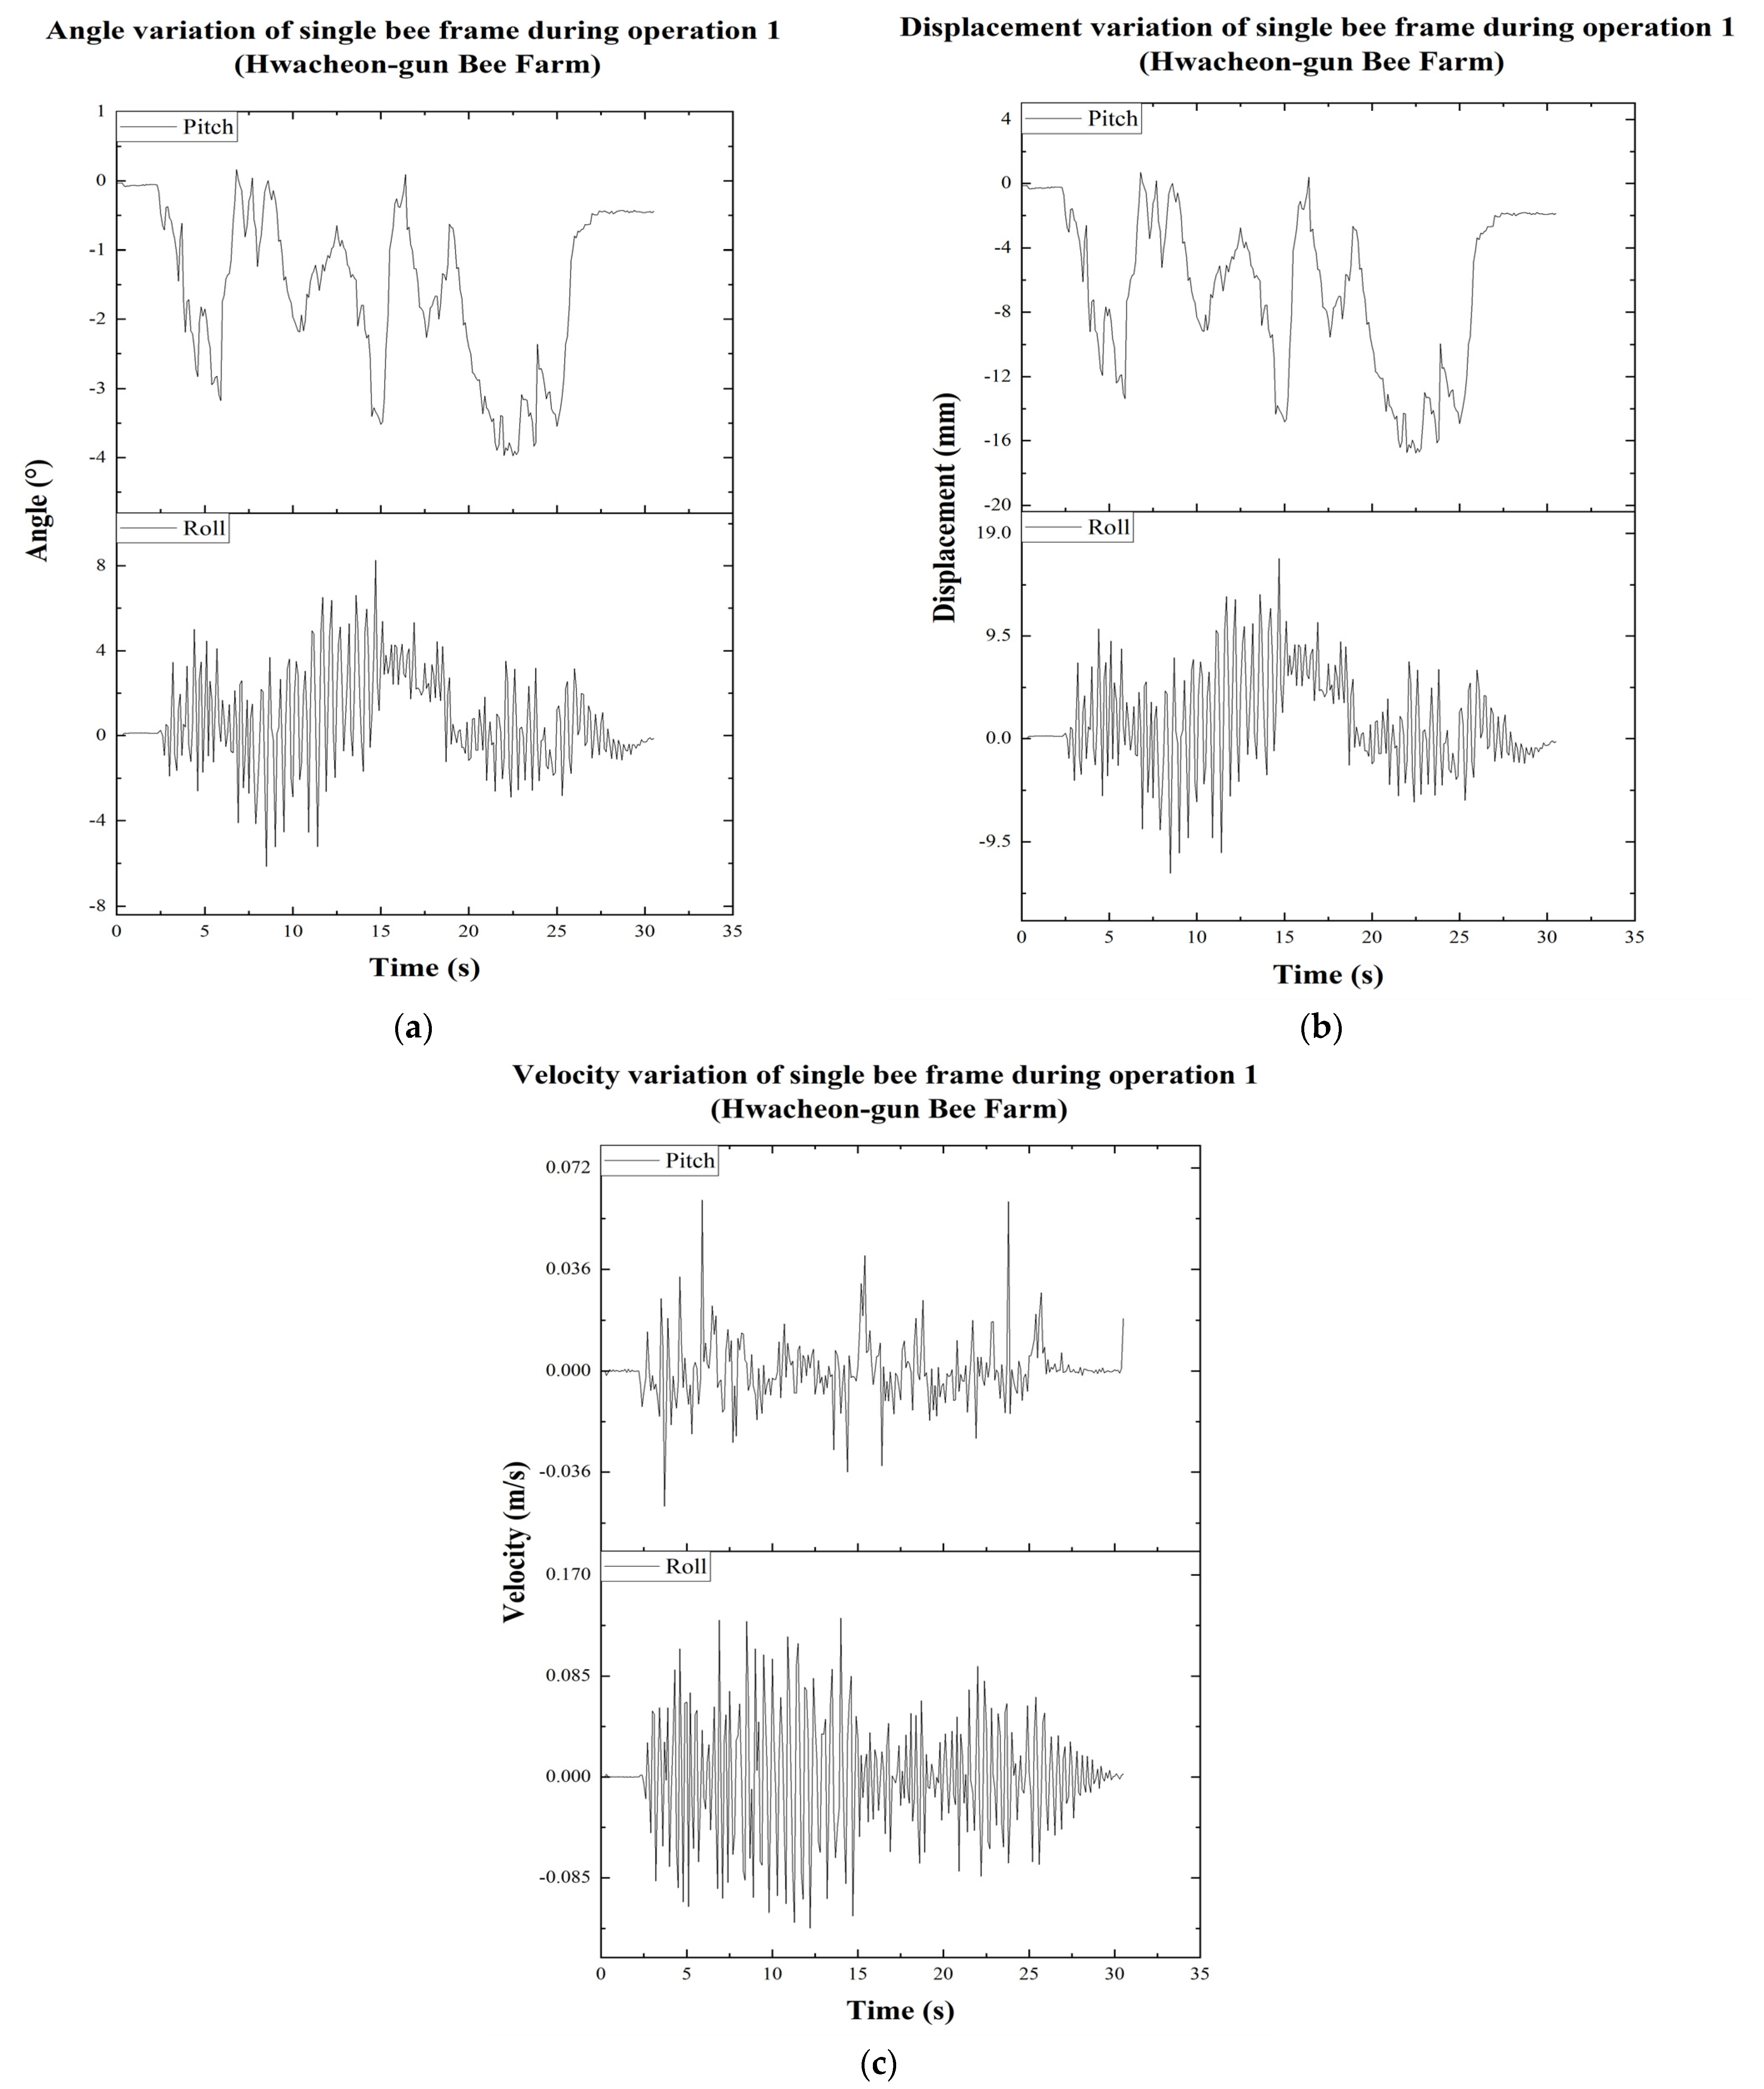
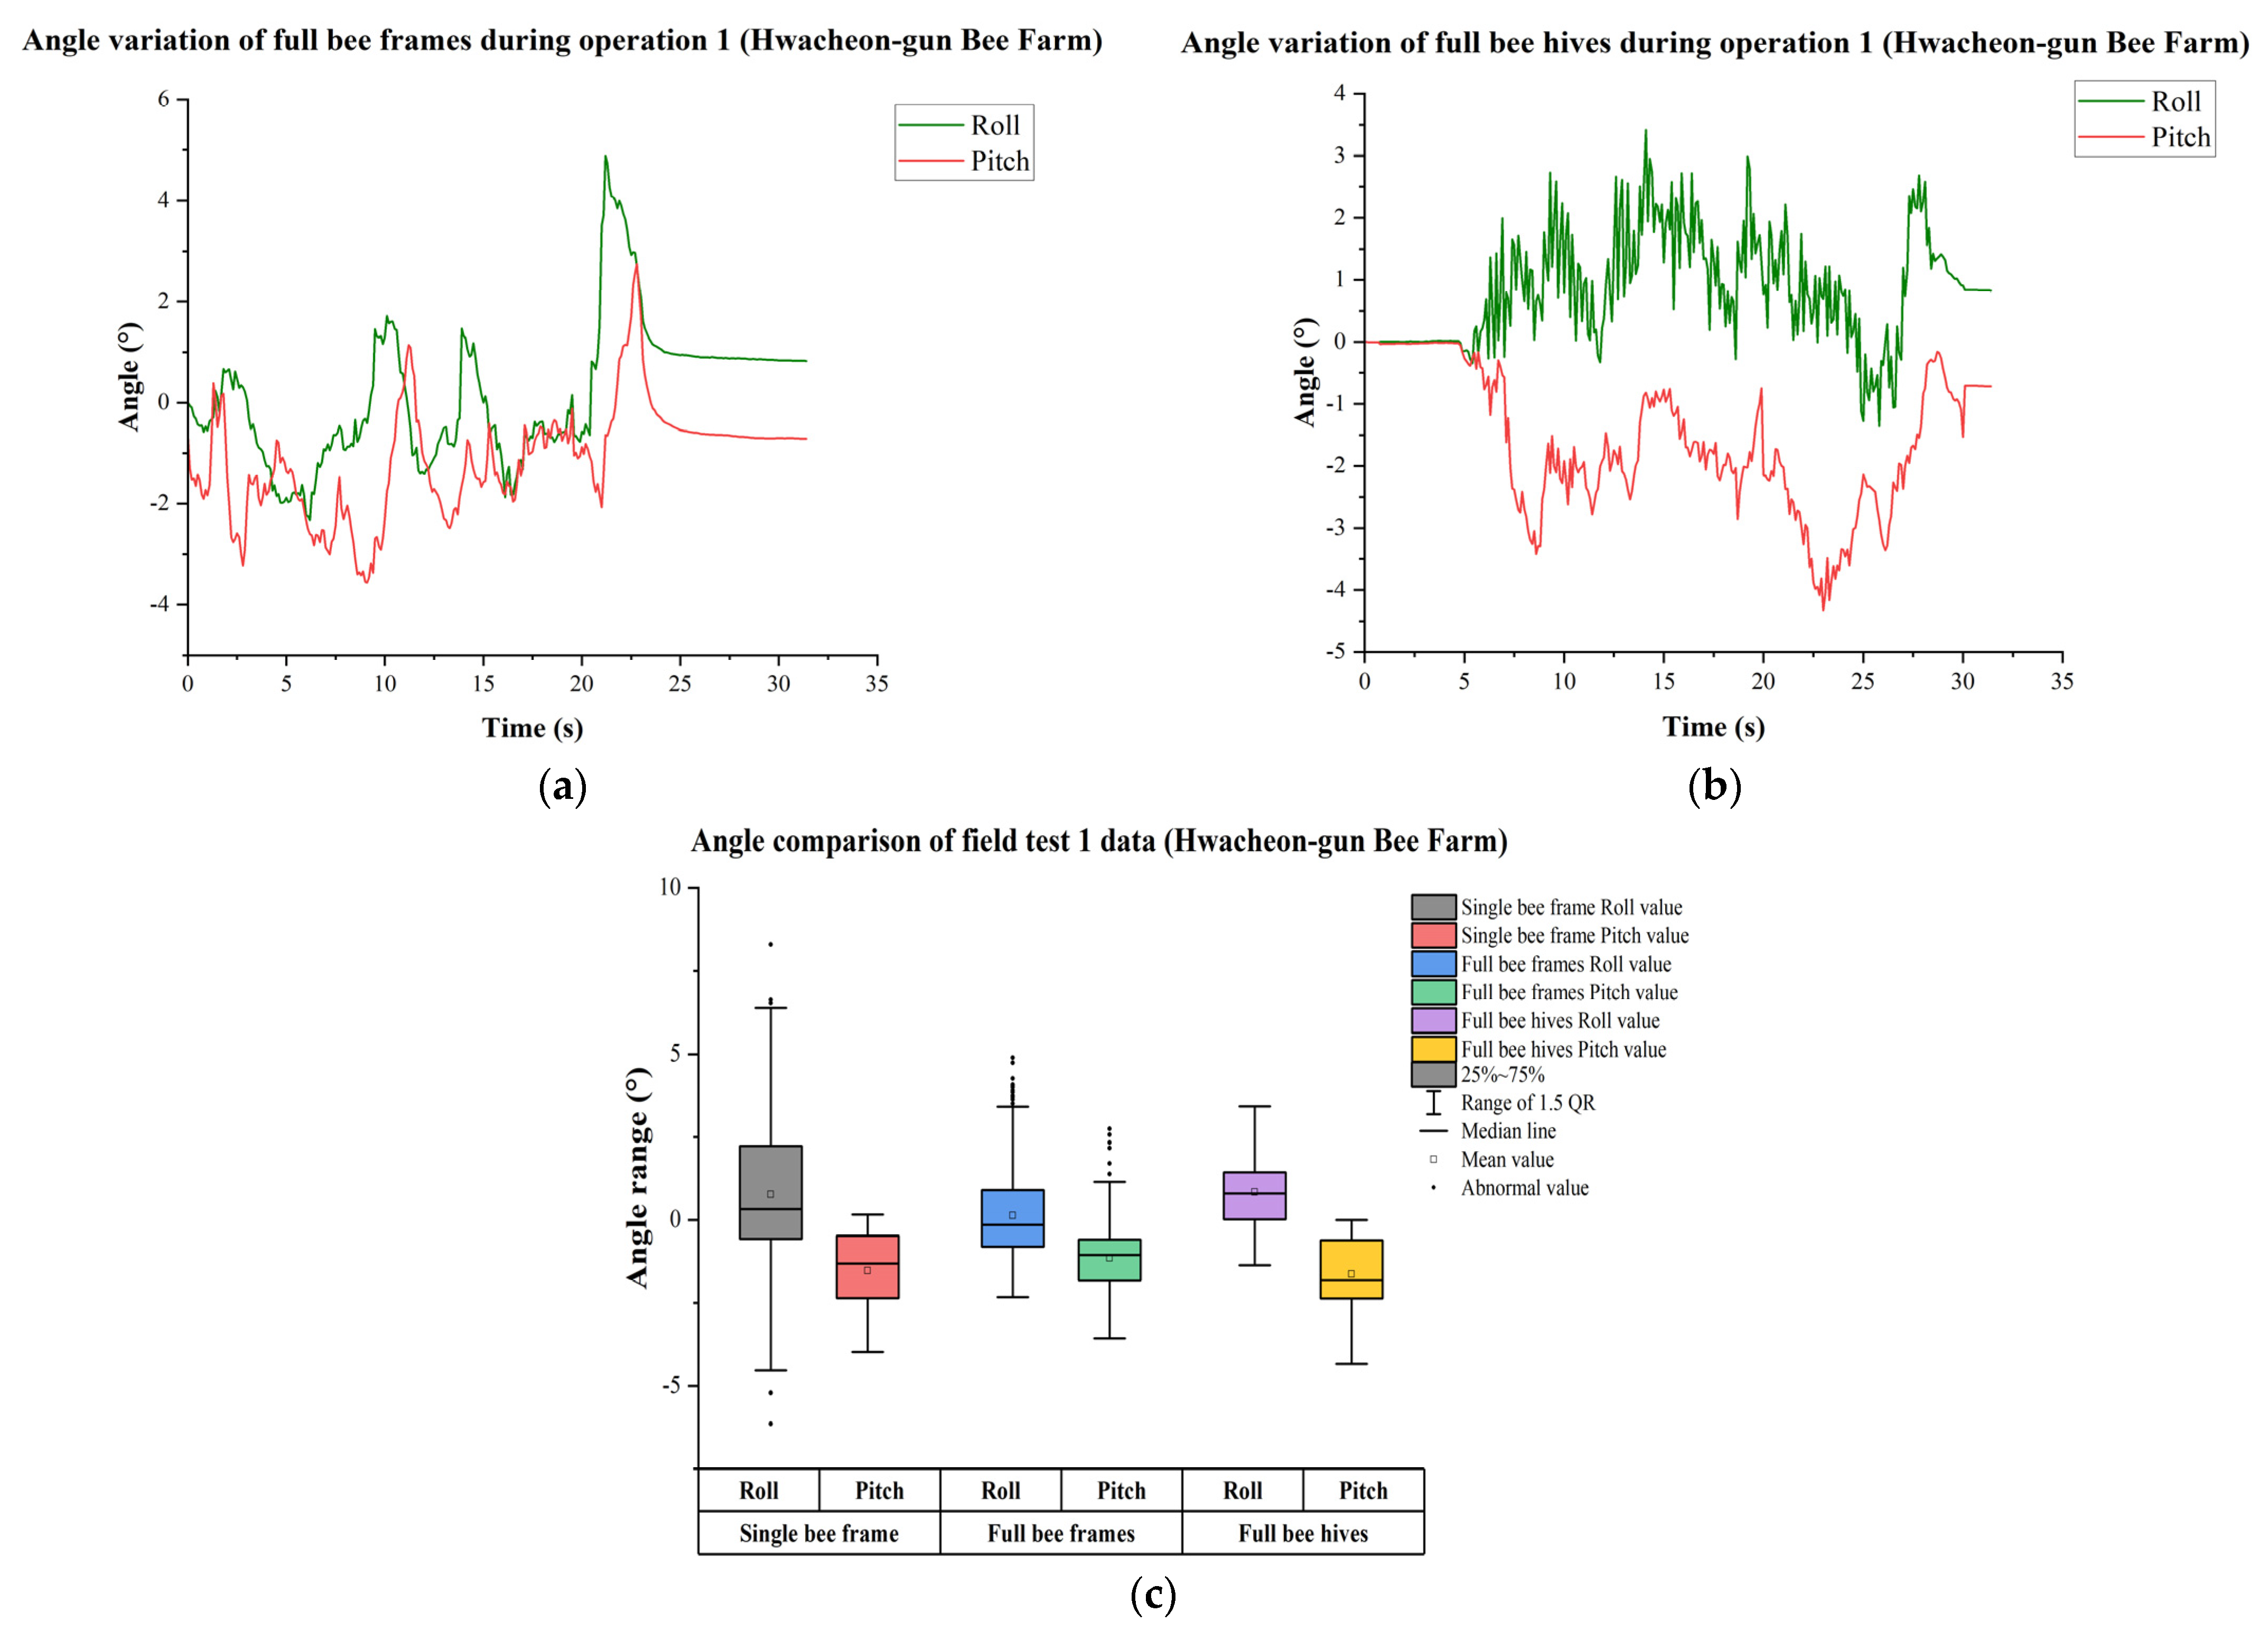
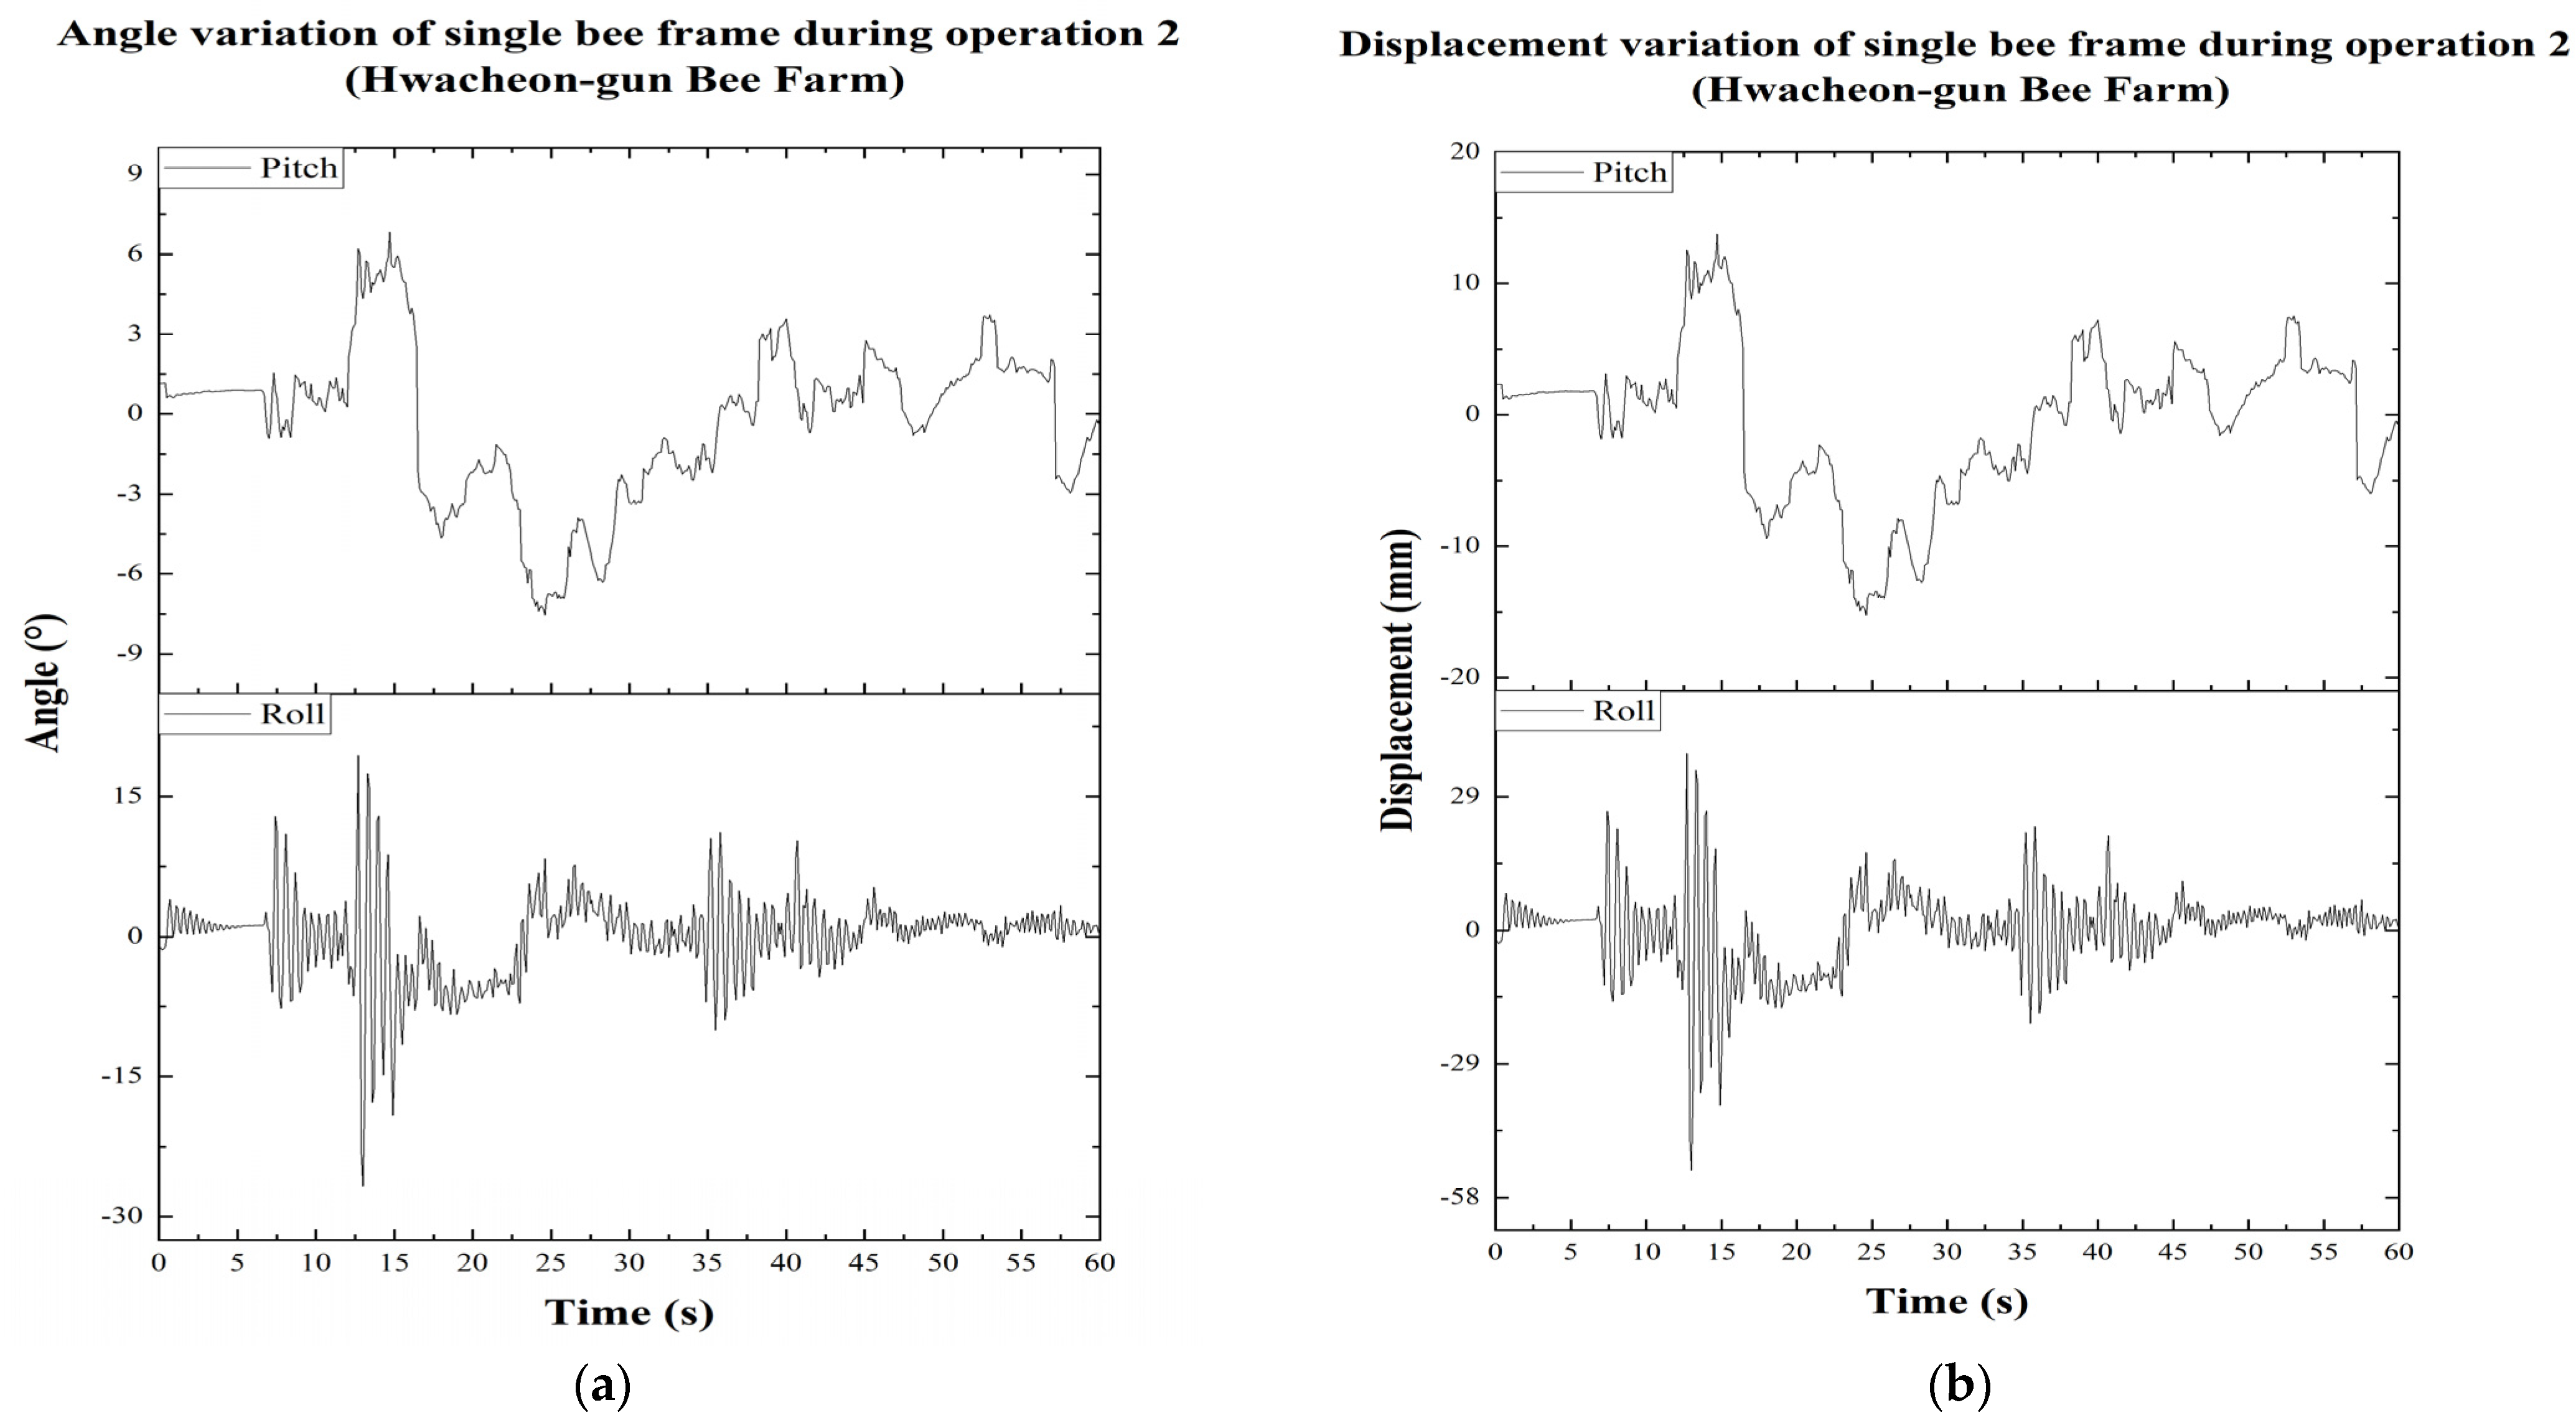
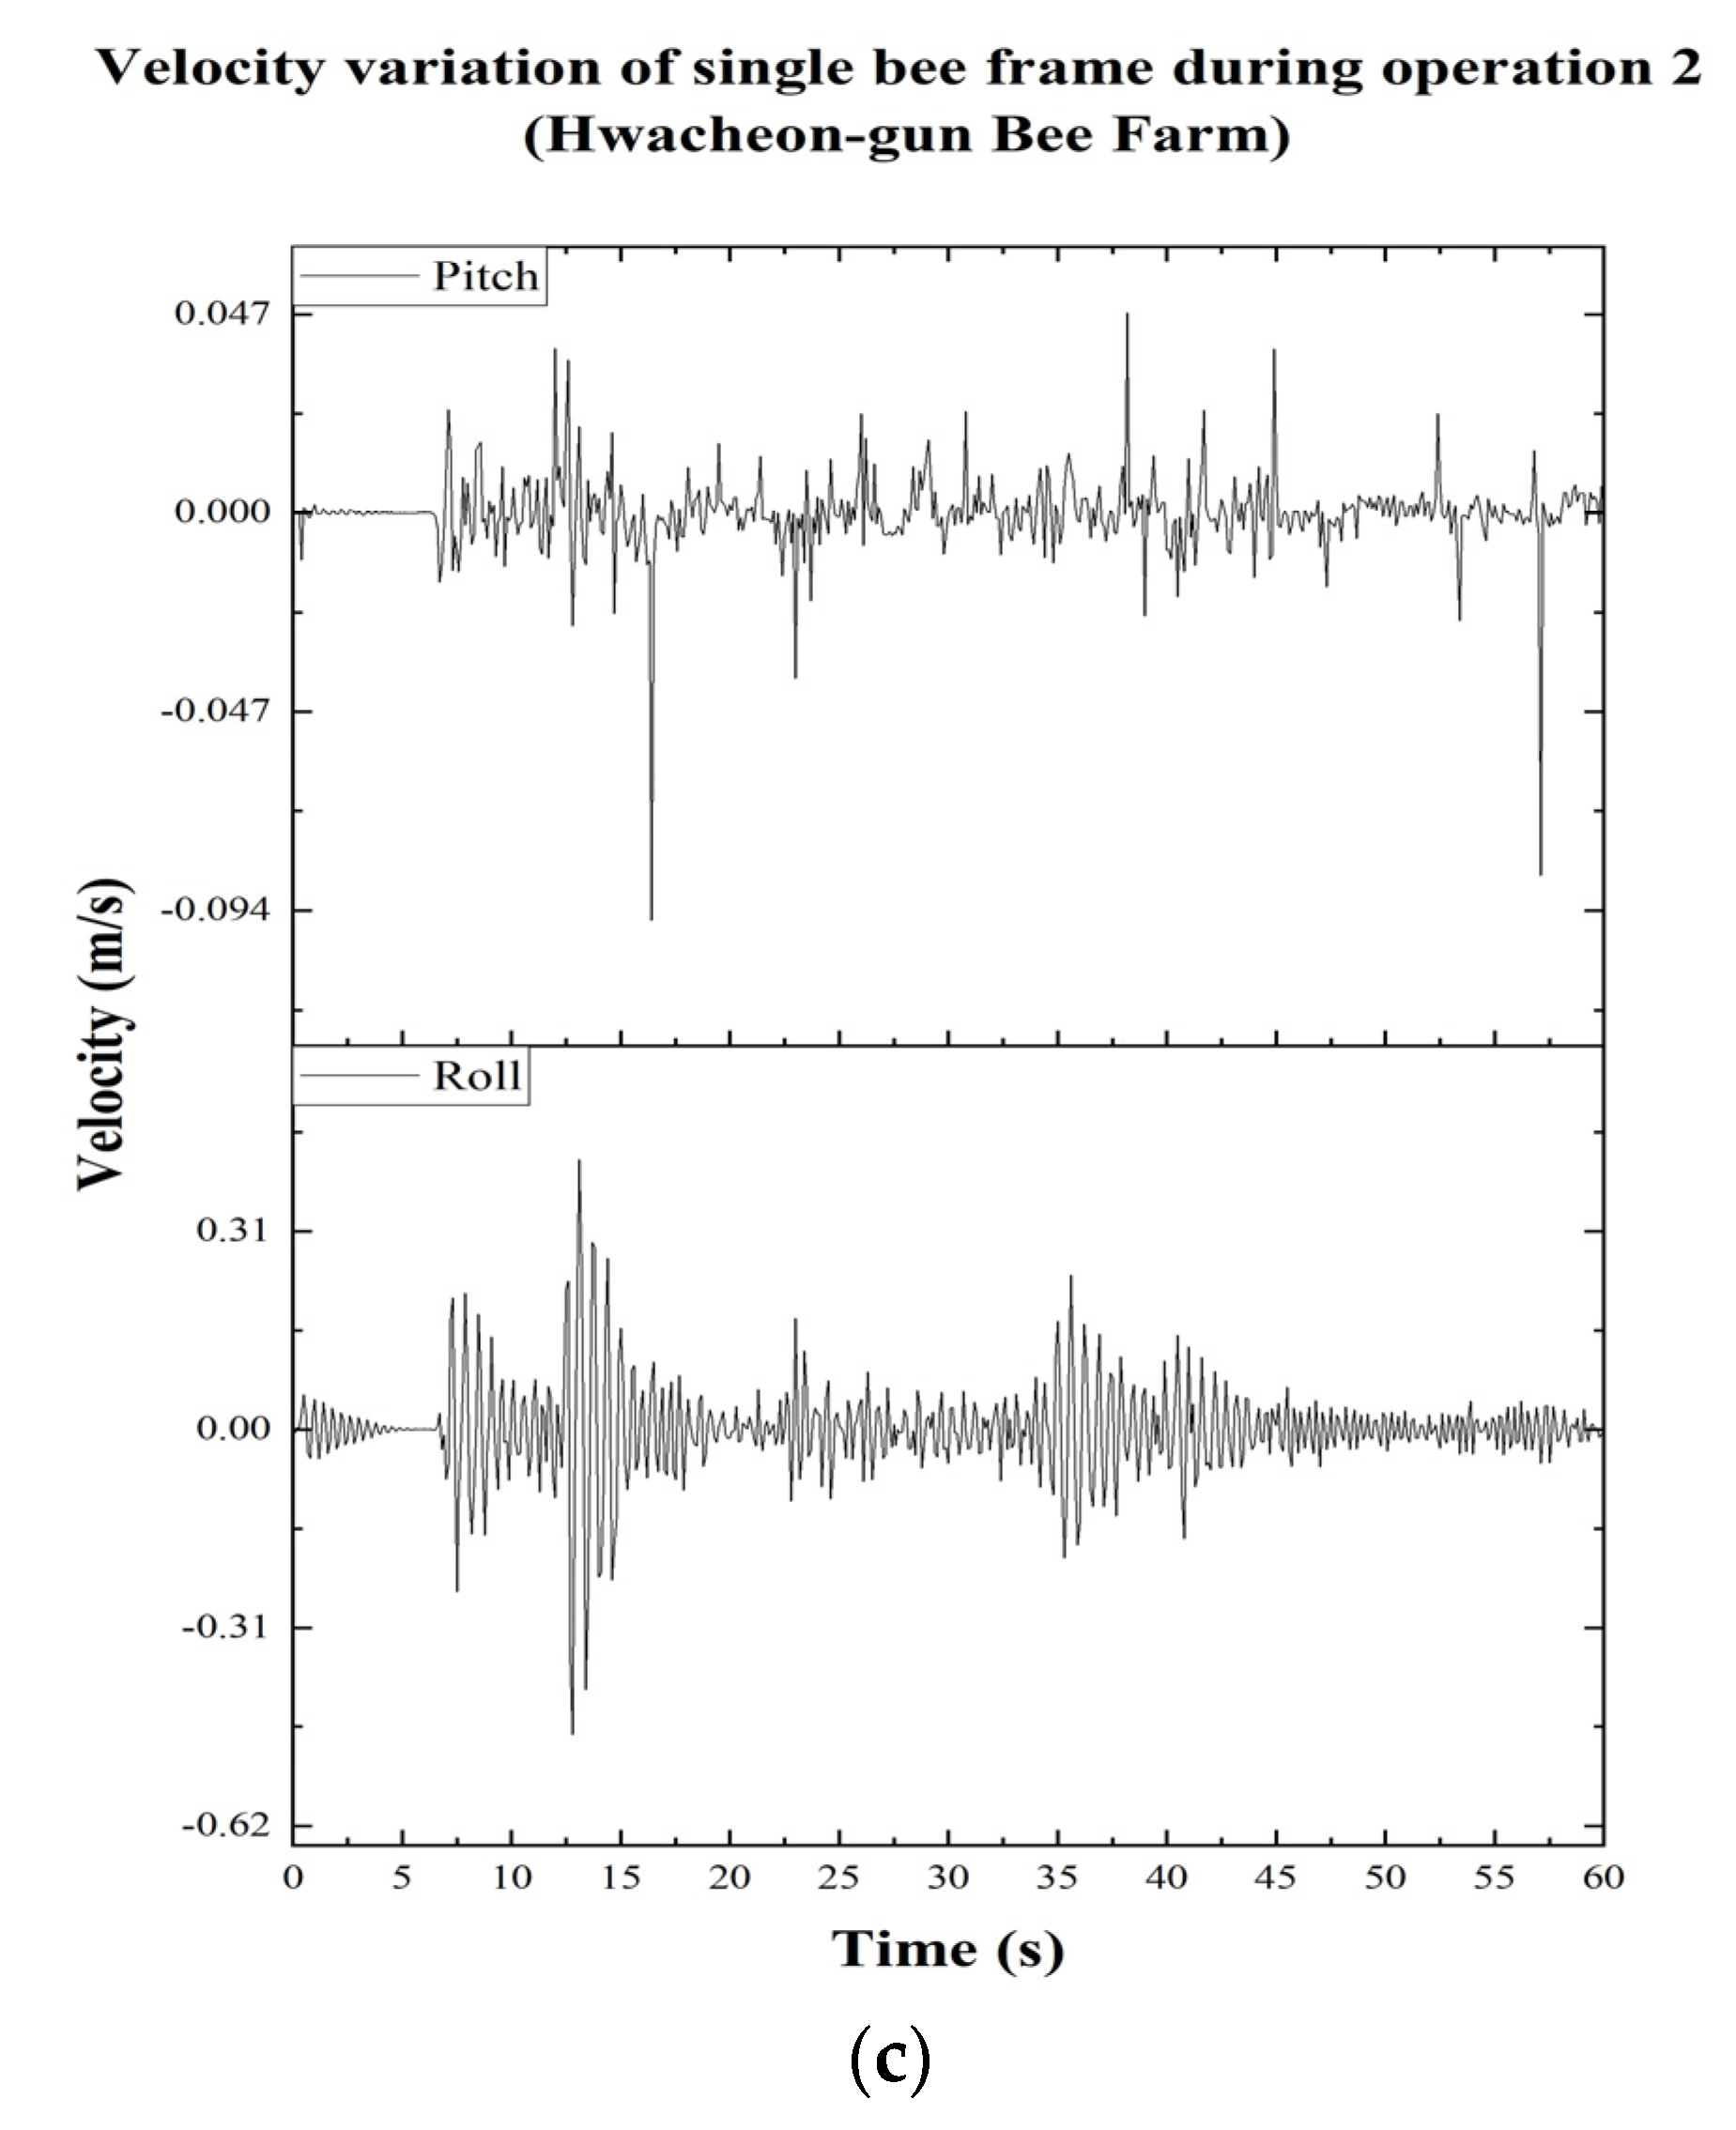
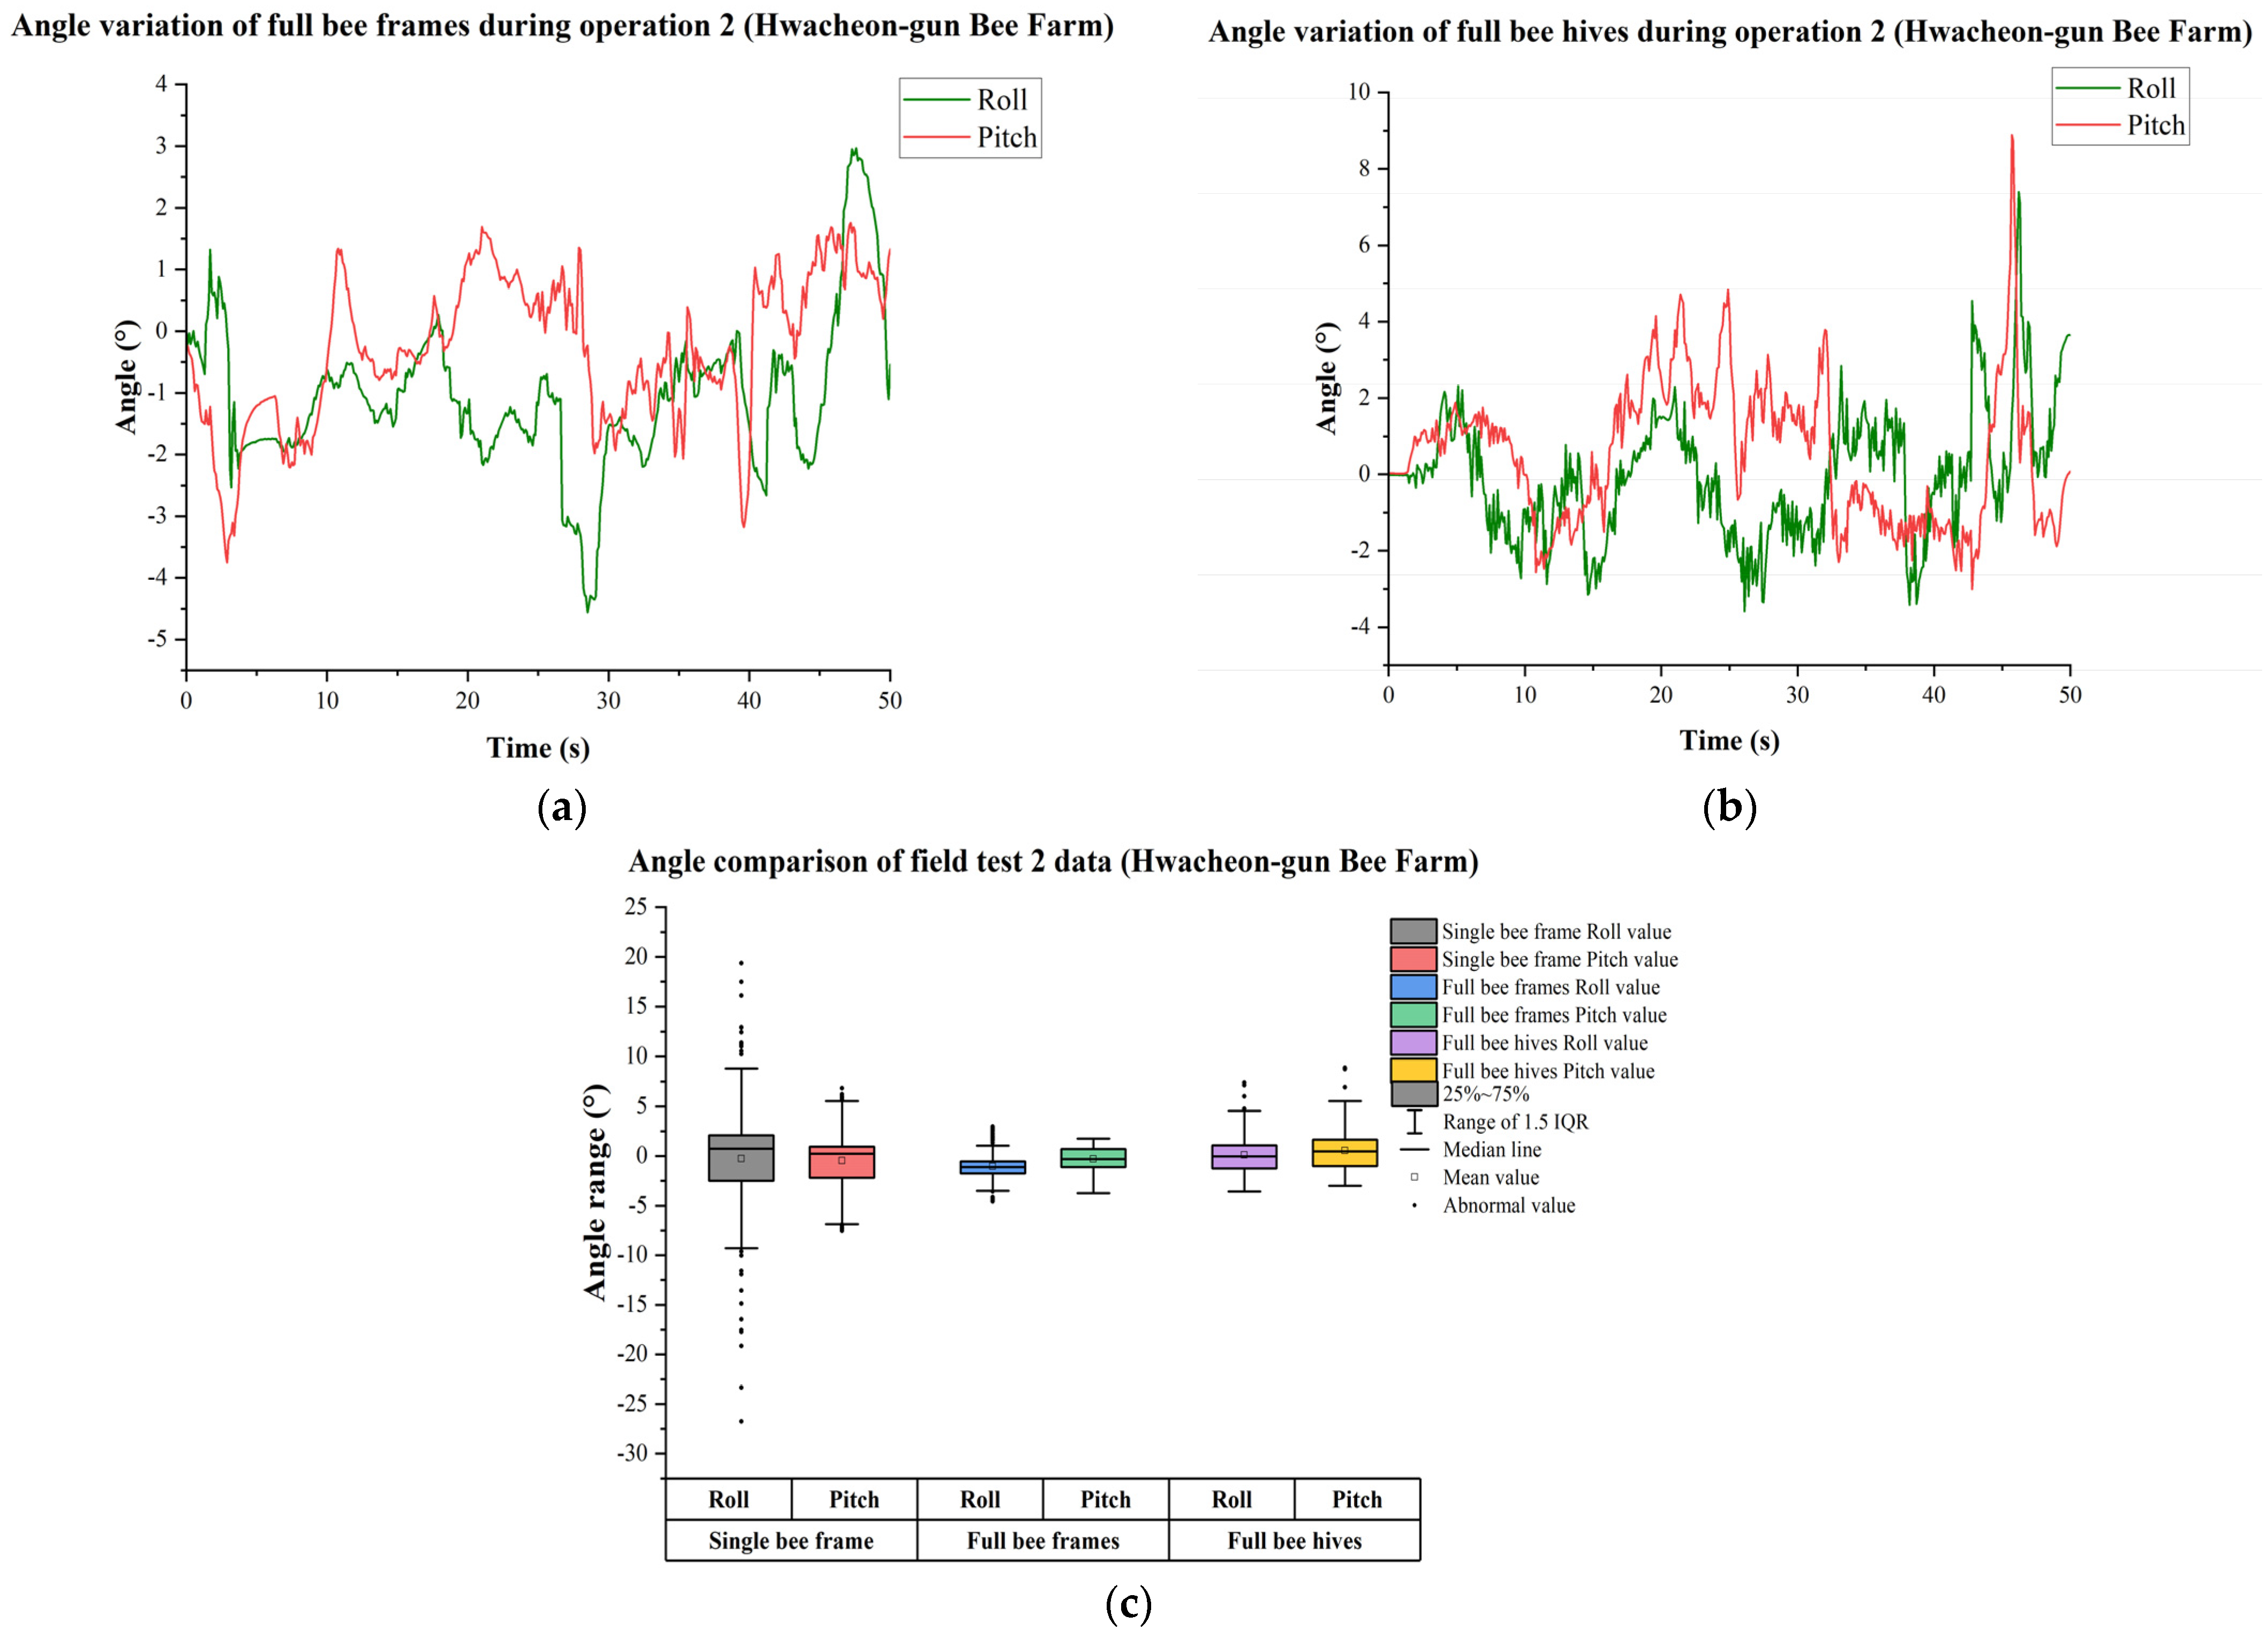
3.2.2. Results and Analysis of Transportation of Beehives from Placement to Honey Picker (Actual Transportation)

By converting and processing the original data in Figure 28a to obtain the displacement variation data in Figure 28b along each direction, the values with the same frequency as those in the simulation were obtained. From the displacement change in each direction in Figure 28b, it can be deduced that during actual transportation, the shaking of the bee frame centroid in the loading box reached its peak at 52 mm, which was considerably higher than the simulation test result of 18.8 mm and the field slewing s-turn test result of 17 mm. In the actual transportation process, the uneven ground and constant real-time adjustment of the direction of travel at the beginning of actual transportation resulted in a shaking value of 50 mm for the bee frames at the beginning of the movement. The shaking of the bee frame centroid was reduced to (−20–20 mm) during the subsequent continuous driving, and it decreased to less than ±10 mm at the end of the test conducted on hard and flat ground. The maximum oscillation rate during the actual transportation was 0.47 m/s, which was considerably smaller than the speed range of the comparative reference honey picker (5.7–21.9 m/s). Thus, damage to the bee frames during transportation was considerably less than the damage caused by the honey picker. Therefore, the transportation vehicle can safely transport the frames.
Figure 29 shows the range of roll and pitch variation, as well as all results of actual transportation when the vehicle is fully loaded with bee frames and beehives. In actual transportation, the roll angle changes in the range of (−4.56–2.97°), and the pitch angle changes in the range of (−3.76–1.76°) when the vehicle is fully loaded with bee frames. In actual transportation, the change in roll angle is mainly caused by uneven ground, and the reason for the larger change in roll angle than that in the simulation analysis is that the vehicle must change direction at any time during the overall transportation process. This induces different internal and external pressures on the two sides of the track, resulting in greater fluctuations in the peak roll angle (−4.56°) than that in the simulation (1.337°). The pitch angle variation peaks at −3.76° at the start, and after stabilization, the angle fluctuates between ±1°, which is not considerably different from the peak angle (1.38°) and a stable variation range (0.37–0.84°) results in the simulation analysis.
When the vehicle was fully loaded with beehives and the roll and pitch angle values varied in the ranges of (−3.59–7.39°) and (−3.01–8.89°), respectively, the peak of the roll value reached 8.89°. From Figure 29c, it can be seen that the roll and pitch values when the vehicle is fully loaded with beehives are larger than the roll (−4.56–2.97°) and pitch values (−3.76–1.76°) when the vehicle is fully loaded with bee frames. This is consistent with the trend that the range of pitch angle variation of the vehicle fully loaded with beehives in the simulation is greater than the range of roll angle variation of the vehicle fully loaded with bee frames. In the actual transportation process, uneven ground and backward center of gravity of the vehicle during beehive transportation resulted in the peak angle of 8.8° for full-load transport of beehives being greater than the peak angle of −3.7° for full-load transport of bee frames during actual transportation. This is consistent with the simulation test results. The reason for the large angle variation of the beehives and bee frames at the end of the simulation path is that the height of the hard ground is slightly higher than the soft ground. From Figure 29c, it can be seen that in the transport process of full loads of beehives and bee frames along the actual transportation route, the pitch angle generated by the transport process of a full load of bee frames was less than the maximum uphill limit inclination angle of 40.7°, and the pitch angle generated by the transport process of a full load of beehives was considerably less than the maximum uphill limit inclination angle of 34°. In summary, the vehicle can perform transportation safely and stably inside the actual apiary. Table 4 shows the summary of the simulation analysis and field analysis.

4. Discussion

In this study, the simulated experimental analysis and the field test analysis of the special beekeeping transporter are discussed separately. From the simulation results, the stability of the transporter varies under three different soil conditions [28]. In the simulation analysis, the vibration of the bee frame was greater under the upland sandy loam soil condition than that under clayey soil and dry sand conditions on the 8° upslope and downslope, as well as in the s-turn experiment. However, in this process, the speed of the bee frame in each direction inside the vehicle was less than the speed of the honey picker used by beekeepers. For this reason, there will be no damage to the bee frames [25]. In the experiment with a full load of bee frames and a full load of beehives, the passability was the worst on dry sand [20]. The vehicle could not pass the 8° upslope when fully load with beehives. In the process, the vehicle head-up phenomenon was aggravated until it reached the maximum passing angle of the vehicle under the full beehive load [27]. The change in the pitch angle of the vehicle began to increase nonlinearly, and eventually, tipping occurred. In the experiments involving the vehicles with full loads of bee frames and beehives on clayey soil and upland sandy loam, vehicle stability was better on the 8° upslope and downslope, as well as along the s-turn. The vehicle pitch angle was less than the maximum uphill limit inclination of the vehicle, and the conditions of safe use were achieved. In the field experiment, unlike the simulated experimental analysis, the field test was conducted with the same slewing experiment as the actual honey harvesting and transportation process. Moreover, the experiment was conducted under the same three conditions of transporting a single bee frame, a full load of bee frames, and a full load of beehives. During the transportation of a single bee frame, the ultimate displacement in the positive roll direction of the bee frame was consistent with the ultimate displacement of the bee frame under the same geology in the simulation analysis, and the speed of the vehicle was considerably less than the speed of the honey picker, which corresponds to the simulation experiment. Moreover, the velocity was considerably less than that of the honey picker, which corresponds to the simulation experiment. However, because of the topography of the site, a large error was generated in the pitch direction. The test results obtained with a full load of bee frames and a full load of beehives verified the simulation result that the stability of the vehicle was better with a full load of bee frames than that with a full load of beehives. Along the actual transportation route, the vehicle operated worse on soft ground in the first half of the route than on the hard ground in the second half of the route. This result is similar to the research of Yang et al. [29], which found that it was more challenging to maneuver tracked vehicles on soft ground than on the hard ground.
Because the stiffness and elasticity coefficients of the contact between the loading box and the bee frame could not be measured precisely during the simulation analysis, the stiffness coefficient of the contact between the loading box and the bee frame was selected as an approximate iron–wood contact in the simulation analysis, and the elasticity coefficient was selected using an empirical formula as one-thousandth of the stiffness coefficient. For this reason, the simulation analysis results may not accurately describe the jitter phenomenon between the bee frame and the vehicle during operation. The ground state did not change in the simulation analysis even after several tests, so further testing in the actual environment is needed. The dry sand road surface was less stable in the analysis, and the vehicle could not pass through the 8° upslope and downslope. Therefore, in the subsequent design, the structure of the transporter must be modified to lower the center of gravity of the vehicle or modify the track section so that it can adapt to various road surfaces and operating conditions.

5. Conclusions

In this paper, to test the safety performance of the designed beekeeping transportation vehicle, we used the dynamics analysis software RecurDyn and conducted field experiments for testing. After modeling the transporter in RecurDyn, two operating conditions, namely s-turn and 8° upslope and downslope, as well as three geological conditions, namely clayey soil, dry sand, and upland sandy loam, were considered to perform the analysis separately. The experimental results were compared with the stability criterion derived from the operating speed and center of gravity of the honey harvester. The stability of the transporter was determined under various operating conditions. In the experimental results, the vehicles with a single bee frame, a full load of bee frames, and a full load of beehives passed under the clayey soil road conditions. The uphill angle of the bee frame in the vehicle with a full load of bee frames was only 11°, which was much considerably less than the maximum uphill inclination angle of 40.7°, and the uphill angle of the vehicle with a full load of beehives was only 2°, which was much considerably less than the maximum uphill inclination angle of 34°. Bee frame shaking was higher under the upland sandy loam condition with a peak value of 18.8 mm when transporting a single bee frame. The peak speed during transportation was only 0.18 m/s, considerably less than the honey picker’s operating speeds of 5.7–21.9 m/s. It means that the bee frames can be transported safely. With a full load of beehives on the dry sand road, the beekeeping vehicle could not pass the 8° uphill slope because it exceeded the maximum uphill angle of 34°. Moreover, the vehicle experienced the most severe head tilt and had the worst stability on the dry sand road in all experiments on horizontal roads.
The soil condition in the actual apiary field trials was upland sandy loam. The peak displacement in the slewing experiment was 17 mm when a single bee frame was transported, which was similar to the simulation results. However, in actual operation, due to real-time angle adjustment, the peak displacement during the transportation of a single bee frame was 52 mm, nearly three times greater than the value in the simulation results. The peak roll angle reached 5° and 3.4° for the full loads of bee frames and beehives, respectively, while the corresponding peak pitch angles were 3.7° and 8.8°. All of these exceeded the simulated experimental results. However, in the field test, the beekeeping transporter showed good passability in simulating the rotary process of beekeepers transporting inside the apiary and simulating the actual transportation process of beekeepers during honey extraction.

Author Contributions

Conceptualization, P.W. and X.H.; methodology, P.W. and X.H.; software, P.W.; funding acquisition, X.H.; formal analysis, P.W.; investigation, P.W.; data curation, P.W.; writing—original draft preparation, P.W.; writing—review and editing, P.W., C.M., S.K. and X.H.; visualization, P.W. and X.H.; supervision, X.H. All authors have read and agreed to the published version of the manuscript.

Funding

This work was supported by a grant from the National Institute of Agricultural Science, Rural Development Administration, Republic of Korea (Project No.: PJ015826012021).

Institutional Review Board Statement

Not applicable.

Informed Consent Statement

Not applicable.

Data Availability Statement

Not applicable.

Conflicts of Interest

The authors declare that they have no conflict of interest.

References

  1. Gupta, R.K.; Reybroeck, W.; van Veen, J.W.; Gupta, A. Beekeeping for Poverty Alleviation and Livelihood Security, 1st ed.; Springer: New York, NY, USA, 2014; pp. 4–5. [Google Scholar]
  2. Jung, C.L. A note on the early publication of beekeeping of western honeybee, apis mellifera in Korea: Yangbong Yoji (Abriss Bienenzucht) by P. Canisius Kugelgen. J. Apic. 2014, 29, 73–77. [Google Scholar]
  3. Muthusamy, S.K.; Sangeetha, S.V.T.; Al Busaidi, A.S.; Al Moqbali, K.S.; Balushi, M.A.; Al Mawali, S.A. Design and Development of Drone Based Remote Controlled Honey Harvesting Machine. In Proceedings of the 2021 Fifth International Conference on I-SMAC (IoT in Social, Mobile, Analytics and Cloud) (I-SMAC), Palladam, India, 11 November 2021; pp. 1212–1217. [Google Scholar]
  4. Archibong, F.N.; Ugwuishiwu, B.O.; Okechukwu, M.E.; Ajah, S.A. Design, construction, and performance evaluation of a honey extracting machine. Agric. Eng. Int. CIGR J. 2021, 23, 279–289. [Google Scholar]
  5. Choi, H.M.; Kim, S.G.; Kim, H.Y.; Woo, S.O.; Kim, S.M.; Moon, H.J.; Han, S.M. Comparative evaluation of productivity increase through improvement of royal jelly production technique. J. Apic. 2021, 36, 221–228. [Google Scholar] [CrossRef]
  6. Kim, K.M.; Lee, M.Y.; Choi, Y.S.; Kang, E.J.; Park, H.G.; Park, B.S.; Frunze, O.; Kim, J.G.; Han, S.M.; Woo, S.O.; et al. Status and environmental factors of the annual production of acacia honey from the false acacia (Robinia pseudoacacia) in South Korea. J. Apic. 2021, 36, 11–16. [Google Scholar] [CrossRef]
  7. Jung, C.L.; Lee, M.L. Beekeeping in Korea: Past, present, and future challenges. In Asian Beekeeping in the 21st Century; Chantawannakul, P., Williams, G., Neumann, P., Eds.; Springer: Singapore, 2018; pp. 175–197. [Google Scholar]
  8. Yoon, H.Y. Transforming the economic value of hillside housing—A case study of Seoul, South Korea. Urban For. Urban Green. 2017, 24, 35–44. [Google Scholar] [CrossRef]
  9. Kim, A.S.; Kim, S.E.; Kim, G.W. Analysis of honeybee-keeping management types and skills level in Korea. J. Anim. Sci. Technol. 2011, 53, 59–66. [Google Scholar] [CrossRef] [Green Version]
  10. Lee, M.Y.; Hong, I.P.; Choi, Y.S.; Kim, N.S.; Kim, H.K.; Lee, K.G.; Lee, M.L. Present status of korean beekeeping industry. Korean J. Apic. 2010, 25, 137–144. [Google Scholar]
  11. Kang, D.Y.; Seol, A.; Oh, J.C.; Jung, Y.K.; Han, H.; Chung, J.S. Analyzing the management characteristics of beekeeping households according to their beekeeping types. J. Apic. 2017, 32, 1–9. [Google Scholar] [CrossRef]
  12. Han, J.H. A study on management of apiary and main factors for developing the beekeeping industry in korea. J. Apic. 2015, 30, 127–133. [Google Scholar] [CrossRef]
  13. Chung, N.K.; Hwang, I.S.; Park, S.G.; Jeong, G.U. Questionary survey on the current status of honeybee-keeping and the consciousness of beekeepers in daejeon metropolitan city and jeollanamdo providence. Korean J. Apic. 2013, 26, 355–363. [Google Scholar]
  14. Wang, P.; Han, X.; Son, Y.; Mo, C.; Kim, D.; Kim, S.; Kim, J.; Chung, W. Development and analysis of multi-functional beekeeping loading box based on electric tracked transport vehicle. J. Biosyst. Eng. 2022, 47, 13–27. [Google Scholar] [CrossRef]
  15. Function Bay Technology Support Home Page. Available online: https://support.functionbay.com/en/page/single/52/recurdyn-toolkits-tracklm (accessed on 10 June 2022).
  16. Chen, W.; Zhan, J.M.; Zhou, H. Modeling and simulation of adaptive surface tracked vehicle based on RecurDyn. Open J. Model. Simul. 2013, 1, 37–41. [Google Scholar] [CrossRef] [Green Version]
  17. Kim, J.G.; Lim, K.J.; Park, Y.S.; Heo, S.G.; Park, J.H.; Ahn, J.H.; Kim, K.S.; Choi, J.D. The effect of slope-based curve number adjustment on direct runoff estimation by L-THIA. J. Korean Soc. Water Environ. 2007, 23, 897–905. [Google Scholar]
  18. Zhang, X.J.; Ni, W.Q.; Jiang, Q.; Xu, L.Y.; Xu, K.K.; Yang, Y. Simulation analysis and test on stability of tracked tractor rotary tillage unit. J. Anhui Agric. Univ. 2020, 47, 324. [Google Scholar]
  19. Ali, M.; Lee, Y.S.; Chowdhury, M.; Khan, N.A.; Swe, K.M.; Rasool, K.; Kabir, M.S.N.; Lee, D.H.; Chung, S.O. Analysis of driving stability and vibration of a 20-kw self-propelled 1-row chinese cabbage harvester. J. Biosyst. Eng. 2021, 46, 48–59. [Google Scholar] [CrossRef]
  20. Liu, W.W.; Cheng, K. An analytical model for predicting ground pressure under a rigid-flexible tracked vehicle on soft ground. Math. Probl. Eng. 2020, 2020, 1–7. [Google Scholar] [CrossRef]
  21. Han, J.; Ren, G.; Li, D. Co-simulation of a tracked mobile robot based on RecurDyn and Simulink. In Proceedings of the 2017 5th International Conference on Frontiers of Manufacturing Science and Measuring Technology (FMSMT), Taiyuan, China, 24–25 June 2017; pp. 1170–1174. [Google Scholar]
  22. Ma, X.G.; Yang, T.; You, X.M.; Zhai, B. Modeling and simulation of multibody dynamics for tracked vehicle based on RecurDyn. In Proceedings of the 2010 Third International Conference on Intelligent Networks and Intelligent Systems, Fukuoka, Japan, 30 November–2 December 2010; IEEE: Washington, DC, USA, 2010; pp. 669–671. [Google Scholar]
  23. Chen, Y.; Cheng, Y.; Chen, J.; Zheng, Z.; Hu, C.; Cao, J. Design and experiment of the buckwheat hill-drop planter hole forming device. Agriculture 2021, 11, 1085. [Google Scholar] [CrossRef]
  24. Sun, S.; Wu, J.; Ren, C.; Tang, H.; Chen, J.; Ma, W.; Chu, J. Chassis trafficability simulation and experiment of a LY1352JP forest tracked vehicle. J. For. Res. 2021, 32, 1315–1325. [Google Scholar] [CrossRef]
  25. Al-Rajhi, M.A.; EL-Sheikha, A.M.A. Development and evaluation of a tangential honey-extractor. Misr J. Agric. Eng. 2014, 31, 1501–1522. [Google Scholar] [CrossRef]
  26. Wu, T.; Wu, H.; Liu, Q.; Liang, X.; Fan, Q.; Xie, C. Design and development of tracked sugarcane transporter. Sugar Tech. 2021, 23, 1137–1146. [Google Scholar] [CrossRef]
  27. Li, Y.; Zang, L.; Shi, T.; Lv, T.; Lin, F. Design and dynamic simulation analysis of a wheel–track composite chassis based on RecurDyn. World Electr. Veh. J. 2021, 13, 12. [Google Scholar] [CrossRef]
  28. Liu, Y.; Xie, N.; Zhang, T.; Liang, J.K. Ground mechanic modeling and analysis on driving performance of tracked vehicles on the soft slope road. J. Mech. Des. 2021, 38, 9. [Google Scholar]
  29. Yang, H.F.; Lv, X.R. Dynamic simulation of small crawler chassis turning based on RecurDyn. Adv. Mater. Res. 2013, 774, 195–198. [Google Scholar] [CrossRef]
Figure 1. (a) LNS T500 tracked vehicle; (b) design model of the loading box when folded; (c) design model of the loading box when unfolded; (d) actual vehicle loaded with bee frames; (e) actual vehicle loaded with beehives.
Applsci 12 06667 g001
Figure 2. 3D models of loading box used for bee frame transportation (a) and beehive transportation (b). (1) Base panel and front panel, (2) front middle lower panel, (3) front middle upper panel, (4) right side lower panel, (5) right side upper panel, (6) middle lower panel, (7) middle upper panel, (8) lower cross baffle, (9) upper cross baffle, (10) rear middle lower panel, (11) rear middle upper panel, (12) rear baffle, (13) right side upper panel, (14) right side lower panel, (15) bolt fastening device, (16) auxiliary plate 1 of rear baffle, and (17) auxiliary plate 2 of rear baffle.
Applsci 12 06667 g002
Figure 3. (a) Model of track section, and (b) properties considered for setting tension force.
Applsci 12 06667 g003
Figure 4. (a) Tracked vehicle used for loading bee frames when the loading box is folded, and (b) tracked vehicle used for loading beehives when the loading box is unfolded.
Applsci 12 06667 g004
Figure 5. (a) Enlarged view of contact relationship between bee frames and interior of loading box, (b) tracked vehicle with a single bee frame loaded onto it, (c) tracked vehicle fully loaded with bee frames, and (d) tracked vehicle fully loaded with beehives.
Applsci 12 06667 g005
Figure 6. (a) The design model of ±8 degree up and downslope surface and (b) horizontal ground surface model.
Applsci 12 06667 g006
Figure 7. Top view diagram used for calculating relative the coordinates when the bee frame is loaded, where points A and B denote the centers of mass of the bee frame and loading box, respectively.
Applsci 12 06667 g007
Figure 8. Vehicle dynamics models when the vehicle is fully loaded with (a) bee frames and (b) beehives.
Applsci 12 06667 g008
Figure 9. The angular velocity of the sprocket during the s-turn and 8° slope conditions.
Applsci 12 06667 g009
Figure 10. Details of field test site: (a) location of field experiment site, (b) two test lines in the field test.
Applsci 12 06667 g010
Figure 11. Bee frame modified with INS to simulate a full load of honey.
Applsci 12 06667 g011
Figure 12. Experimental equipment: (a) conceptual diagram of experimental equipment and (b) actual experimental setup.
Applsci 12 06667 g012
Figure 13. Experimental setup when the loading box is fully loaded with (a) bee frames and (b) beehives.
Applsci 12 06667 g013
Figure 14. Relationship between speed of honey harvester and damage to bee frame [25].
Applsci 12 06667 g014
Figure 15. Position of center of gravity: (a) loading box fully loaded with bee frames and (b) loading box fully loaded with beehives.
Applsci 12 06667 g015
Figure 16. Variation of relative displacement in (a) the X-direction of the bee frame (8°), (b) Y-direction of the bee frame (8°), (c) Z-direction of the bee frame (8°), and (d) range of XYZ direction for the bee frame (8°).
Applsci 12 06667 g016
Figure 17. Variation of relative displacement in (a) the X-direction of the bee frame (s-turn), (b) Y-direction of the bee frame (s-turn), and (c) Z-direction of the bee frame (s-turn). (d) Range of the XYZ directions for the bee frame (s-turn).
Applsci 12 06667 g017aApplsci 12 06667 g017b
Figure 18. Velocity variation of bee frame in each direction under upland sandy loam conditions during s-curve driving.
Applsci 12 06667 g018
Figure 19. Variation of (a) roll values under each pavement condition when the bee frames are fully loaded (8°) and (b) pitch values for each pavement condition when the bee frames are fully loaded (8°).
Applsci 12 06667 g019
Figure 20. Variation of (a) roll values under each pavement condition when the loading box is fully loaded with bee frames (s-turn), (b) pitch values under each pavement condition when loading box is fully loaded with bee frames (s-turn).
Applsci 12 06667 g020
Figure 21. Box plot of (a) variation in roll values under each pavement condition when the loading box is fully loaded with bee frames and (b) variation in pitch values under each pavement condition when the loading box is fully loaded with bee frames.
Applsci 12 06667 g021
Figure 22. Variation of (a) roll values under each pavement condition when the vehicle is fully loaded with beehives (8°) and (b) pitch values under for each pavement condition when the vehicle is fully loaded with beehives (8°).
Applsci 12 06667 g022
Figure 23. Description of the driving torque (a) and the bushing tension (b) of the vehicle when fully loaded with beehives.
Applsci 12 06667 g023
Figure 24. Variation of (a) roll values under each pavement condition when the vehicle is fully loaded with beehives (s-turn) and (b) pitch values under each pavement condition when the vehicle is fully loaded with beehives (s-turn).
Applsci 12 06667 g024
Figure 25. Box plot of (a) variation in roll values under each pavement condition when the vehicle is fully loaded with beehives and (b) variation in pitch values under each pavement condition when the vehicle is fully loaded with beehives.
Applsci 12 06667 g025
Figure 26. Variation of (a) angle, (b) displacement, and (c) velocity of single bee frame during s-turn transportation.
Applsci 12 06667 g026
Figure 27. Angle variation of (a) the vehicle with a full load of bee frames during s-turn transportation, (b) vehicle with a full load of beehives during s-turn transportation, and (c) all vehicles during s-turn transportation.
Applsci 12 06667 g027
Figure 28. Variation in the (a) angle, (b) displacement, and (c) velocity of a single bee frame during actual transportation.
Applsci 12 06667 g028aApplsci 12 06667 g028b
Figure 29. Angle variation of (a) the vehicle fully loaded with bee frames during actual transportation, (b) the vehicle fully loaded with beehives during actual transportation, and (c) all vehicles during actual transportation.
Applsci 12 06667 g029
Table 1. Physical property of various soils [21,22].
PropertiesClayey SoilDry SandUpland Sandy Loam
Terrain   Stiffness   k c   kN / m n + 1 0.417100.000480.03740
Terrain   Stiffness   k ϕ   kN / m n + 2 0.021900.000770.00100
Exponential   Number     n 0.500001.100001.10000
Cohesion   c   kpa 0.004100.001000.00330
Shearing   Resistance   Angle   ϕ   ° 13.000028.000033.7000
Shearing   Deformation   Modulus   k 25.000025.000025.0000
Sinkage Ratio0.050000.050000.05000
Table 2. RecurDyn stiffness contact coefficient table.
SteelAluminumBronzeOak WoodPlasticRubber
Steel108,78654,95580,55911,210263625
Aluminum-36,76346,69010,182257525
Bronze--63,96310,819261425
Oak Wood---5909217725
Plastic----133425
Rubber-----13
Table 3. Specifications of iAHRS-RB-SDA-v1.
ParameterValueUnit
Output Voltage4.2–12 (Recommended)V
Operating temperature0–45 (Recommended),
−40–85 (Max)
°C
Current100mA
Gyroscope Range±2000dps
Accelerometer Range±16g
Magnetometer Range±4900μT
Dimensions35(L) × 35(W) × 10(H)mm
Table 4. Summary of the simulation and field test results.
Simulation ResultsField Test Results (Line 1)Field Test Results (Line 2)
S-Turn8° Slope
Clayey SoilDry SandUpland Sandy LoamClayey SoilDry SandUpland Sandy Loam
Single frameX-Range (mm)−2.950~2.080−0.970~1.560−17.05~18.90−0.060~0.064−0.044~0.062−0.038~0.066−12.425~16.695−52.216~38.463
Y-Range (mm)−0.010~0.390−0.010~0.270−0.010~4.620−0.006~0.007−0.006~0.007−0.006~0.007−16.749~0.695−15.217~13.781
Z-Range (mm)−0.750~0.120−0.150~0.270−2.320~0.030−1.404~0.153−1.573~0.362−1.511~0.491--
Fully bee framesRoll range (°)−0.328~0.349−0.415~0.468−0.723~0.782−0.113~0.196−0.072~0.229−0.064~0.089−2.328~4.891−4.56~2.971
Pitch range (°)−0.328~0.849−0.195~2.243−0.160~1.384−10.883~11.777−11.188~15.219−10.835~12.756−3.561~2.749−3.756~1.76
Fully beehivesRoll range (°)−0.095~0.132−0.474~0.099−0.053~0.108−0.147~0.261-−0.132~0.164−1.362~3.419−3.594~7.388
Pitch range (°)0.200~2.0730.200~6.0850.200~3.935−10.207~13.314-−10.422~16.758−4.332~−0.002−3.011~8.888
Publisher’s Note: MDPI stays neutral with regard to jurisdictional claims in published maps and institutional affiliations.

